Ambuja Cements Limited · NSE:AMBUJACEM
Ambuja Cements — Q4 2022 Earnings Presentation
36 slides from Ambuja Cements's earnings presentation, February 2023
Slide 1: Operational & Financial Highlights for the Quarter Ended December 31, 2022
adani Cement Operational & Financial Highlights For the Quarter Ended December 31, 2022
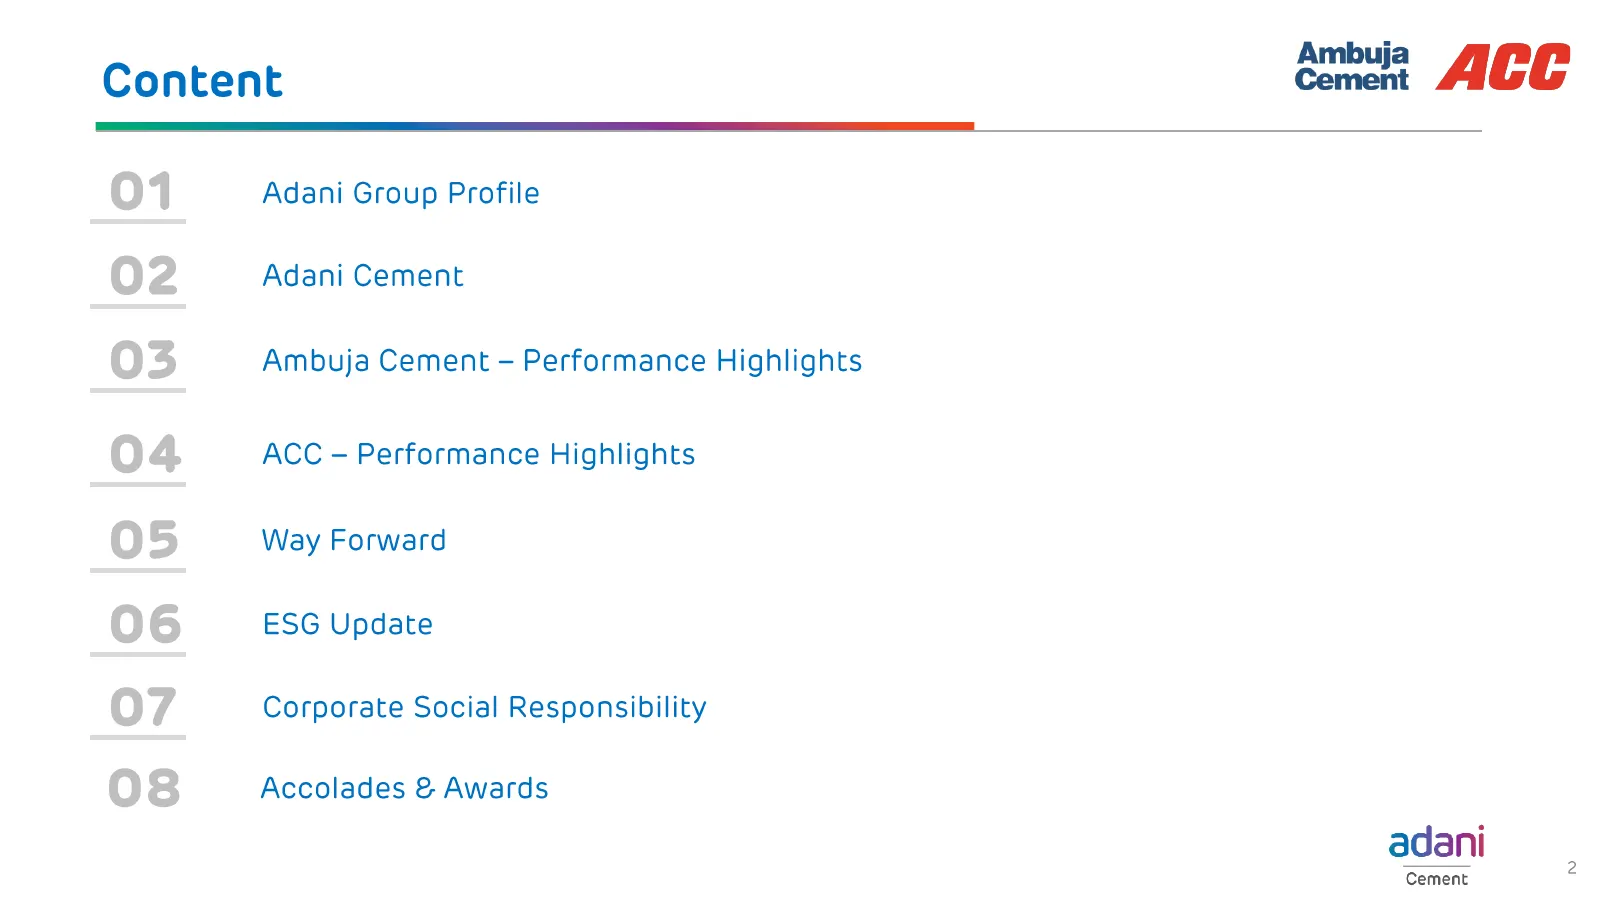
Slide 2: Content
Content conel2 ACC 01 Adani Group Profile 02 Adani Cement 03 Ambuja Cement —- Performance Highlights 04 ACC - Performance Highlights @) 5 Way Forward 06 ESG Update 07 Corporate Social Responsibility os Accolades & Awards adani Cement
Slide 3: Adani Group Profile
Adani Group Profile O1
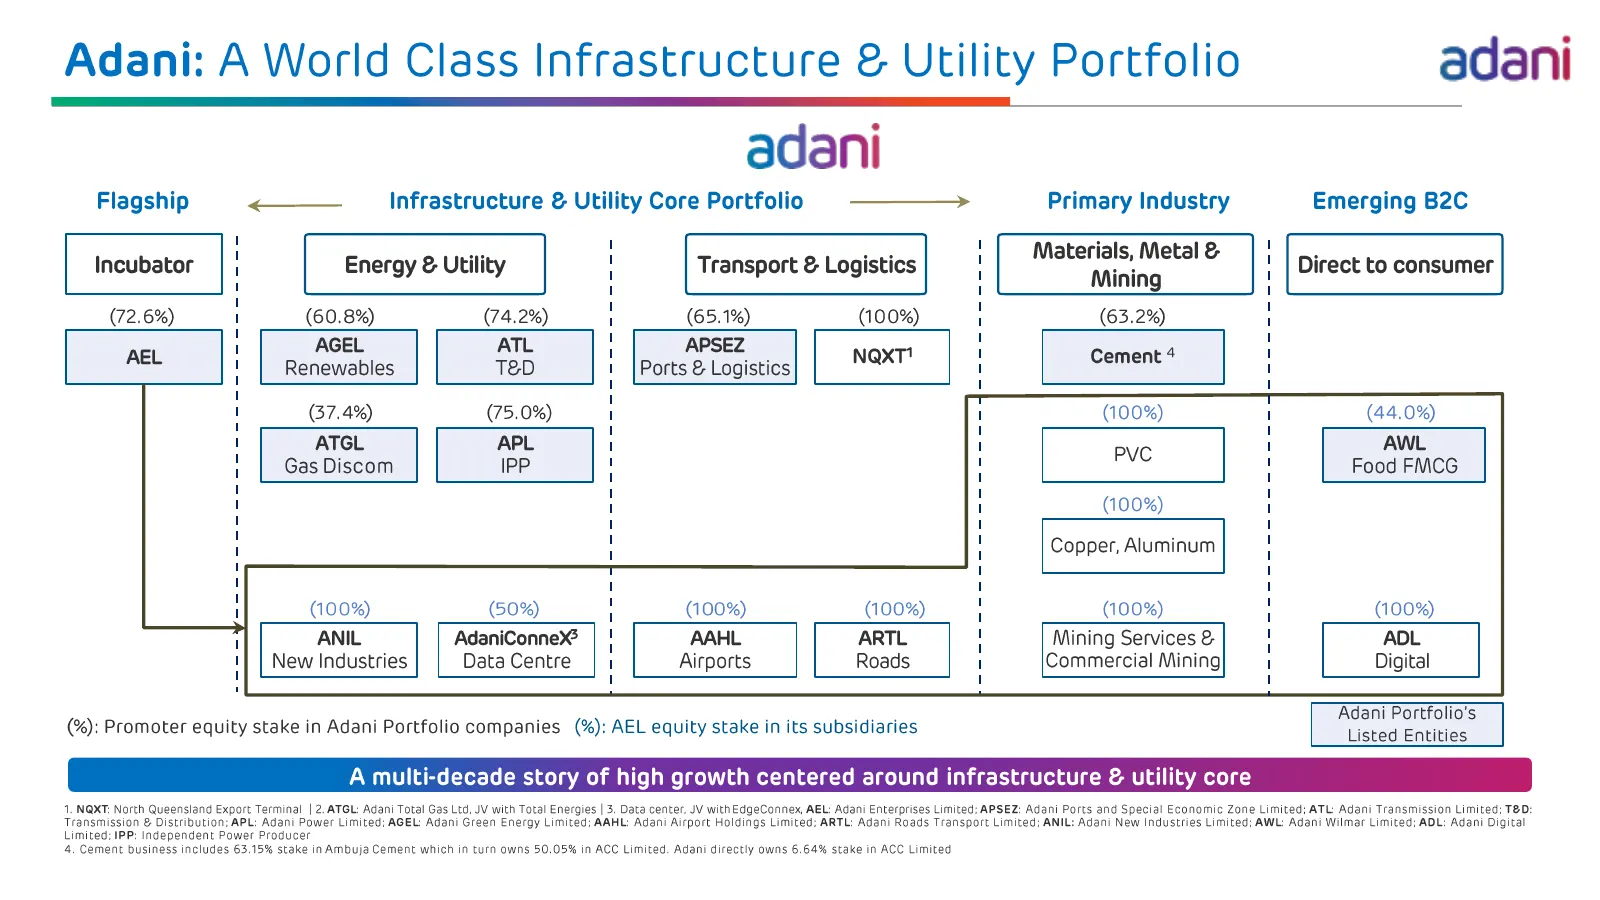
Slide 4: Adani: A World Class Infrastructure & Utility Portfolio
Adani: A World Class Infrastructure & Utility Portfolio adani adani Flagship << Infrastructure & Utility Core Portfolio ——-™- Primary Industry Emerging B2C 1 1 1 1 Incubator | ; Energy 2 Utility ' Transport & Logistics ' | | Direct to consumer ' 1 1 1 (72.6%) 1 (60.8%) (74.2%) 1 (65.1%) (100%) 1 (63
Slide 5: Adani Portfolio: Decades long track record of industry best growth
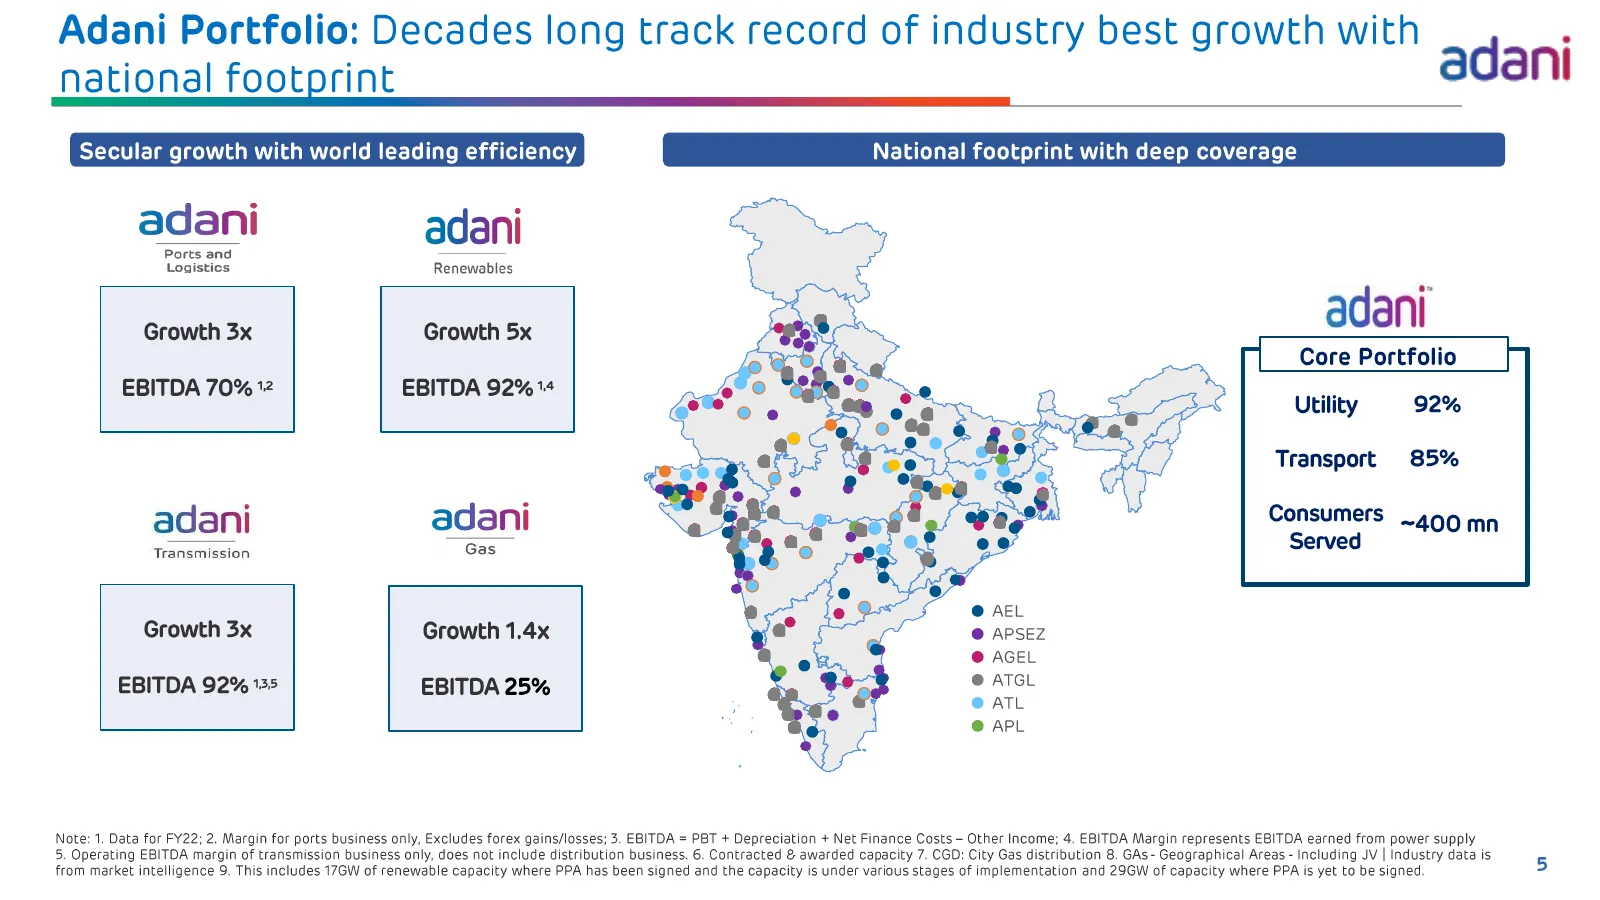
Adani Portfolio: Decades long track record of industry best growth with dani national footprint adani Secular growth with world leading efficiency National footprint with deep coverage adani adani Ports and Logistics Renewables Growth 3x Growth 5x EBITDA 70% *2 EBITDA 92% 14 ° Utility 92% Transport
Slide 6: Adani Portfolio: Repeatable, robust & proven transformative model of investment
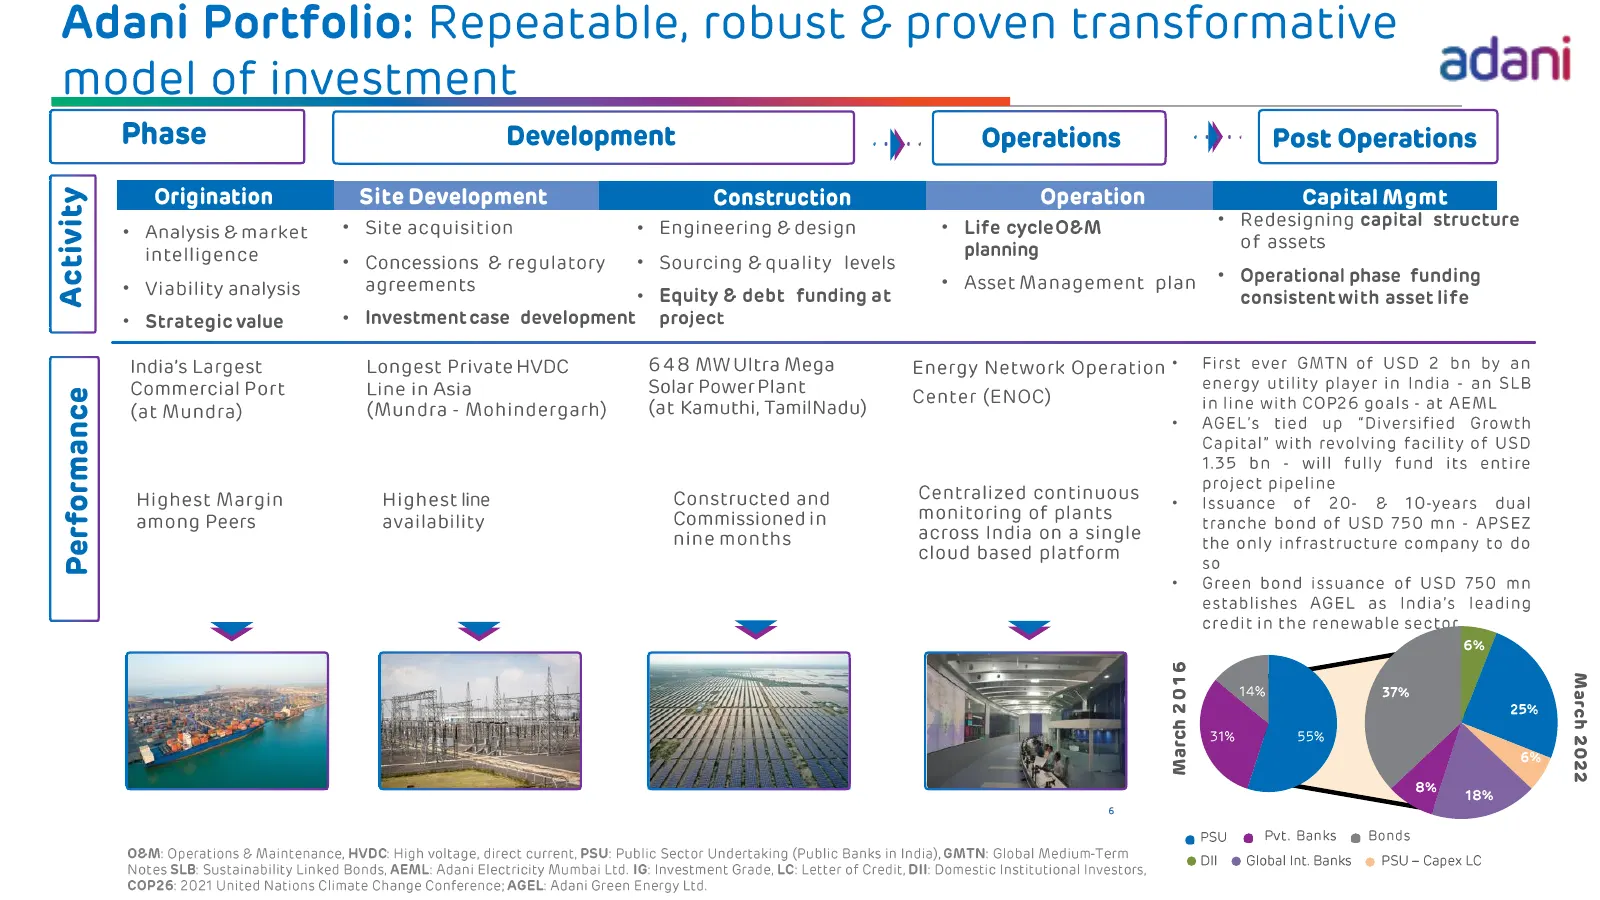
Adani Portfolio: Repeatable, robust & proven transformative model of investment adani Phase Development Operations -}- | Post Operations i Origination Site Development Construction Operation Capital Mgmt ‘S| + Analysisemarket * Site acquisition + Engineering & design + Life cycleoeM . Redesigning ca
Slide 7: Adani Cement (Ambuja + ACC)
cement AGE Adani Cement (Ambuja + ACC) O2
Slide 8: Adani Cement: Builders of Progress in India
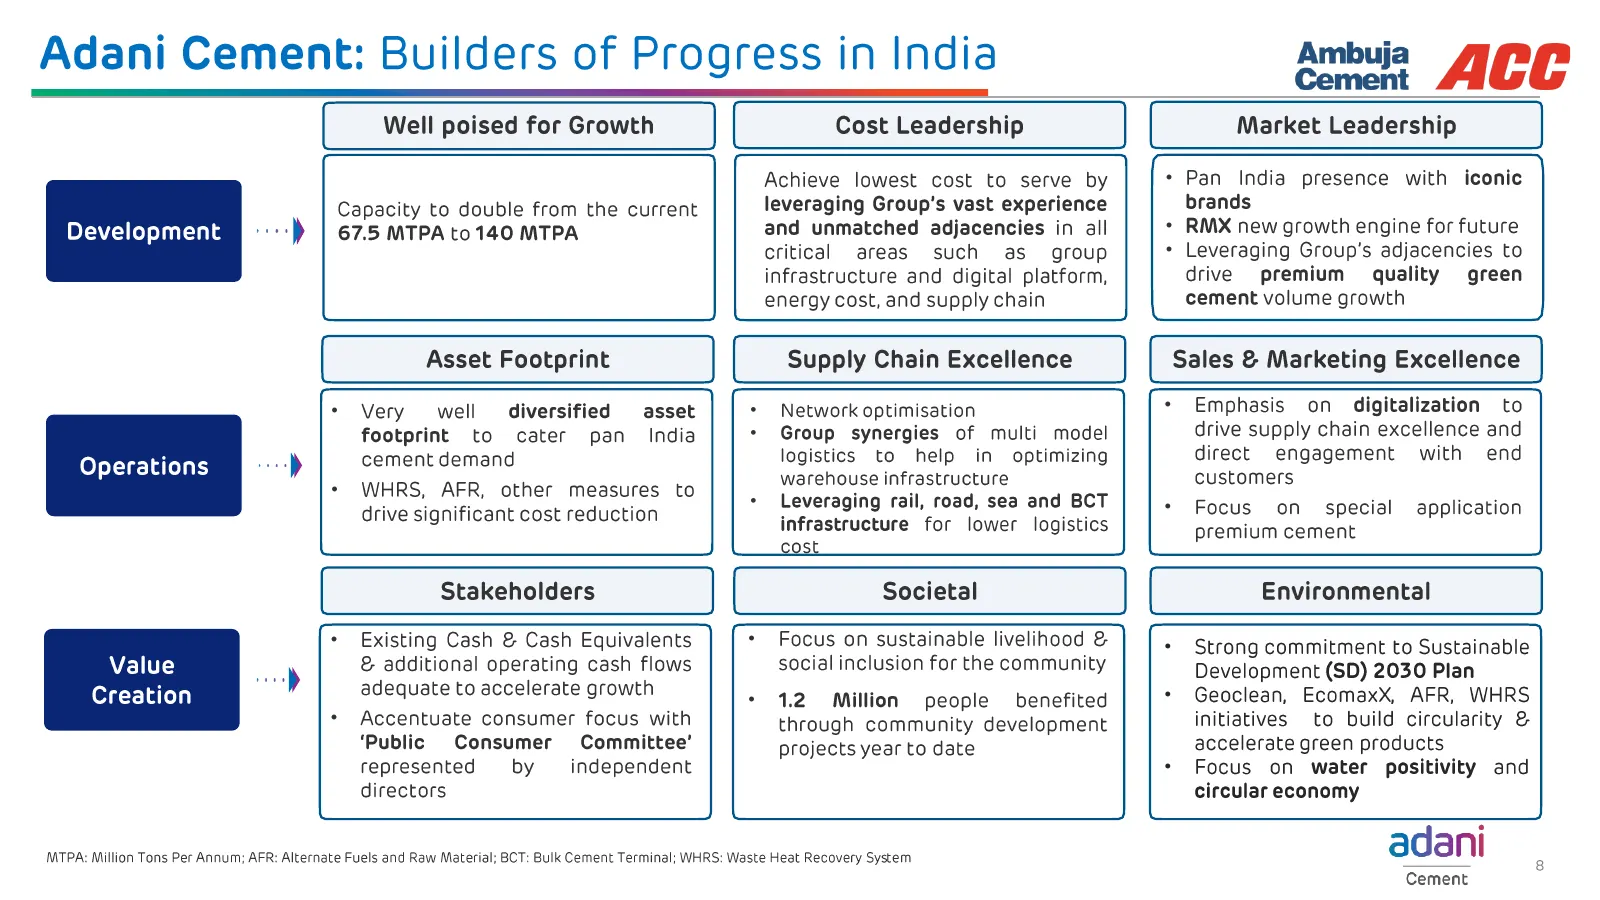
Adani Cement: Builders of Progress in India Development Operations Value Creation ”» ”» Well poised for Growth Ambuja Cement ACC Cost Leadership Market Leadership Capacity to double from the current 67.5 MTPA to 140 MTPA Achieve lowest cost to serve by leveraging Group's vast experience and unmatche
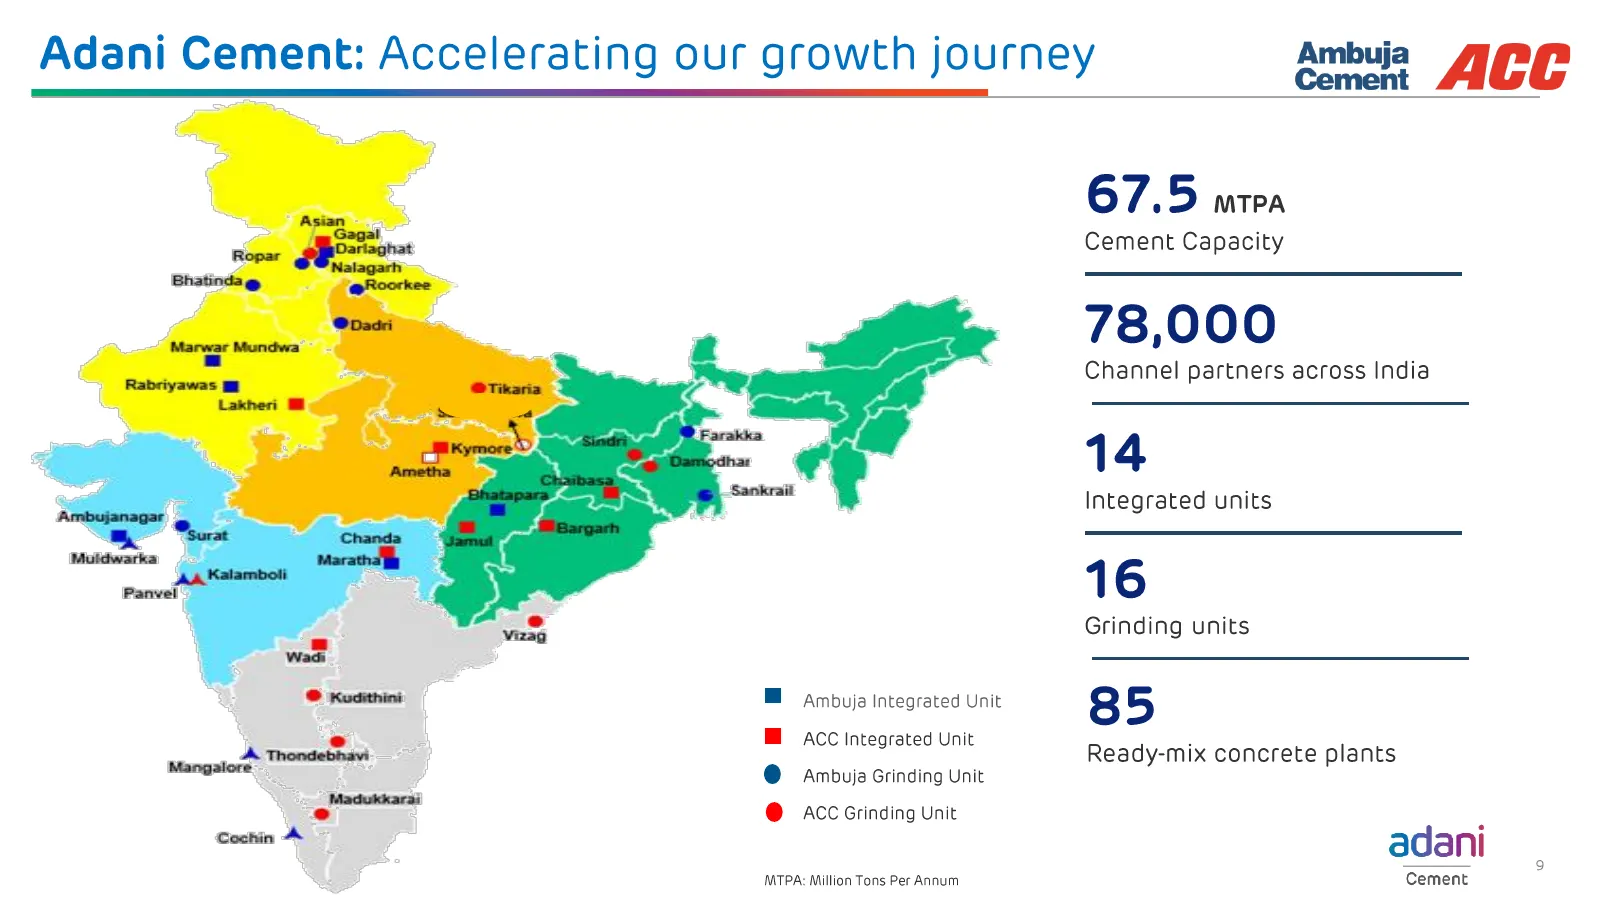
Slide 9: Adani Cement: Accelerating our growth journey
Adani Cement: Accelerating our growth journey Ambuja ACC Ambuja Integrated Unit ACC Integrated Unit Ambuja Grinding Unit ACC Grinding Unit MTPA: Million Tons Per Annum. 67. 5 MTPA Cement Capacity 78,000 Channel partners across India 14 Integrated units 16 Grinding units 85 Ready-mix concrete plants
Slide 10: Cement - Performance Highlights
Ambuja Cement’ - Performance Highlights cement AGE For the Quarter Ended December 31, 2022 O35 * Consolidated adani Cement 10
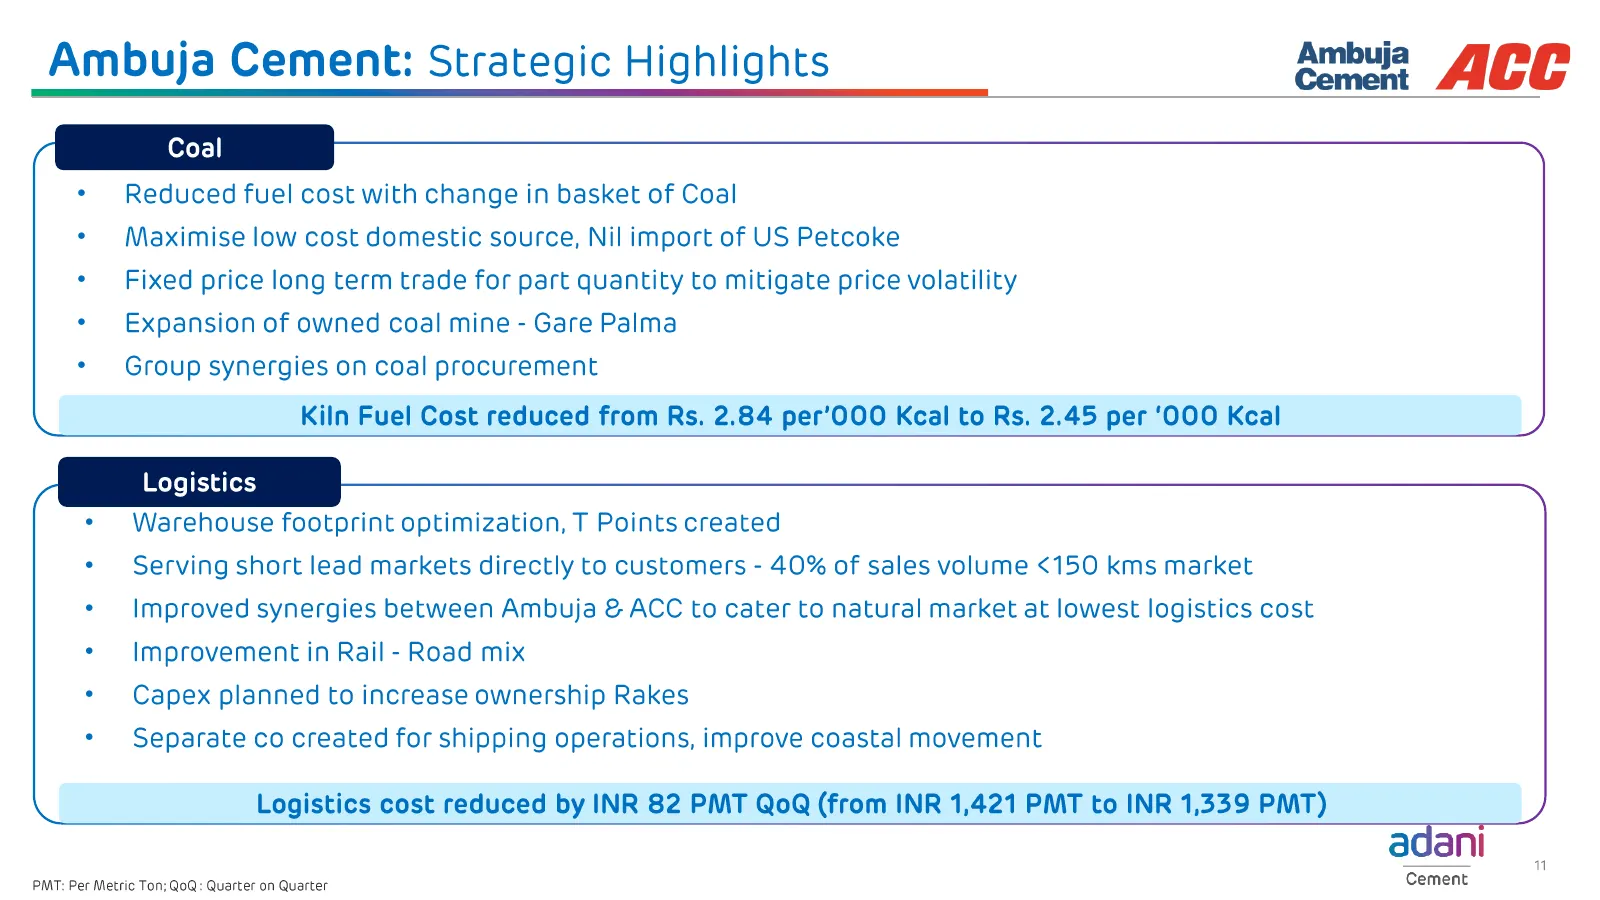
Slide 11: Cement: Strategic Highlights
Ambuja Cement: Strategic Highlights Ambuja ACC Cement . * Reduced fuel cost with change in basket of Coal * Maximise low cost domestic source, Nil import of US Petcoke + Fixed price long term trade for part quantity to mitigate price volatility * Expansion of owned coal mine - Gare Palma * Group syn
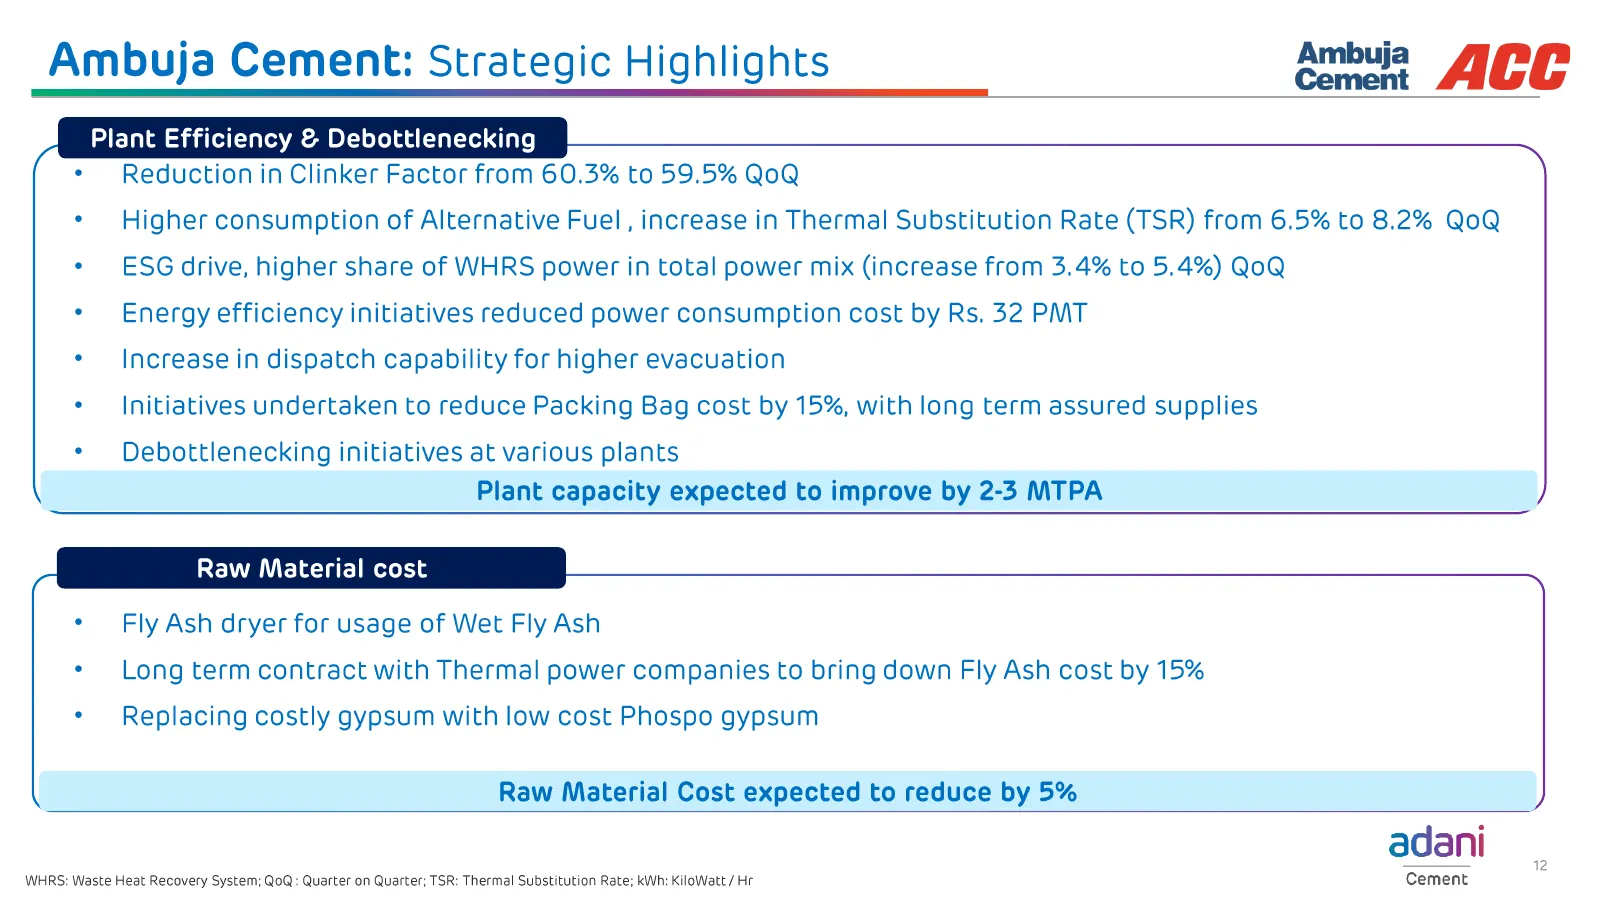
Slide 12: Cement: Strategic Highlights
Ambuja Cement: Strategic Highlights ambuia ACC Plant Efficiency & Debottlenecking ~\ R eduction in Clinker Factor from 60.3% to 59.5% QoQ * Higher consumption of Alternative Fuel, increase in Thermal Substitution Rate (TSR) from 6.5% to 8.2% QoQ * SG drive, higher share of WHRS power in total power
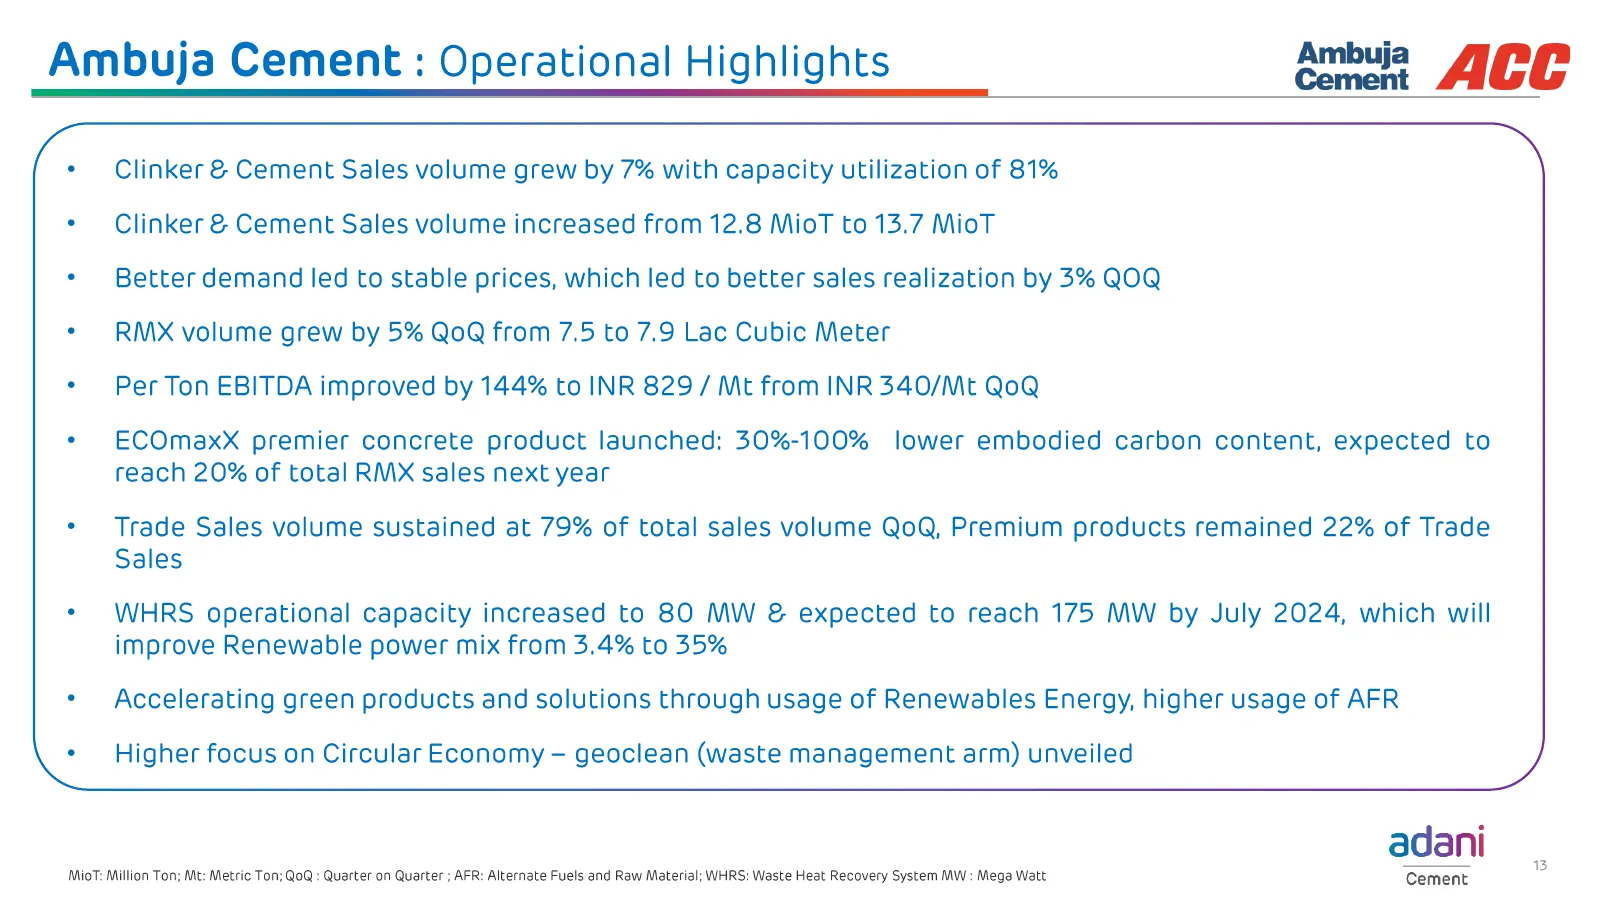
Slide 13: Cement: Operational Highlights
Ambuja Cement : Operational Highlights Ambuja 4iPE \ (. Clinker & Cement Sales volume grew by 7% with capacity utilization of 81% * Clinker & Cement Sales volume increased from 12.8 MioT to 13.7 MioT * Better demand led to stable prices, which led to better sales realization by 3% QOQ * RMX volume g
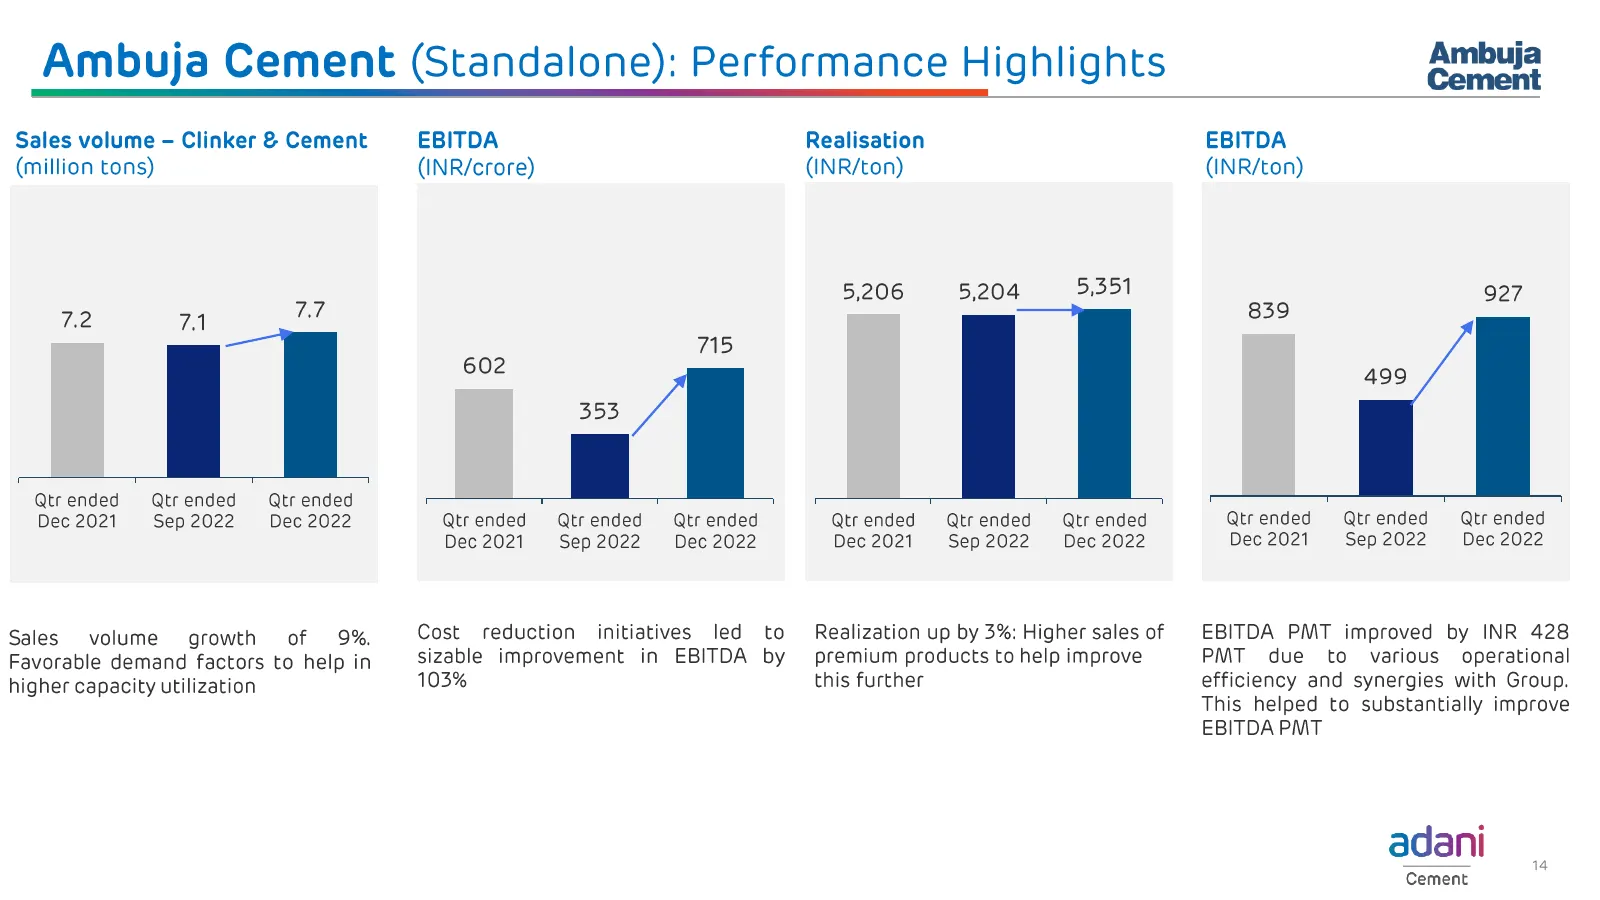
Slide 14: Cement (Standalone): Performance Highlights
Ambuja Cement (Standalone): Performance Highlights Sales volume - Clinker & Cement (million tons) 7.2 71 we Qtrended Qtrended Qtr ended Dec 2021 Sep 2022 Dec 2022 Sales volume growth of 9%, Favorable demand factors to help in higher capacity utilization Ambuja Cement EBITDA Realisation EBITDA (INR/c
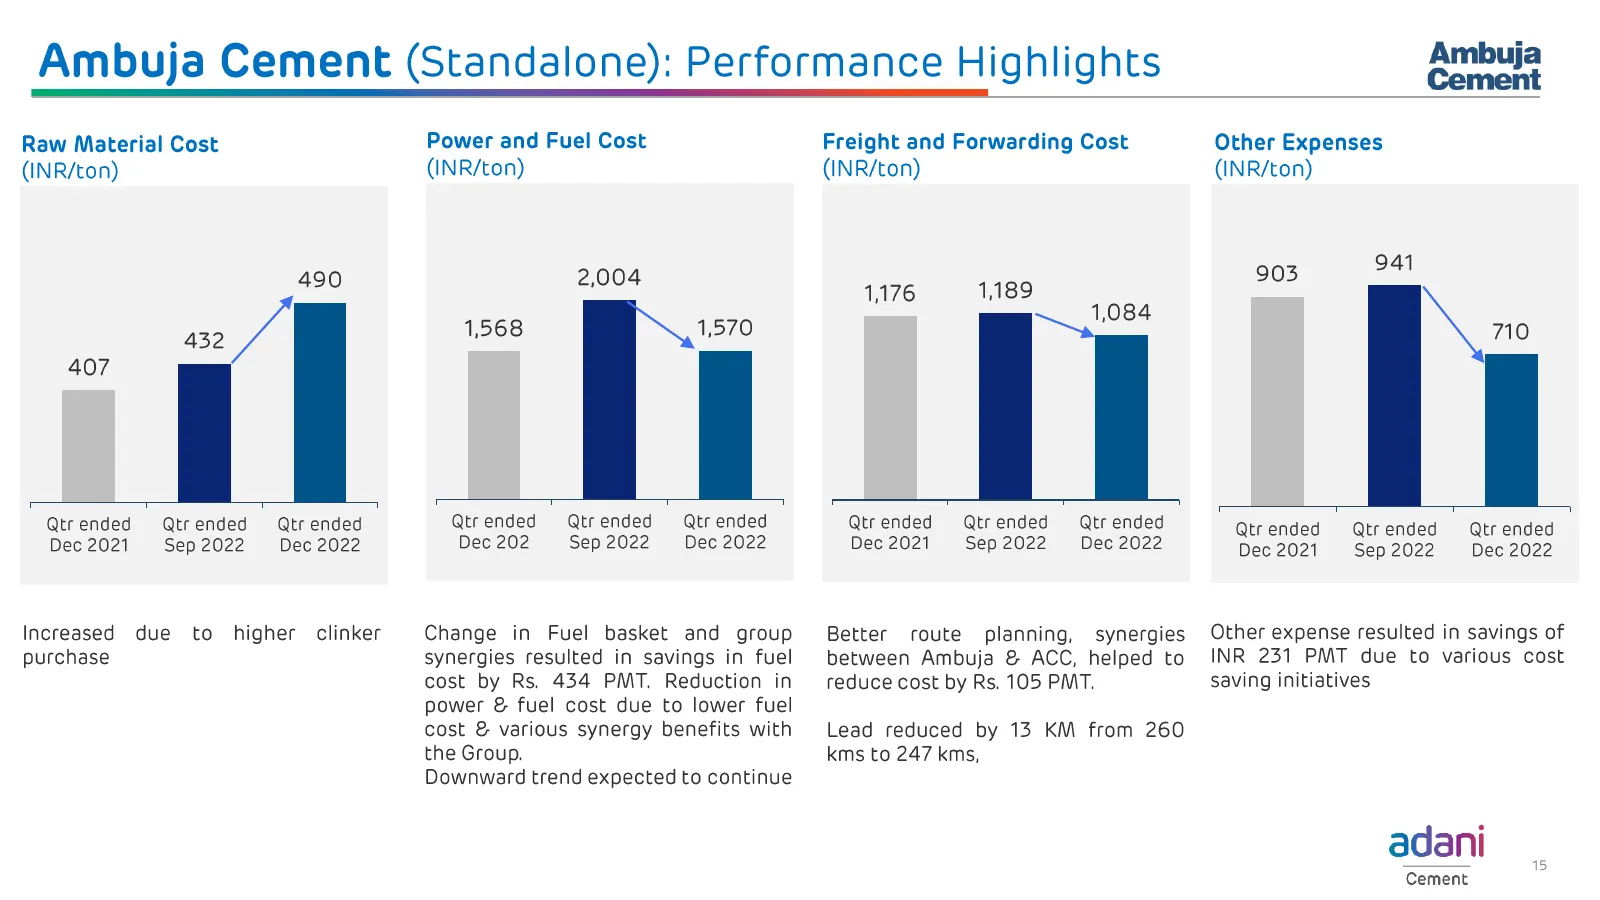
Slide 15: Cement (Standalone): Performance Highlights
Ambuja Cement (Standalone): Performance Highlights Raw Material Cost (INR/ton) 490 432 /| 407 Qtrended Qtrended Qtr ended Dec 2021 Sep 2022 Dec 2022 Increased due to higher clinker purchase Power and Fuel Cost (INR/ton) 2,004 1,568 1,570 Qtrended Qtrended Qtr ended Dec 202 Sep 2022 Dec 2022 Change i
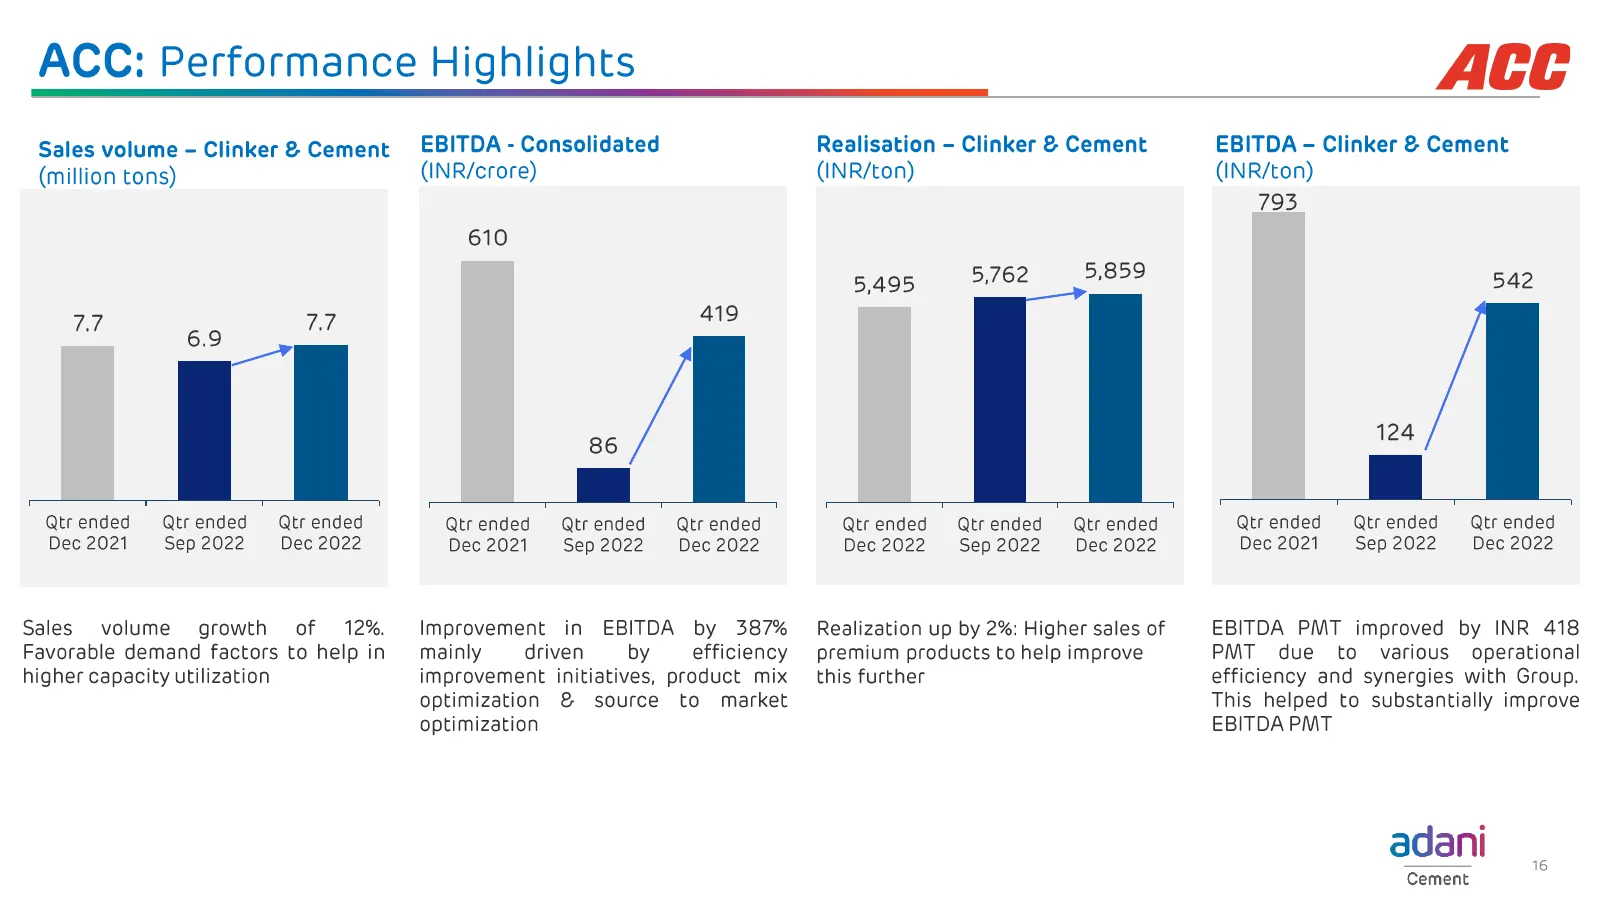
Slide 16: ACC: Performance Highlights
ACC: Performance Highlights Sales volume - Clinker & Cement (million tons) 77 7.7 6.9 —| Qtrended Qtrended Qtrended Dec 2021 Sep 2022 Dec 2022 Sales volume growth of 12%. Favorable demand factors to help in higher capacity utilization EBITDA - Consolidated (INR/crore) 610 419 86 Qtrended Qtrended Qt
Slide 17: ACC: Performance Highlights
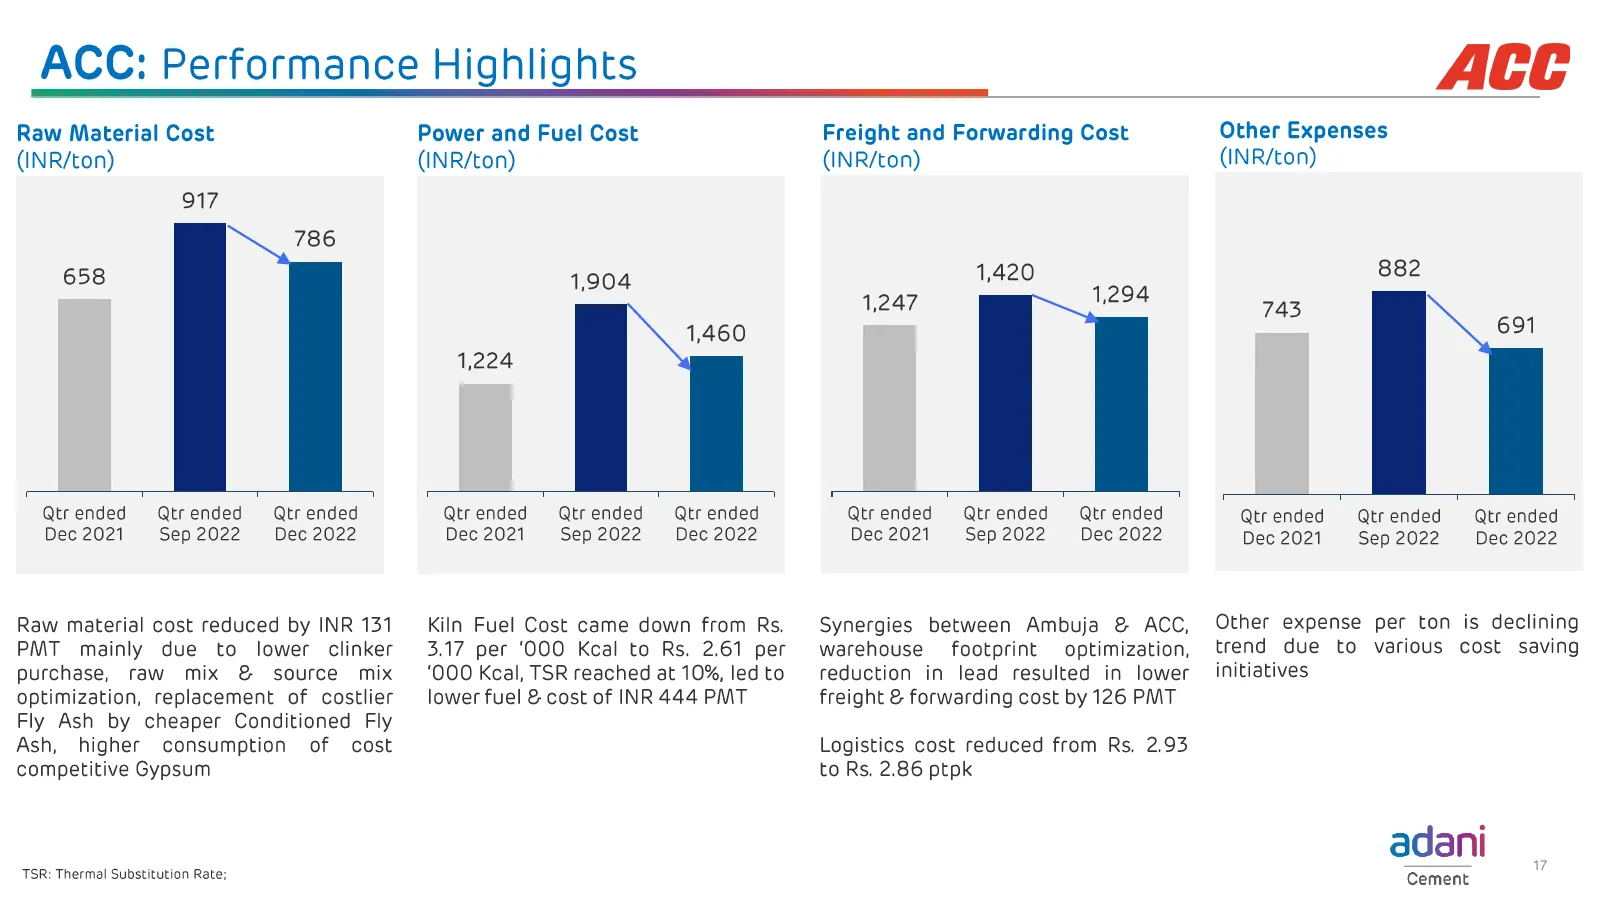
ACC: Performance Highlights Raw Material Cost (INR/ton) 917 786 658 Qtrended Qtrended Qtr ended Dec 2021 Sep 2022 Dec 2022 Raw material cost reduced by INR 131 PMT mainly due to lower clinker purchase, raw mix & source mix optimization, replacement of costlier Fly Ash by cheaper Conditioned Fly Ash,
Slide 18: Cement (consolidated): Performance Highlights
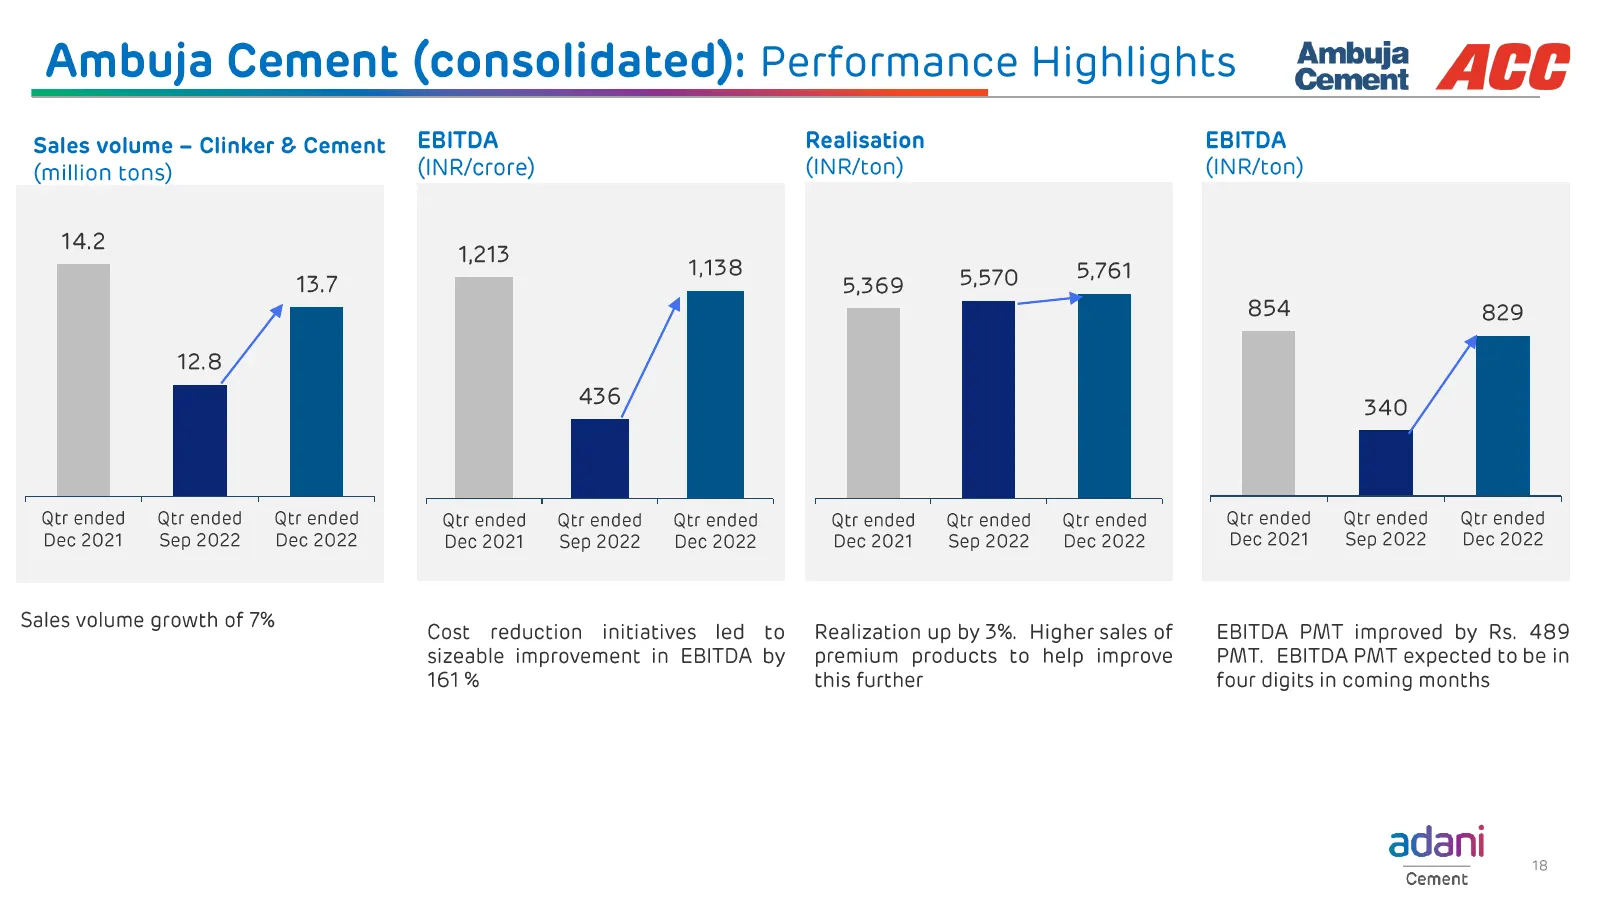
Ambuja Cement (consolidated): Performance Highlights Ambuja ACC Cement Sales volume - Clinker & Cement EBITDA Realisation EBITDA (million tons) (INR/crore) (INR/ton) (INR/ton) 14.2 1,213 ‘ 1,138 13.7 5369 5570 9761 854 829 12.8 / 436 340 Qtrended Qtrended Qtrended Qtrended Qtrended Qtr ended Qtrende
Slide 19: Cement (consolidated): Performance Highlights
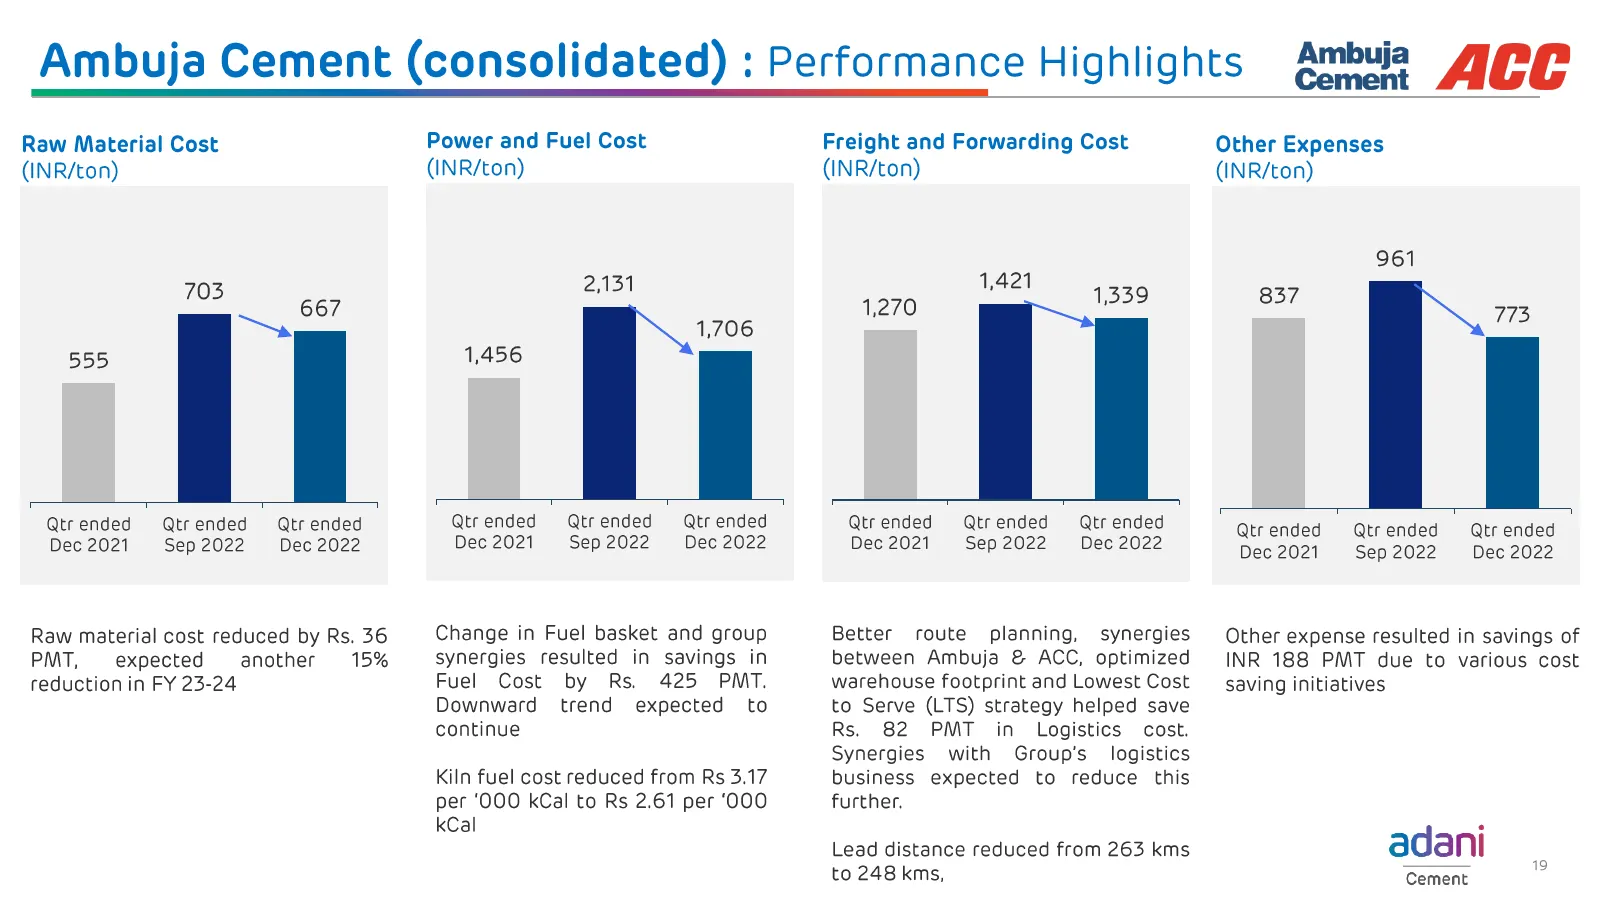
Ambuja Cement (consolidated) : Performance Highlights Raw Material Cost (INR/ton) 703 667 ~~ 555 Qtrended Qtrended Qtr ended Dec 2021 Sep 2022 Dec 2022 Raw material cost reduced by Rs. 36 PMT, expected another 15% reduction in FY 23-24 Power and Fuel Cost (INR/ton) 2,131 1,706 1,456 Qtrended Qtrende
Slide 20: (Standalone) - Financial Results
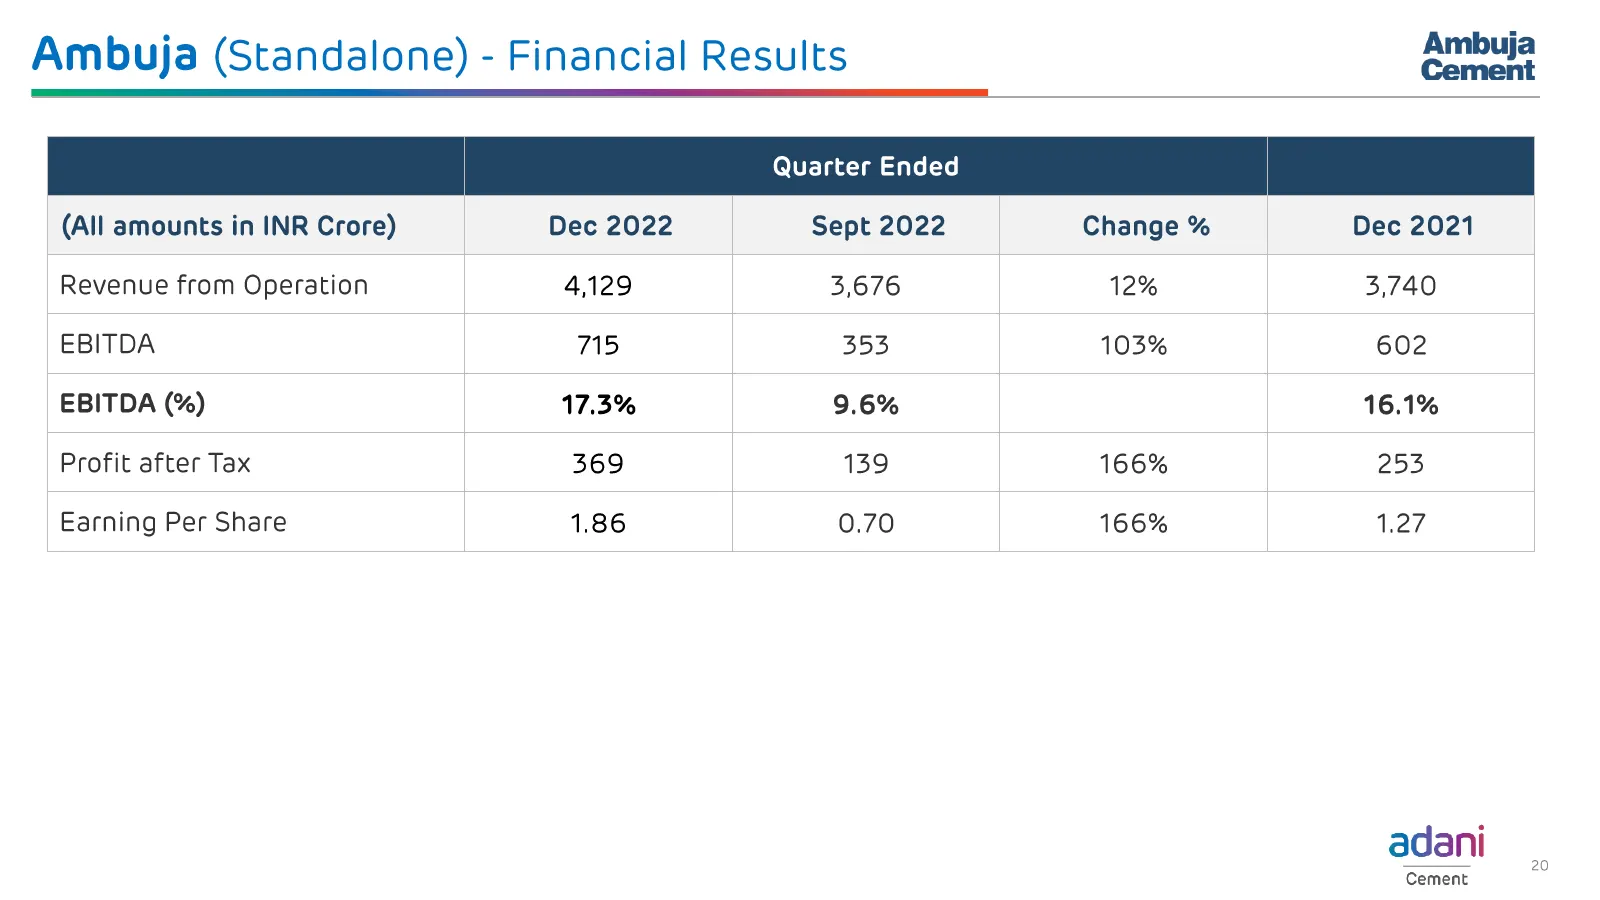
Ambuja (Standalone) - Financial Results Ambuja Cement (All amounts in INR Crore) Dec 2022 Revenue from Operation 4129 EBITDA 715 EBITDA (%) 17.3% Profit after Tax 369 Earning Per Share 1.86 Sept 2022 3,676 353 9.6% 139 0.70 Change % 12% 103% 166% 166% Dec 2021 3,740 602 16.1% 253 1.27 adani Cement
Slide 21: ACC - Financial Results
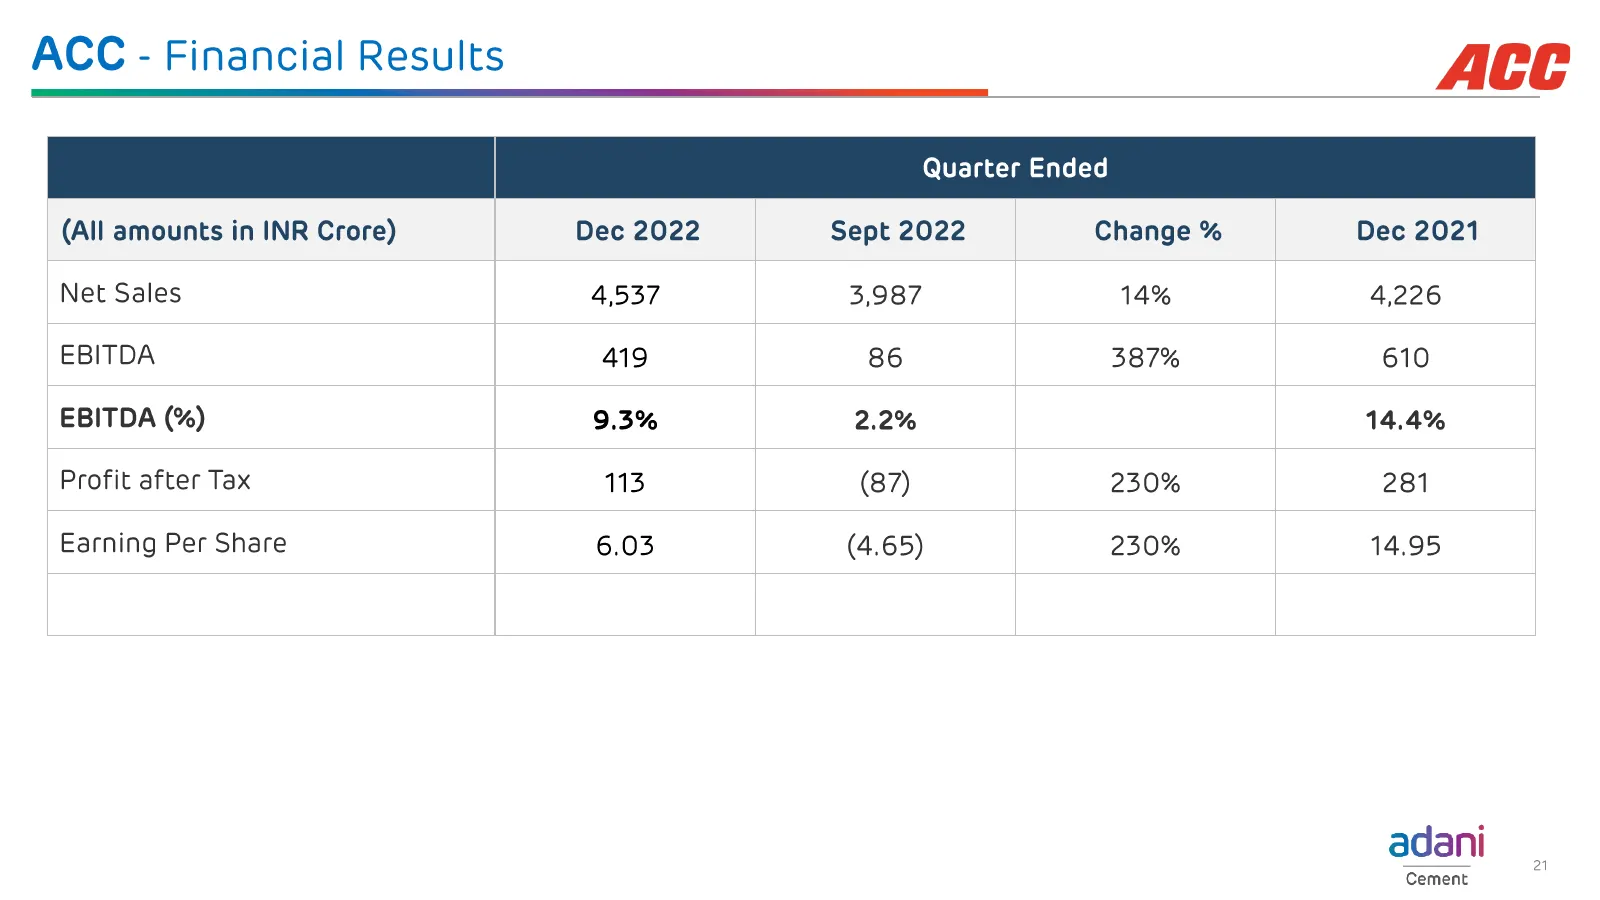
ACC - Financial Results ACL (All amounts in INR Crore) Dec 2022 Sept 2022 Change % Dec 2021 Net Sales 4,537 3,987 14% 4,226 EBITDA 419 86 387% 610 EBITDA (%) 9.3% 2.2% 14.4% Profit after Tax 113, (87) 230% 281 Earning Per Share 6.03 (4.65) 230% 14.95 adani Cement
Slide 22: (Consolidated) Financial Results
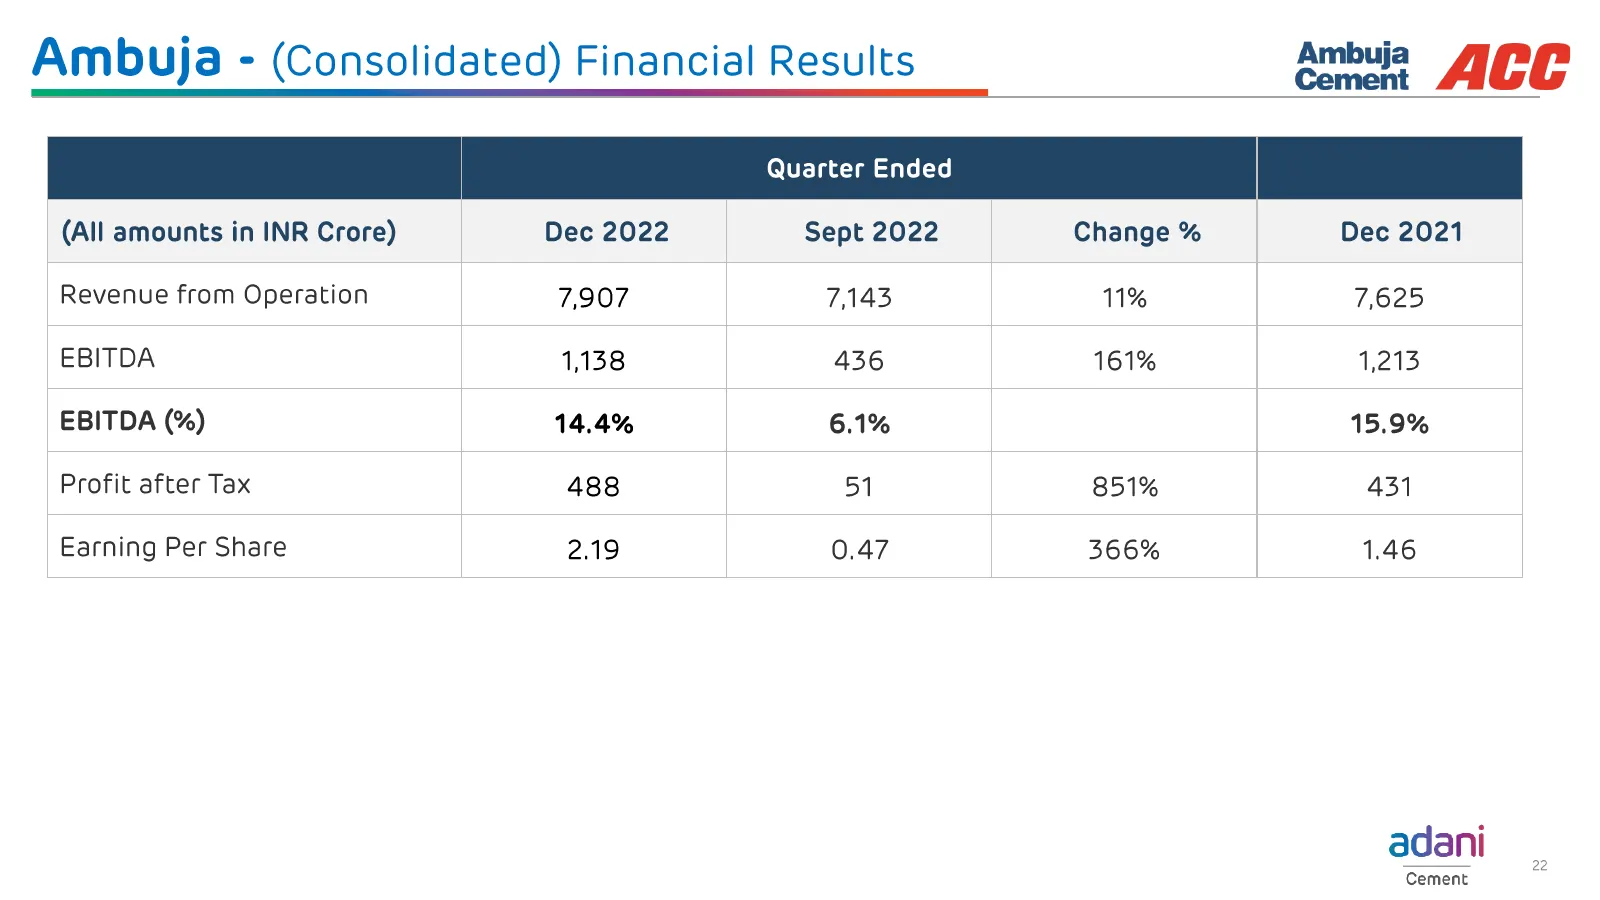
Ambuja - (Consolidated) Financial Results Ambuja ACC (All amounts in INR Crore) Dec 2022 Sept 2022 Change % Dec 2021 Revenue from Operation 7,907 7,143 11% 7,625 EBITDA 1,138 436 161% 1,213 EBITDA (%) 14.4% 6.1% 15,9% Profit after Tax 488 51 851% 431 Earning Per Share 2.19 0.47 366% 1.46 adani Cemen
Slide 23: Cement (consolidated): Cash & Cash Equivalents position 1/2
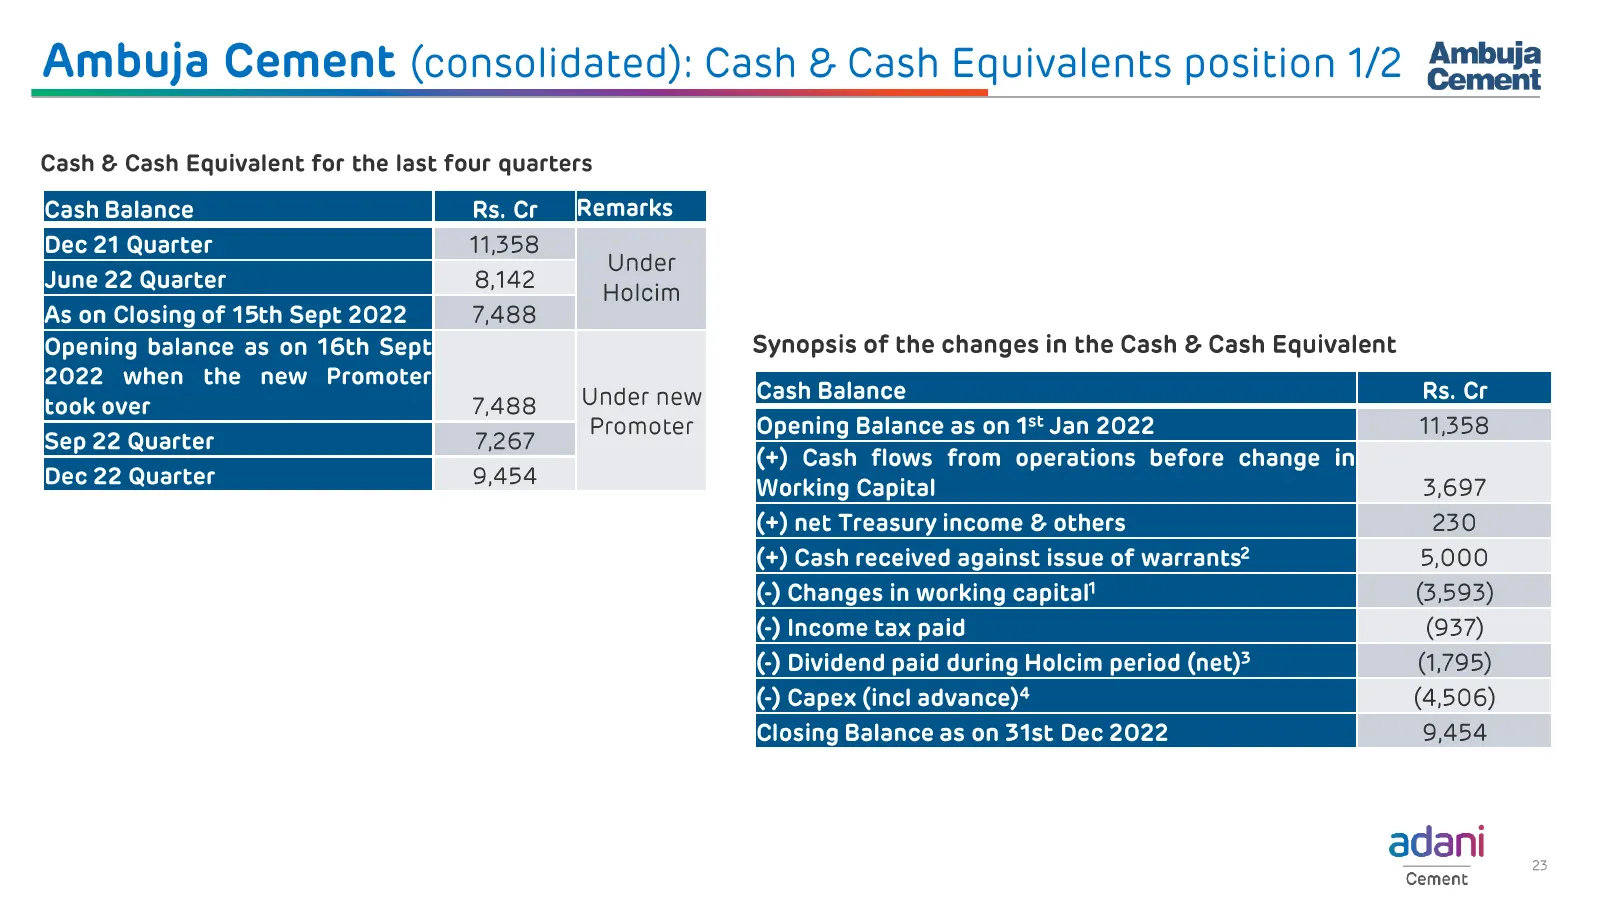
Ambuja Cement (consolidated): Cash & Cash Equivalents position 1/2 Ambuja Cash & Cash Equivalent for the last four quarters Cash Balance IDec 21 Quarter 11,358 une 22 Quart g1a2 (under une uarter b eoleim As on Closing of 15th Sept 2022 7,488 (Opening balance as on 16th Sep Synopsis of the changes i
Slide 24: Cement (consolidated): Cash & Cash Equivalents position 2/2
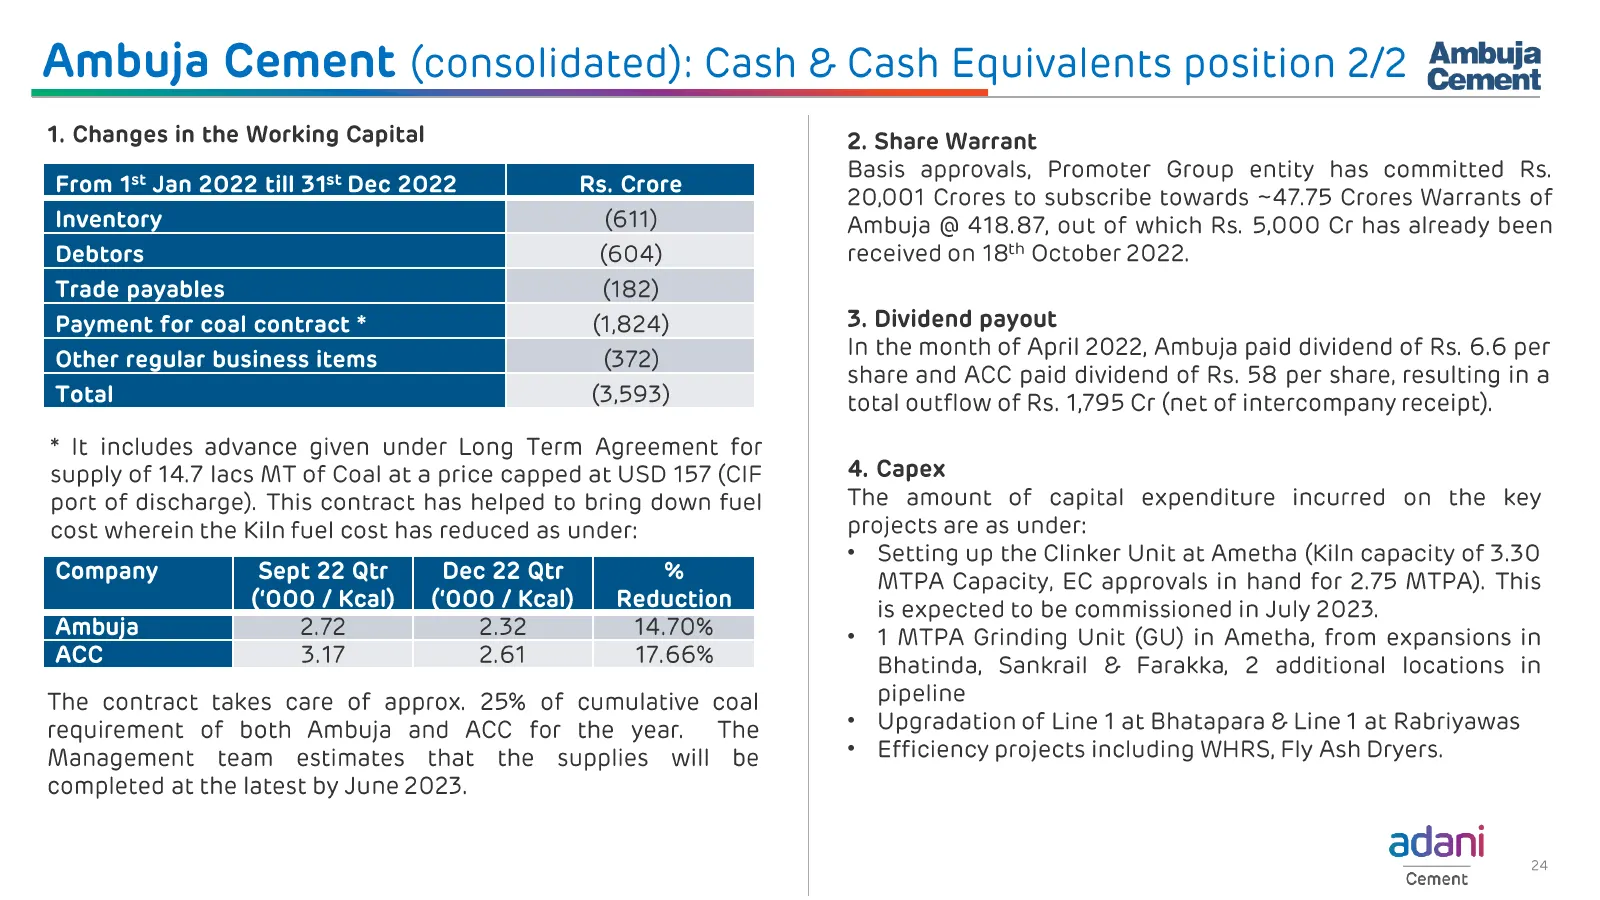
Ambuja Cement (consolidated): Cash & Cash Equivalents position 2/2 Ambuja 1, Changes in the Working Capital From 1% Jan 2022 till 31% Dec 2022 Inventor (611) Debtors (604) Trade payables (182) Payment for coal contract * (1,824) Other regular business items (372) (3,593) * It includes advance given
Slide 25: Way Forward
cement AGE Way Forward O5
Slide 26: Adani Cement - Way Forward
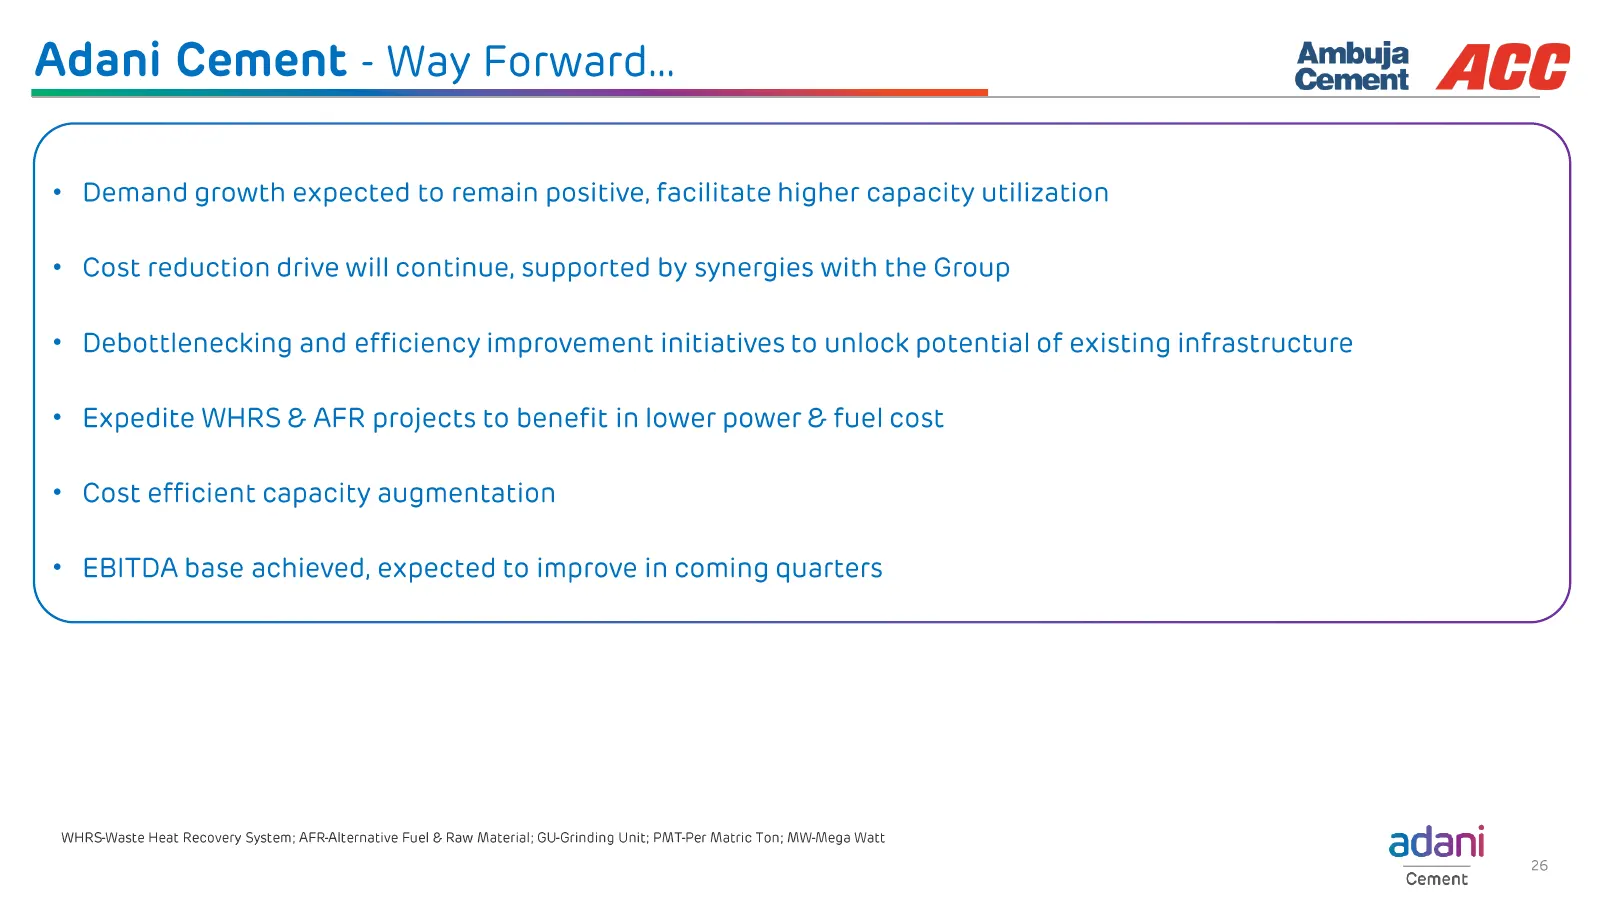
Adani Cement - Way Forward... ambuia ACC 7 ~ * Demand growth expected to remain positive, facilitate higher capacity utilization * Cost reduction drive will continue, supported by synergies with the Group * Debottlenecking and efficiency improvement initiatives to unlock potential of existing infras
Slide 27: ESG Update
cement AGE ESG Update O6 Cement
Slide 28: Cement: ESG performance update
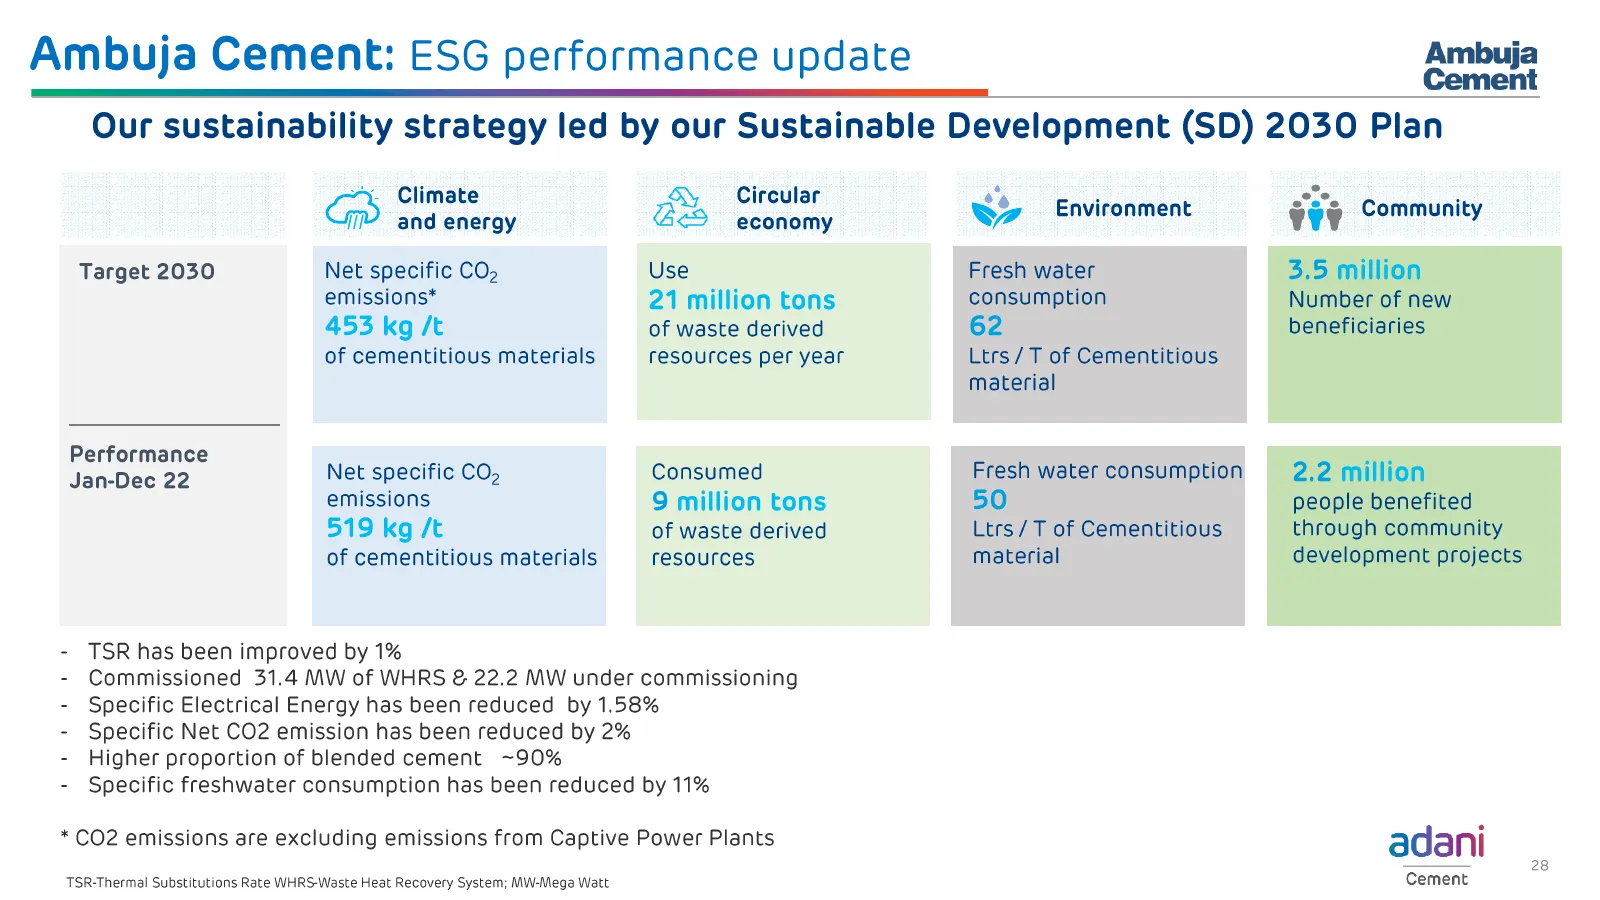
Ambuja Cement: ESG performance update Ambuja Our sustainability strategy led by our Sustainable Development (SD) 2030 Plan ~y. Climate Circular wy Rey fil? and energy Bx economy Environment eee Commnuly Target 2030 Net specific CO, Use emissions* 21 million tons 453 kg /t of waste derived of cementi
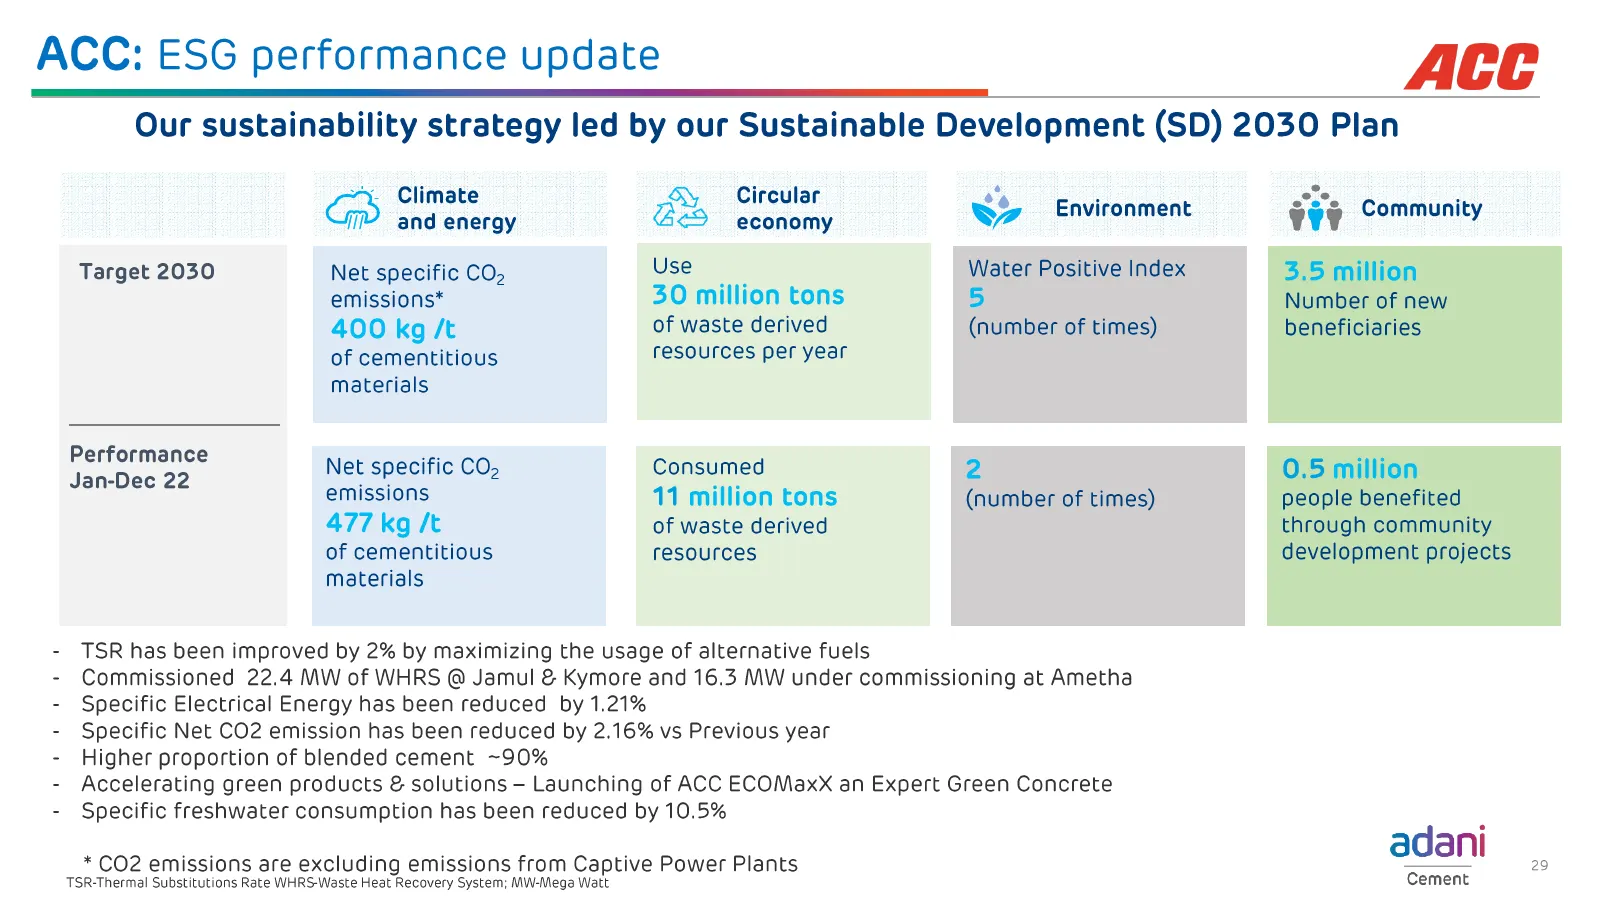
Slide 29: ACC: ESG performance update
ACC: ESG performance update Ace Our sustainability strategy led by our Sustainable Development (SD) 2030 Plan ~\. Climate Circular ry OO 2 fi? and energy oS, economy ww Environment ve Community Target 2030 Net specific CO, Use Water Positive Index emissions* 30 million tons 5 400 kg /t of waste deri
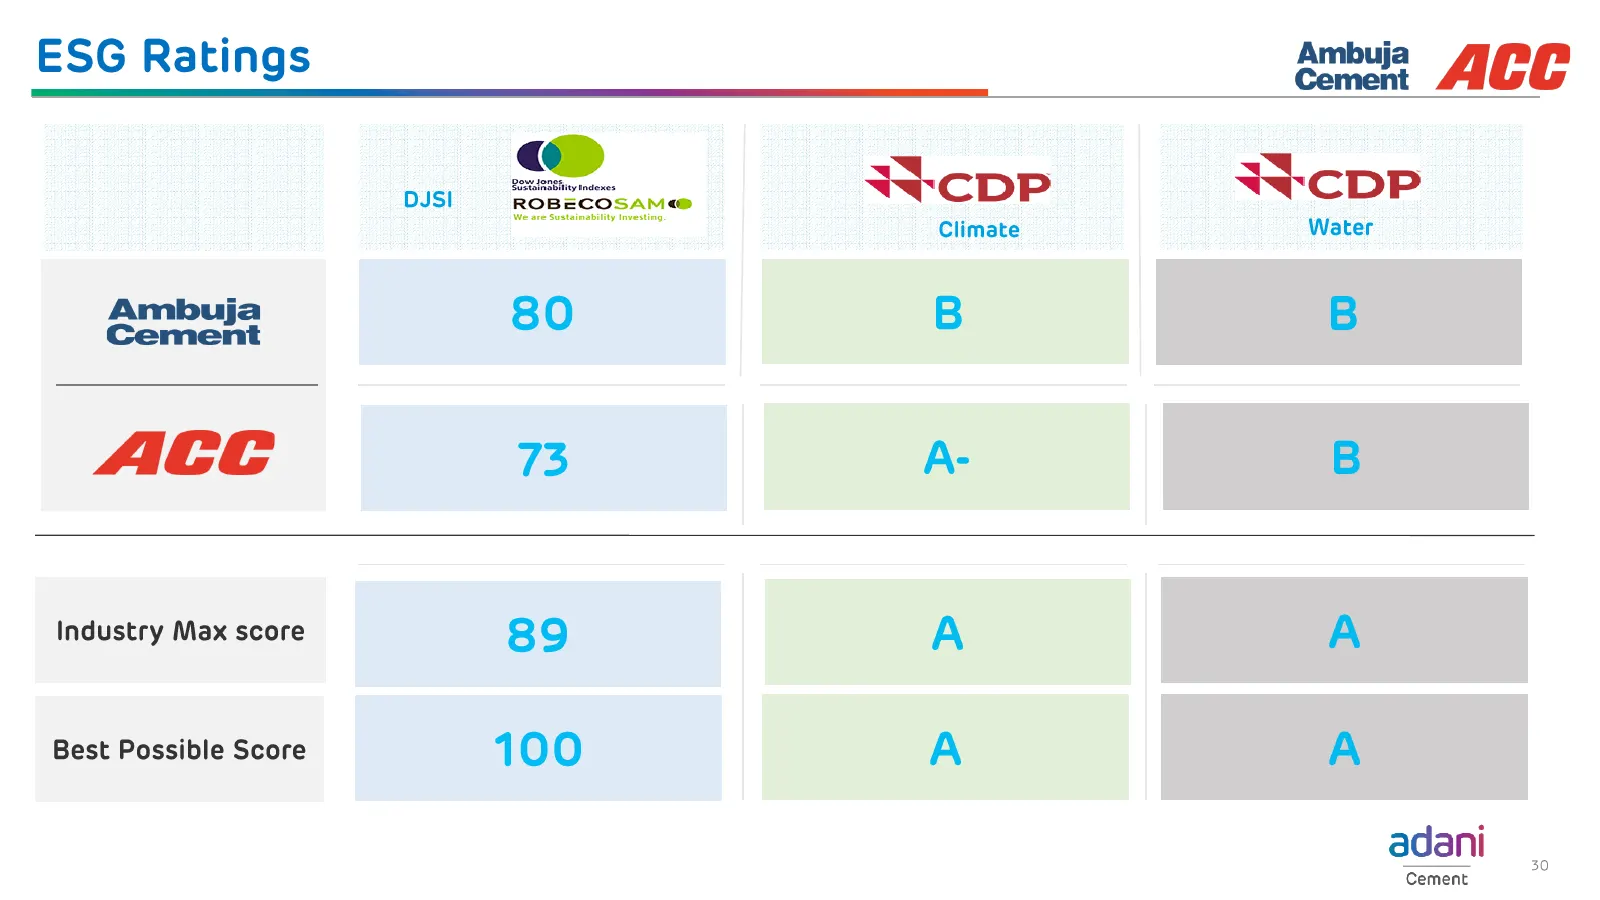
Slide 30: ESG Ratings
ESG Ratings Ambuja ACC Cement DJS! Wcpp Wepp Climate Water Ambuja 80 B B Cement ACL 73 A- B Industry Max score 89 A A Best Possible Score 1 (eye) A A adani Cement
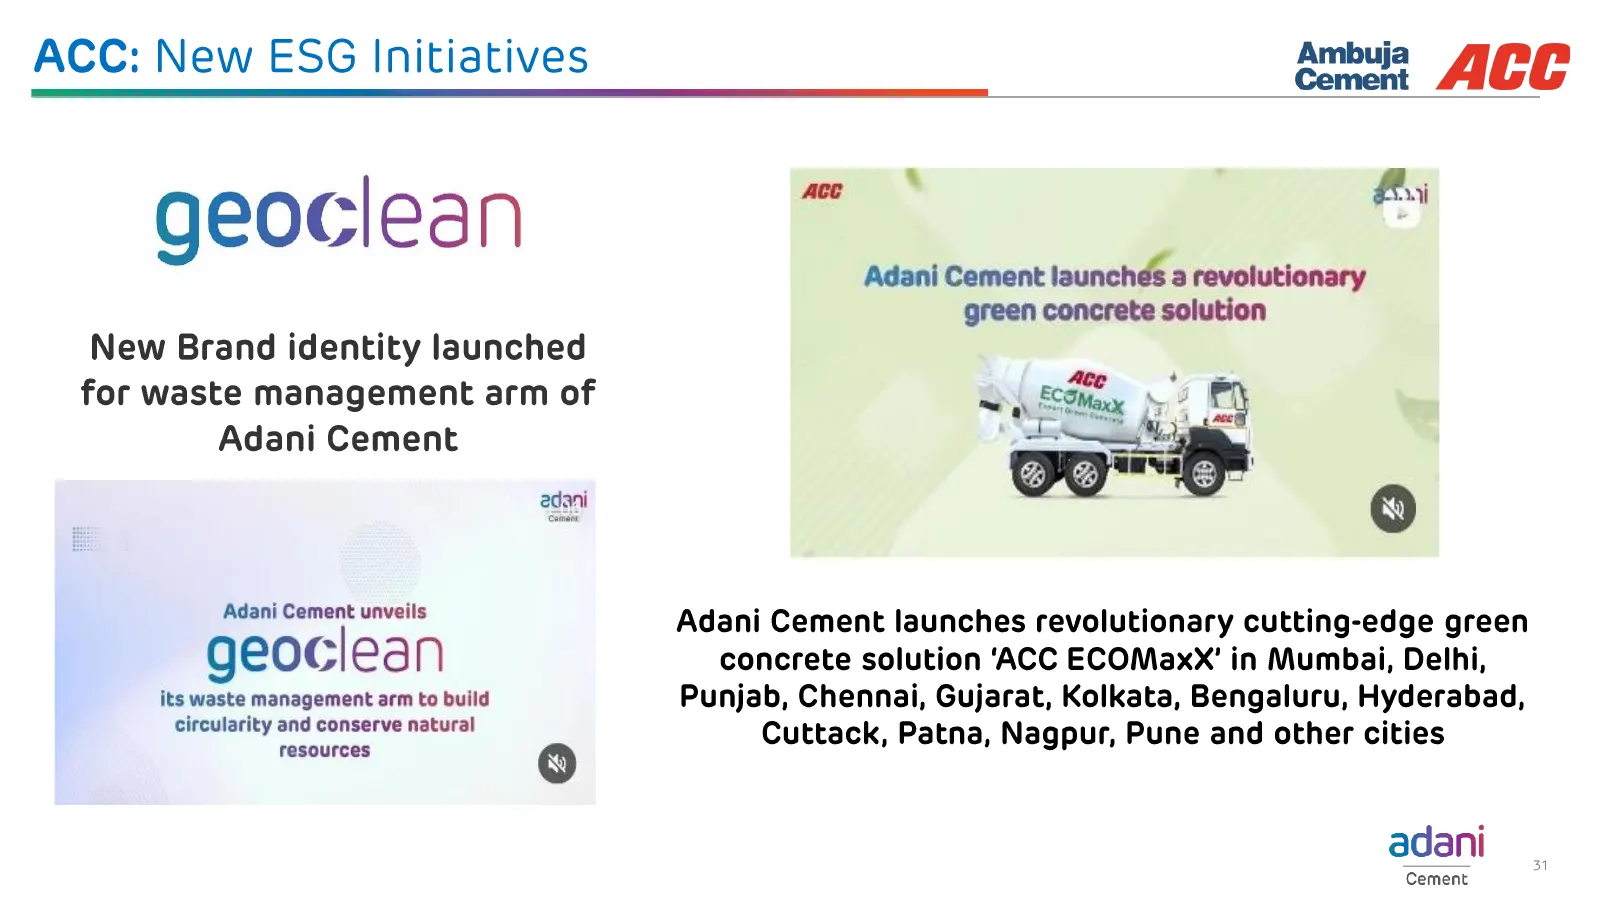
Slide 31: ACC: New ESG Initiatives
ACC: New ESG Initiatives cement AGE geoclean New Brand identity launched for waste management arm of Adani Cement Adani Cement unveils geoclean its waste management arm to build circularity and conserve natural resources x] ace ‘ ; Ri Adani Cement launchés a revolutionary green concrete solution Ada
Slide 32: Adani Cement: Corporate Social Responsibility
cement AGE Adani Cement : Corporate Social Responsibility O7 Cement
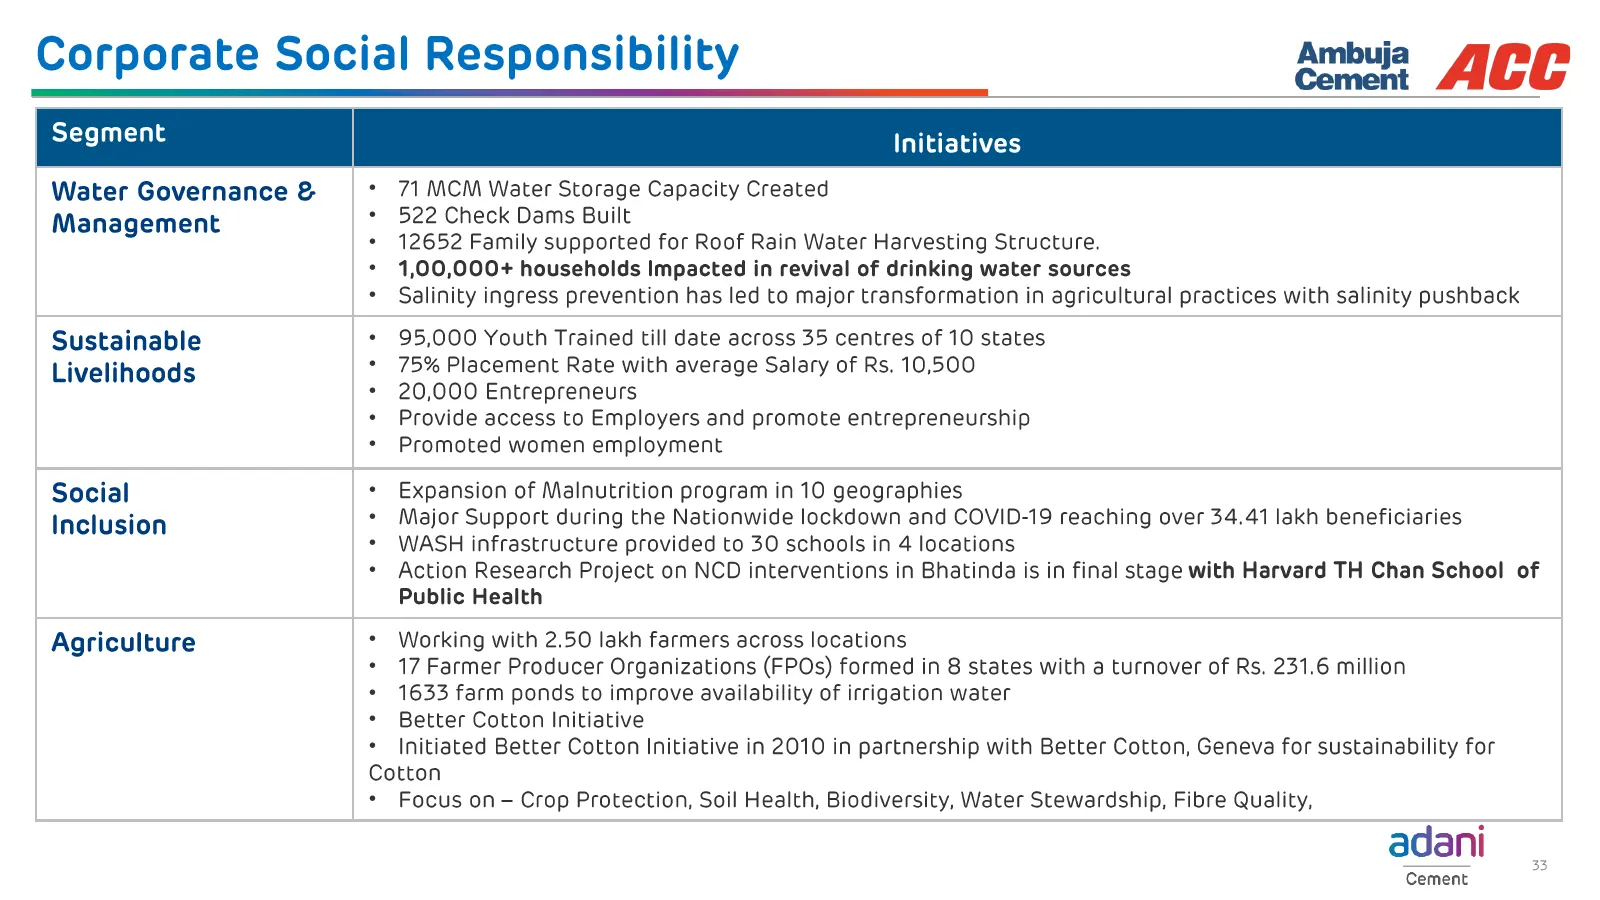
Slide 33: Corporate Social Responsibility
Corporate Social Responsibility Ambuia ACL Segment cies Water Governance & Management Sustainable Livelihoods Social Inclusion Agriculture Cement 71 MCM Water Storage Capacity Created 522 Check Dams Built 12652 Family supported for Roof Rain Water Harvesting Structure. 1,00,000+ households Impacted
Slide 34: Accolades & Awards
Accolades & Awards 08 Ambuja Cement Ace
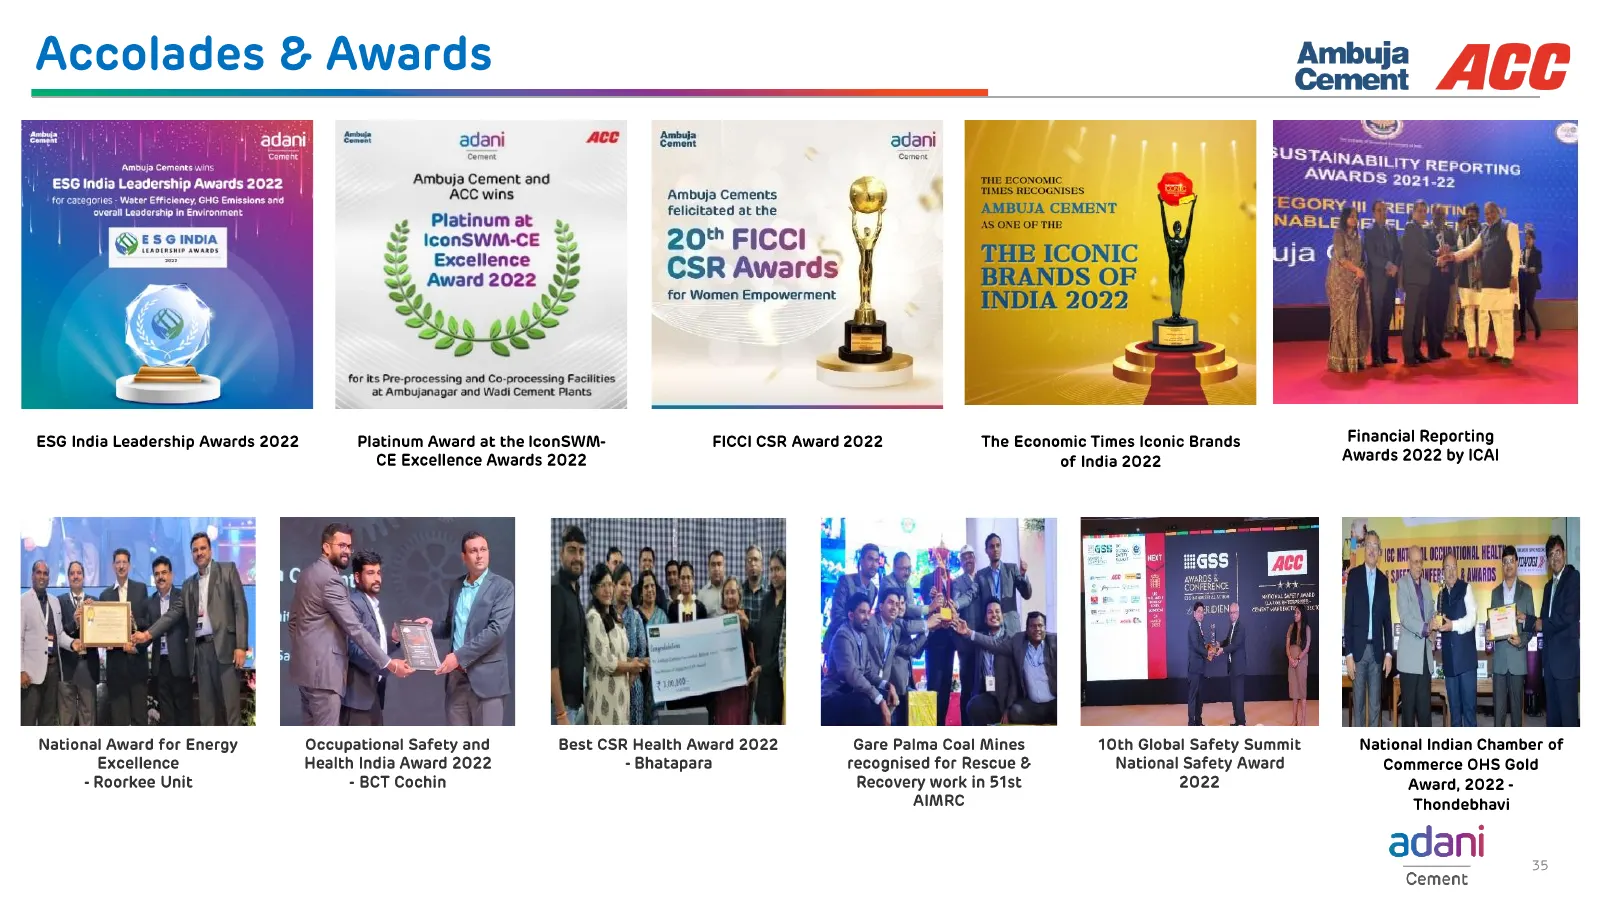
Slide 35: Accolades & Awards
Accolades & Awards eit : | ie so adani ar, adani ba ‘Ambuja Cements wins isi ie. “iy ITY REPORT | ESG India Leadership Awards Ambuja Cement and Tu EcoNoMIc AWARDS 2021.22 tel ACC wins Ambuja Cements aa - EGO! felicitated at the AMBUJA CEMENT RY WN RE Platinum at 9, h AS ONE OF THE eS Iconswm-ce 20*
Slide 36: Disclaimer
Disclaimer ambula AGG Cement Certain statements made in this presentation may not be based on historical information or facts and may be “forward-looking statements,” including those relating to general business plans and strategy of Ambuja Cements Limited (“Ambuja”), the future outlook and growth p
Source: Internet Archive copy of ambujacement.com
More decks from Ambuja Cements Limited
 Adani Portfolio — Investor Presentation (November 2026)56 slides · November 2026
 H1 FY27 Earnings Presentation40 slides · November 2026
 H1 FY27 Earnings Presentation40 slides · November 2026
 Adani Portfolio — ESG Presentation (November 2026)18 slides · November 2026
 Q2 FY2027 Earnings Presentation39 slides · Oct 29, 2026
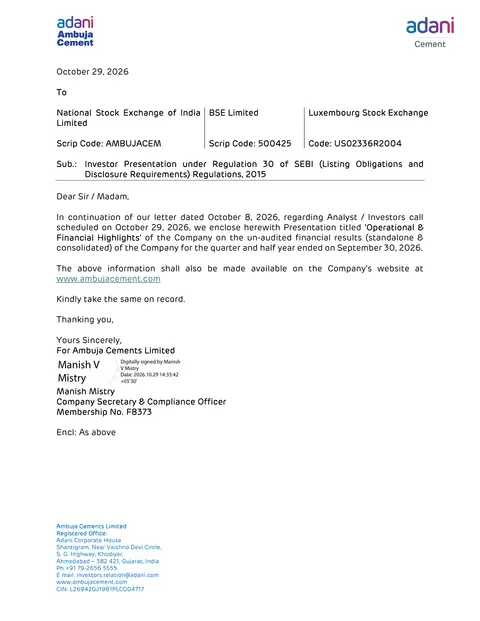 Q2 FY2027 Earnings Presentation40 slides · Oct 29, 2026