Archstone Smith Trust — Archstone-Smith Investor Conference 2004
62 slides from Archstone Smith Trust's conference presentation, Oct 12, 2004

Slide 1: Archstone-Smith Investor Conference
Table of Contents Exhibit 99.1 Archstone-Smith Investor Conference Washington, D.C. October 12, 2004 1

Slide 2: Safe harbor language
Table of Contents Safe harbor language In addition to historical information, this presentation contains forward-looking statements and information under the federal securities laws. These statements are based on current expectations, estimates and projections about the industry and markets in which
Slide 3: Deep and talented management team
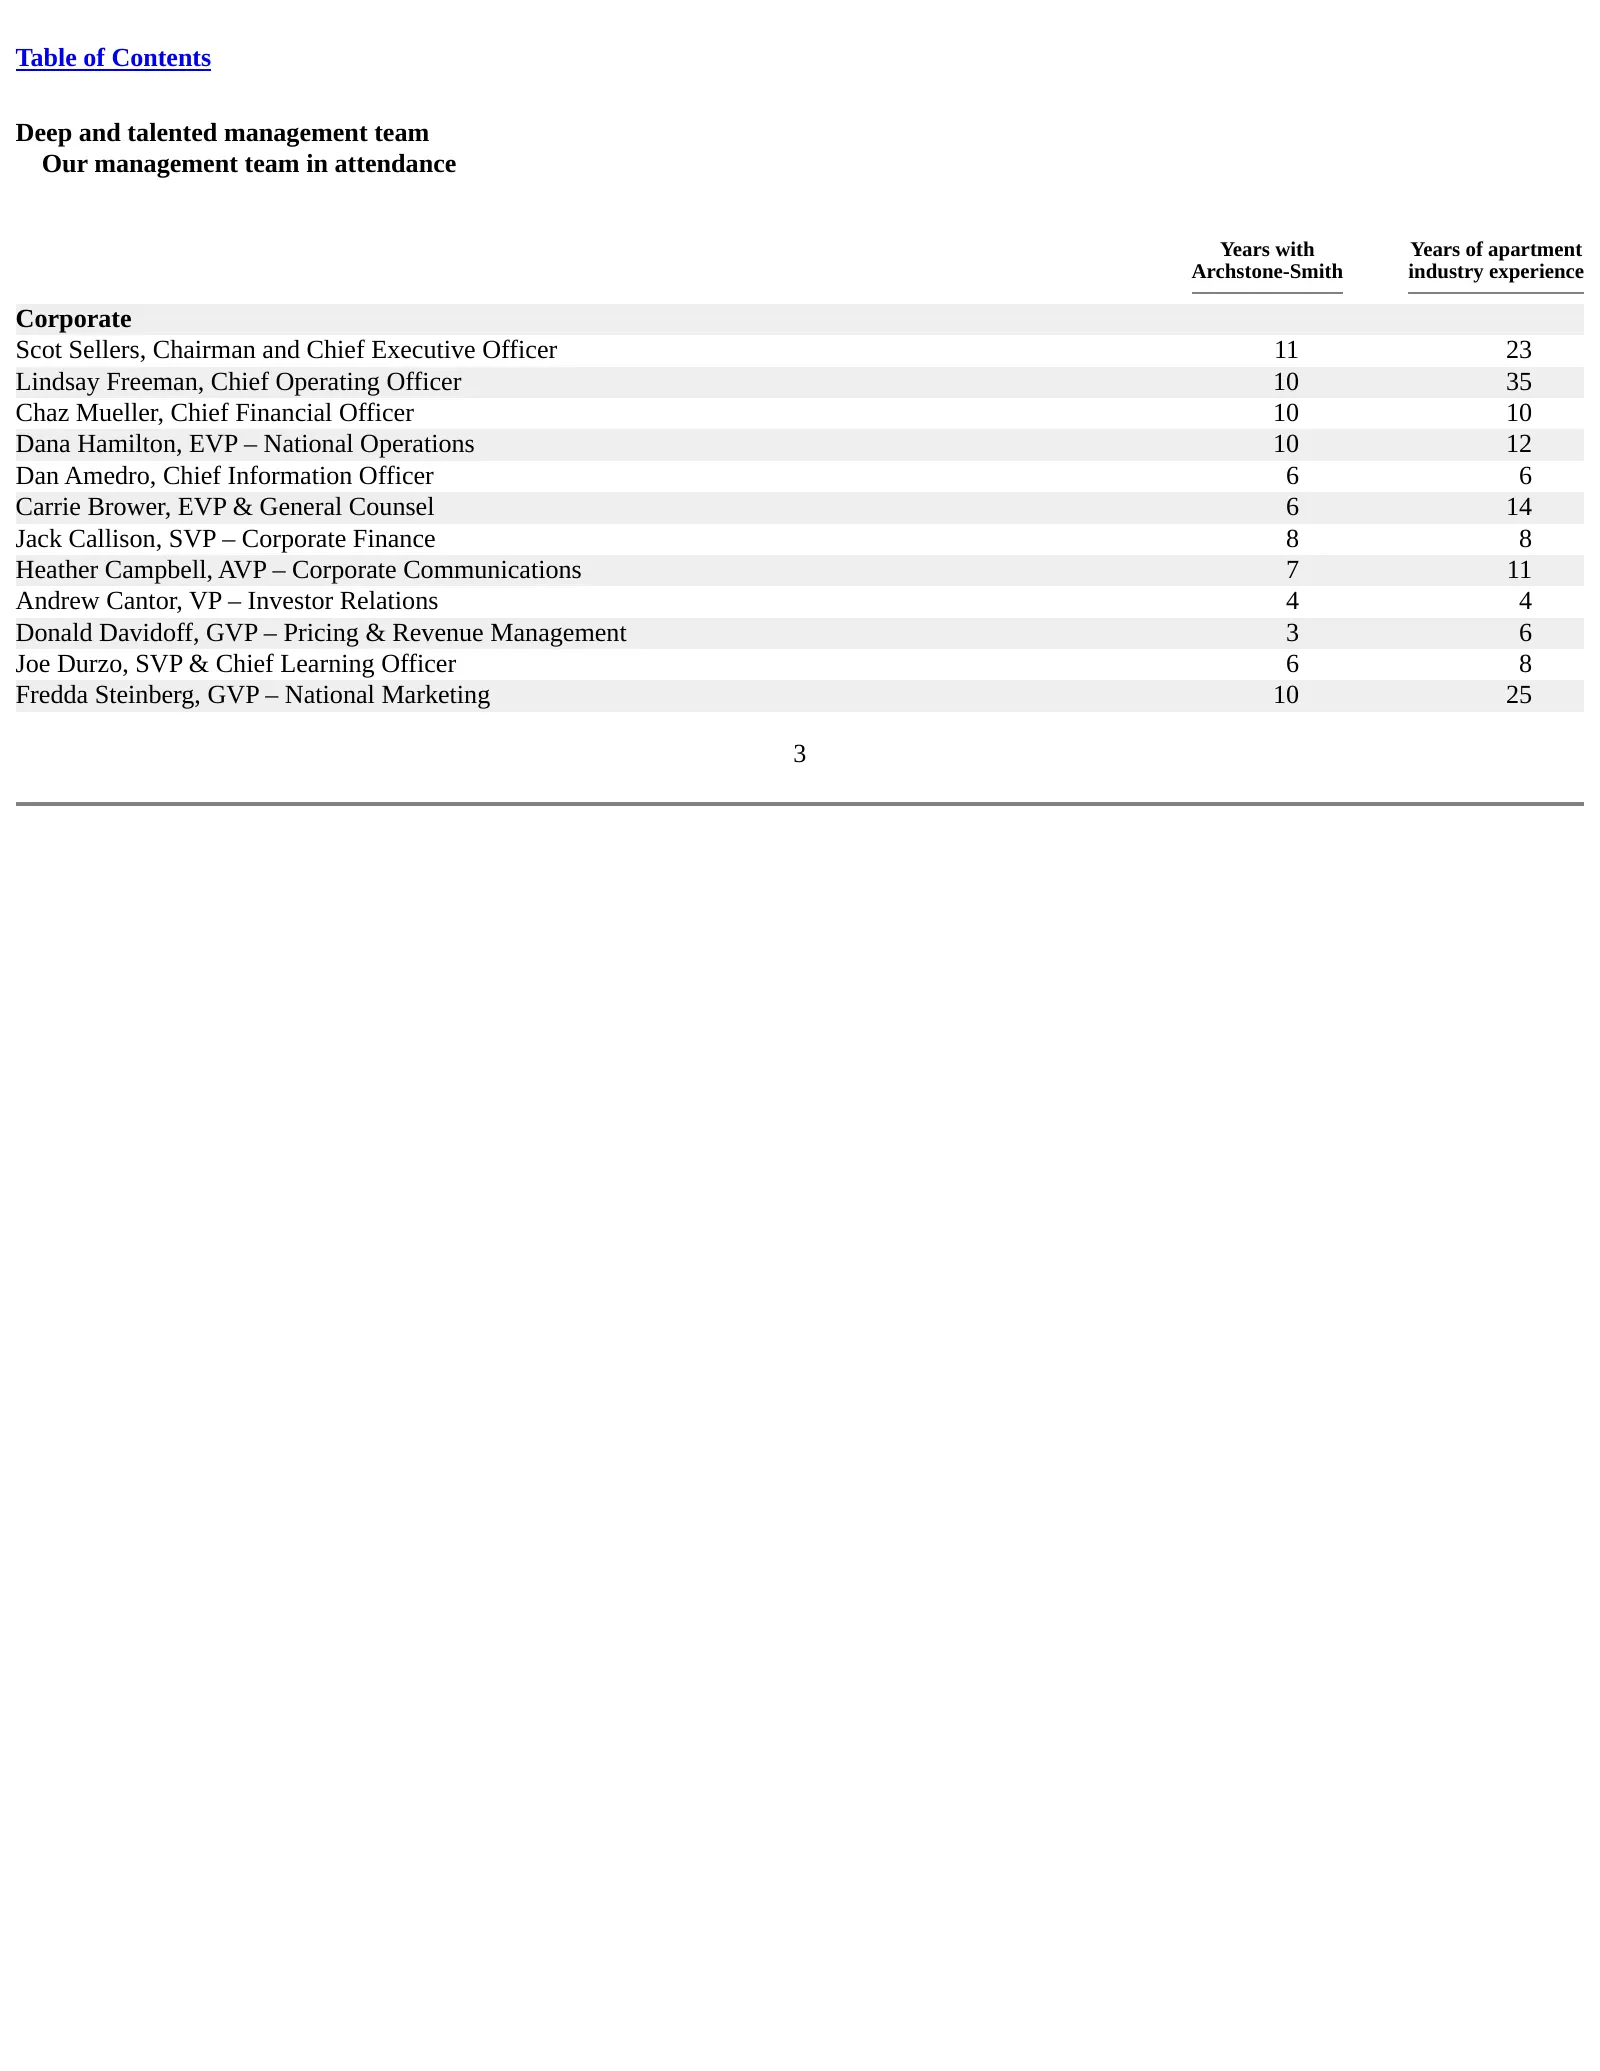
Table of Contents Deep and talented management team Our management team in attendance Years with Years of apartment Archstone-Smith industry experience Corporate Scot Sellers, Chairman and Chief Executive Officer 11 23 Lindsay Freeman, Chief Operating Officer 10 35 Chaz Mueller, Chief Financial Offi
Slide 4: Deep and talented management team
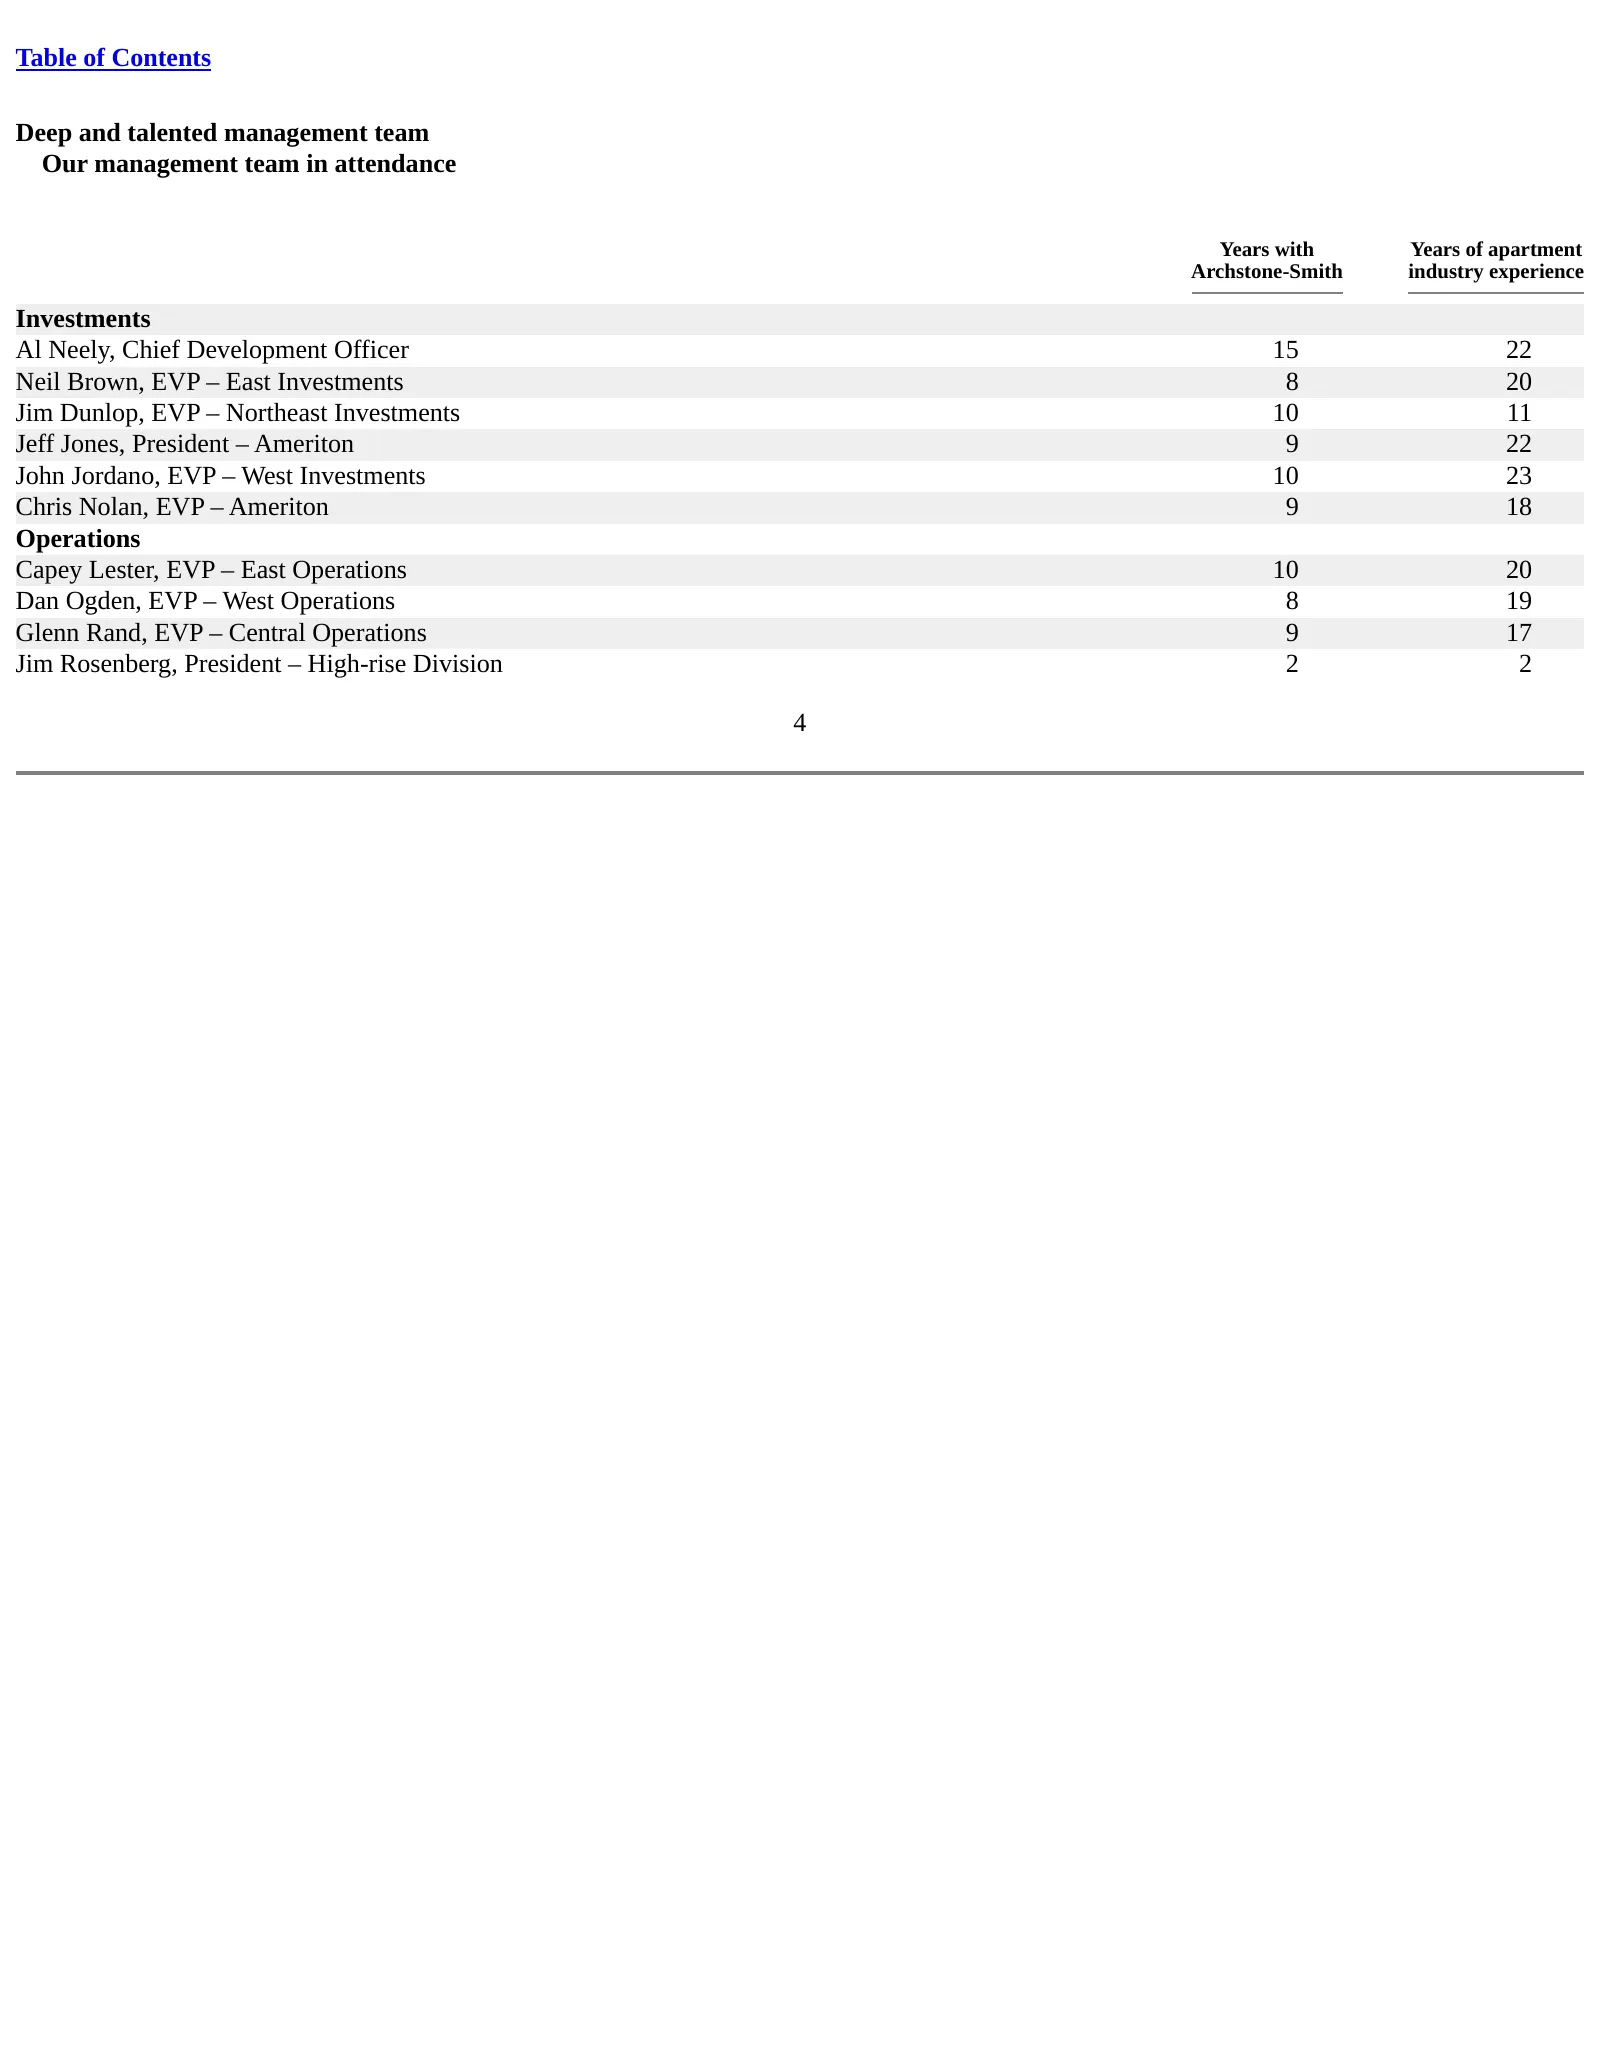
Table of Contents Deep and talented management team Our management team in attendance Years with Years of apartment Archstone-Smith industry experience Investments Al Neely, Chief Development Officer 15 22 Neil Brown, EVP – East Investments 8 20 Jim Dunlop, EVP – Northeast Investments 10 11 Jeff Jon

Slide 5: Our key messages for this conference
Table of Contents Our key messages for this conference • Unique value of our portfolio and platform - Potential special dividend(s) • Our operating franchise is a key competitive advantage • Opportunity for strong growth in 2005 • Deep and talented management team 5
Slide 6: A brief history of Archstone-Smith
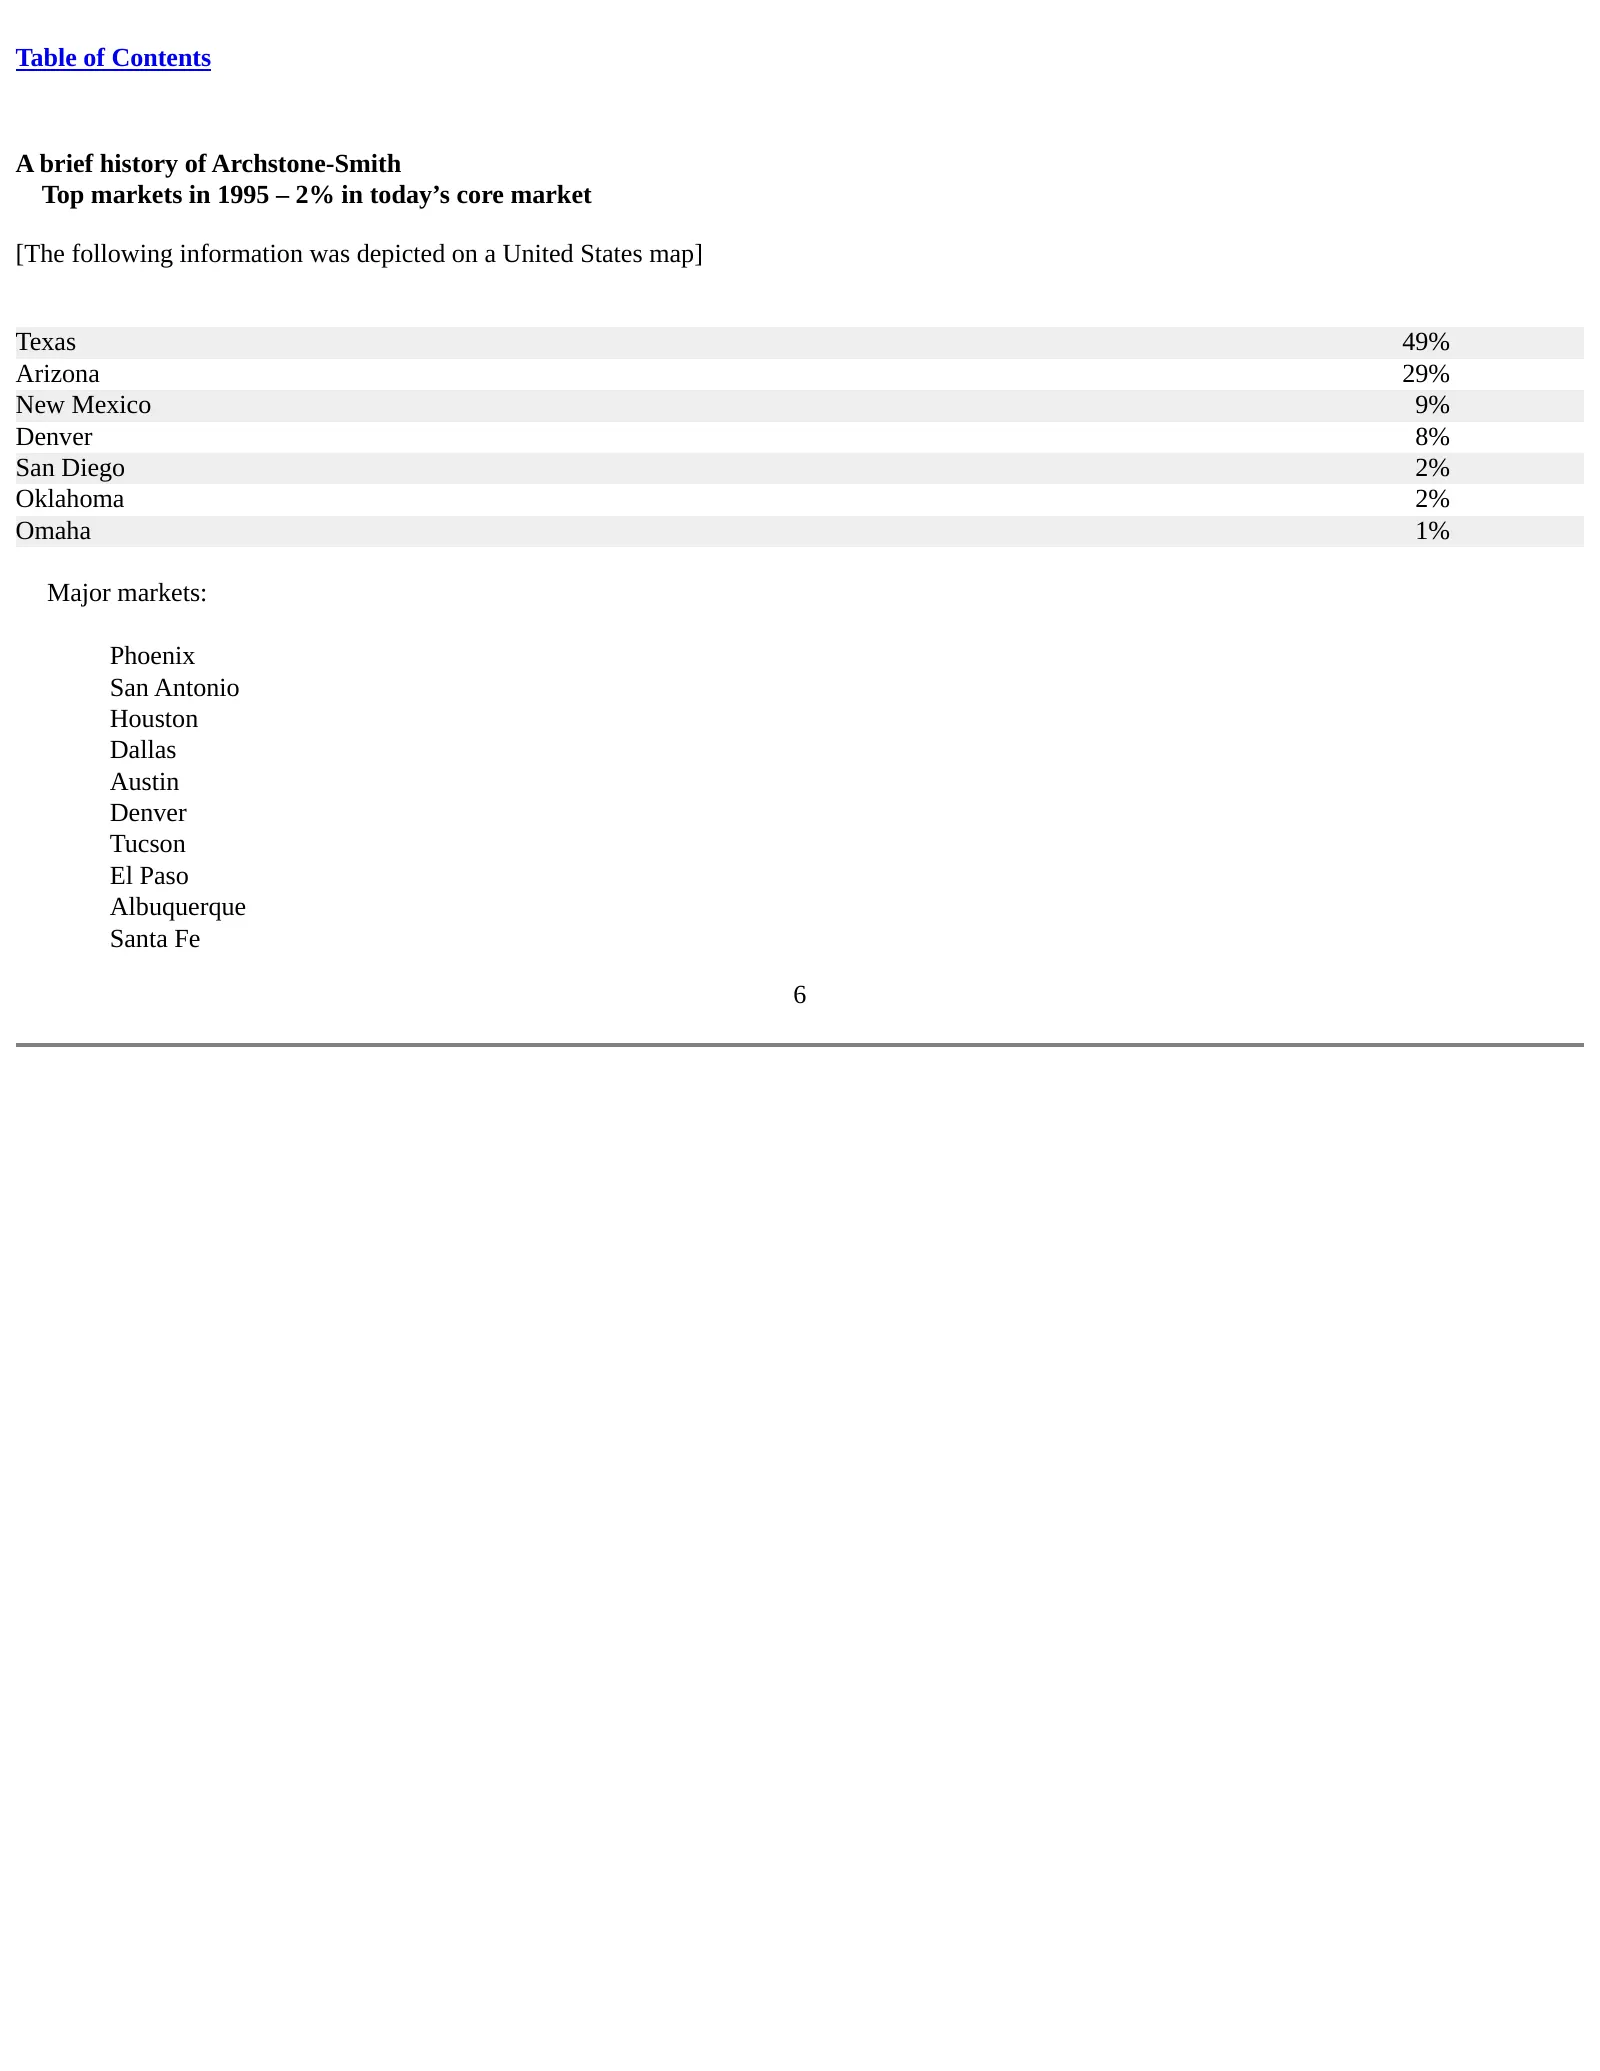
Table of Contents A brief history of Archstone-Smith Top markets in 1995 – 2% in today’s core market [The following information was depicted on a United States map] Texas 49% Arizona 29% New Mexico 9% Denver 8% San Diego 2% Oklahoma 2% Omaha 1% Major markets: Phoenix San Antonio Houston Dallas Austi
Slide 7: A brief history of Archstone-Smith: assets in 1995
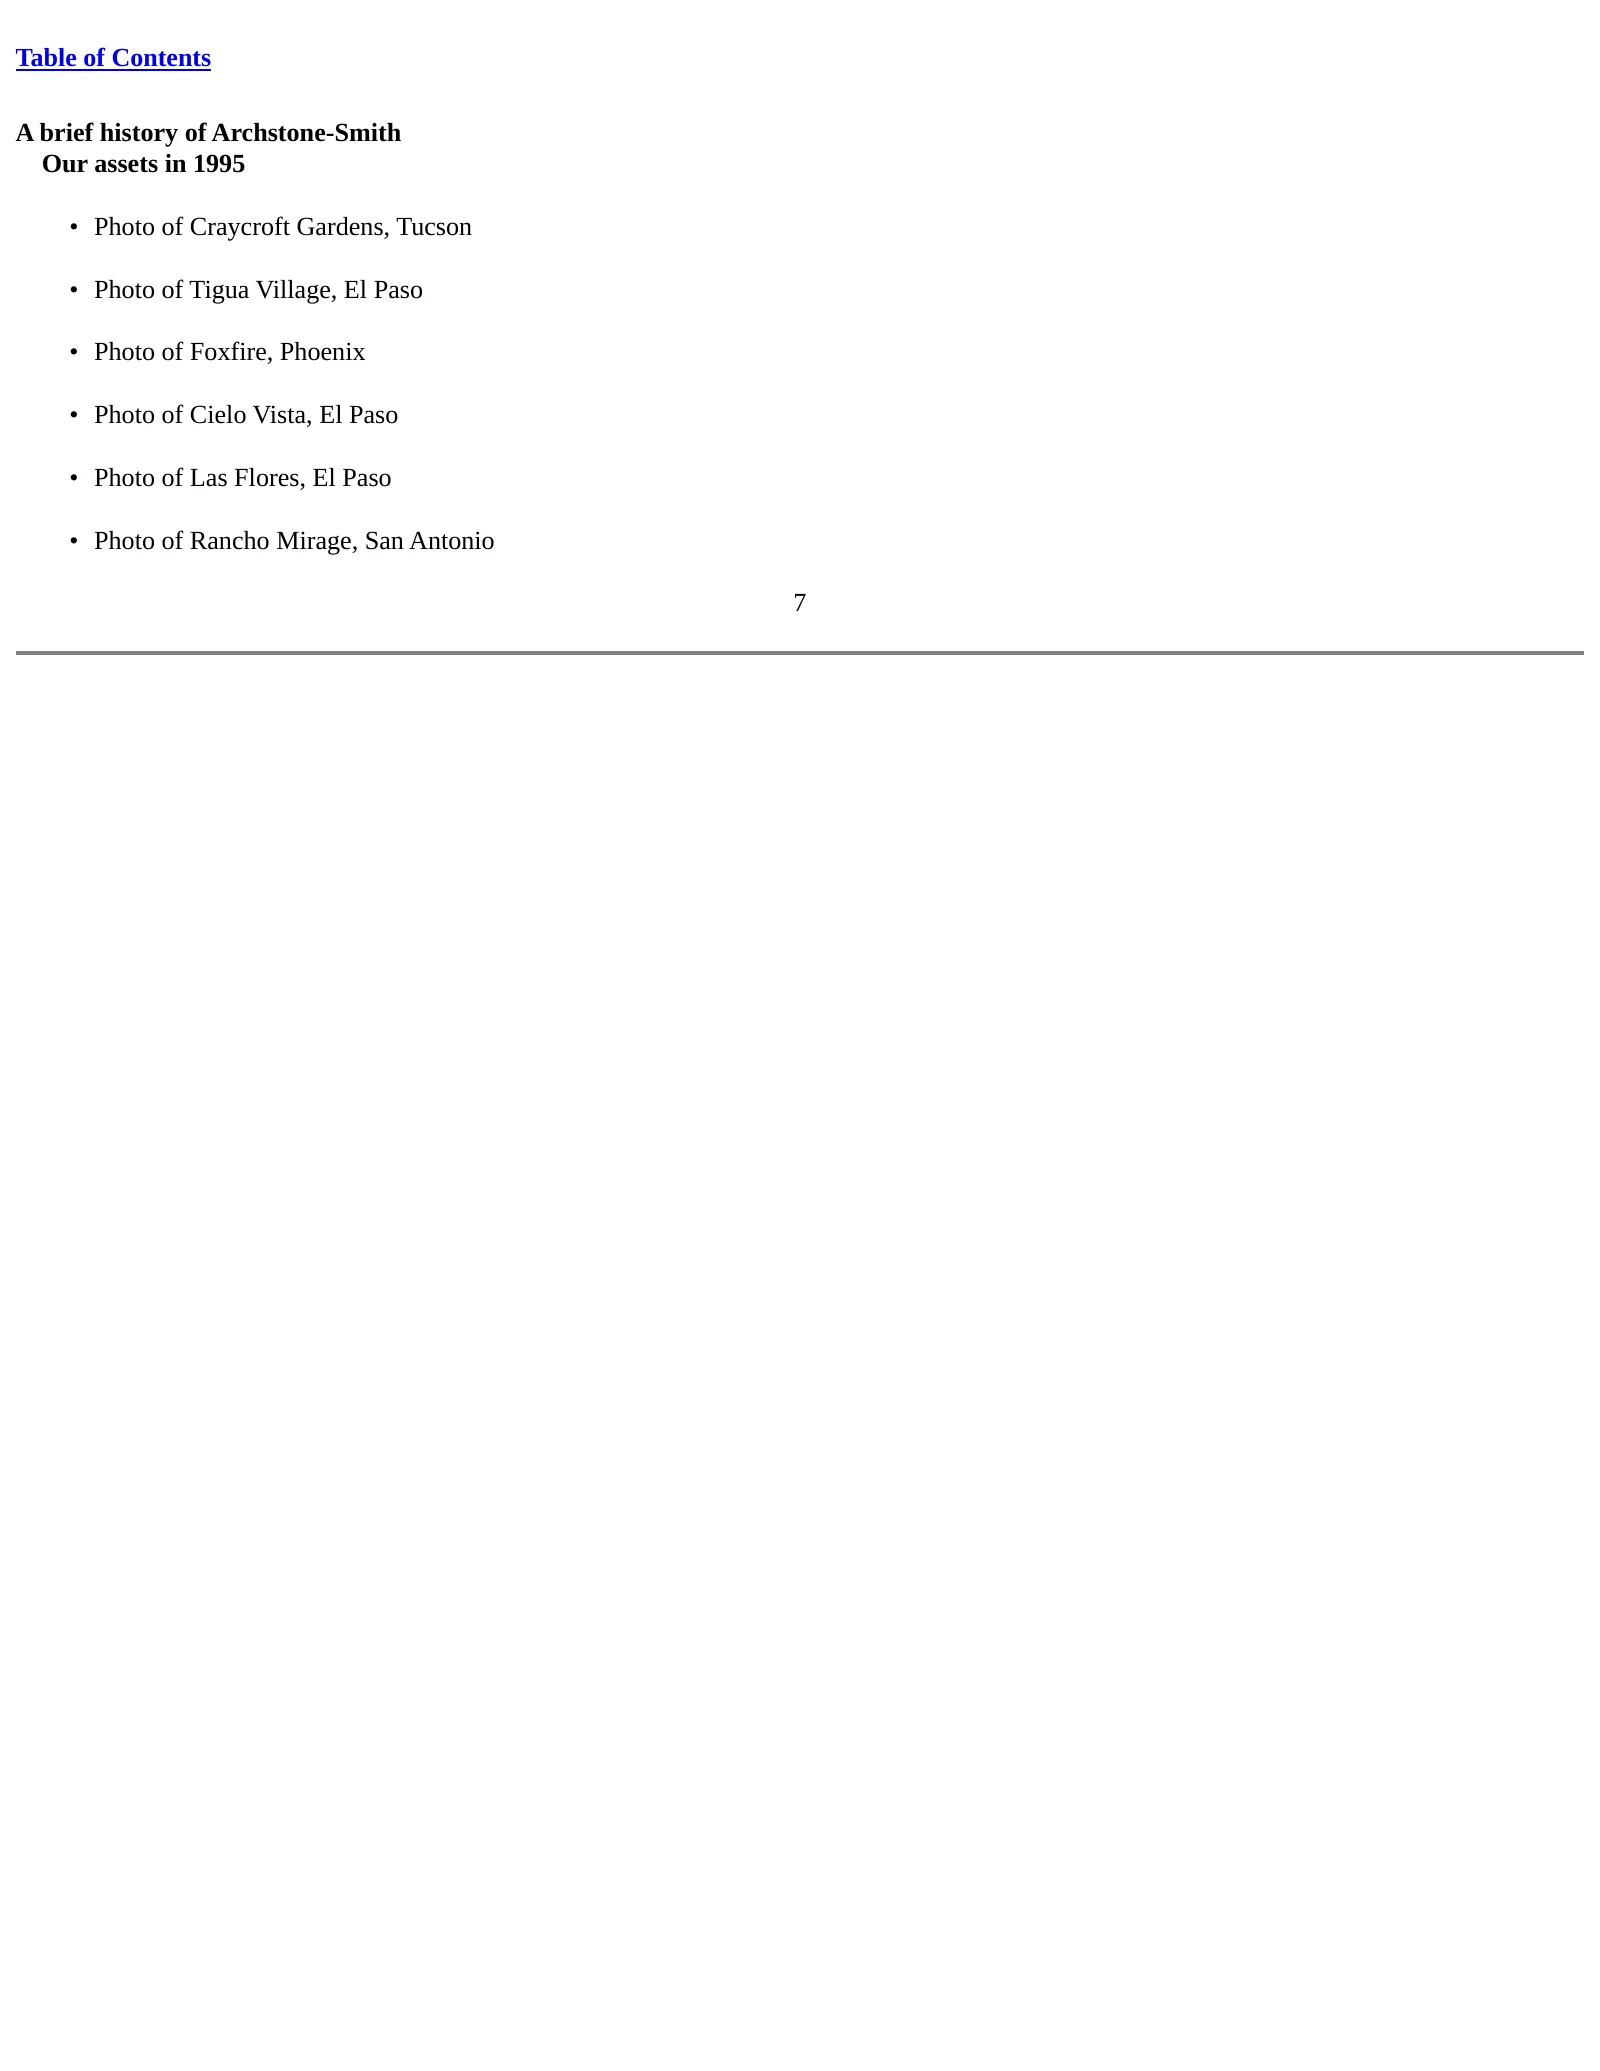
Table of Contents A brief history of Archstone-Smith Our assets in 1995 • Photo of Craycroft Gardens, Tucson • Photo of Tigua Village, El Paso • Photo of Foxfire, Phoenix • Photo of Cielo Vista, El Paso • Photo of Las Flores, El Paso • Photo of Rancho Mirage, San Antonio 7
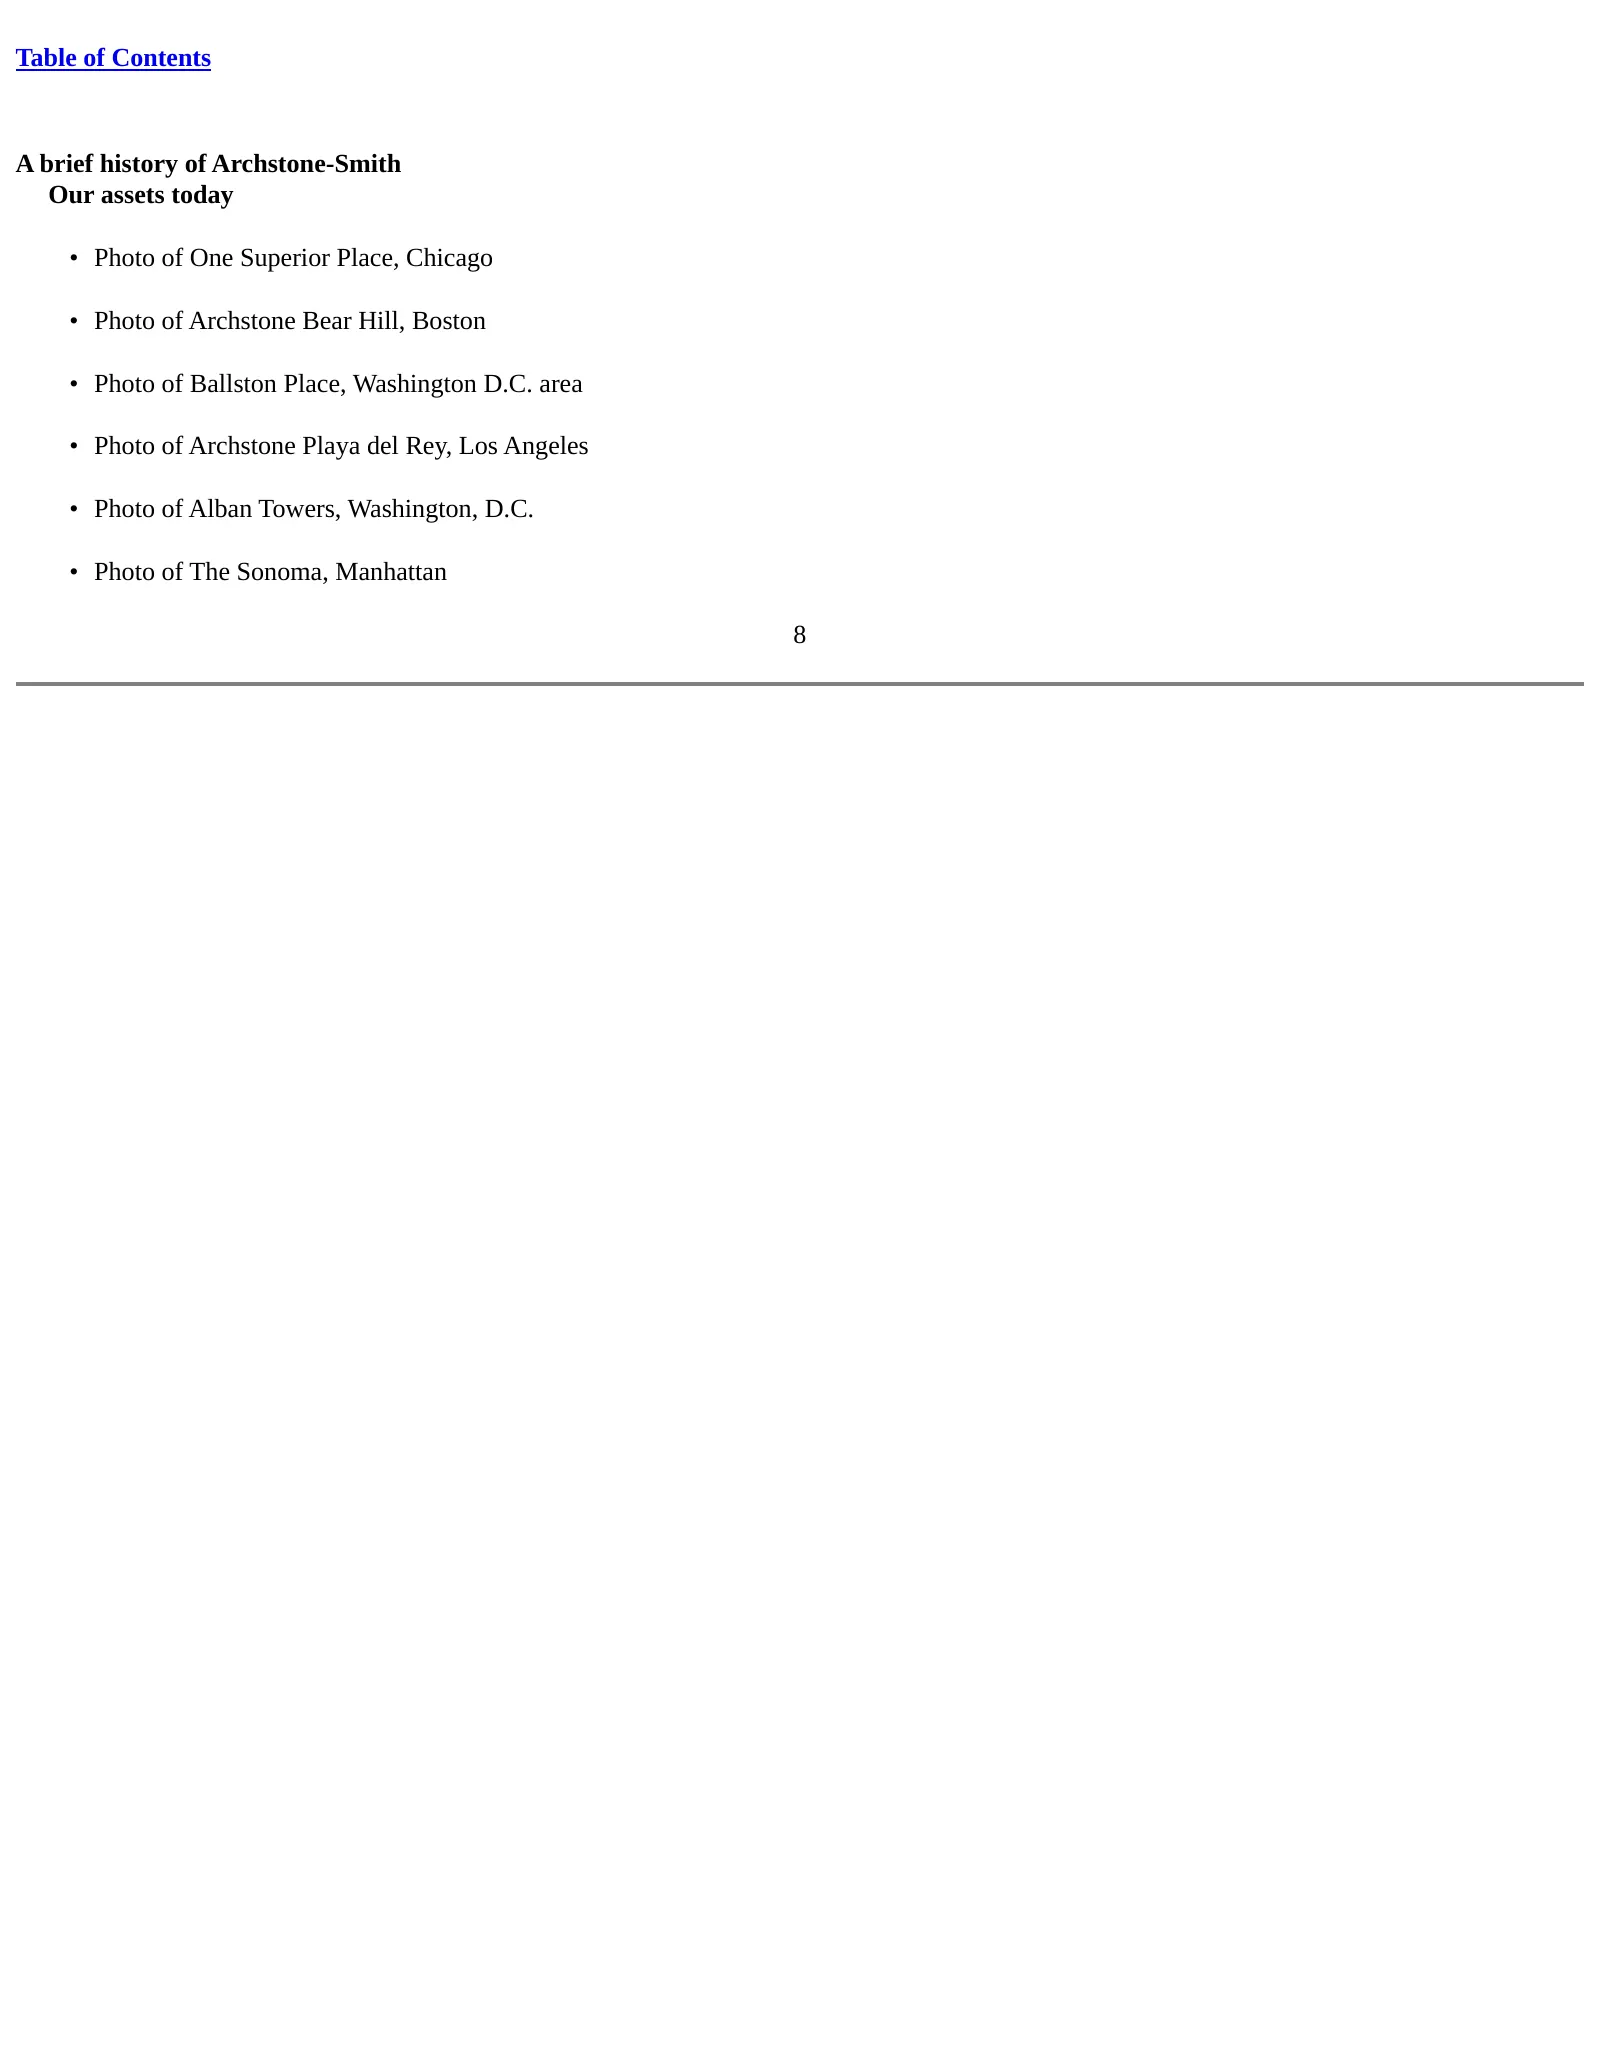
Slide 8: A brief history of Archstone-Smith: assets today
Table of Contents A brief history of Archstone-Smith Our assets today • Photo of One Superior Place, Chicago • Photo of Archstone Bear Hill, Boston • Photo of Ballston Place, Washington D.C. area • Photo of Archstone Playa del Rey, Los Angeles • Photo of Alban Towers, Washington, D.C. • Photo of The
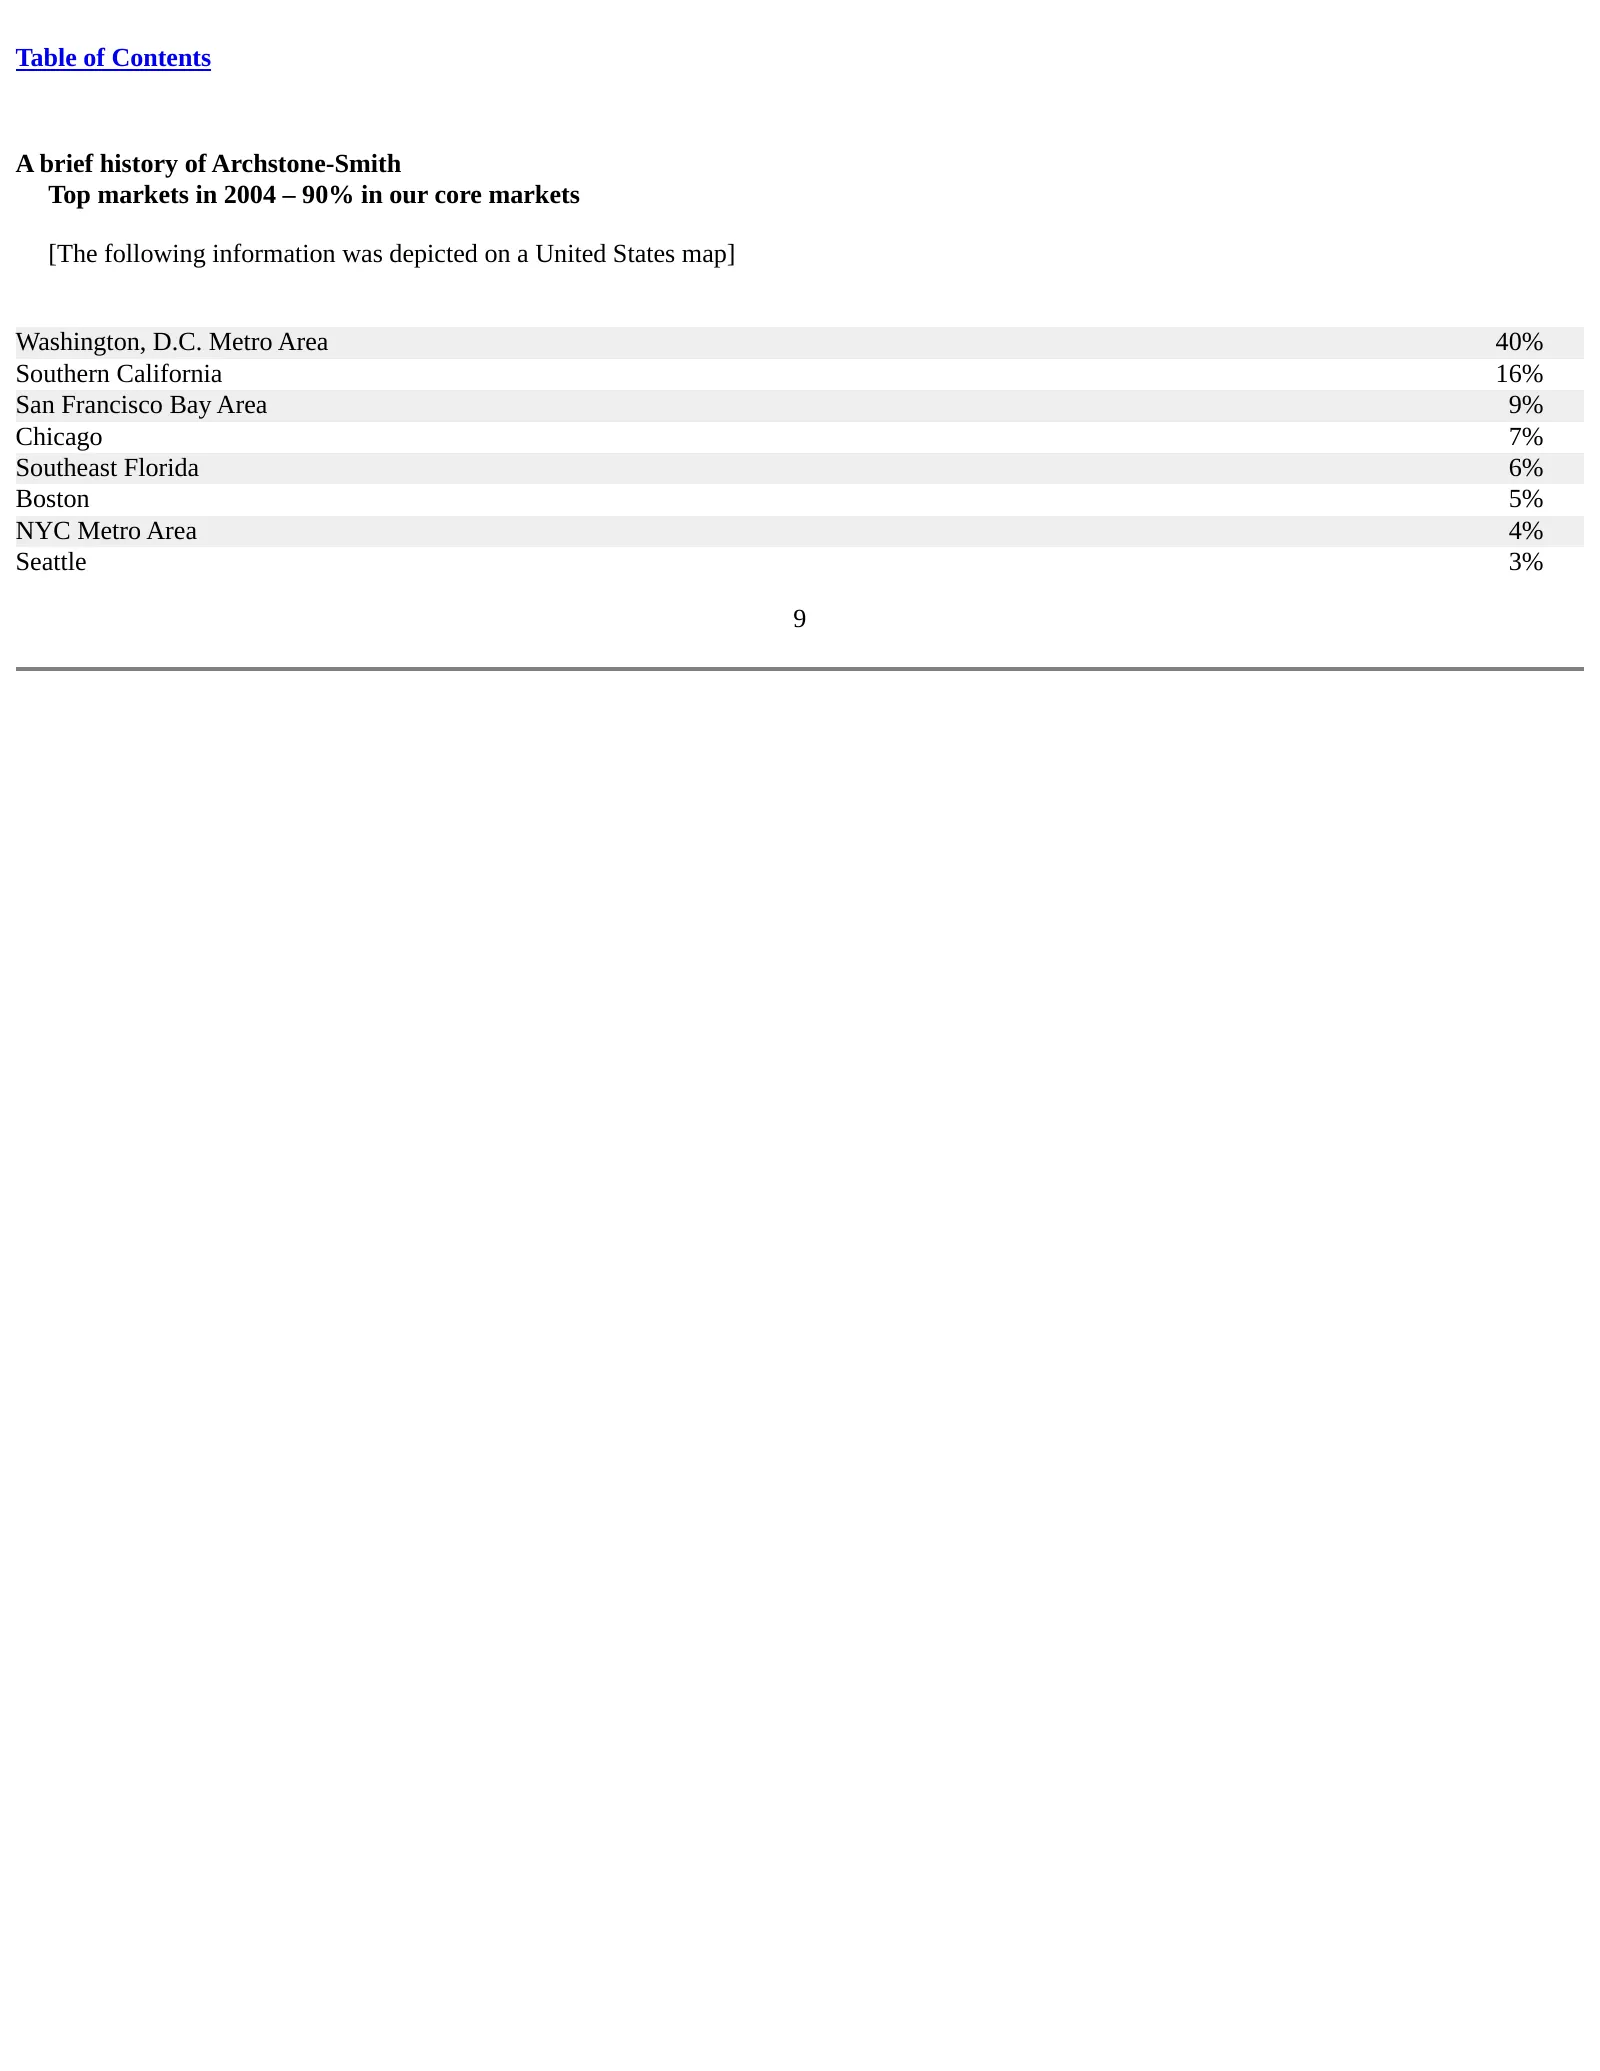
Slide 9: A brief history of Archstone-Smith: top markets in 2004
Table of Contents A brief history of Archstone-Smith Top markets in 2004 – 90% in our core markets [The following information was depicted on a United States map] Washington, D.C. Metro Area 40% Southern California 16% San Francisco Bay Area 9% Chicago 7% Southeast Florida 6% Boston 5% NYC Metro Are
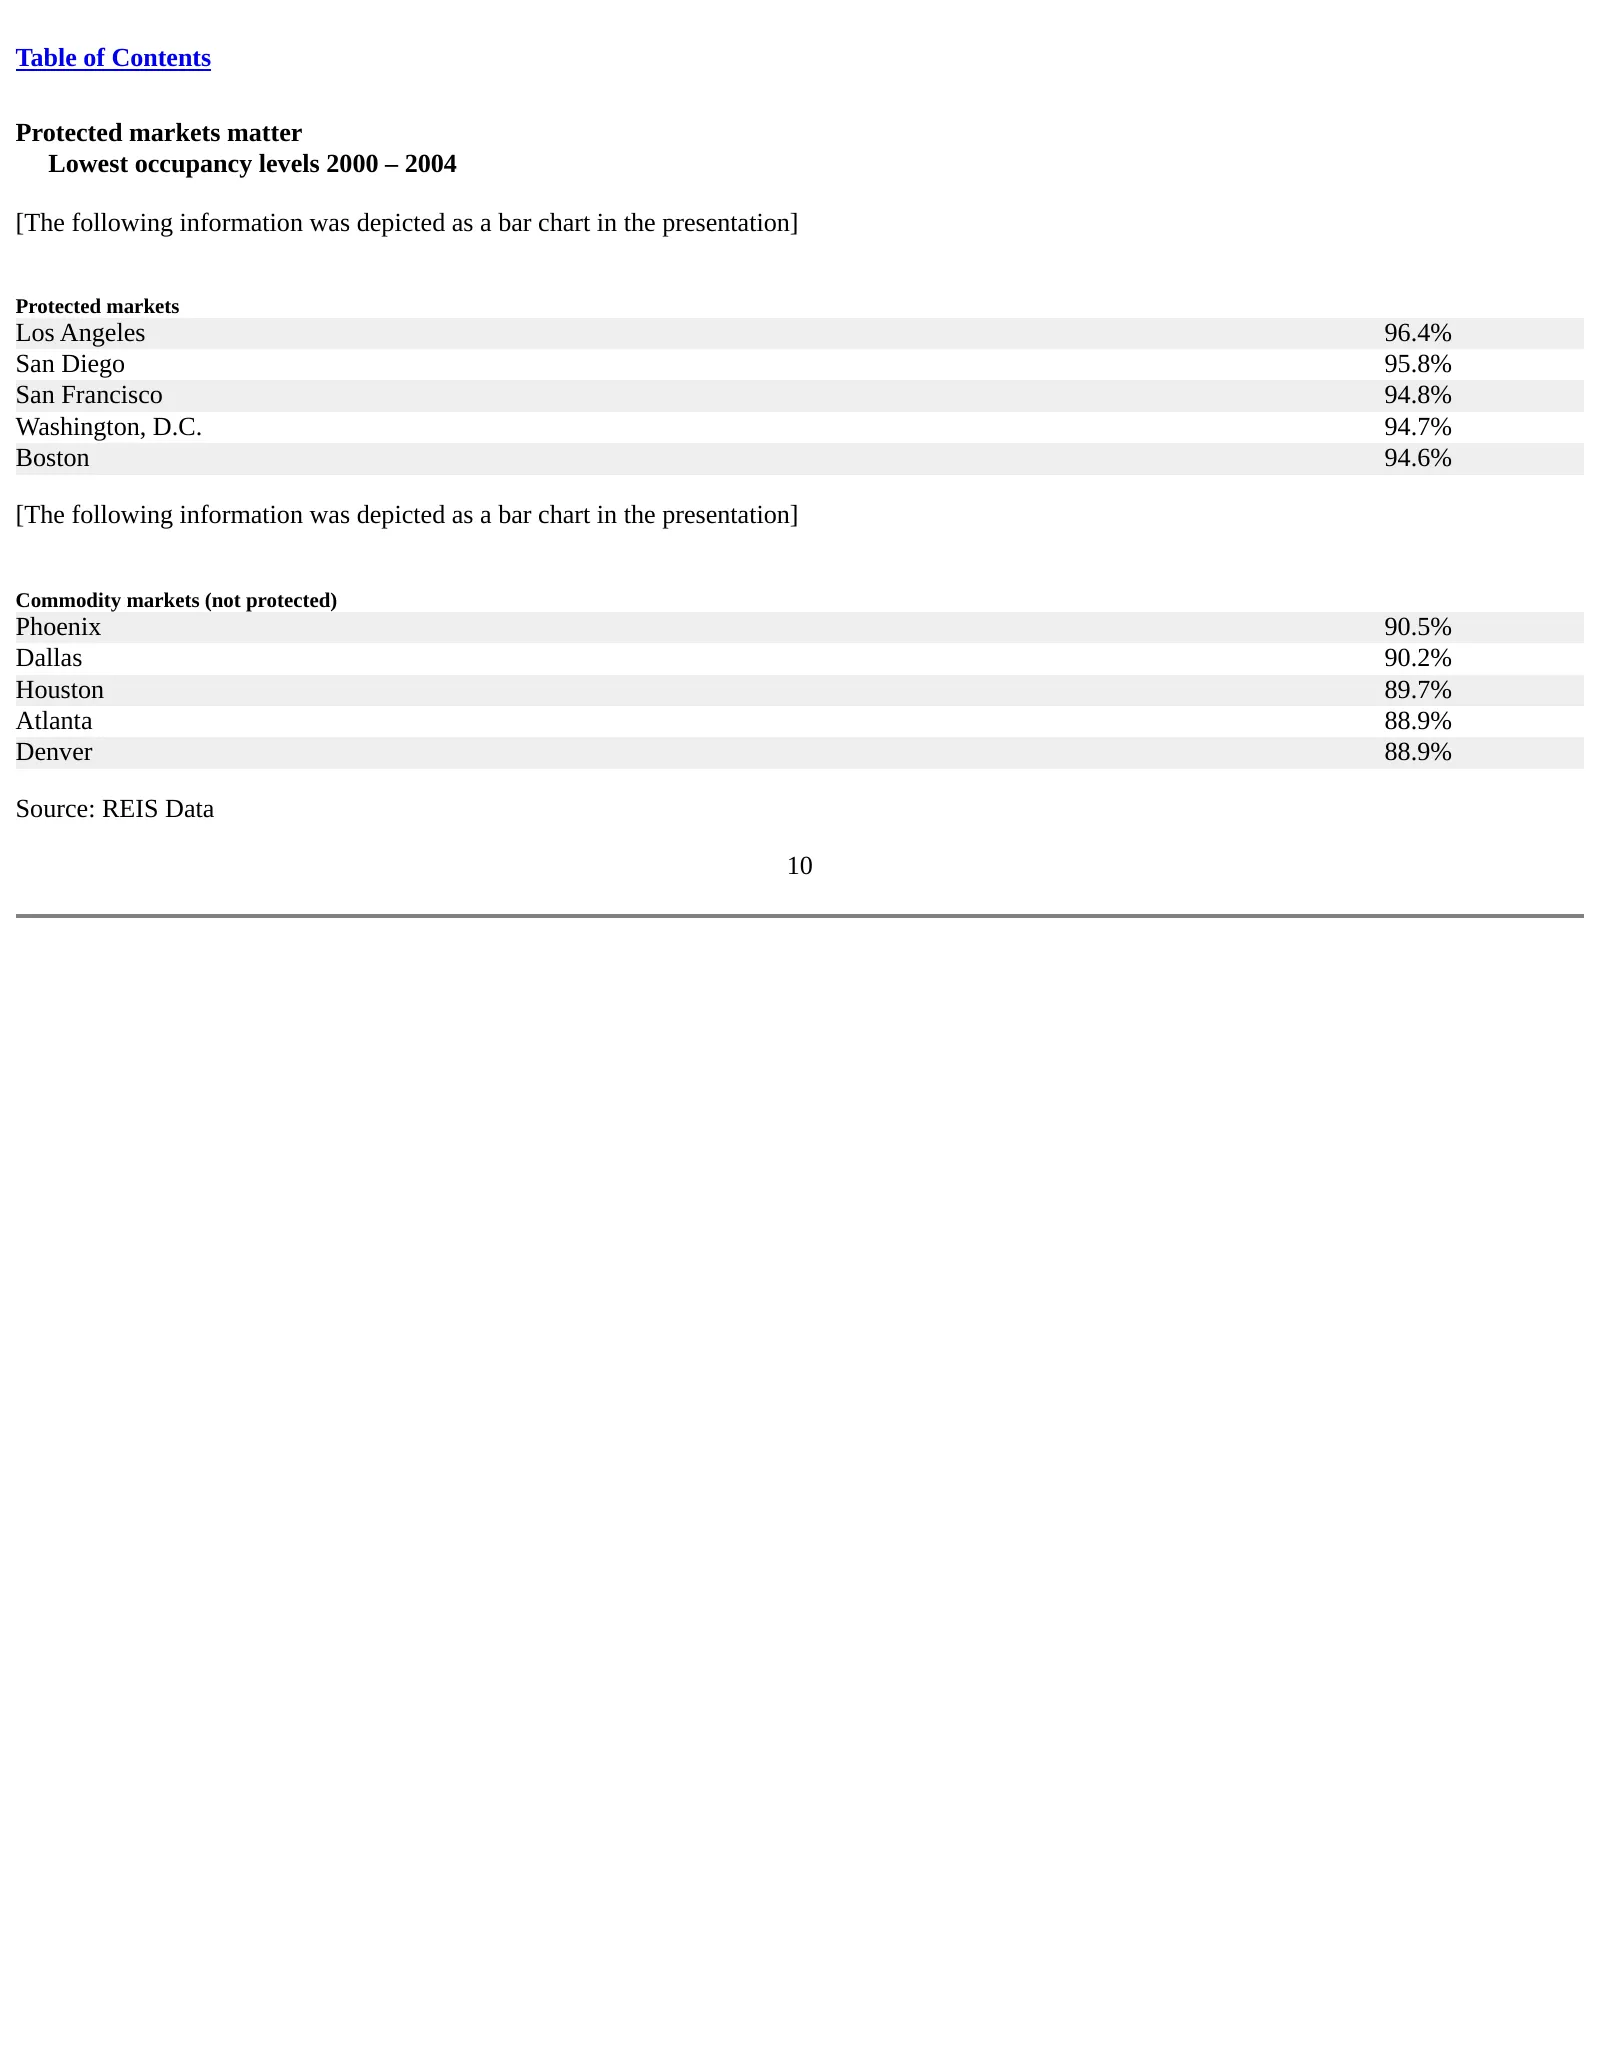
Slide 10: Protected markets matter
Table of Contents Protected markets matter Lowest occupancy levels 2000 – 2004 [The following information was depicted as a bar chart in the presentation] Protected markets Los Angeles 96.4% San Diego 95.8% San Francisco 94.8% Washington, D.C. 94.7% Boston 94.6% [The following information was depict
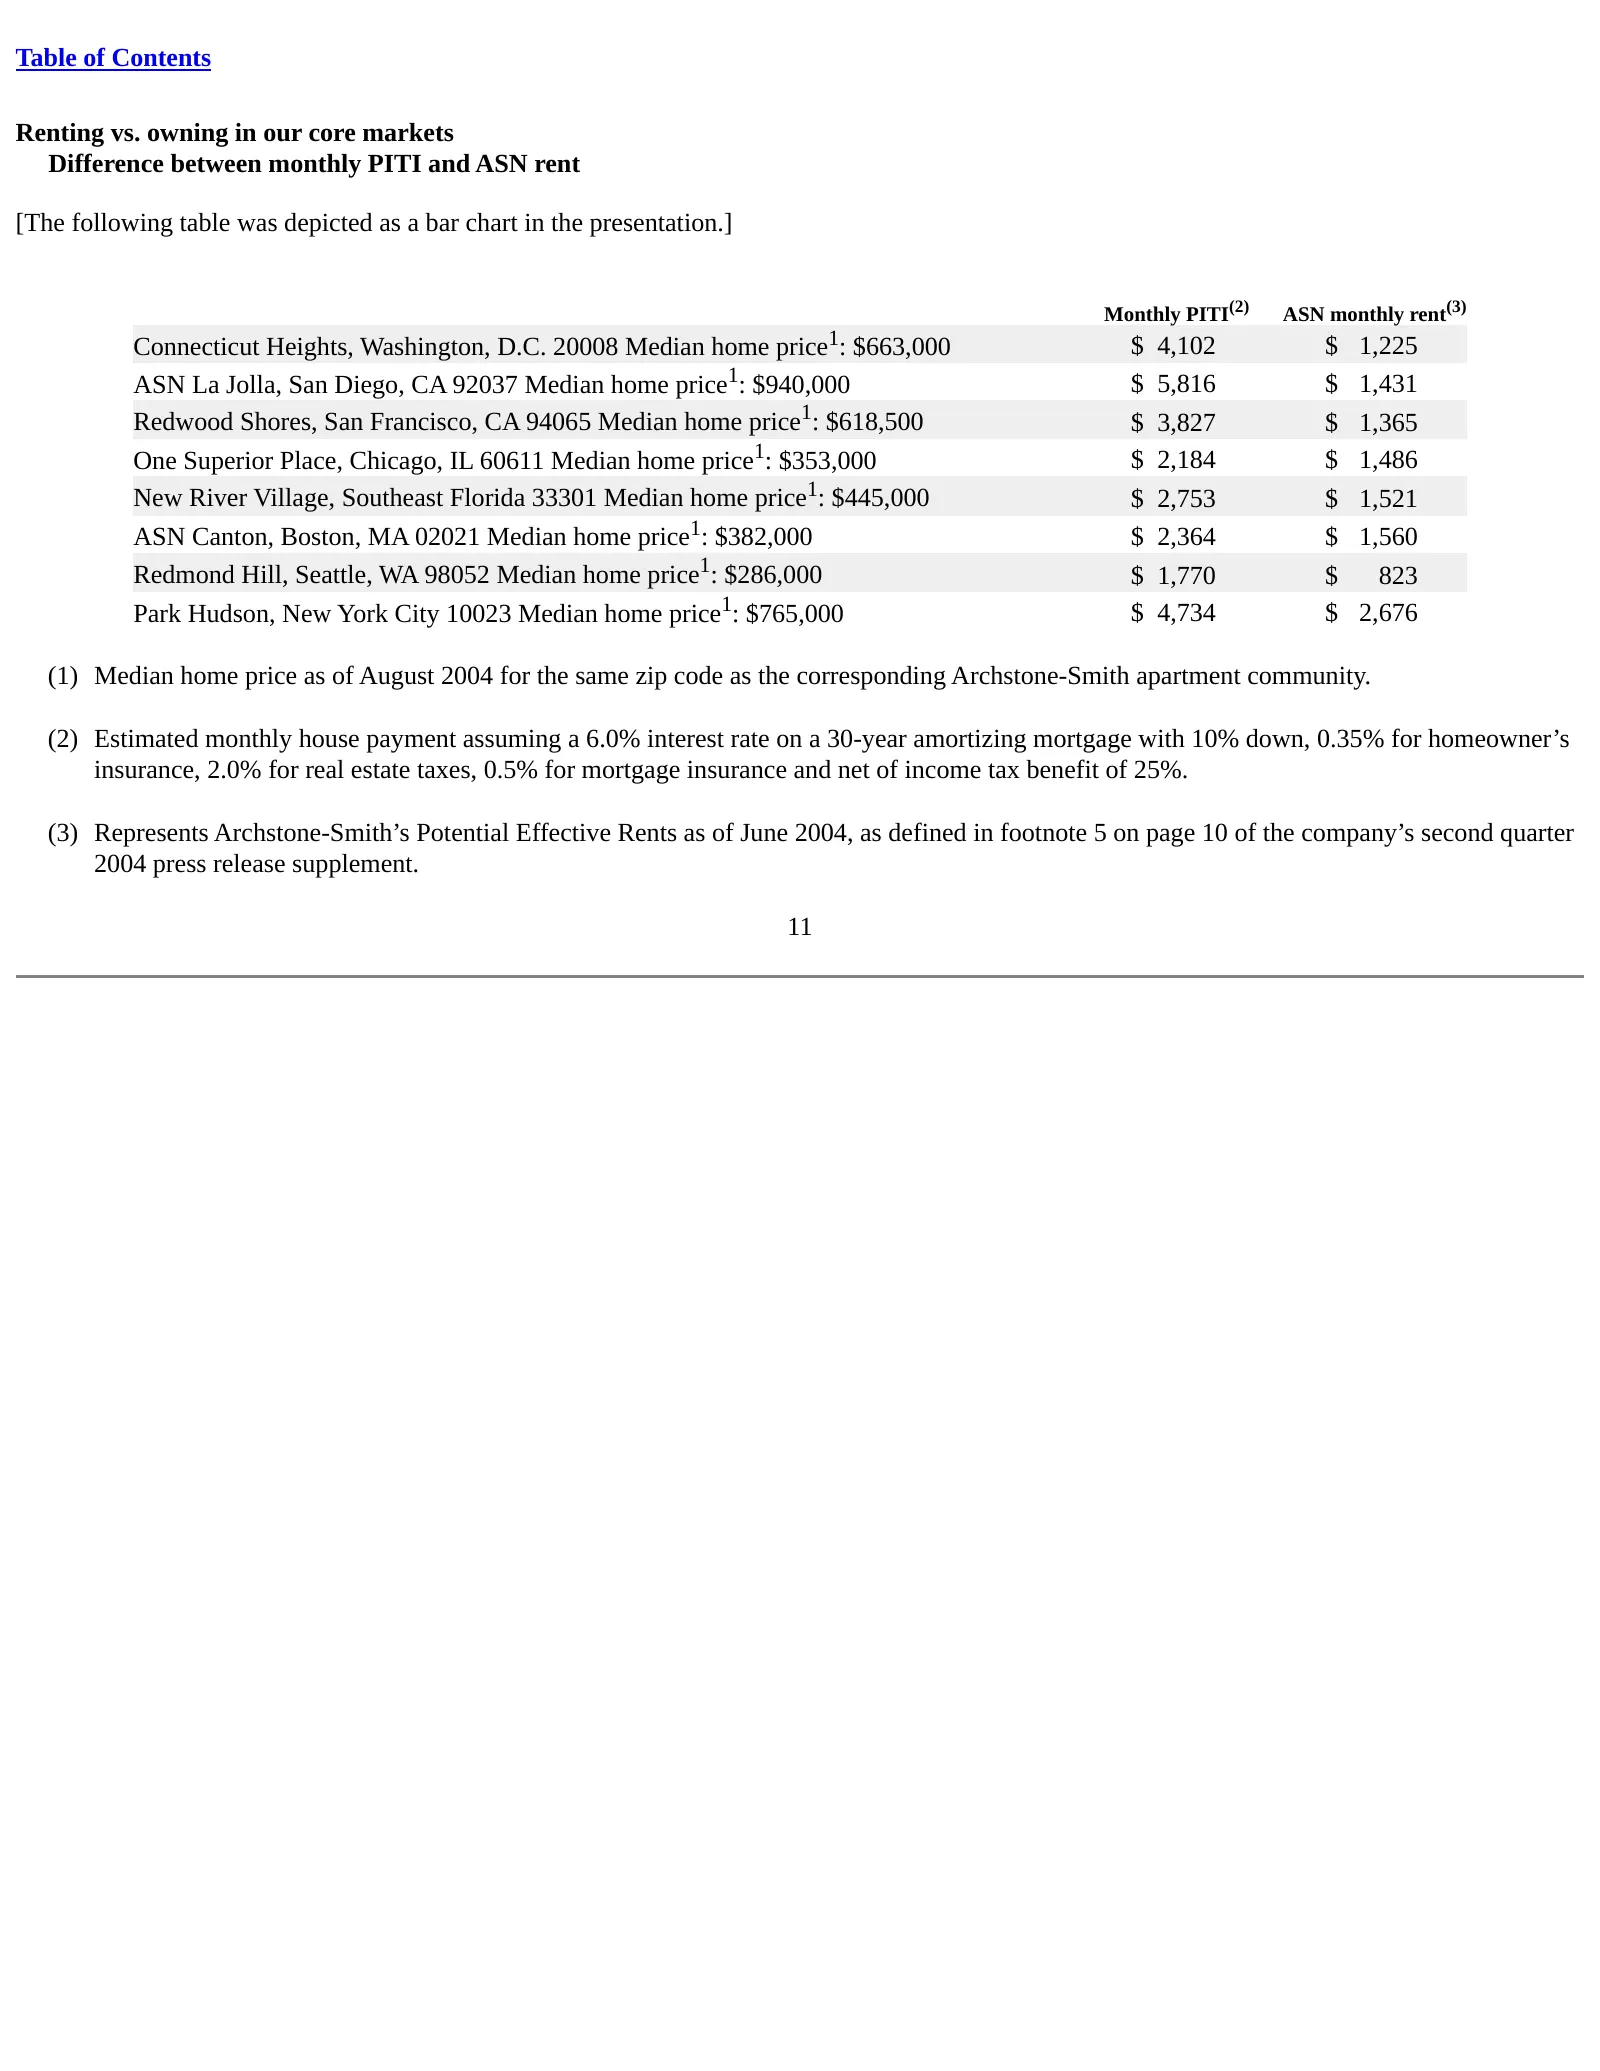
Slide 11: Renting vs. owning in our core markets
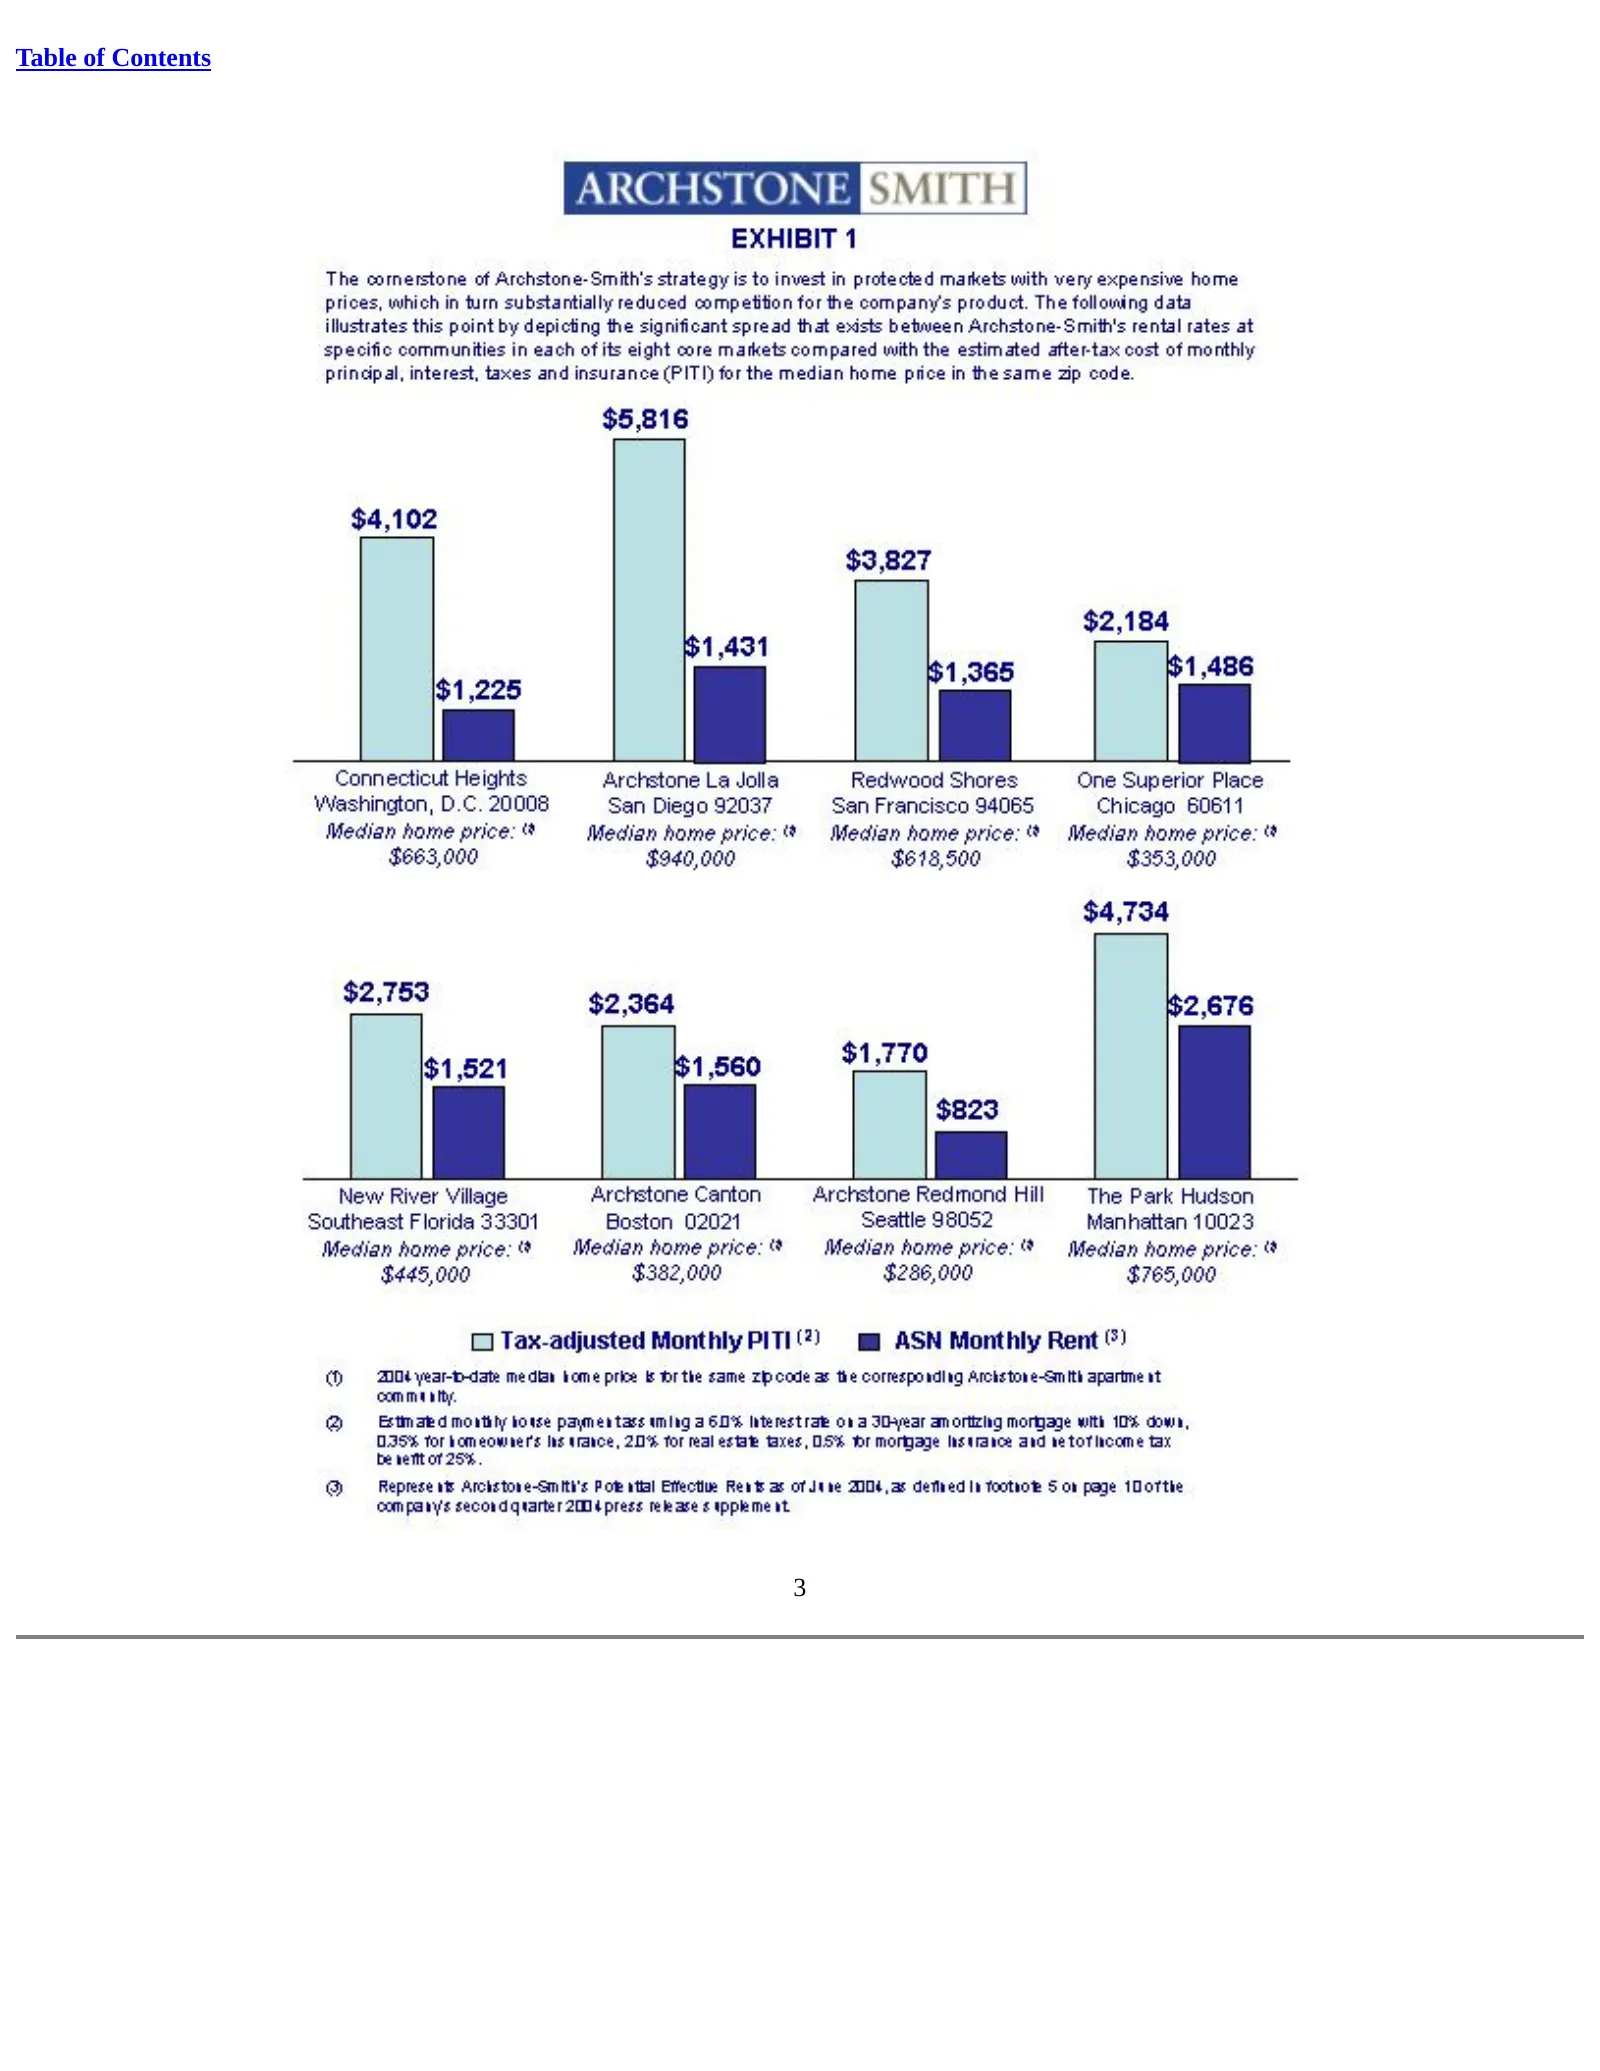
Table of Contents Renting vs. owning in our core markets Difference between monthly PITI and ASN rent [The following table was depicted as a bar chart in the presentation.] Monthly PITI(2) ASN monthly rent(3) Connecticut Heights, Washington, D.C. 20008 Median home price1: $663,000 $ 4,102 $ 1,225 AS
Slide 12: IRR matters!
Table of Contents IRR matters! We make money on our real estate investments • $6.2 billion of sales since 1996 • 12.5% average unleveraged internal rate of return (IRR) • $983 million in GAAP gains • $821 million in gross gains1 And these are not our best assets! • If others won’t disclose it, there

Slide 13: Demonstrating embedded value
Table of Contents Demonstrating embedded value • We have identified over $4.5 billion of our assets that management believes would currently sell at a 4.5% capitalization rate – or lower Photos of: The Sonoma, Manhattan; Lofts 590, Washington D.C.; Archstone Torrey Hills, San Diego; Archstone Hoboke
Slide 14: Condo-conversion opportunity – potential special dividend
Table of Contents Demonstrating embedded value Condo-conversion opportunity – potential special dividend1 • Approximately $500 million of anticipated non-core asset sales • $200 - $300 million of expected tax gains • Approximately $1.00 per share potential special dividend • No planned reduction to
Slide 15: Condo conversion opportunity: Archstone The Crossing
Table of Contents Condo conversion opportunity Archstone The Crossing – Inland Empire Map of Inland Empire showing all the locations of ASN communities owned plotted with Archstone The Crossing highlighted. Photo of Archstone The Crossing • Non-core asset in a core market • $18 million gross book ba
Slide 16: Condo conversion opportunity: Archstone Escondido
Table of Contents Condo conversion opportunity Archstone Escondido – San Diego Map of San Diego showing the locations of all ASN communities owned with Archstone Escondido highlighted. Photo of Archstone Escondido • Non-core asset in a core market • $17 million gross book basis • $51 million - $58 m
Slide 17: Ameriton creates significant value for our company
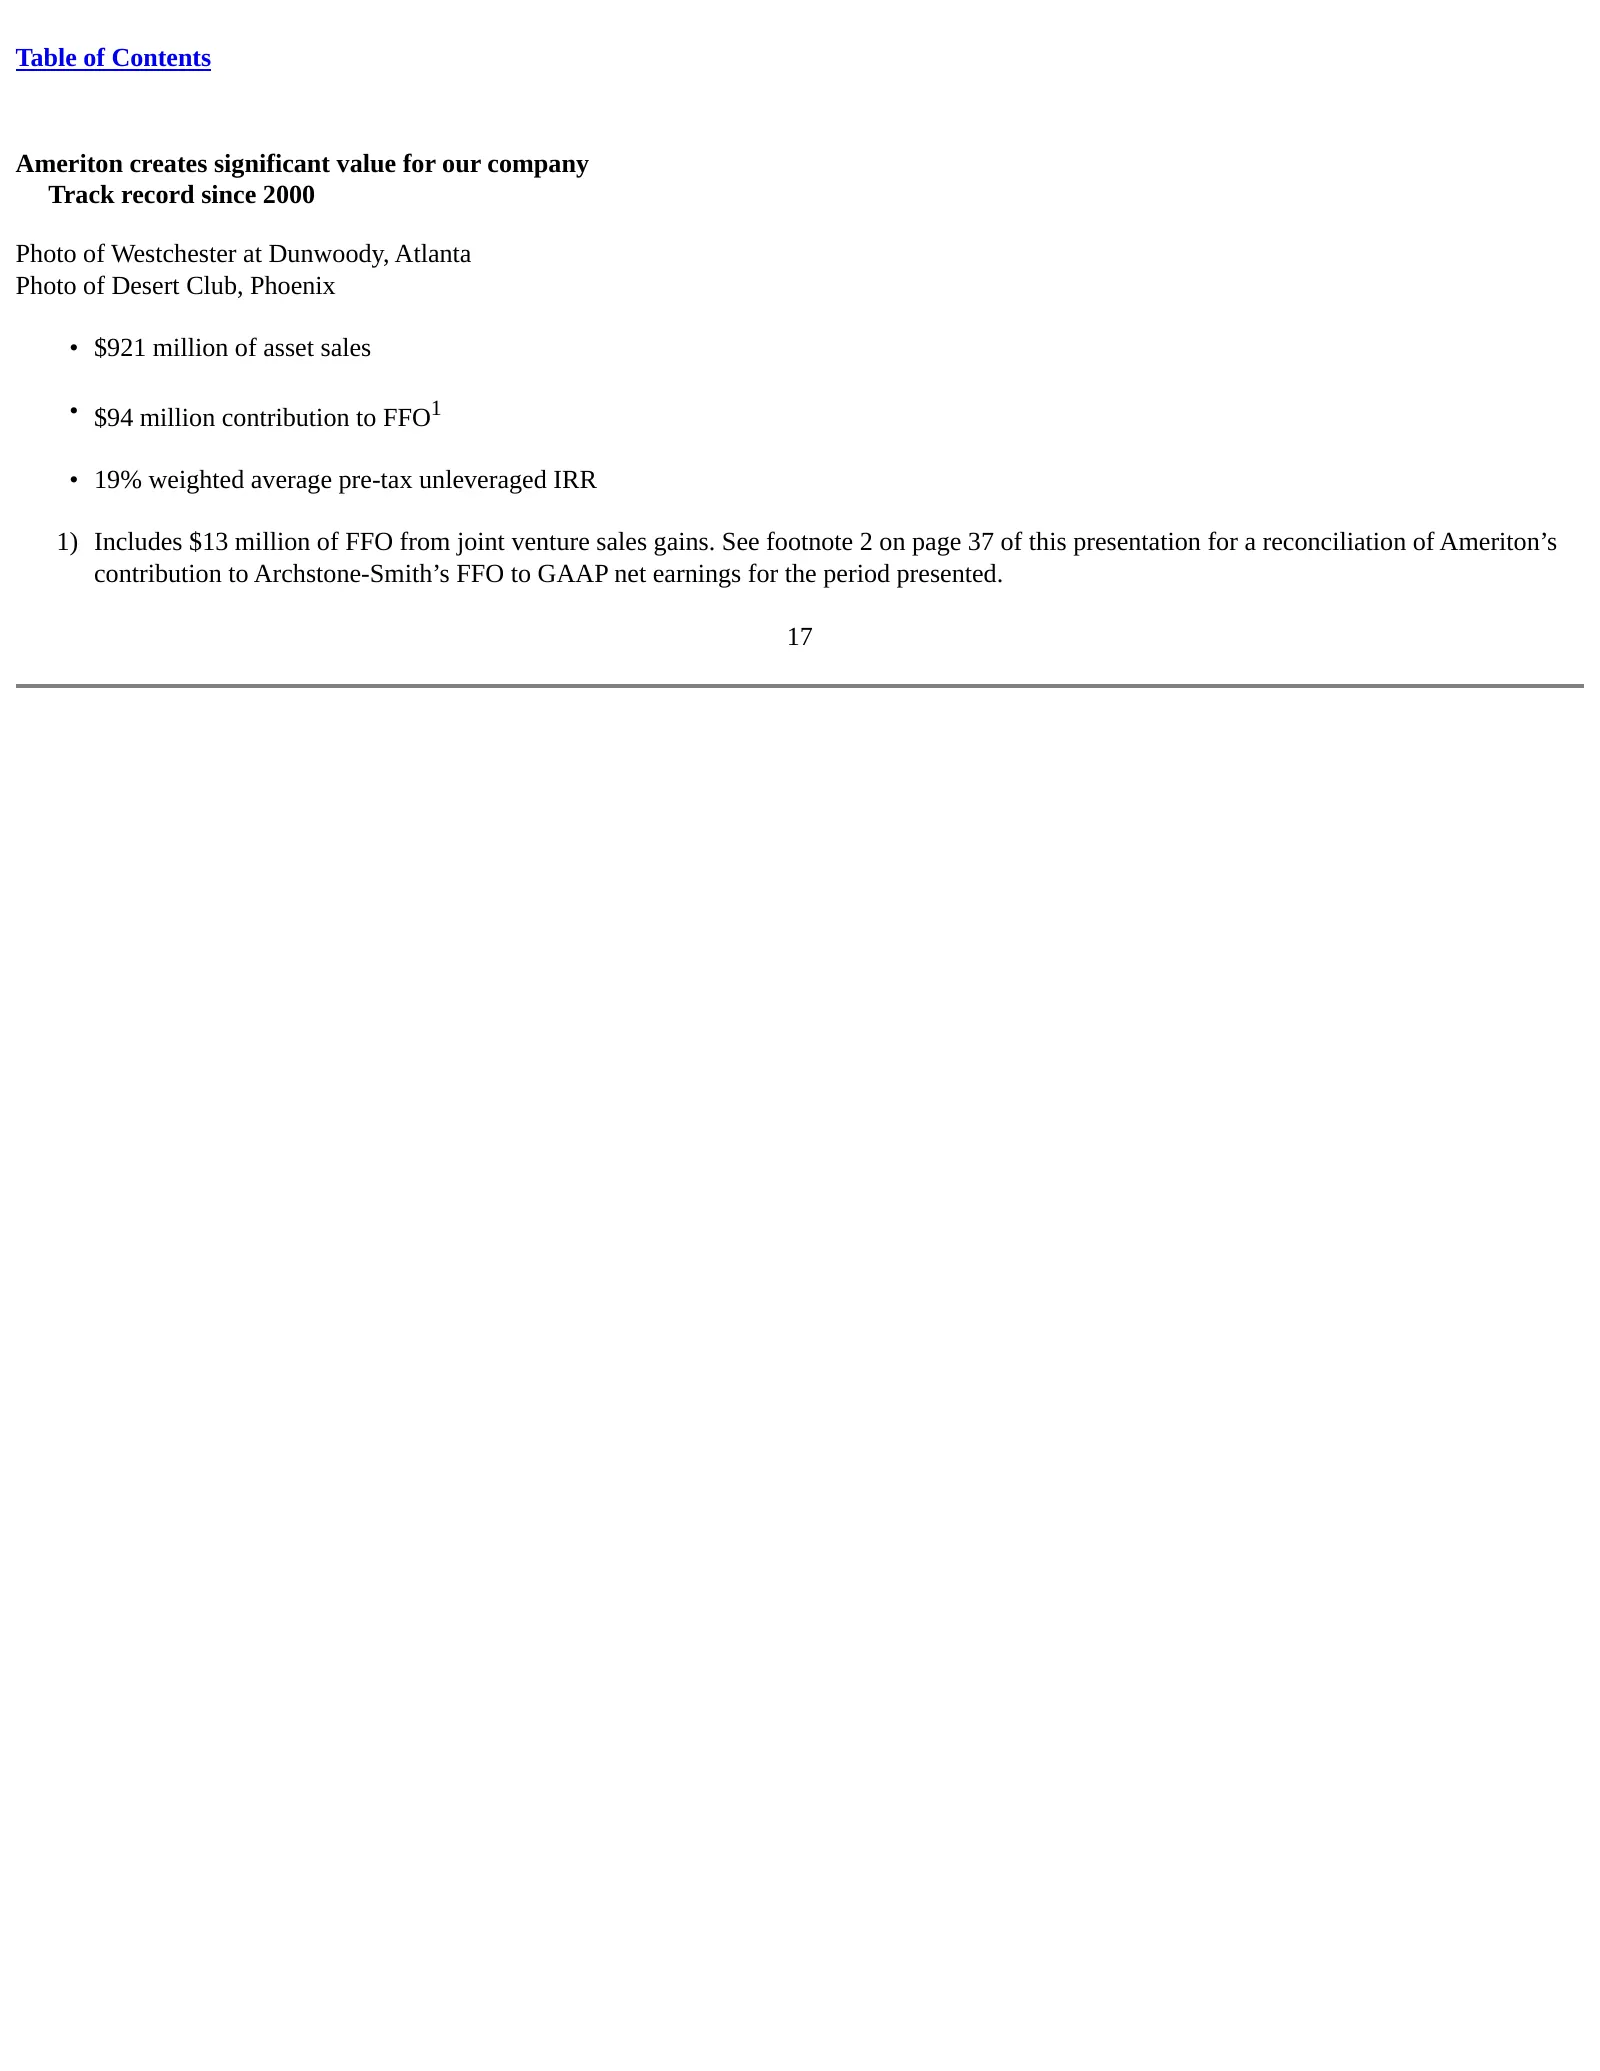
Table of Contents Ameriton creates significant value for our company Track record since 2000 Photo of Westchester at Dunwoody, Atlanta Photo of Desert Club, Phoenix • $921 million of asset sales • $94 million contribution to FFO1 • 19% weighted average pre-tax unleveraged IRR 1) Includes $13 million
Slide 18: Ameriton: consistent and recurring contribution to earnings
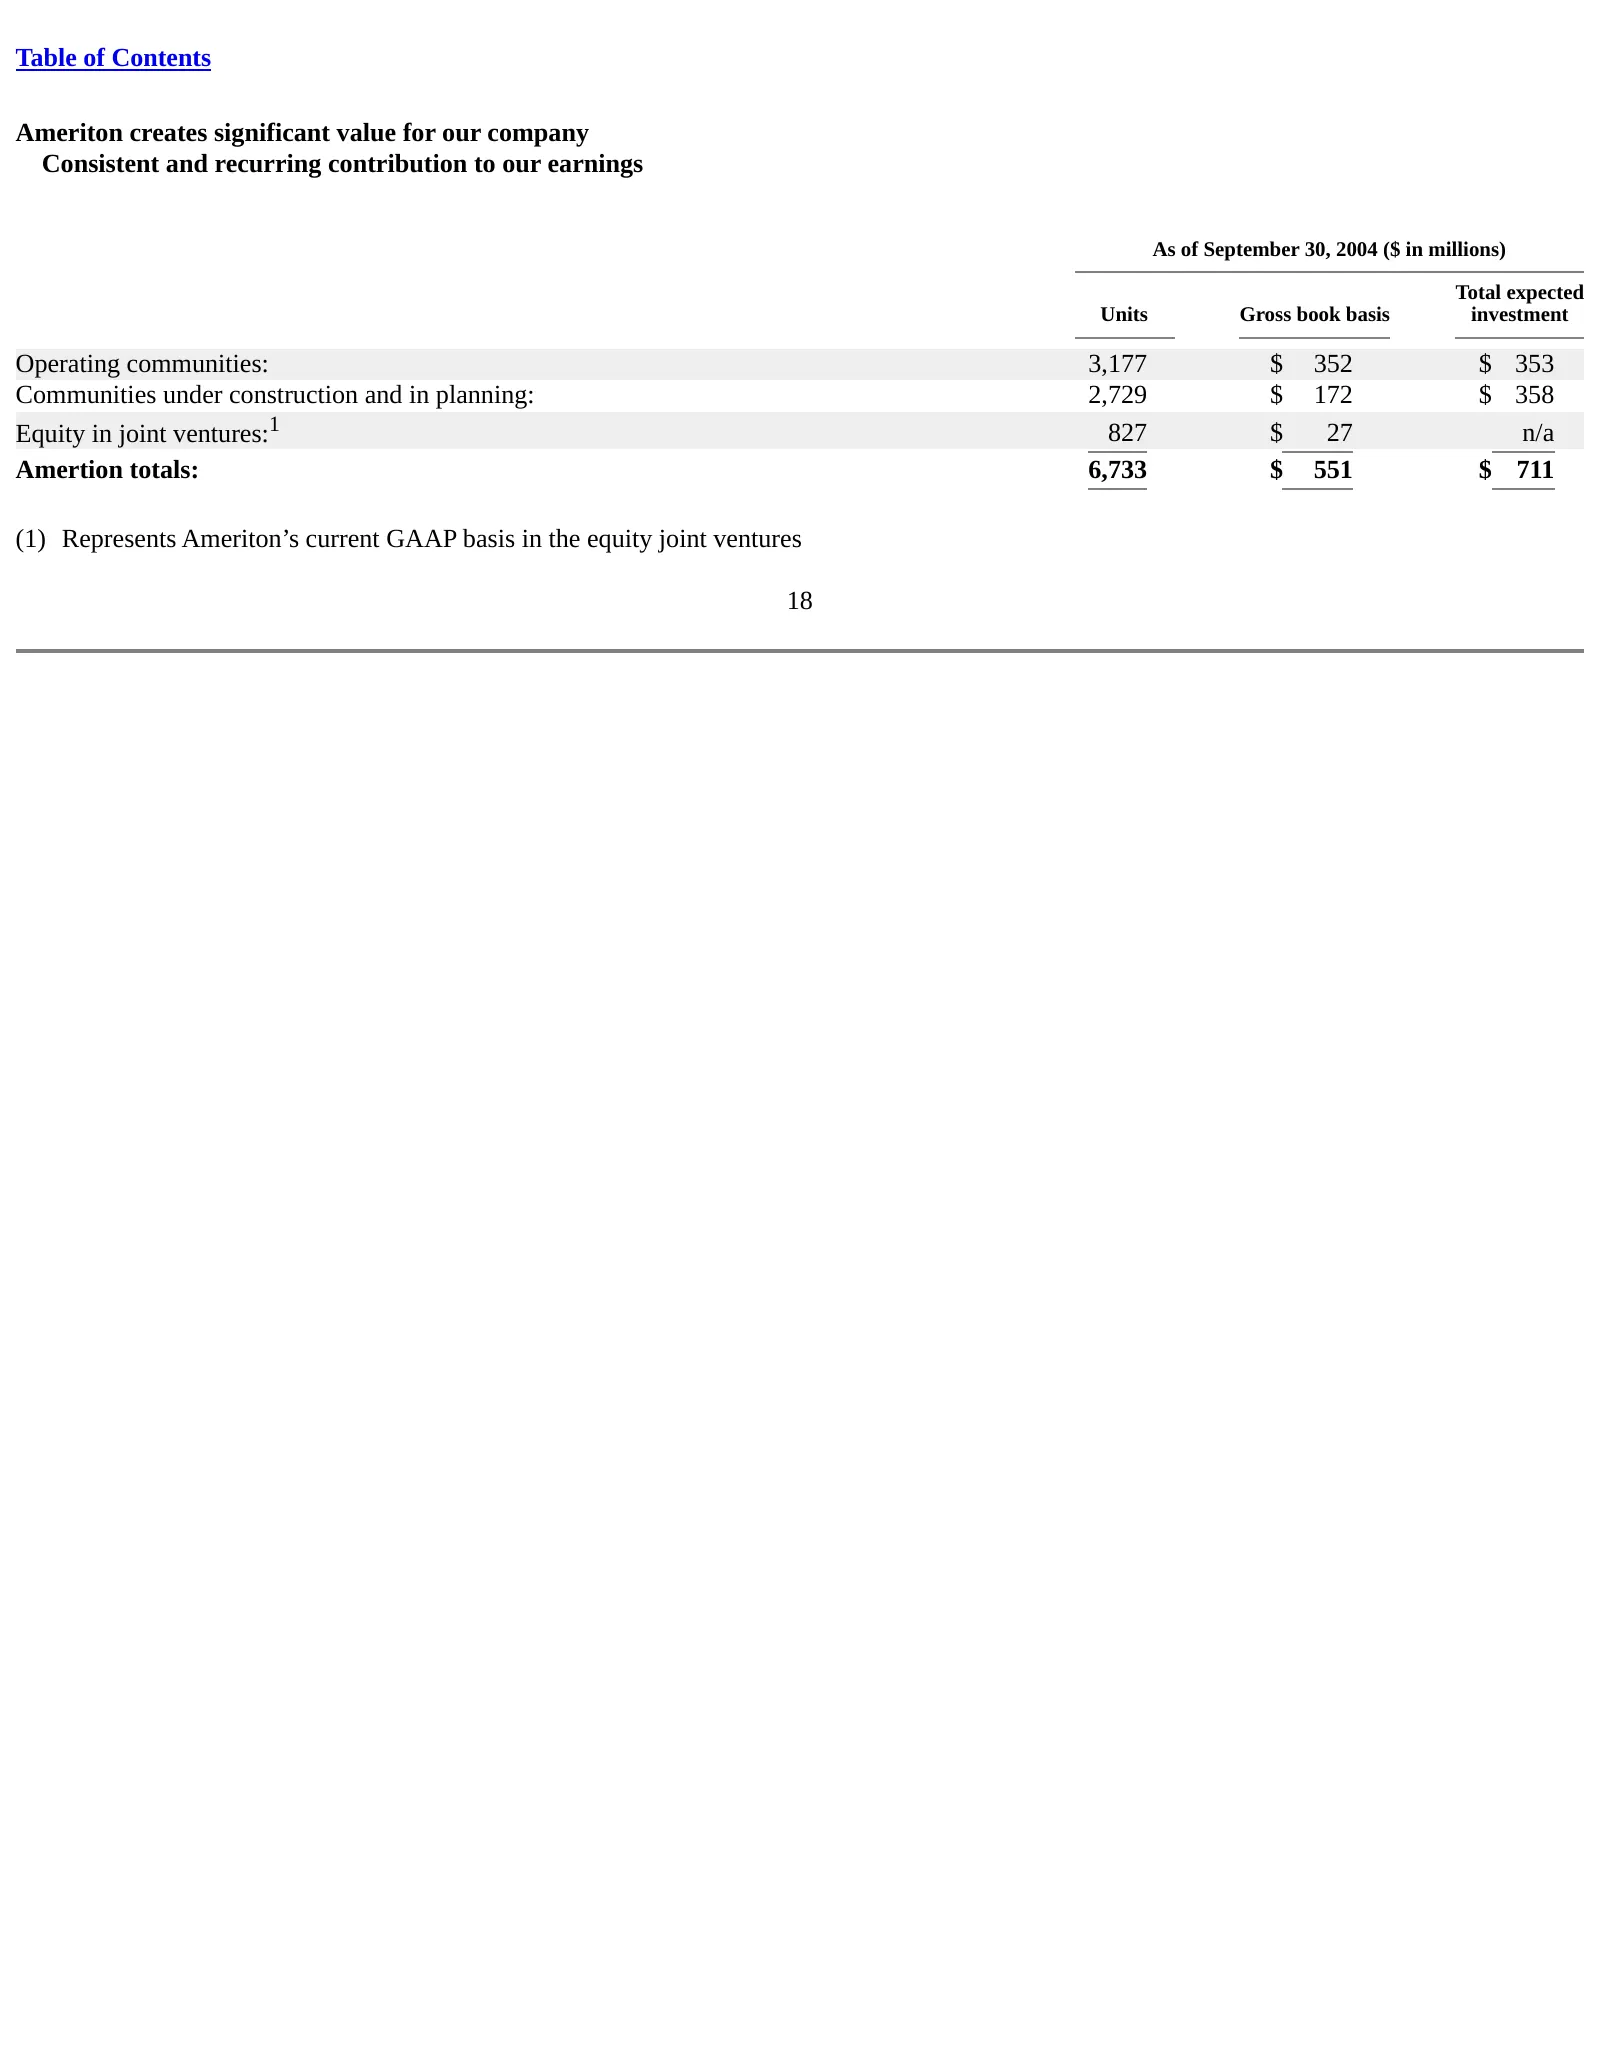
Table of Contents Ameriton creates significant value for our company Consistent and recurring contribution to our earnings As of September 30, 2004 ($ in millions) Total expected Units Gross book basis investment Operating communities: 3,177 $ 352 $ 353 Communities under construction and in planning

Slide 19: Operations matters!
Table of Contents Operations matters! Building the Dominant Operating Platform is exactly what you would expect us to do - It motivates us each and every day - We want to be the best - Includes our operating and investment teams 19

Slide 20: Track record of operational innovation
Table of Contents Track record of operational innovation • Multiple times, not just once • Purposeful, not accidental • Invest in research and development • We are reinventing our industry 20
Slide 21: Operations matters! Reported same-store NOI growth
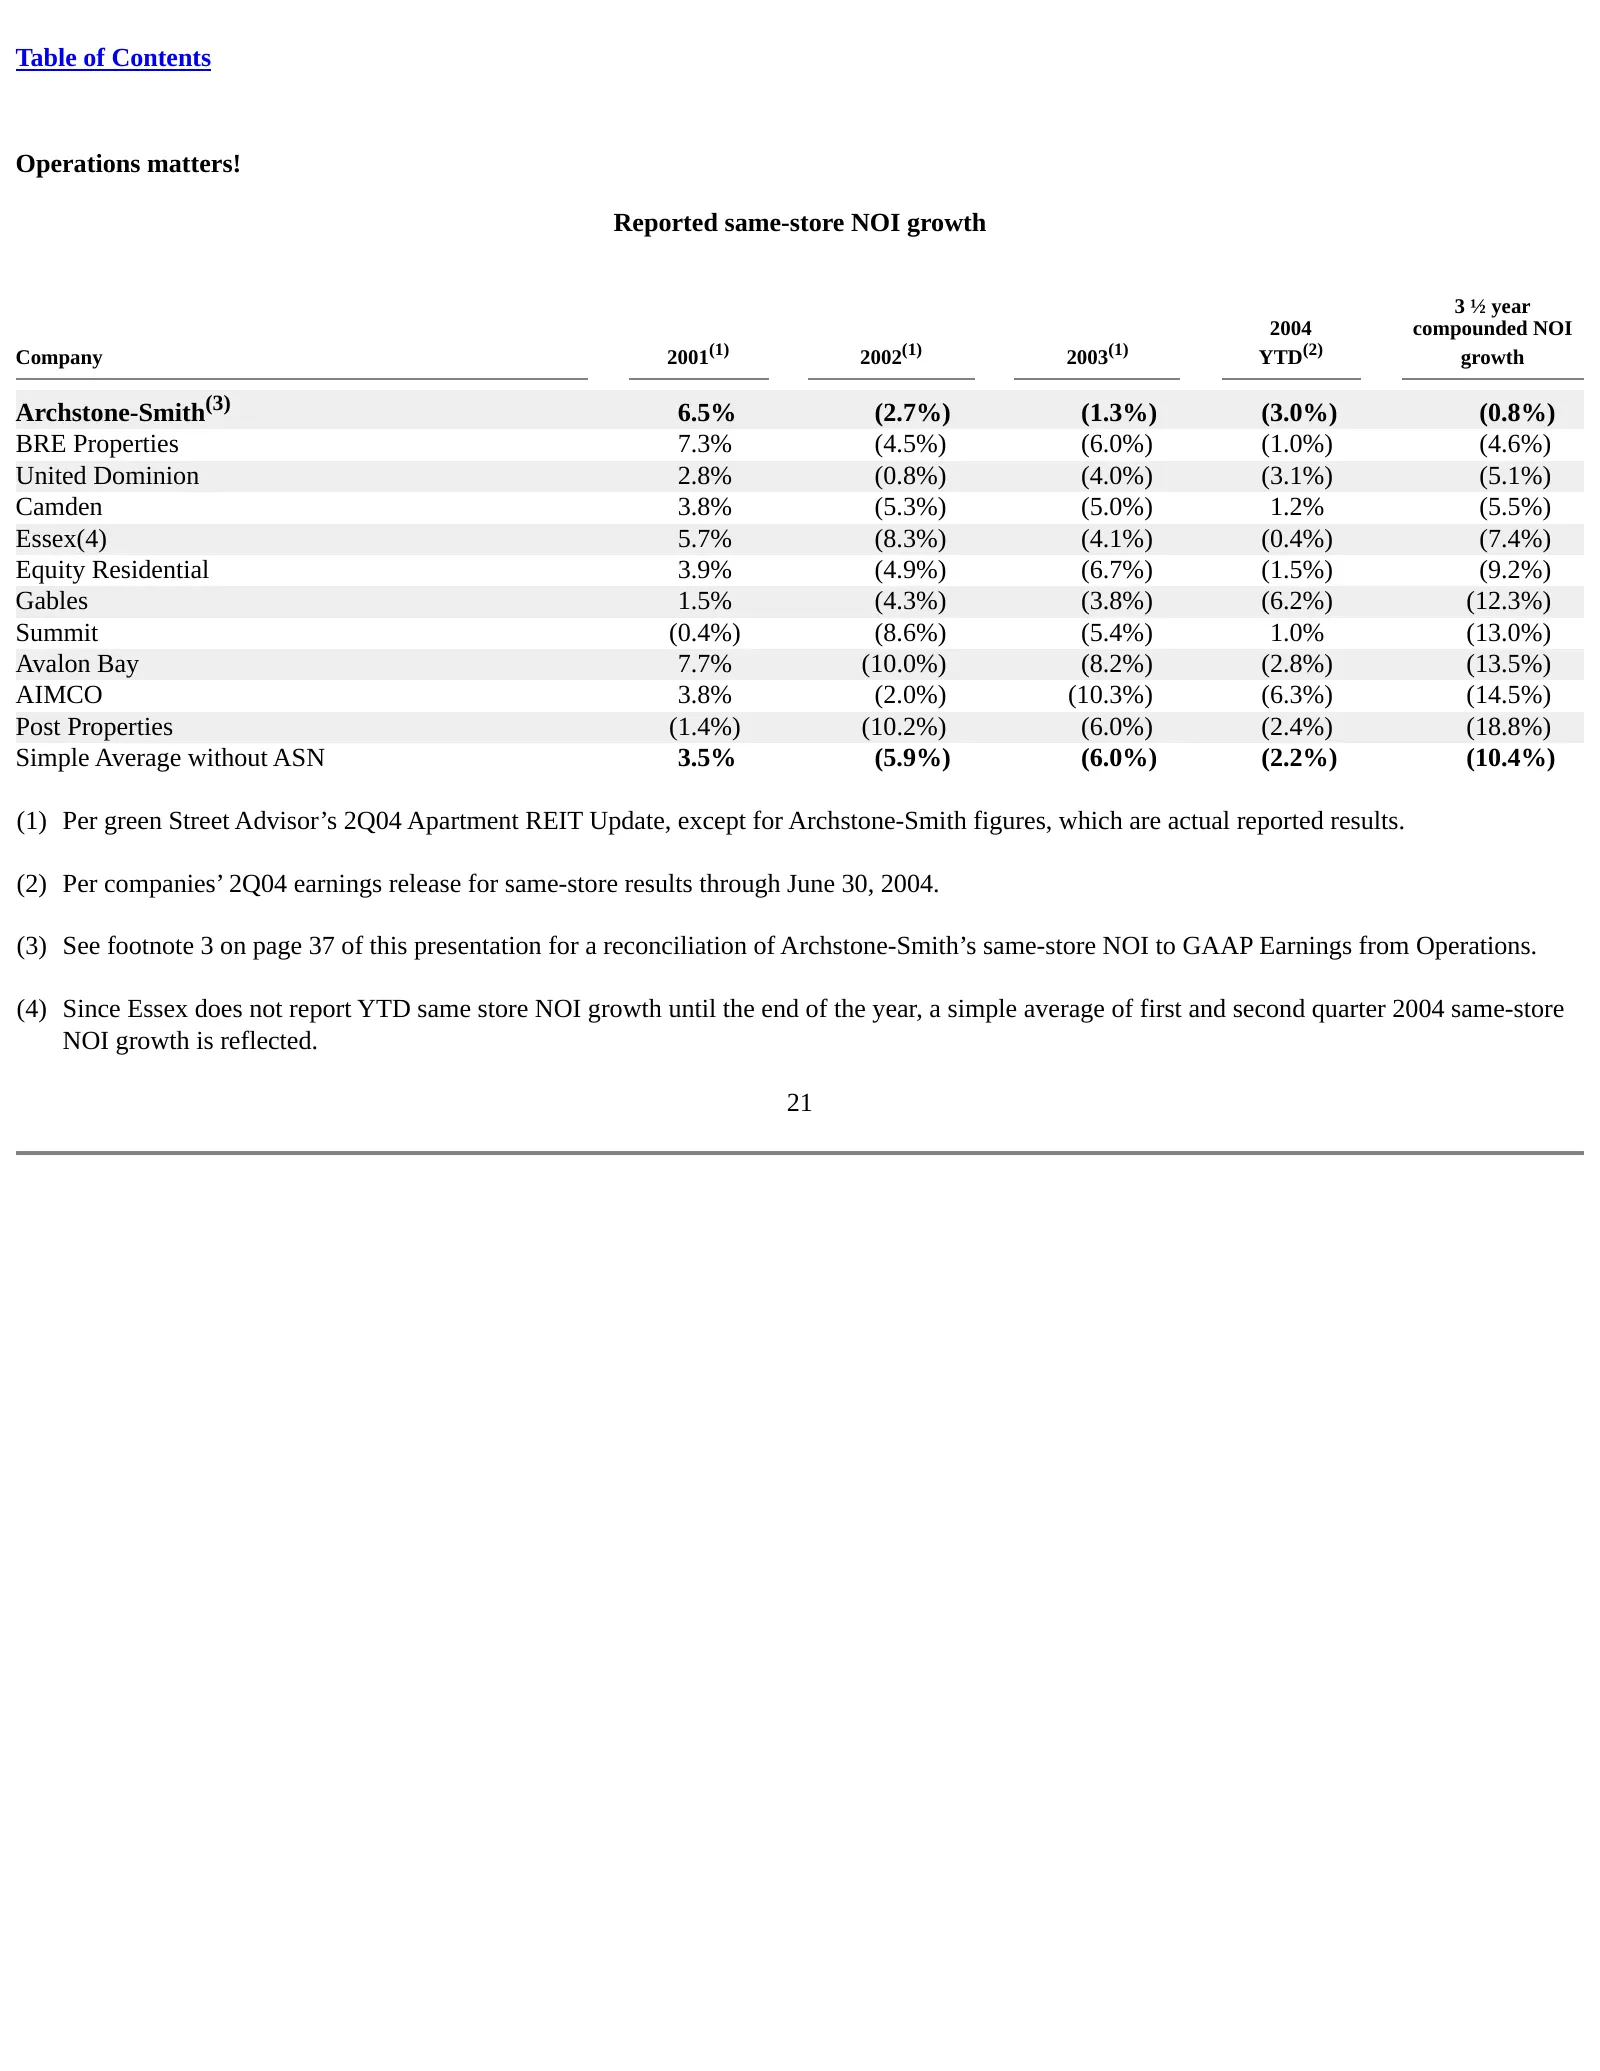
Table of Contents Operations matters! Reported same-store NOI growth 3 ½ year 2004 compounded NOI Company 2001(1) 2002(1) 2003(1) YTD(2) growth Archstone-Smith(3) 6.5% (2.7%) (1.3%) (3.0%) (0.8%) BRE Properties 7.3% (4.5%) (6.0%) (1.0%) (4.6%) United Dominion 2.8% (0.8%) (4.0%) (3.1%) (5.1%) Camden
Slide 22: Park Hudson – Manhattan
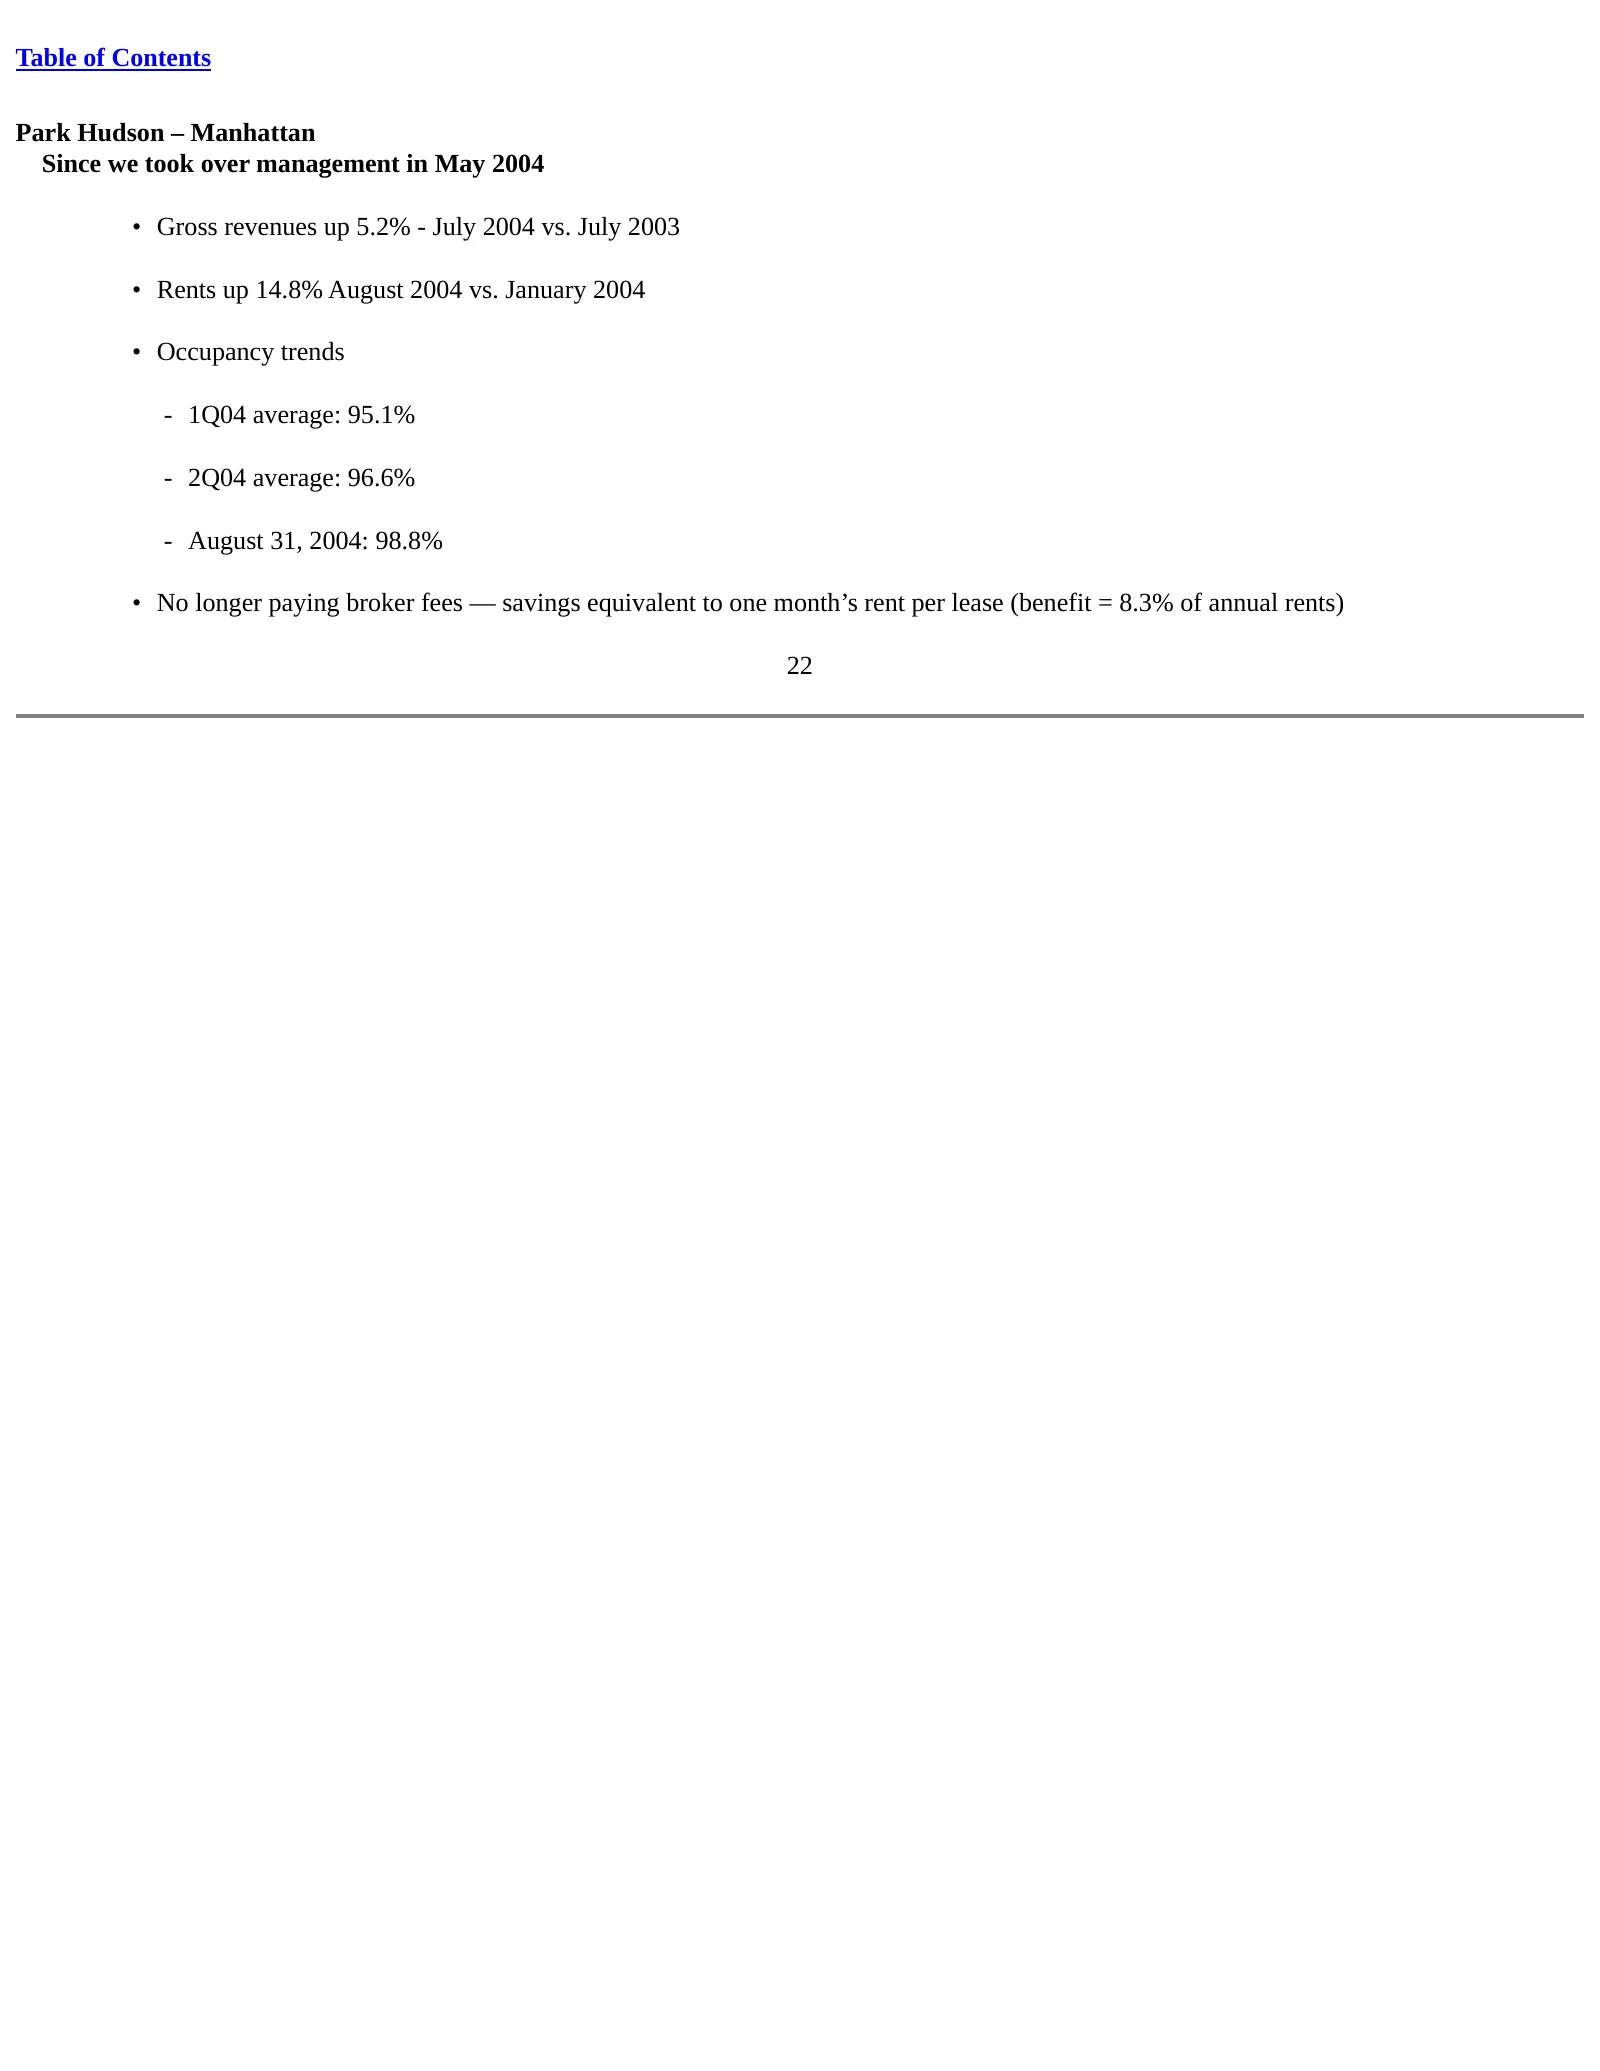
Table of Contents Park Hudson – Manhattan Since we took over management in May 2004 • Gross revenues up 5.2% - July 2004 vs. July 2003 • Rents up 14.8% August 2004 vs. January 2004 • Occupancy trends - 1Q04 average: 95.1% - 2Q04 average: 96.6% - August 31, 2004: 98.8% • No longer paying broker fees
Slide 23: Significant rent increases in our key markets
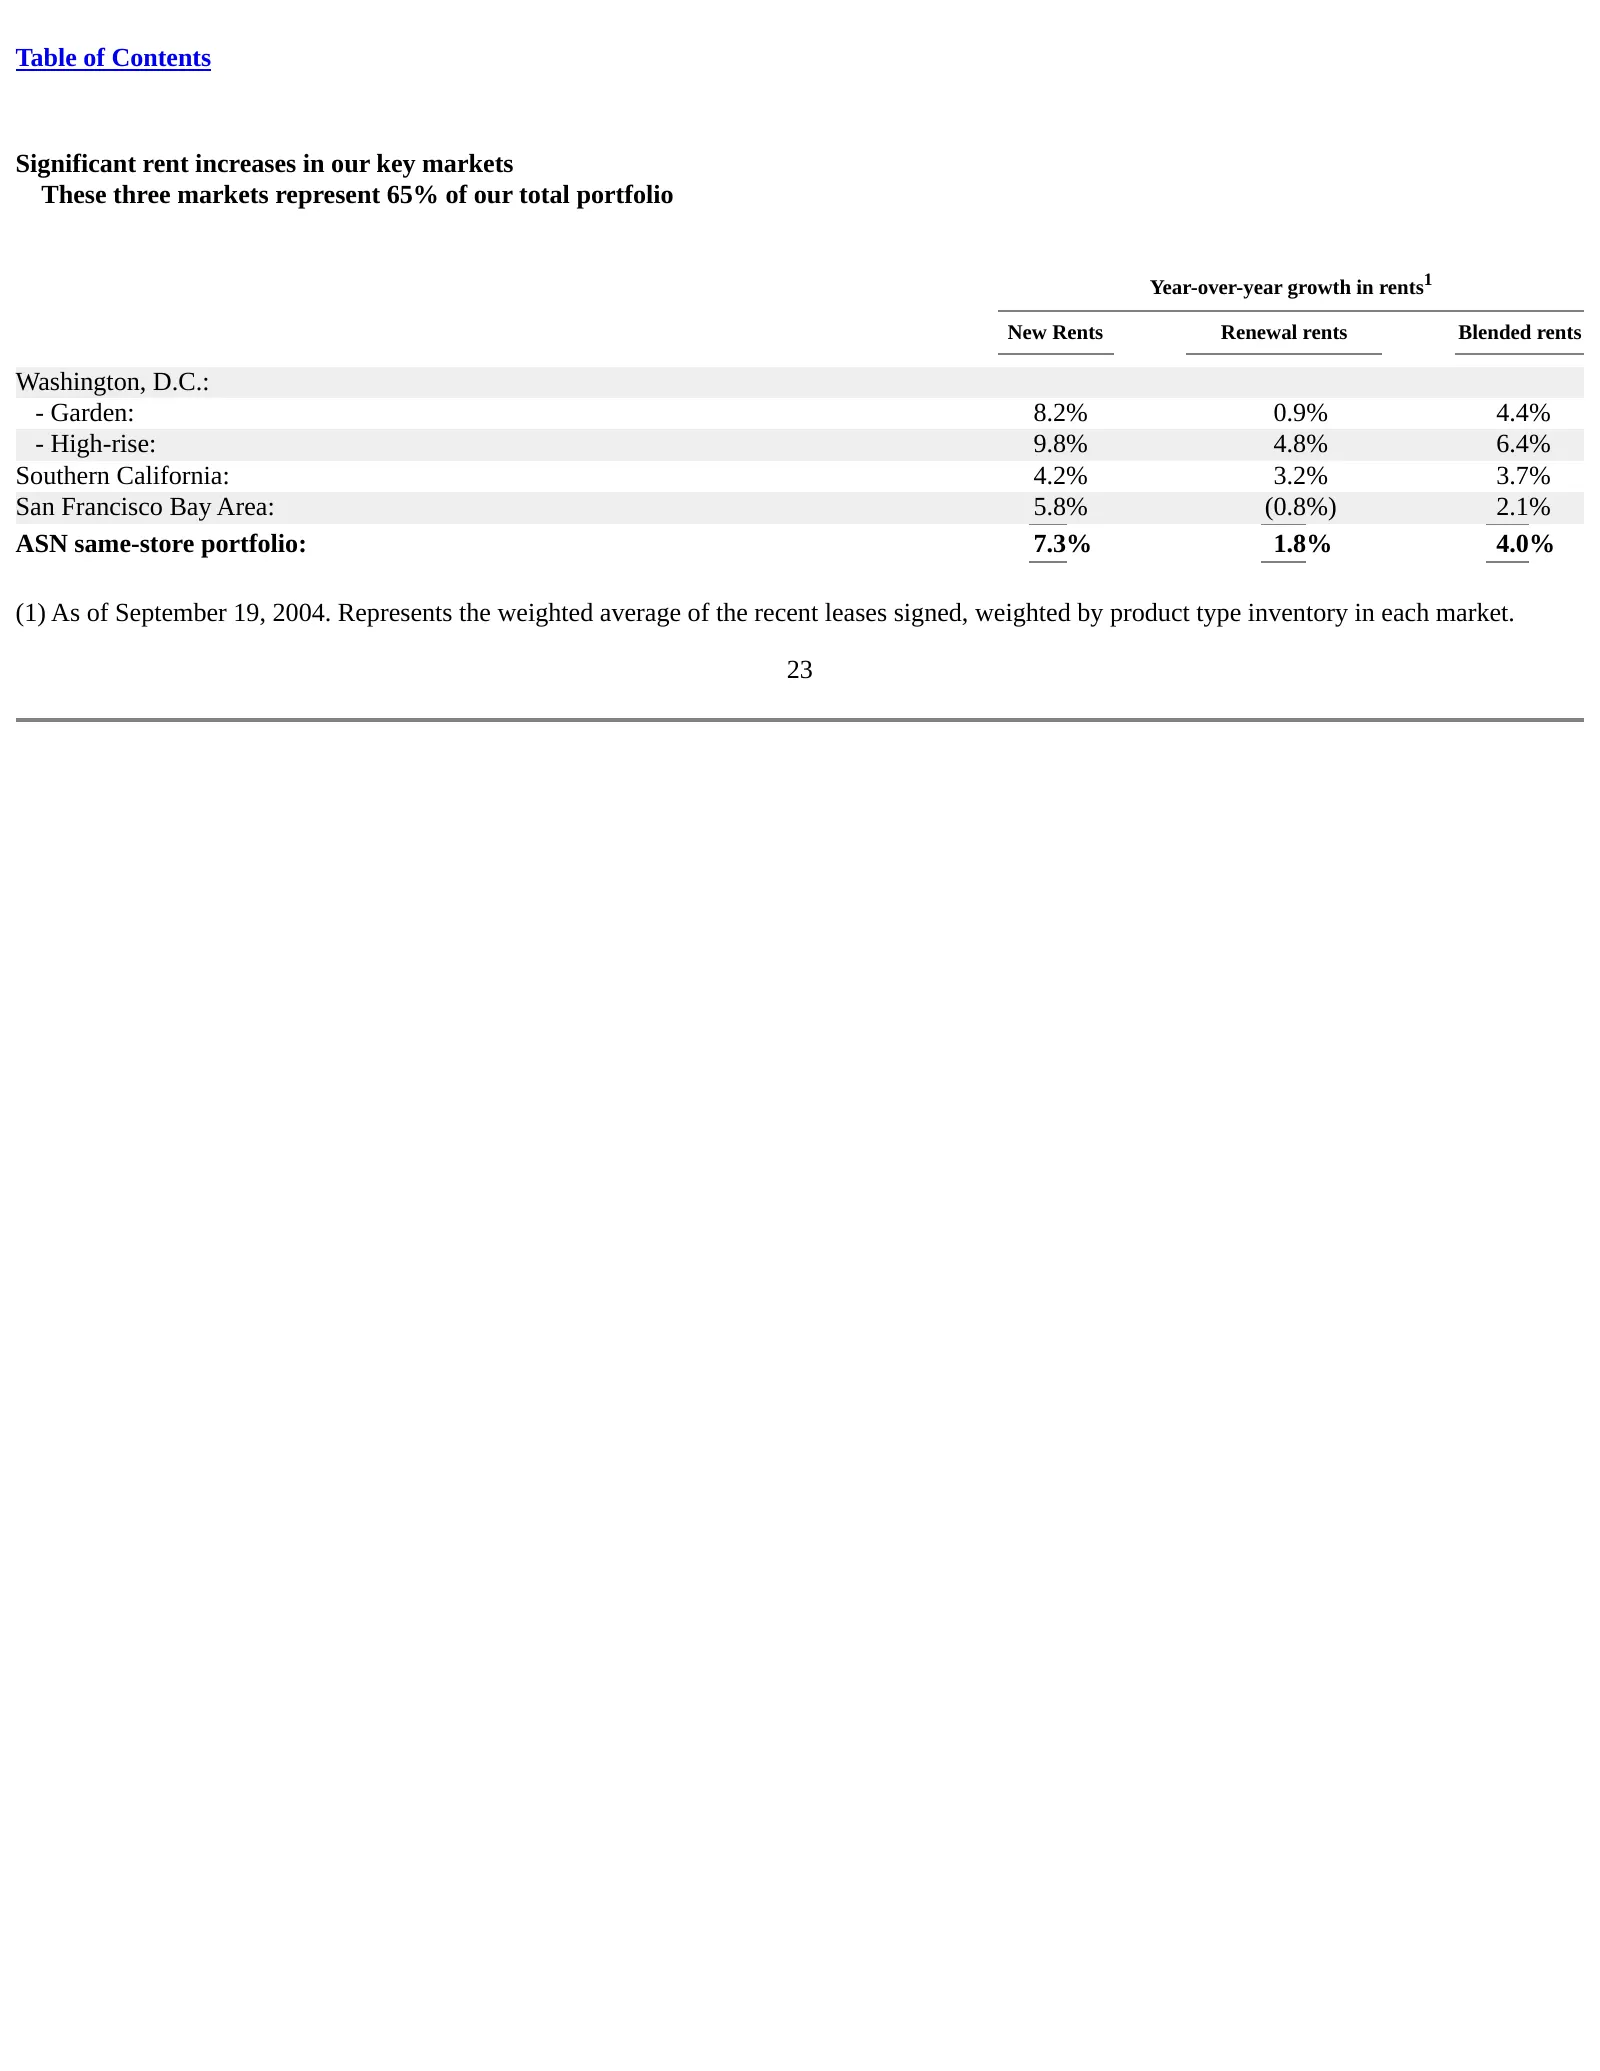
Table of Contents Significant rent increases in our key markets These three markets represent 65% of our total portfolio Year-over-year growth in rents1 New Rents Renewal rents Blended rents Washington, D.C.: - Garden: 8.2% 0.9% 4.4% - High-rise: 9.8% 4.8% 6.4% Southern California: 4.2% 3.2% 3.7% Sa

Slide 24: Refining our Washington, D.C. portfolio
Table of Contents Refining our Washington, D.C. portfolio This slide contains an overview map of the Washington, D.C. area with Archstone-Smith high-rise assets owned, garden assets owned and Archstone- Smith and Ameriton dispositions plotted. 24
Slide 25: Building the Dominant Operating Platform: best practices
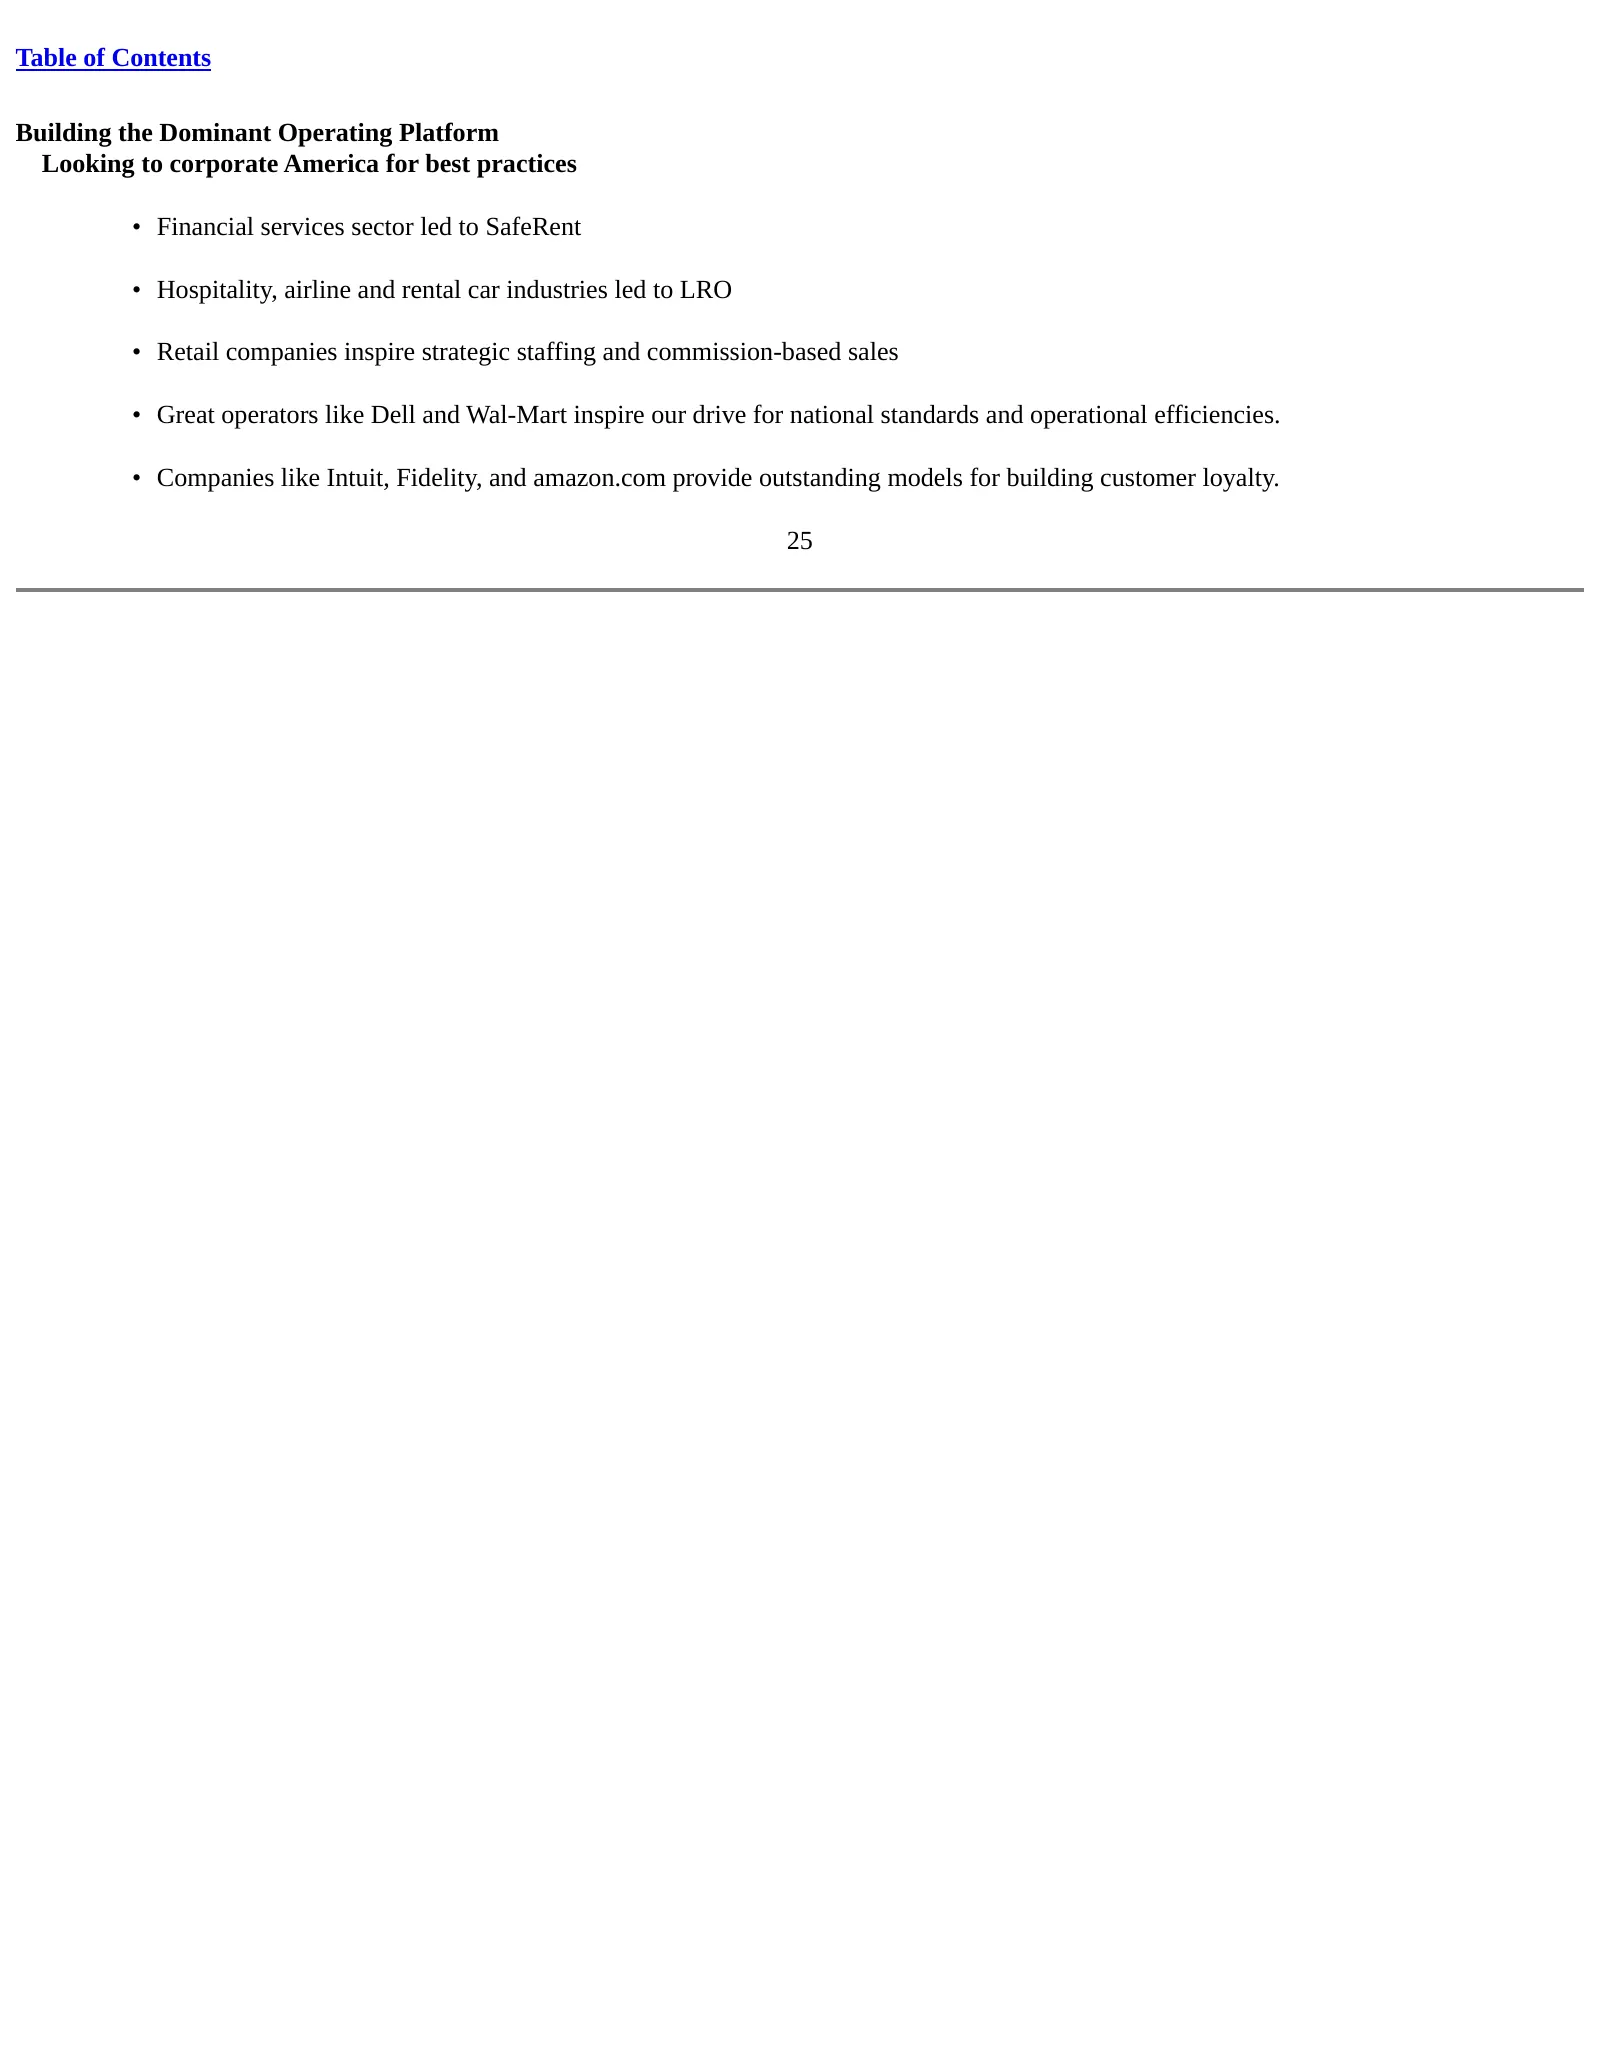
Table of Contents Building the Dominant Operating Platform Looking to corporate America for best practices • Financial services sector led to SafeRent • Hospitality, airline and rental car industries led to LRO • Retail companies inspire strategic staffing and commission-based sales • Great operator
Slide 26: Building the Dominant Operating Platform: technology
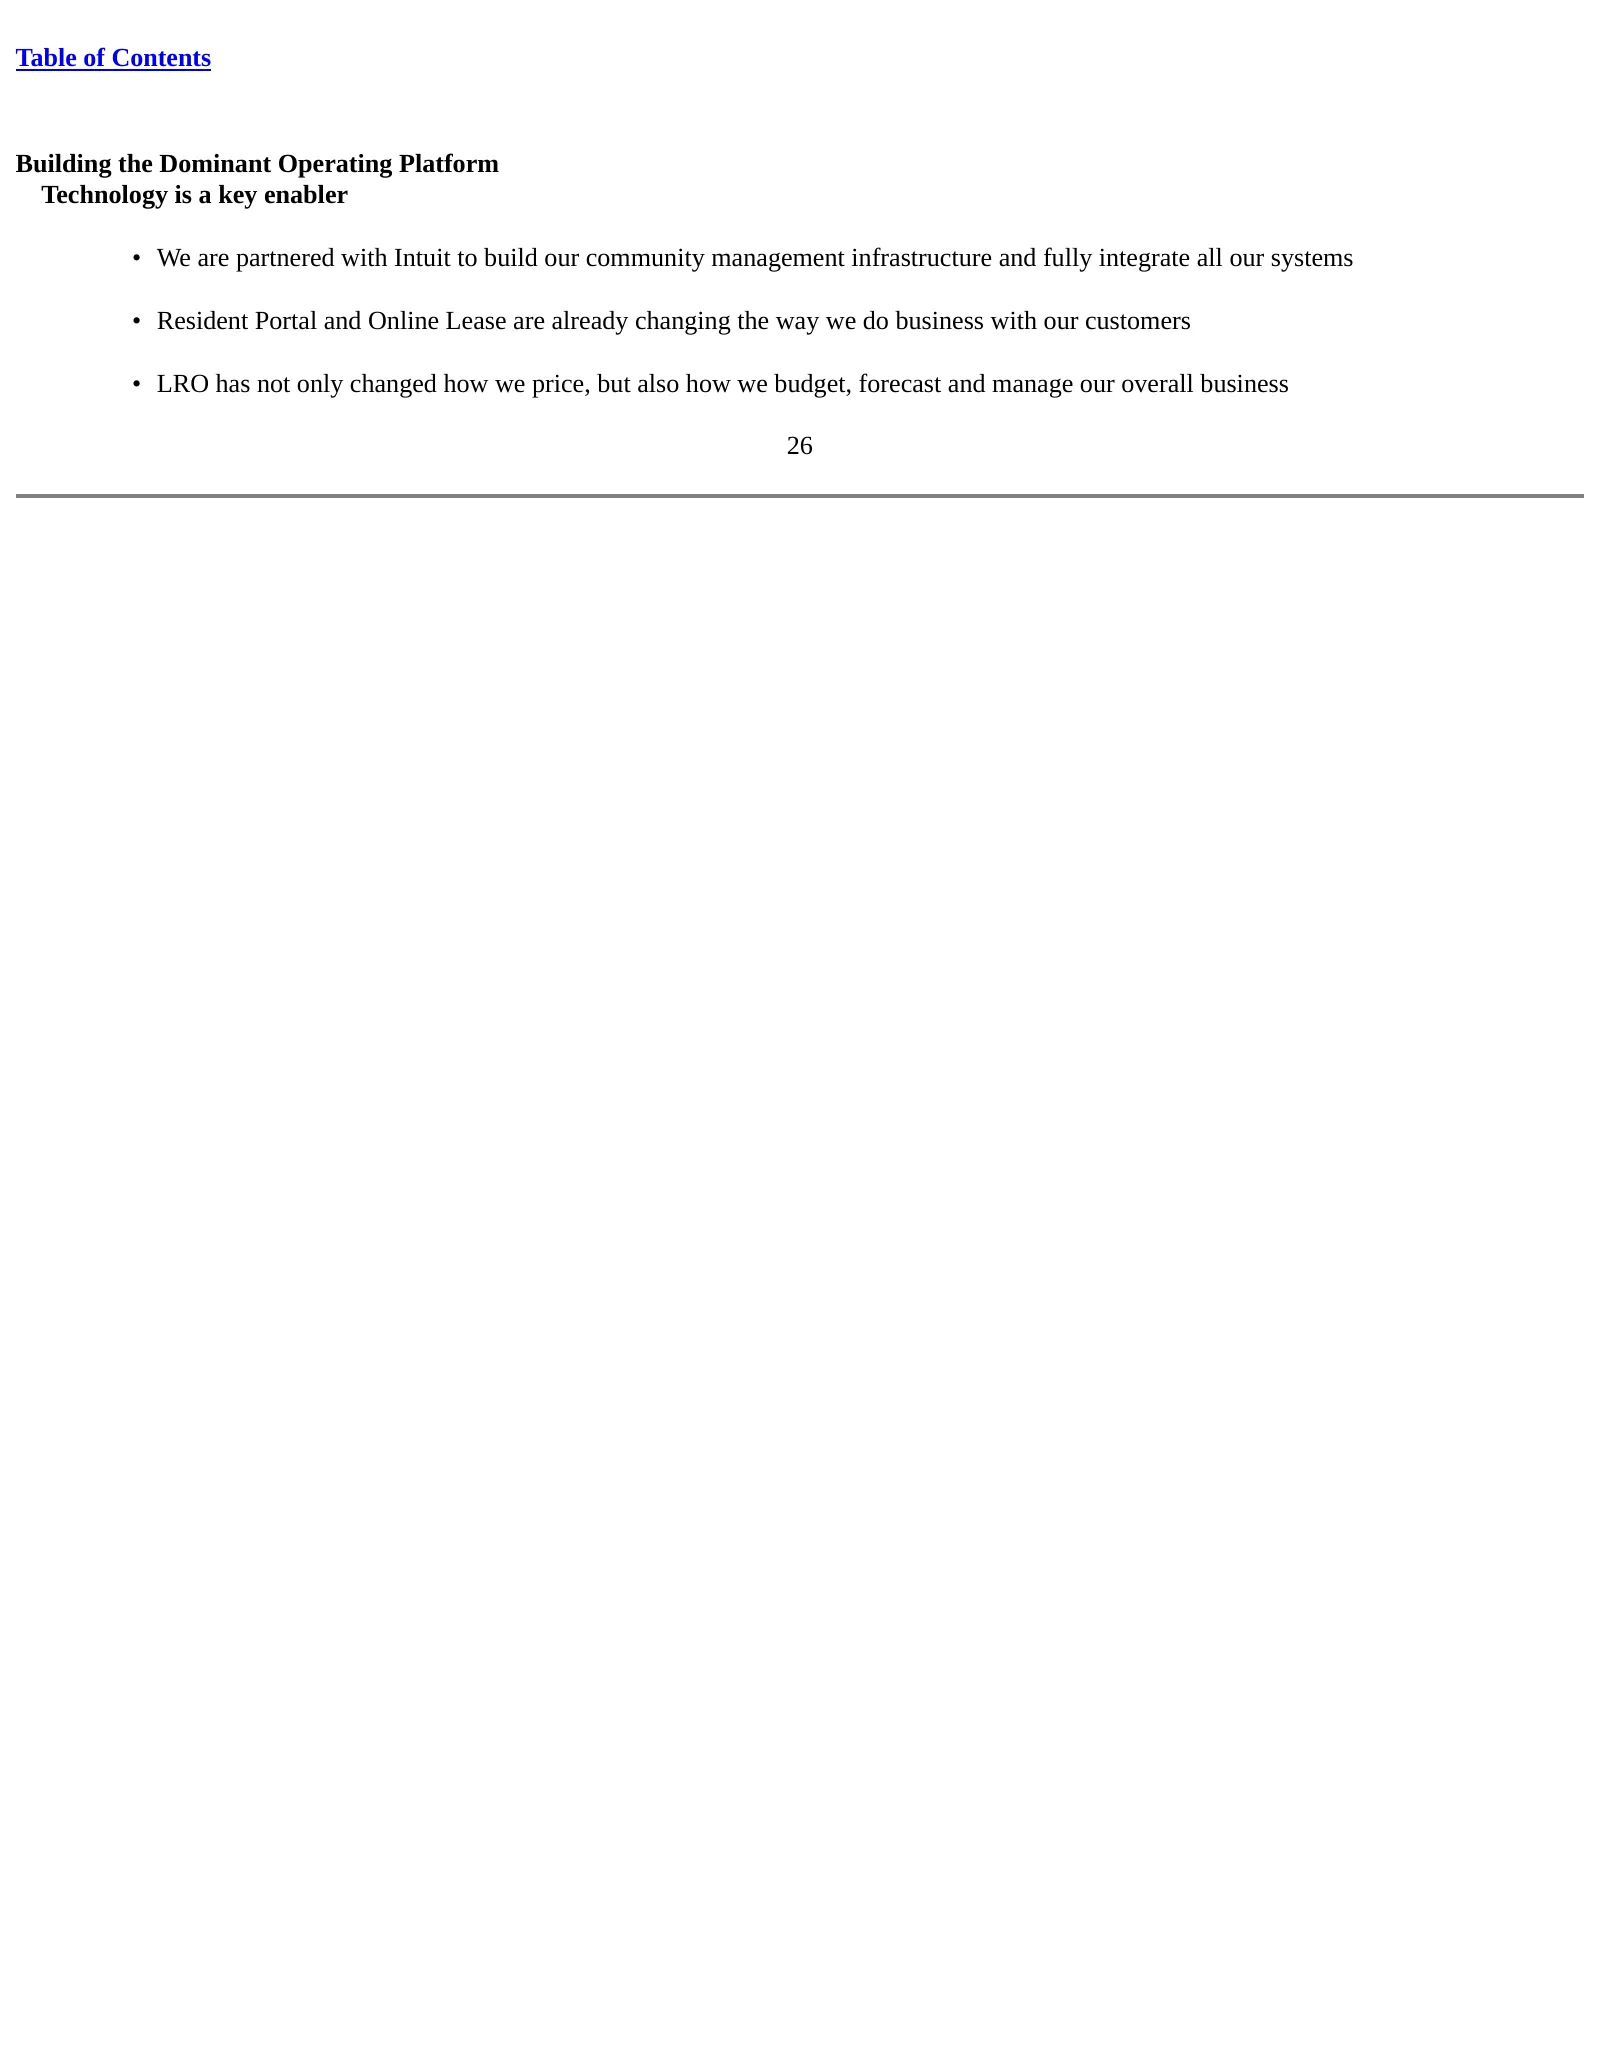
Table of Contents Building the Dominant Operating Platform Technology is a key enabler • We are partnered with Intuit to build our community management infrastructure and fully integrate all our systems • Resident Portal and Online Lease are already changing the way we do business with our customers
Slide 27: Building the Dominant Operating Platform: brands
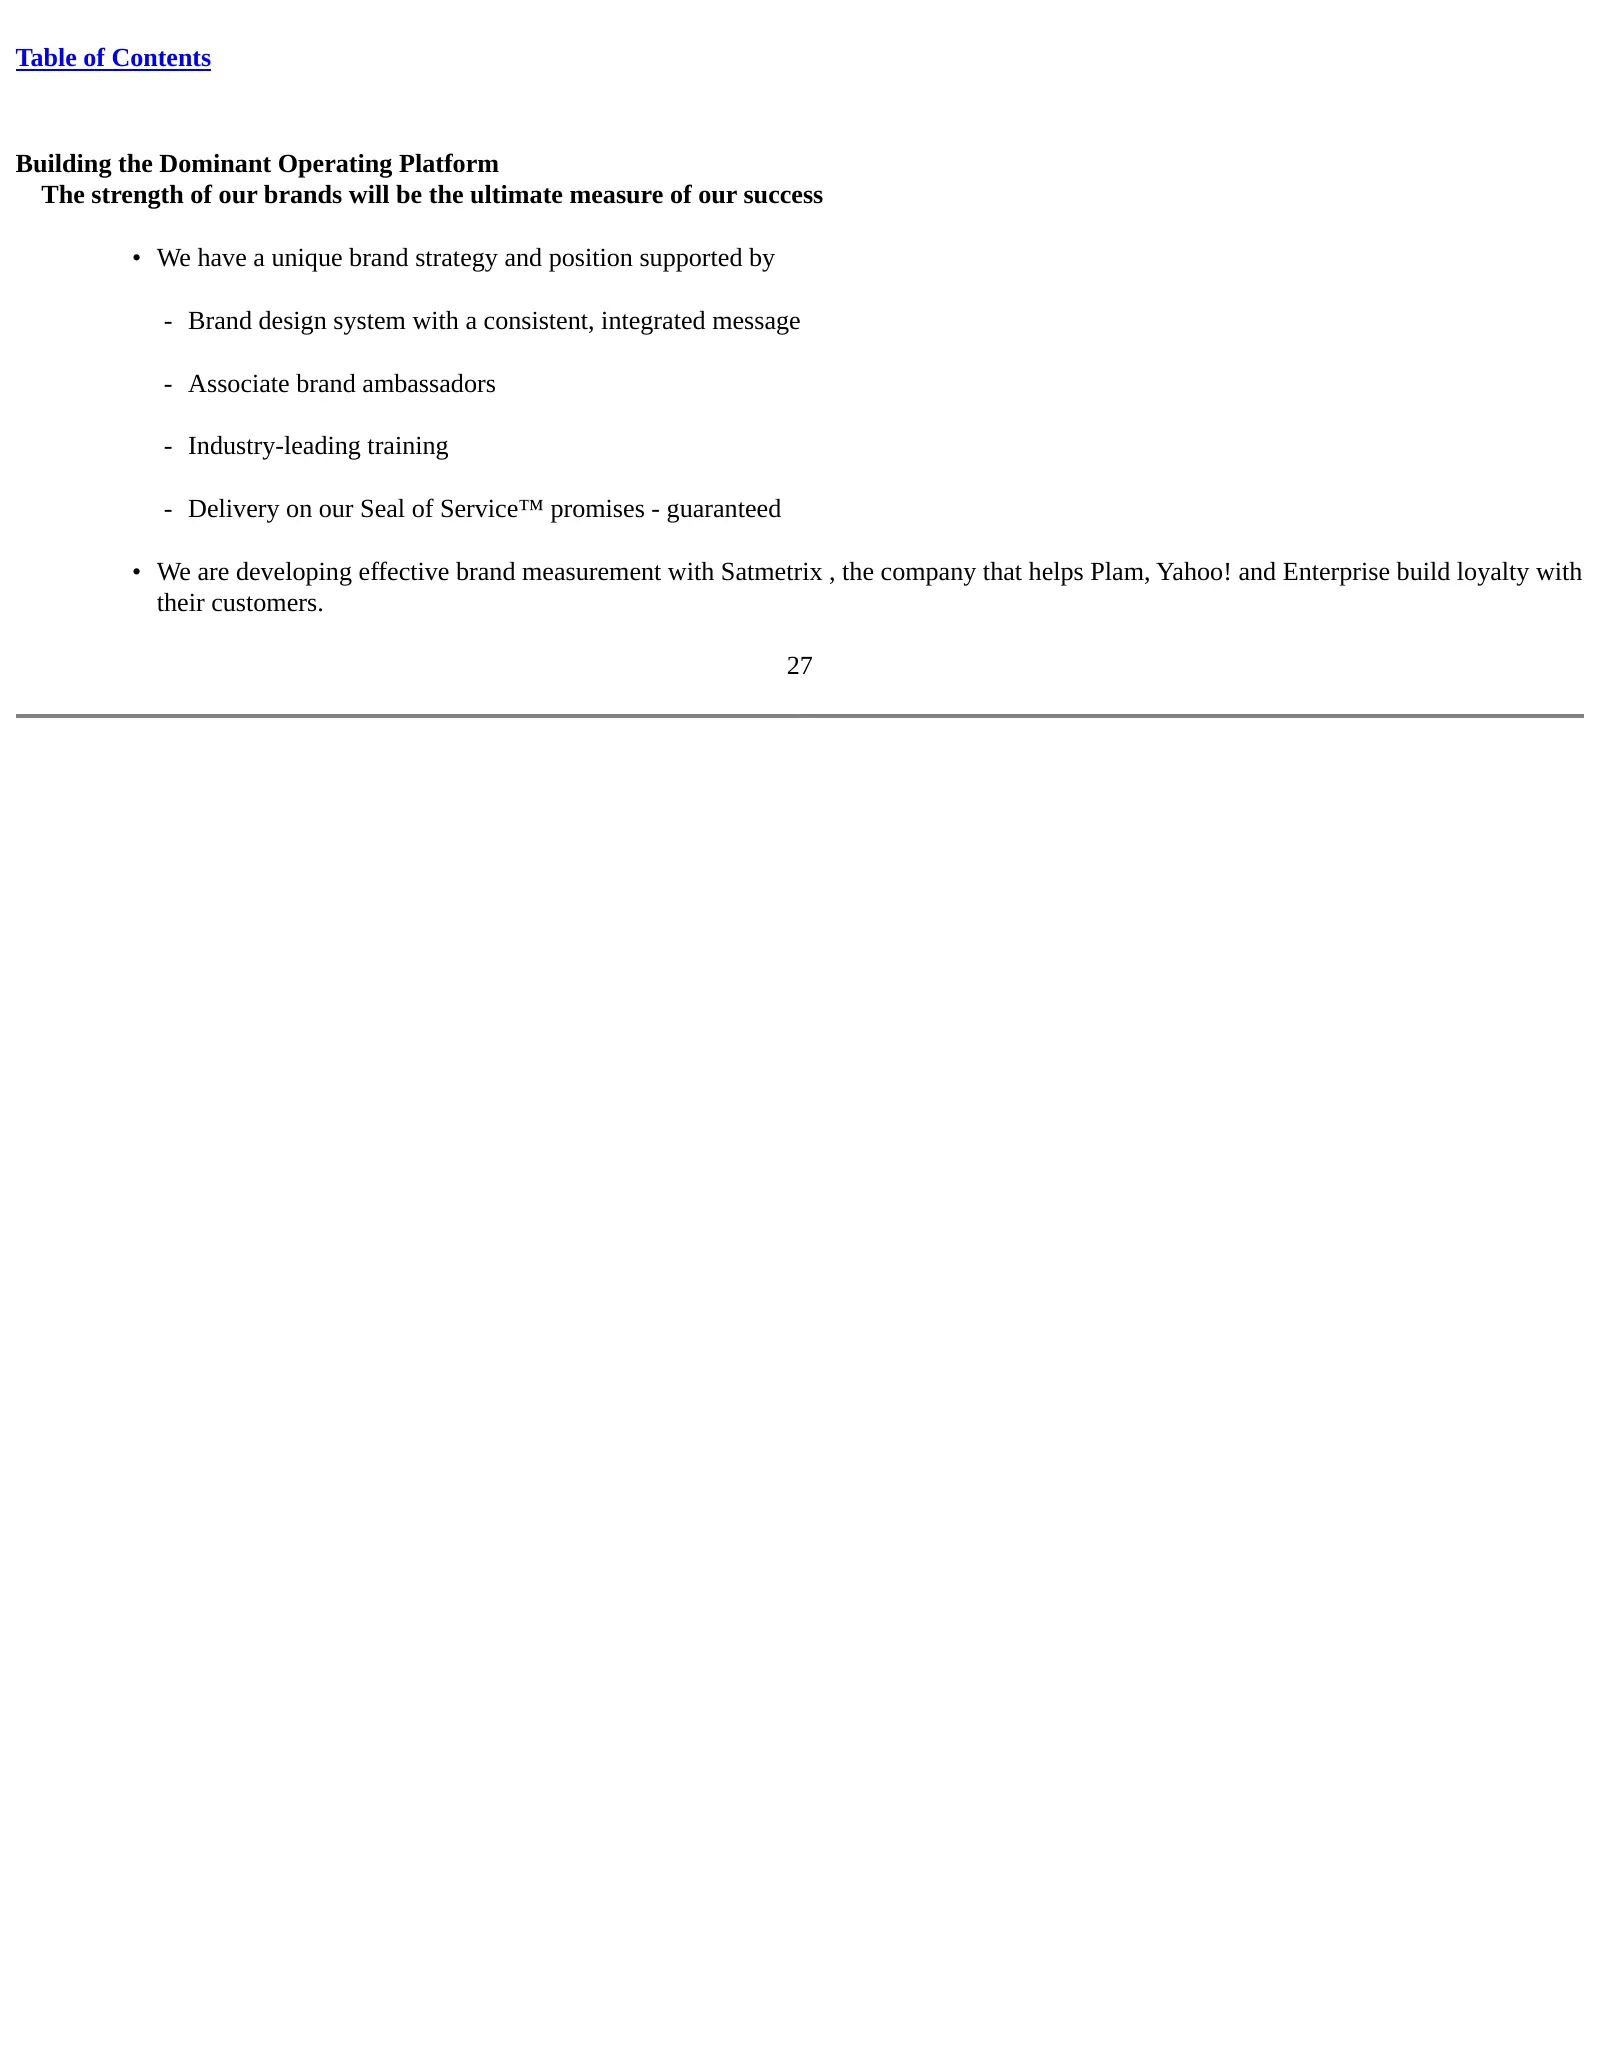
Table of Contents Building the Dominant Operating Platform The strength of our brands will be the ultimate measure of our success • We have a unique brand strategy and position supported by - Brand design system with a consistent, integrated message - Associate brand ambassadors - Industry-leading t

Slide 28: Building the Dominant Operating Platform: talent
Table of Contents Building the Dominant Operating Platform • We attract and retain outstanding talent at all levels of the organization because of operational innovation – and we believe it is a key reason we have and should continue to outperform our peers. 28
Slide 29: Disciplined capital allocation strategy
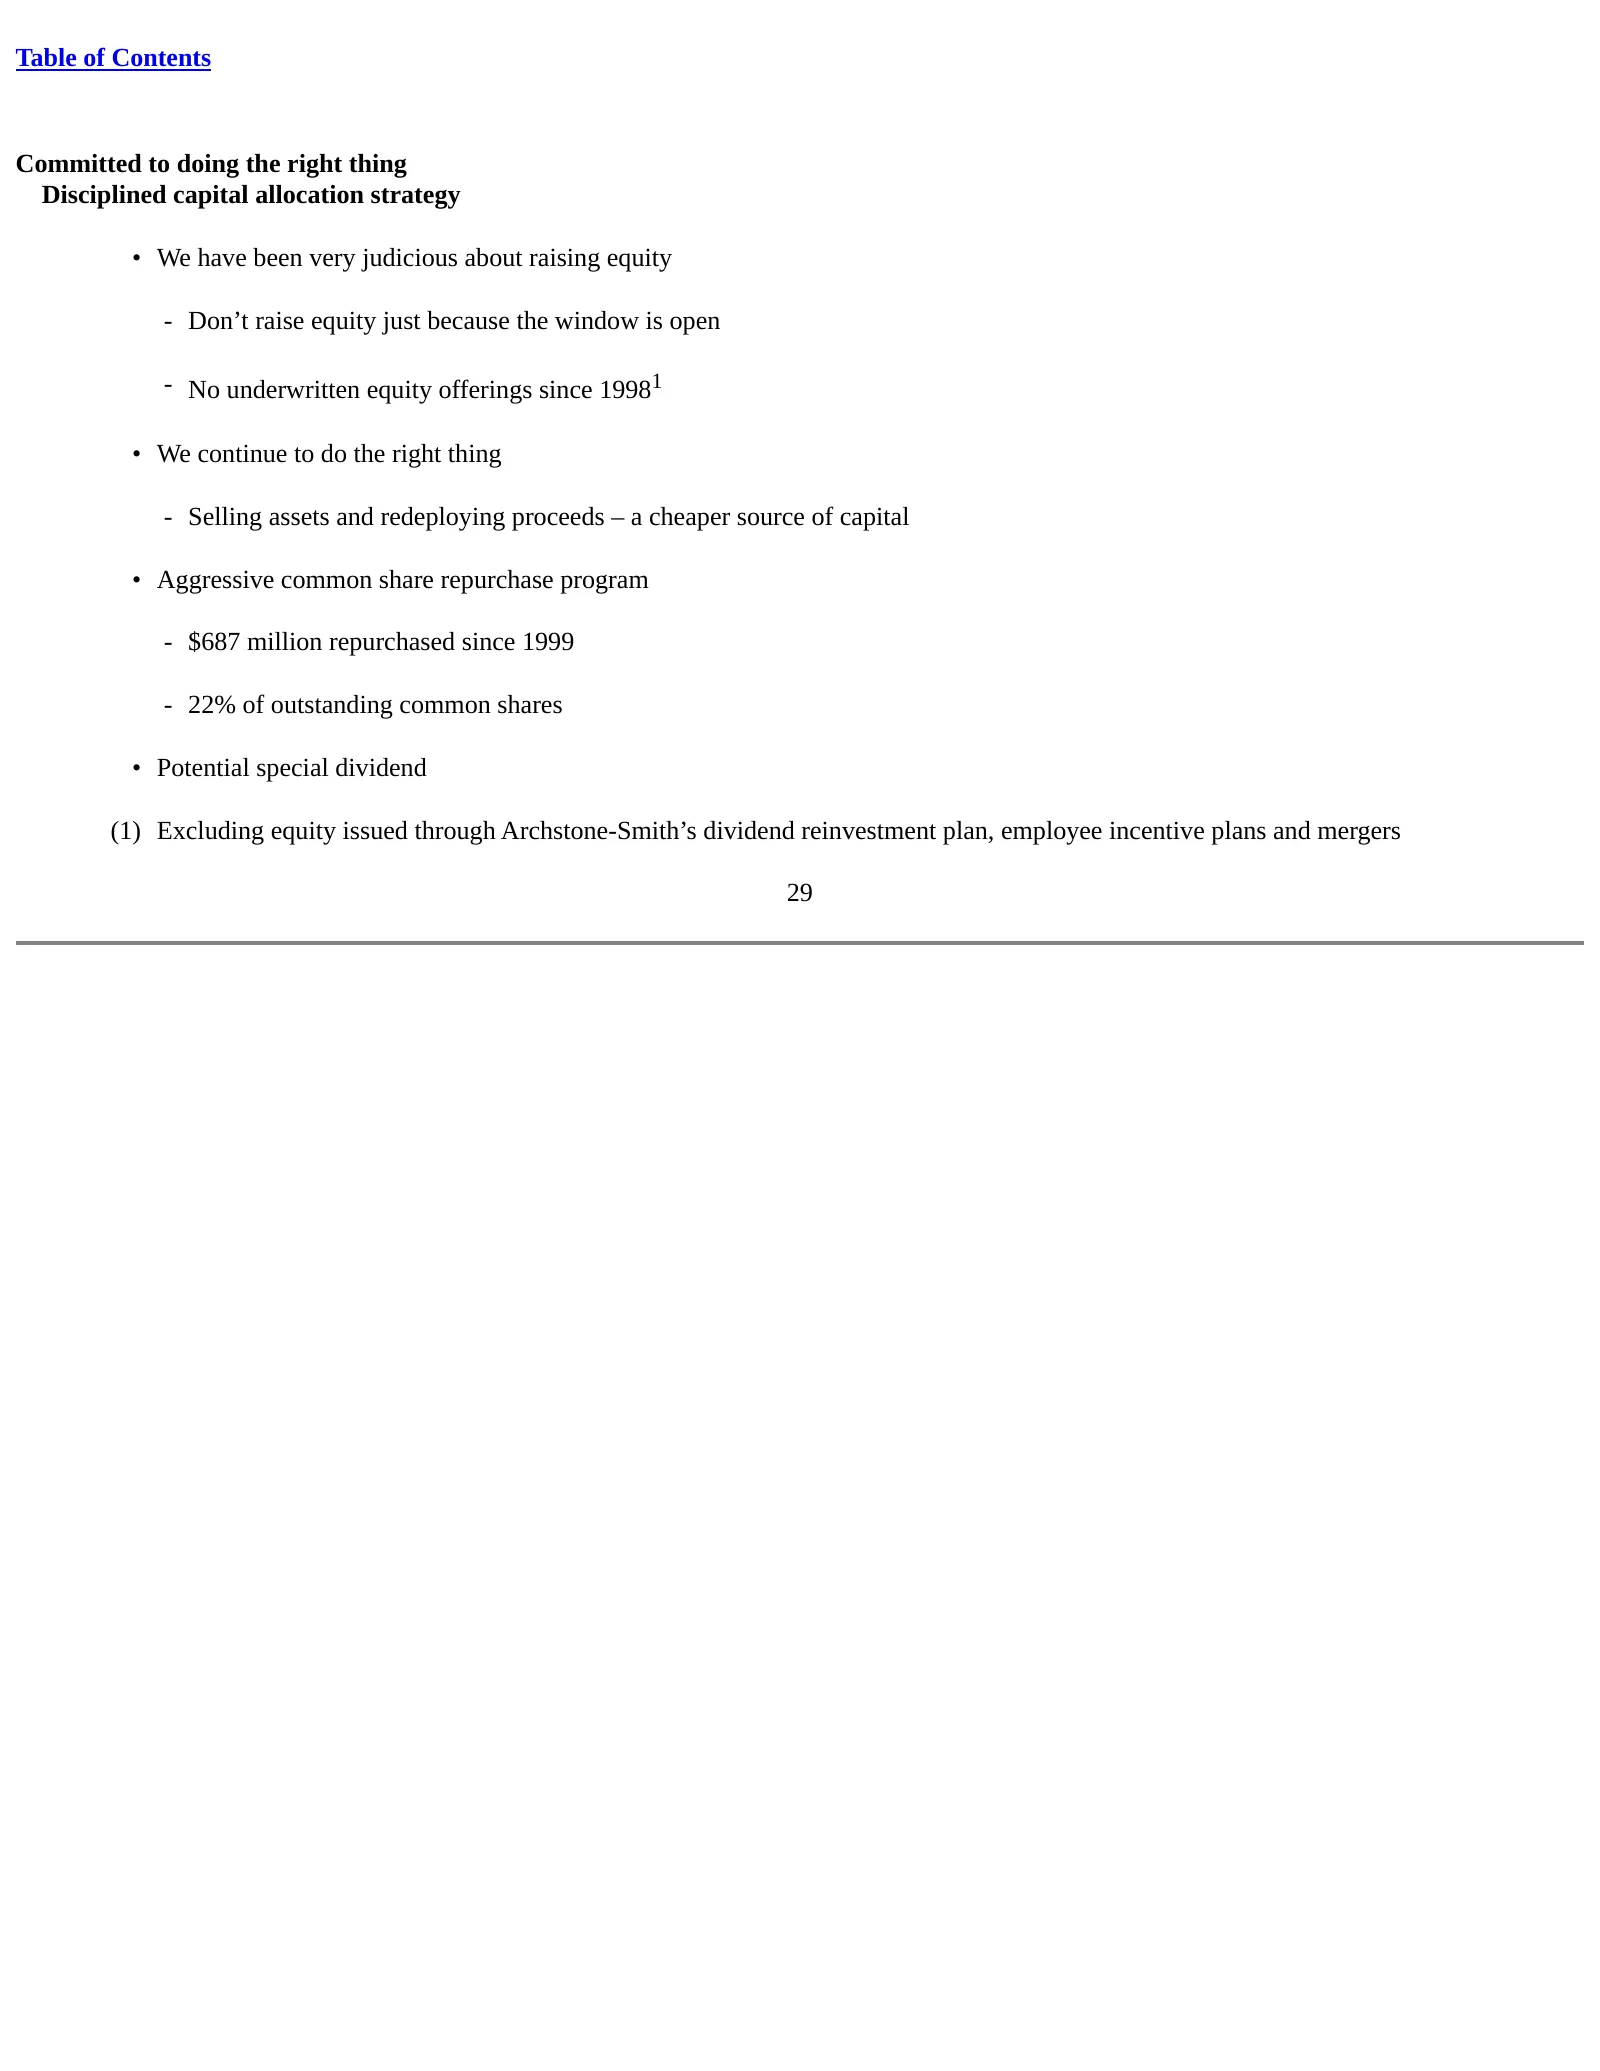
Table of Contents Committed to doing the right thing Disciplined capital allocation strategy • We have been very judicious about raising equity - Don’t raise equity just because the window is open - No underwritten equity offerings since 19981 • We continue to do the right thing - Selling assets and
Slide 30: ASN's Net Asset Value (NAV) per share
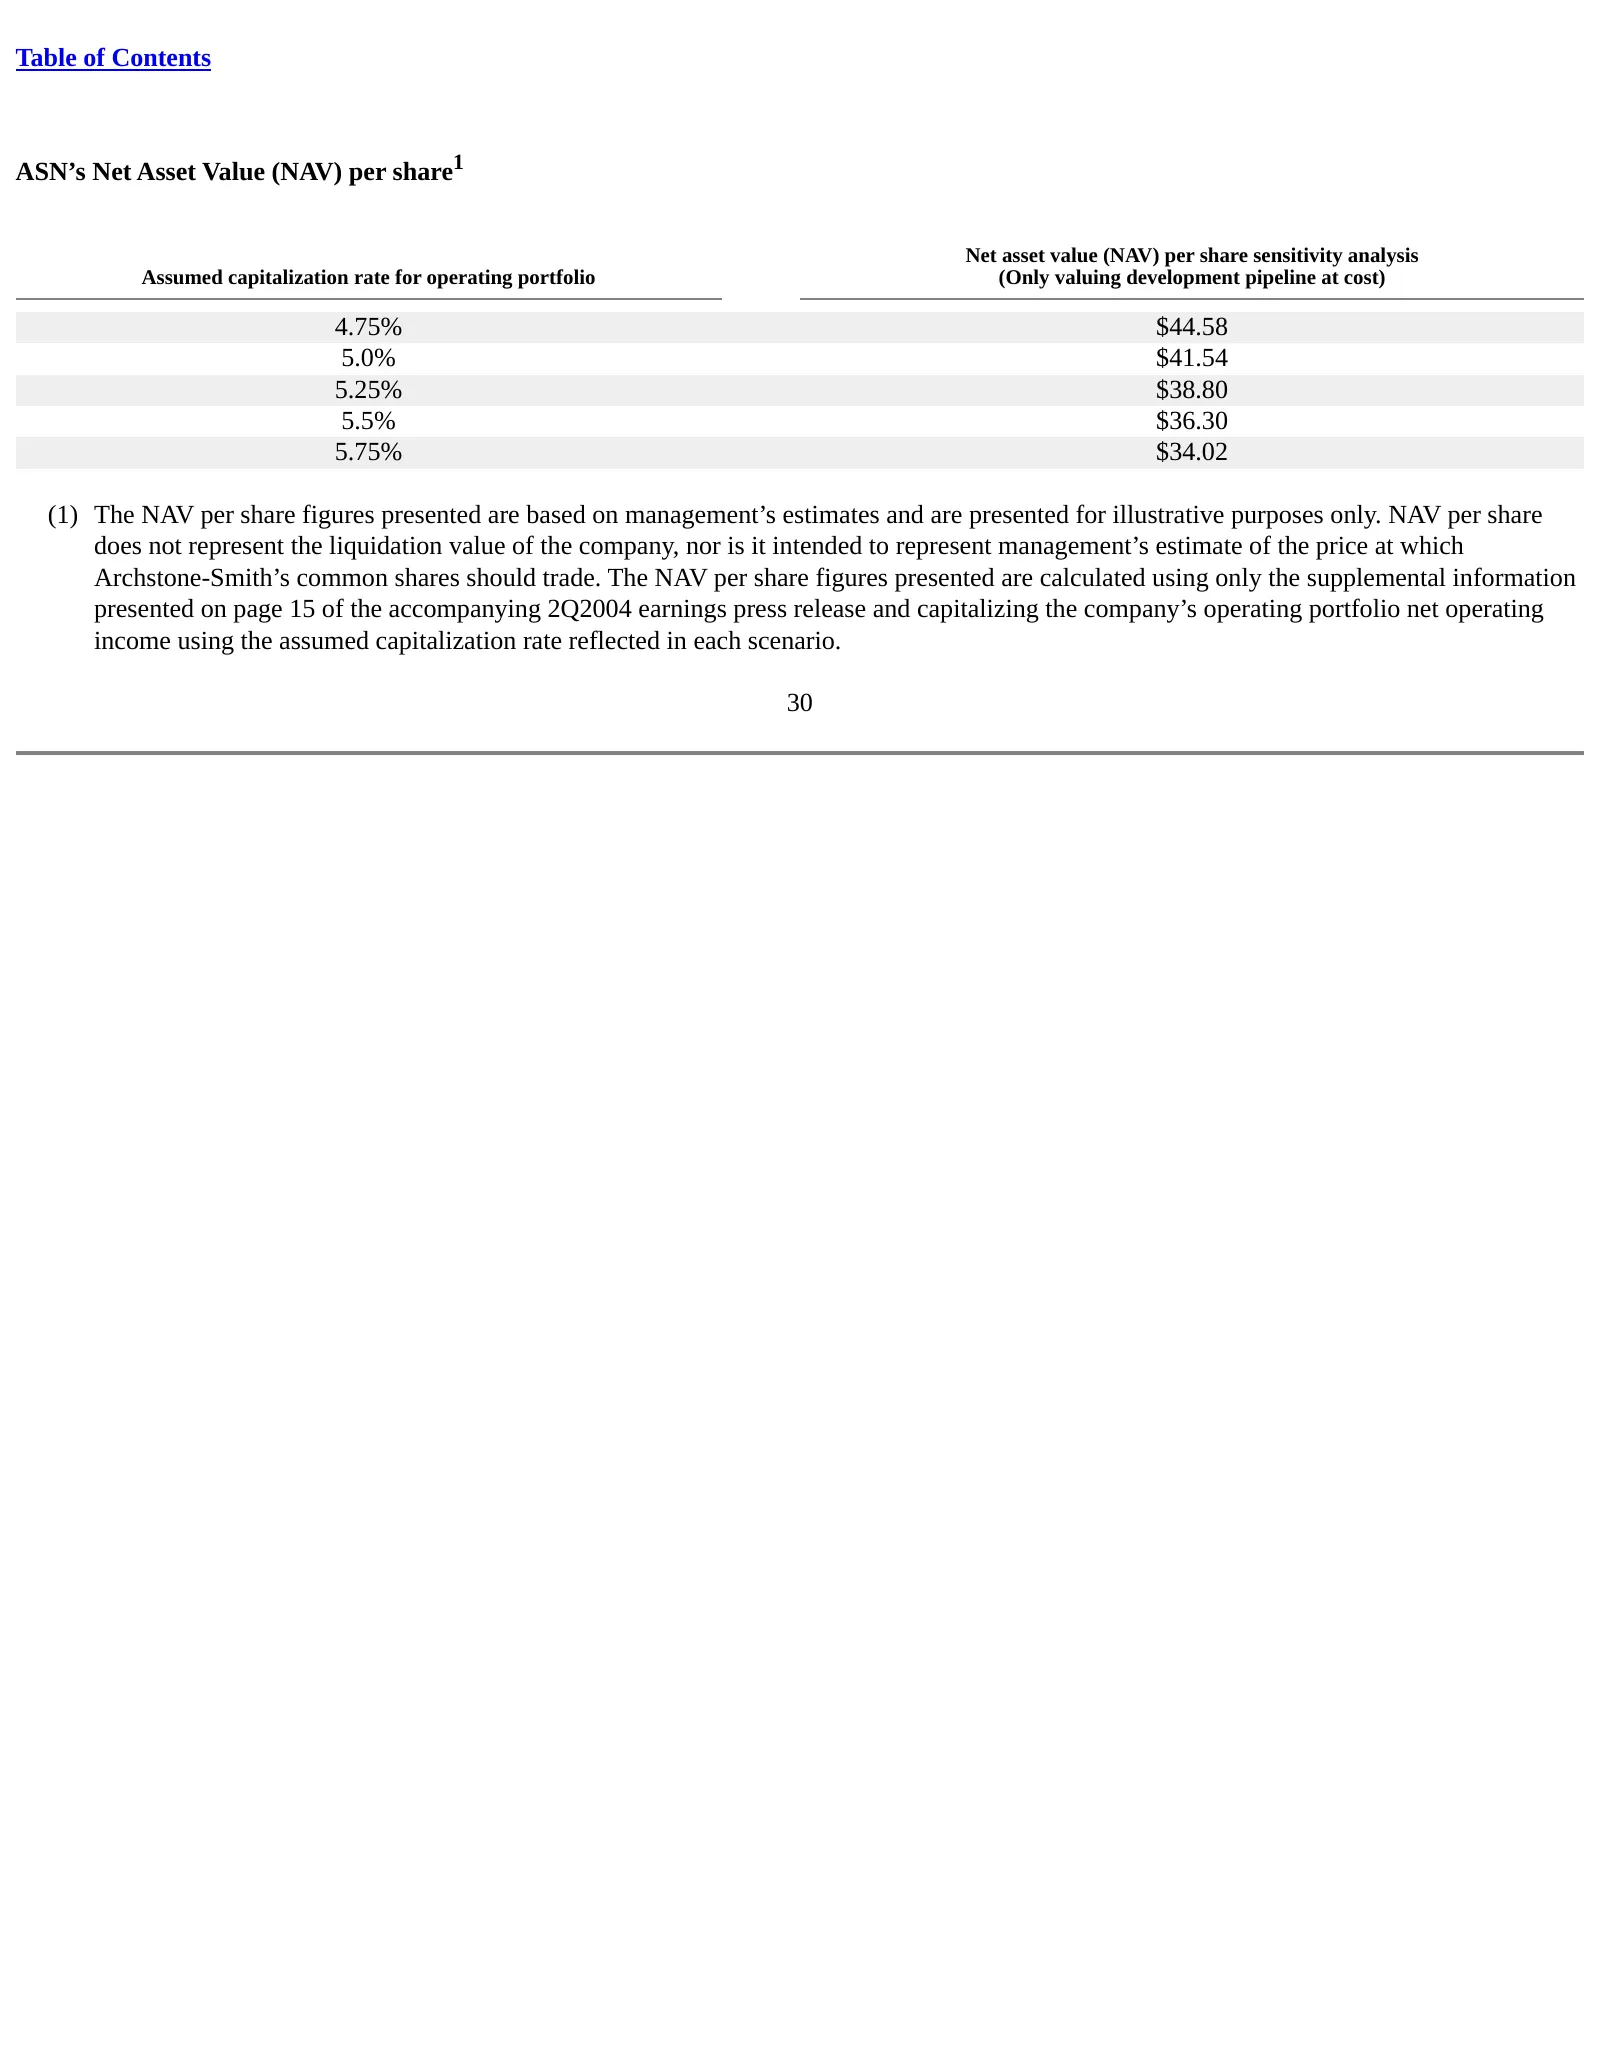
Table of Contents ASN’s Net Asset Value (NAV) per share1 Net asset value (NAV) per share sensitivity analysis Assumed capitalization rate for operating portfolio (Only valuing development pipeline at cost) 4.75% $44.58 5.0% $41.54 5.25% $38.80 5.5% $36.30 5.75% $34.02 (1) The NAV per share figures p
Slide 31: Strong balance sheet and financial flexibility
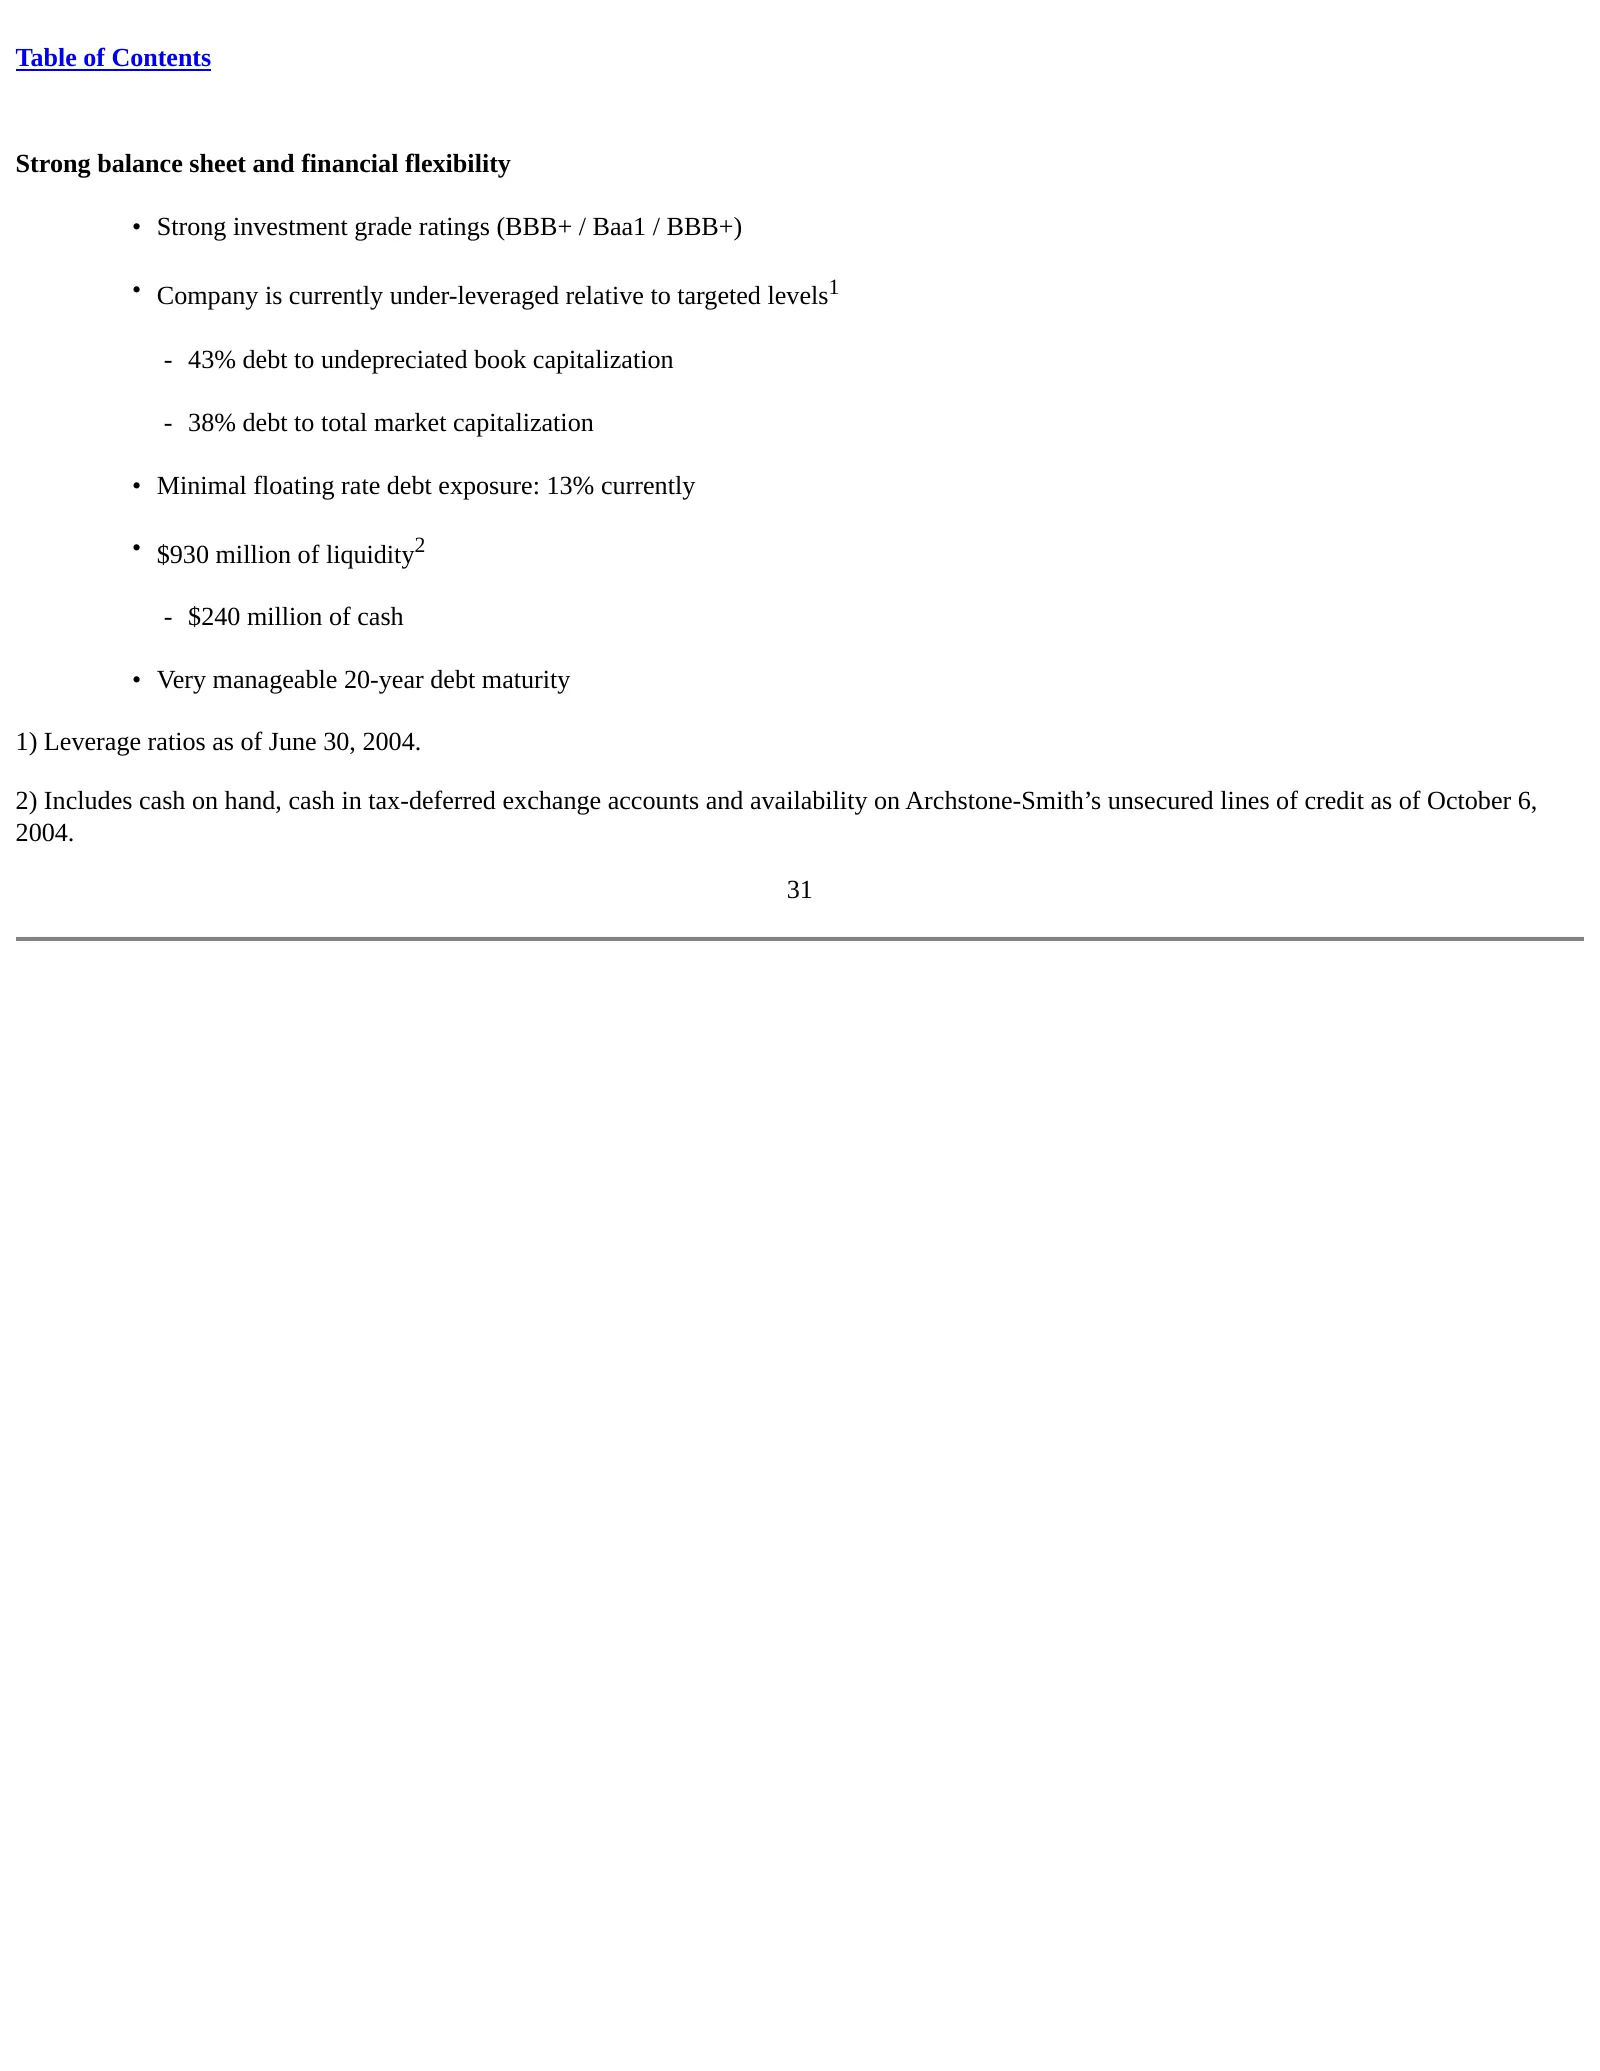
Table of Contents Strong balance sheet and financial flexibility • Strong investment grade ratings (BBB+ / Baa1 / BBB+) • Company is currently under-leveraged relative to targeted levels1 - 43% debt to undepreciated book capitalization - 38% debt to total market capitalization • Minimal floating rat
Slide 32: Strong financial controls
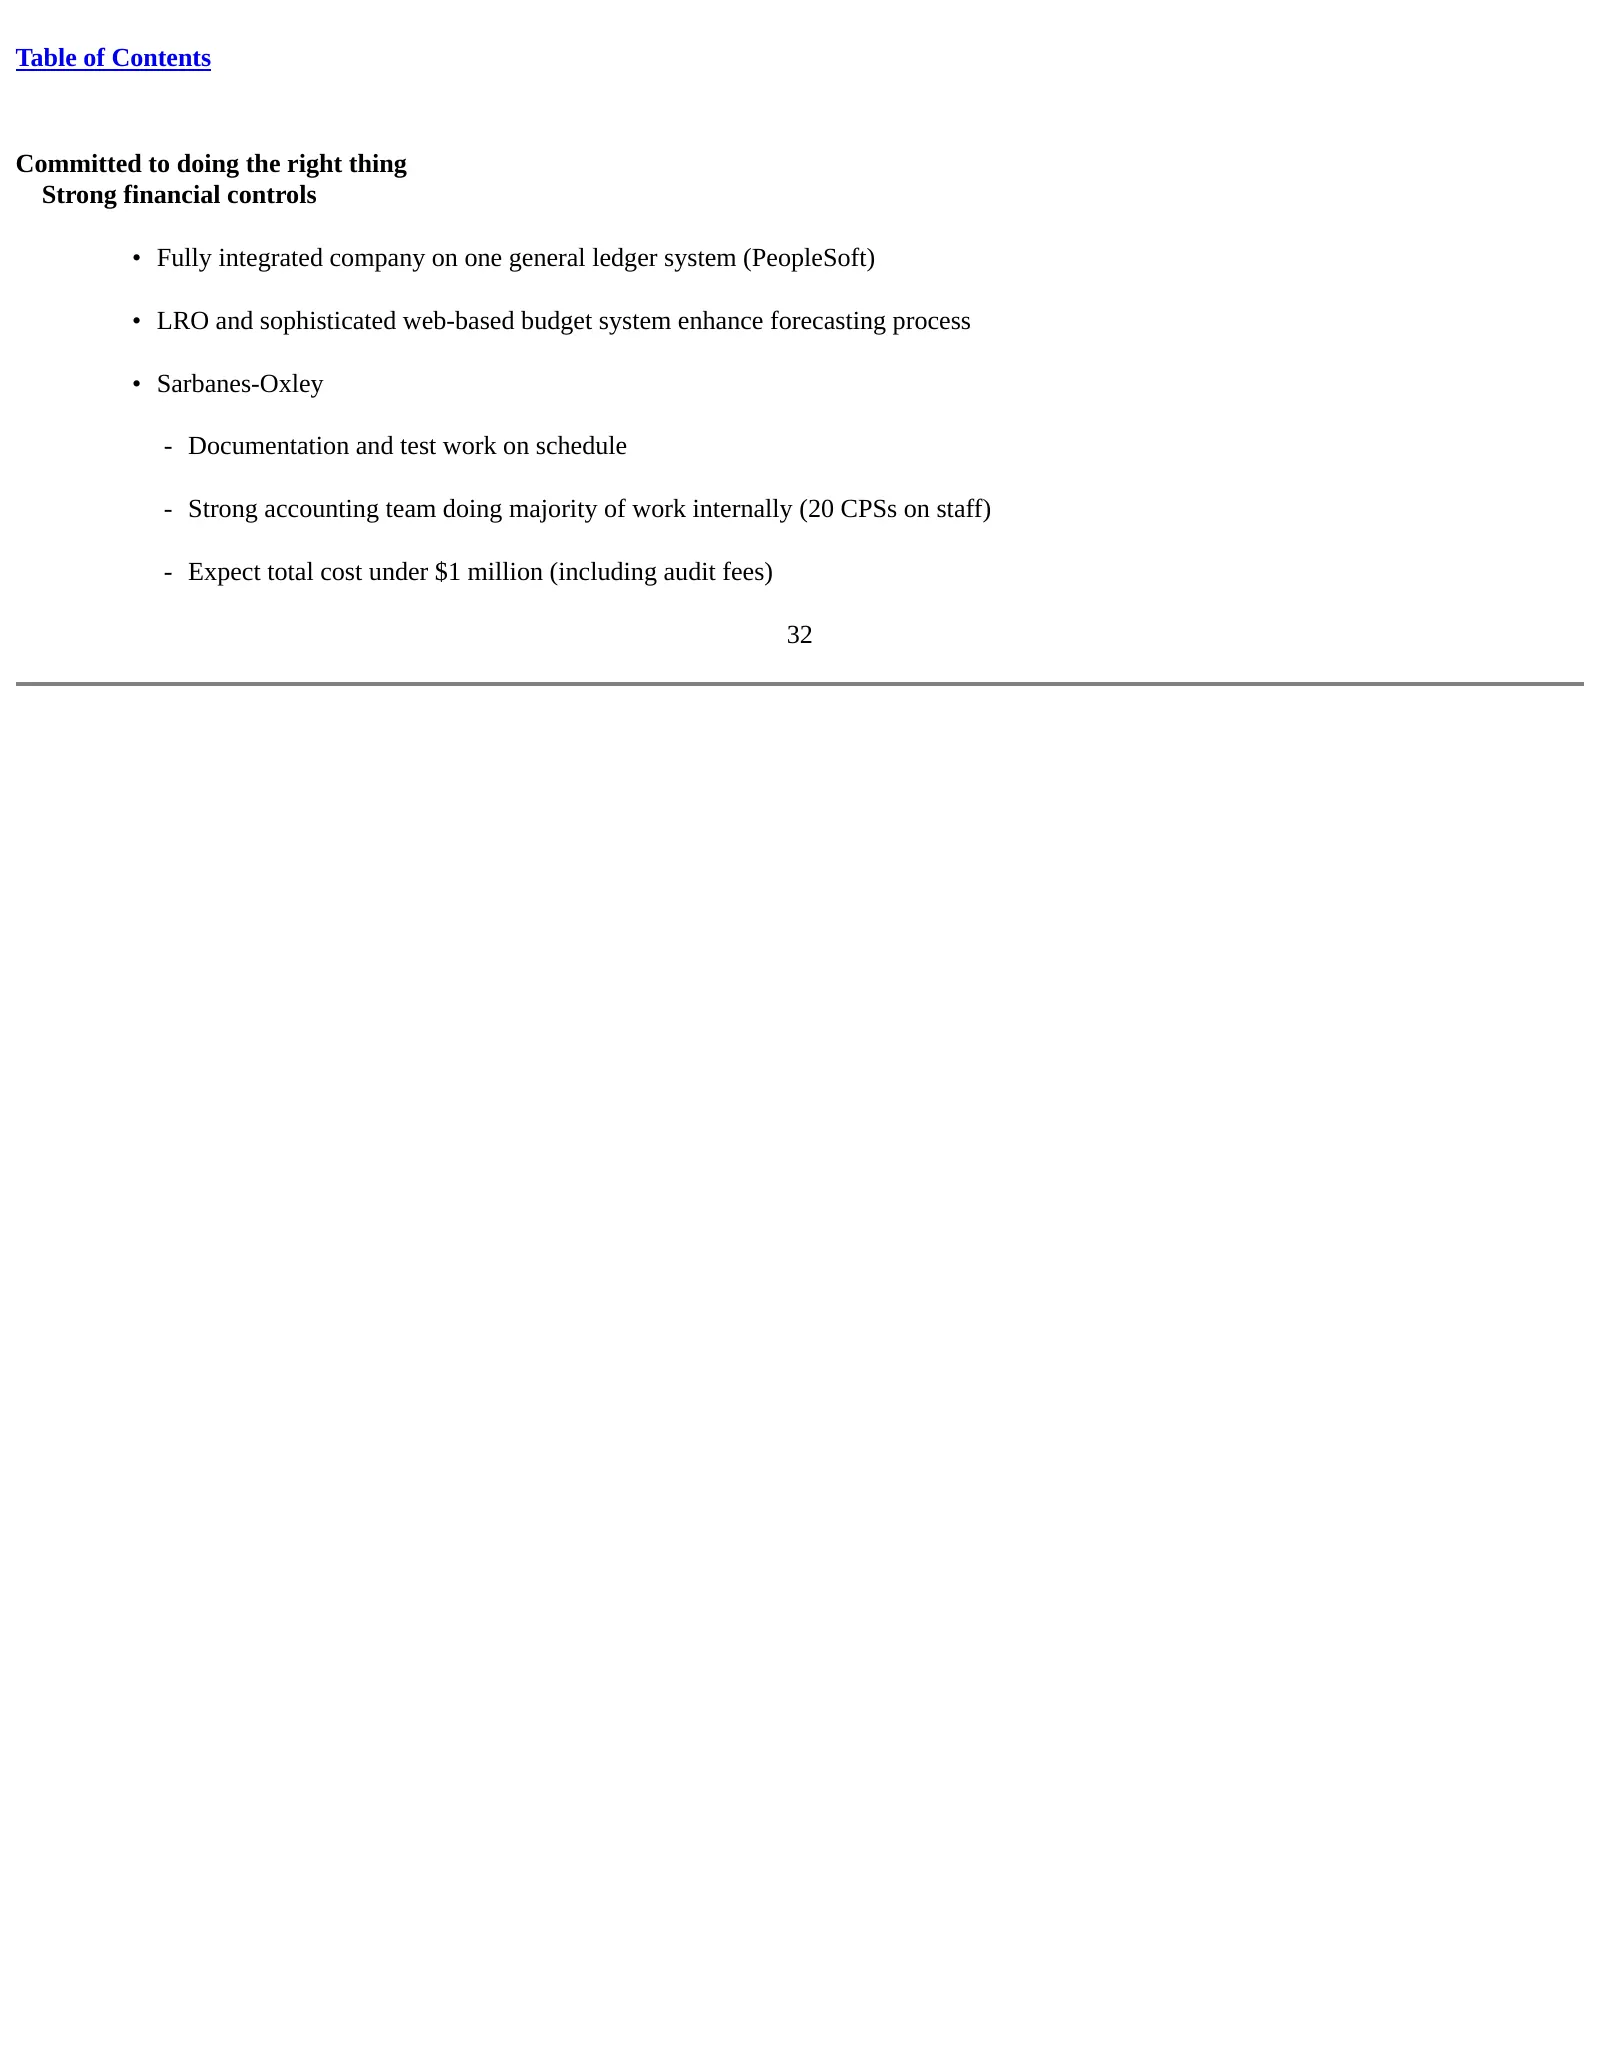
Table of Contents Committed to doing the right thing Strong financial controls • Fully integrated company on one general ledger system (PeopleSoft) • LRO and sophisticated web-based budget system enhance forecasting process • Sarbanes-Oxley - Documentation and test work on schedule - Strong accounti
Slide 33: Strong corporate governance
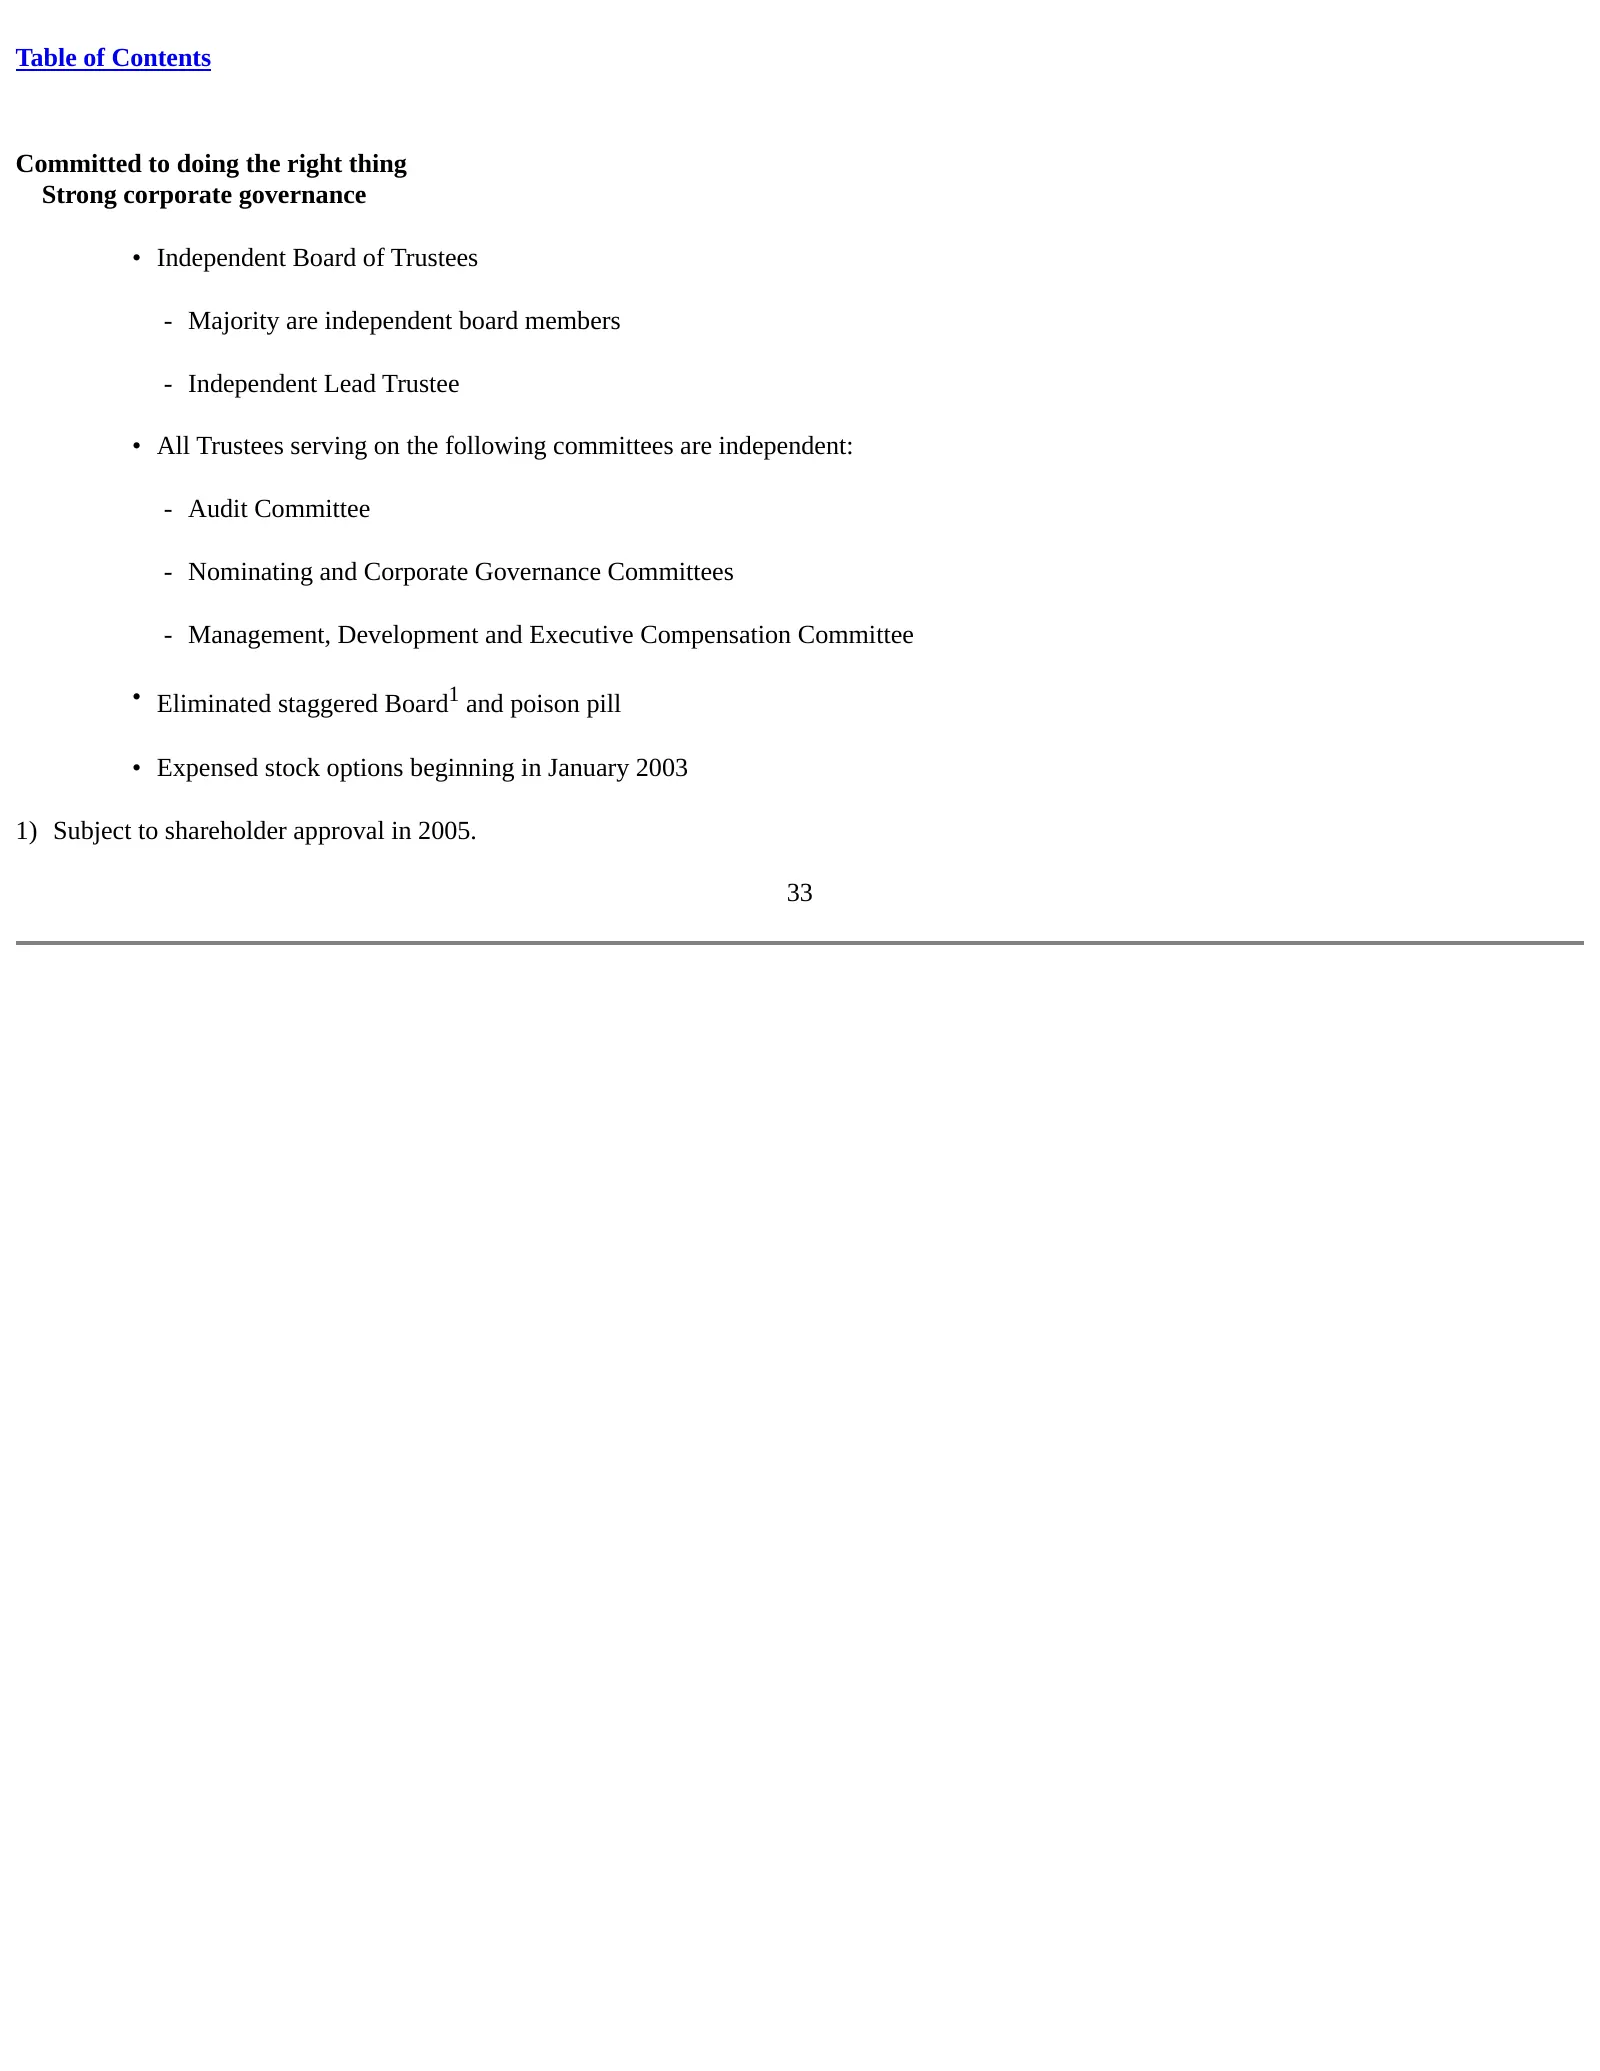
Table of Contents Committed to doing the right thing Strong corporate governance • Independent Board of Trustees - Majority are independent board members - Independent Lead Trustee • All Trustees serving on the following committees are independent: - Audit Committee - Nominating and Corporate Govern
Slide 34: Archstone-Smith 2005 growth drivers
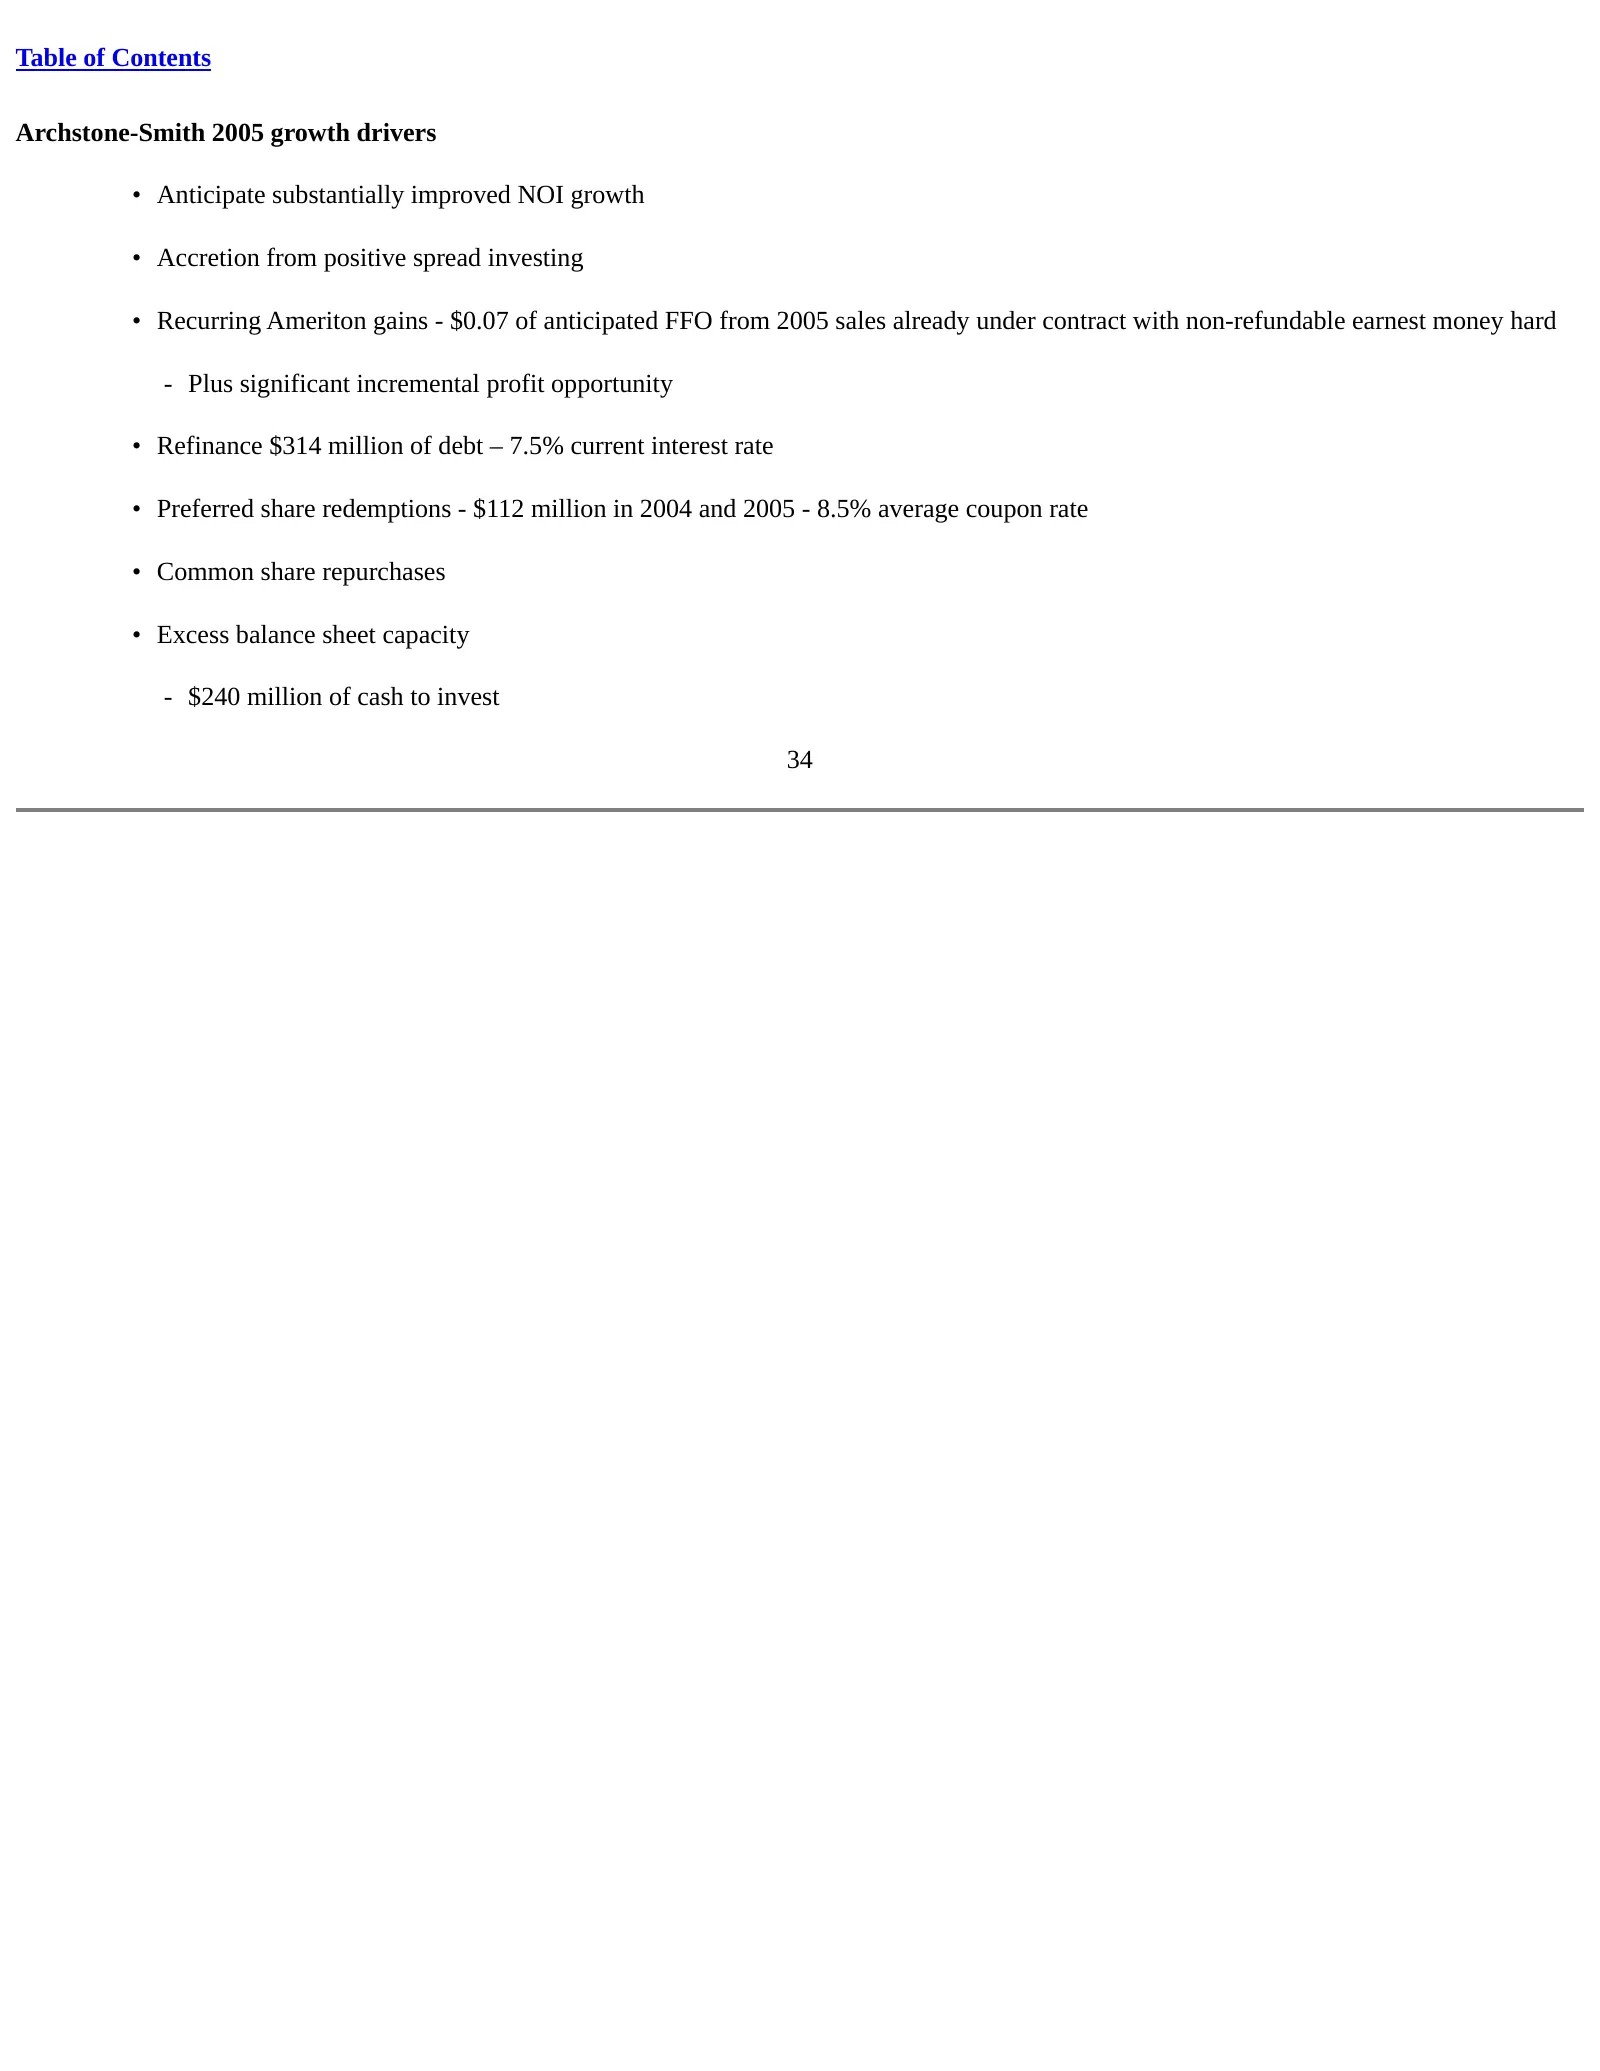
Table of Contents Archstone-Smith 2005 growth drivers • Anticipate substantially improved NOI growth • Accretion from positive spread investing • Recurring Ameriton gains - $0.07 of anticipated FFO from 2005 sales already under contract with non-refundable earnest money hard - Plus significant incre
Slide 35: Top reasons why we believe shares are undervalued
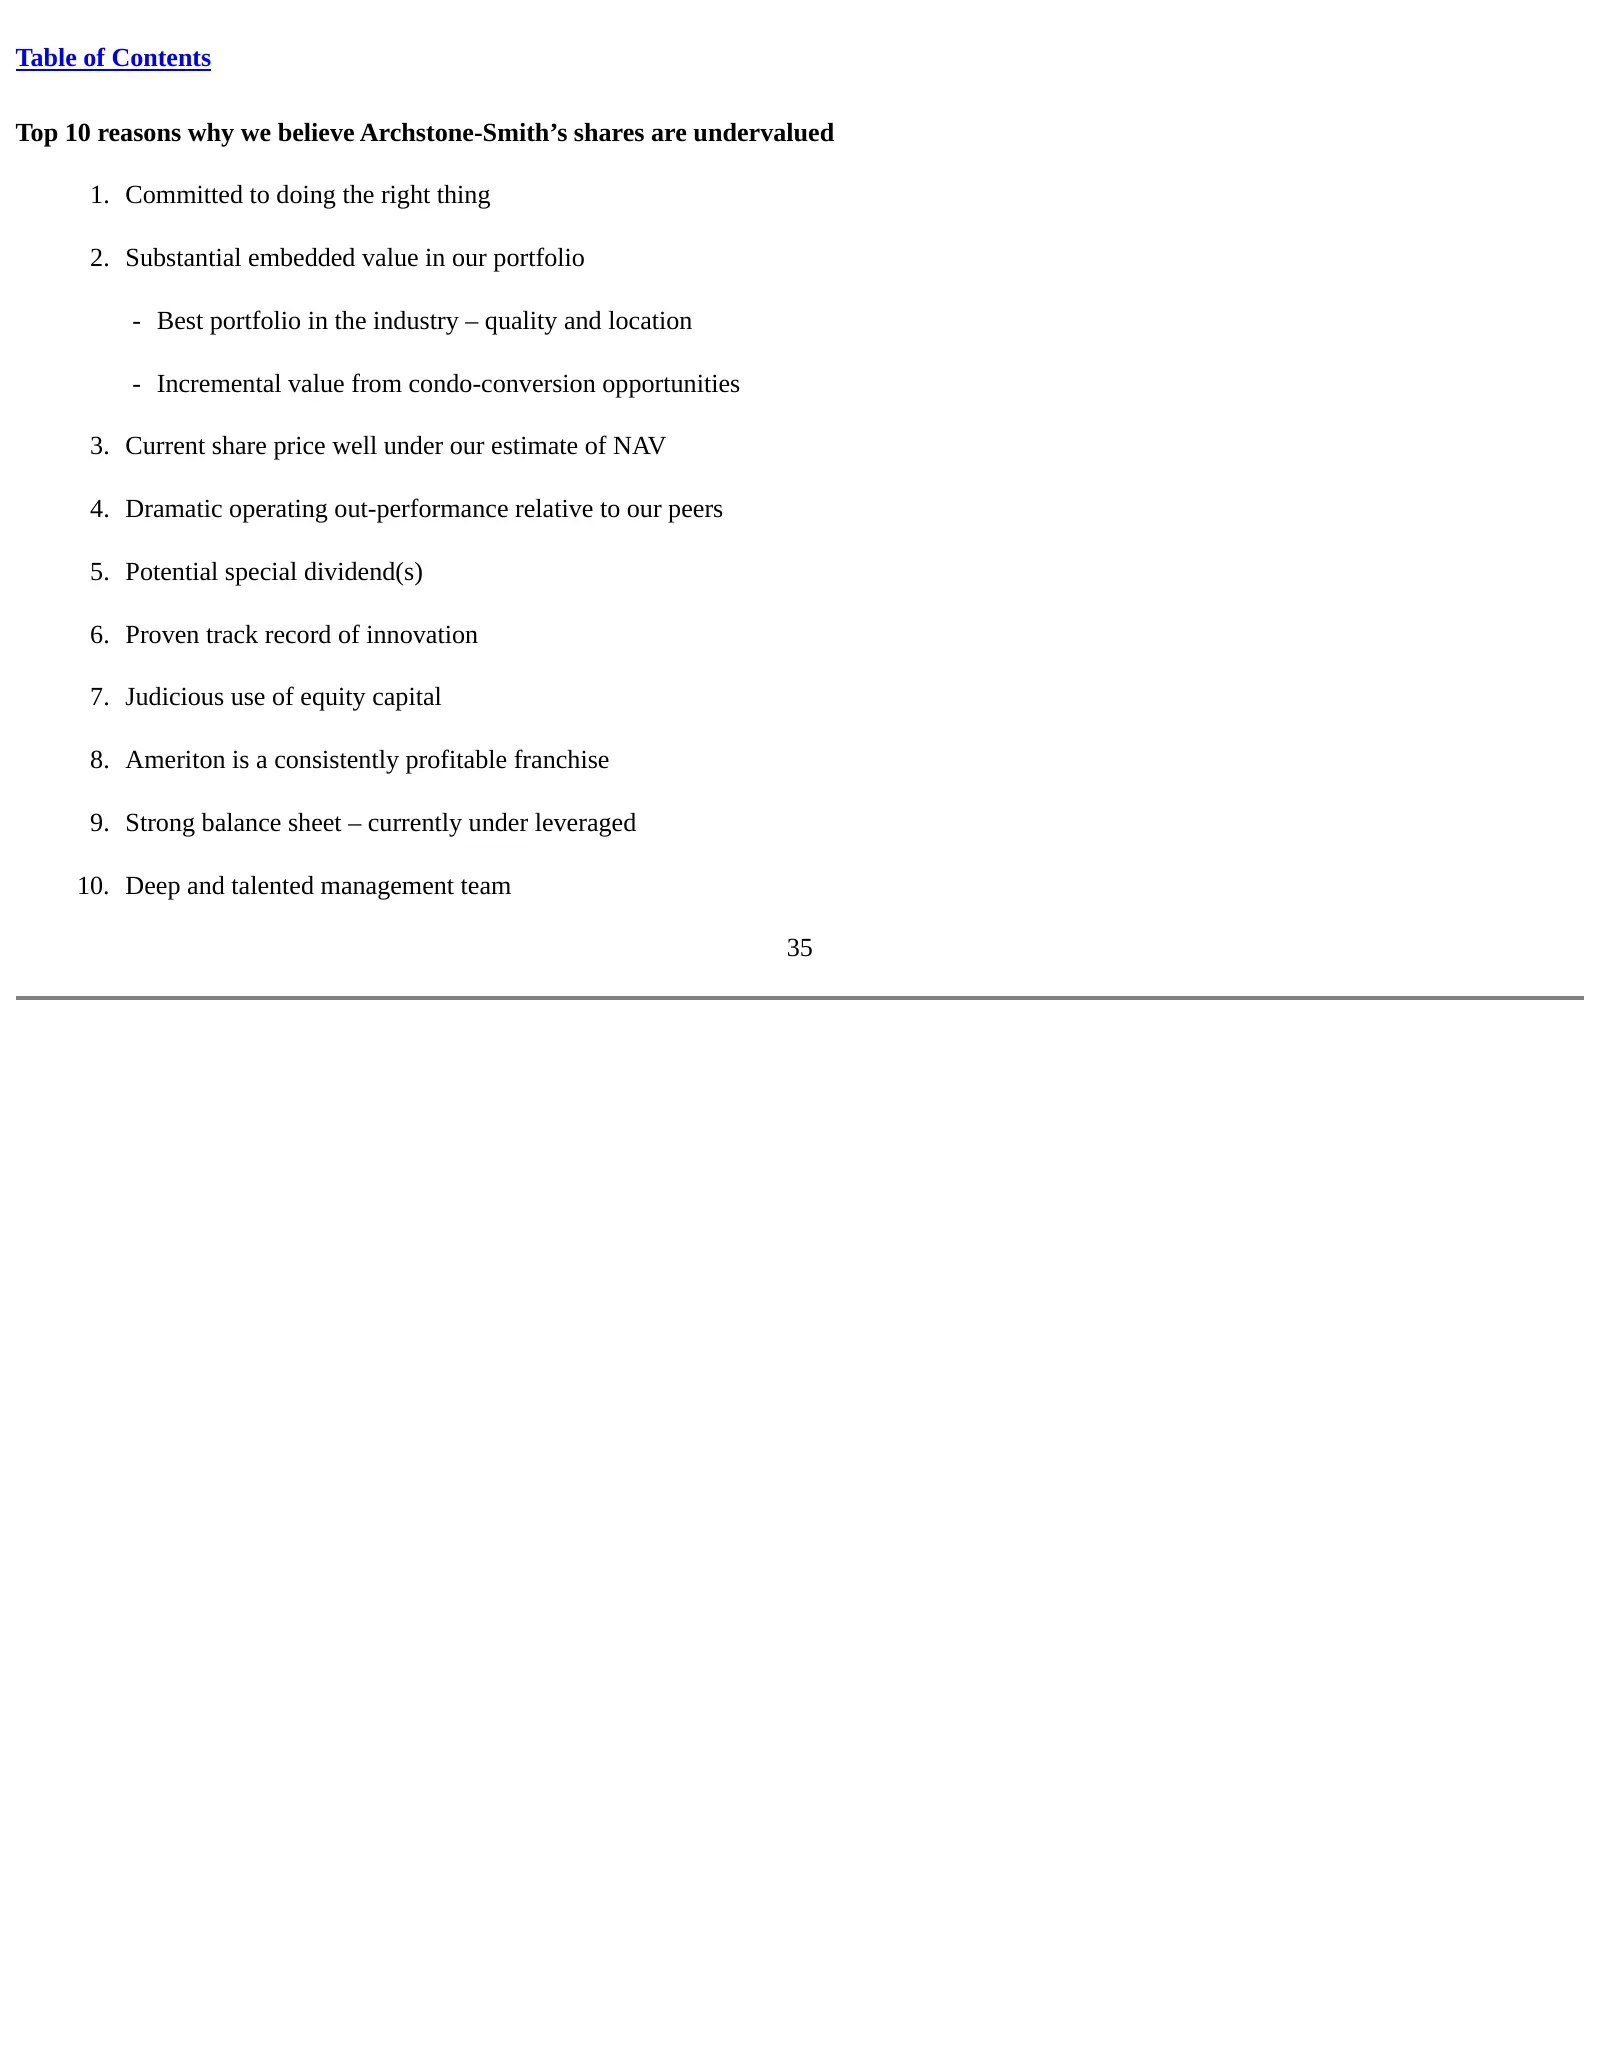
Table of Contents Top 10 reasons why we believe Archstone-Smith’s shares are undervalued 1. Committed to doing the right thing 2. Substantial embedded value in our portfolio - Best portfolio in the industry – quality and location - Incremental value from condo-conversion opportunities 3. Current sha

Slide 36: Archstone-Smith goals
Table of Contents Archstone-Smith goals • Trade well above our estimate of net asset value per share • Reinvent our industry • Build the Dominant Operating Platform • Respected member of corporate America – not just a great real estate company 36
Slide 37: Supplemental information and reconciliation
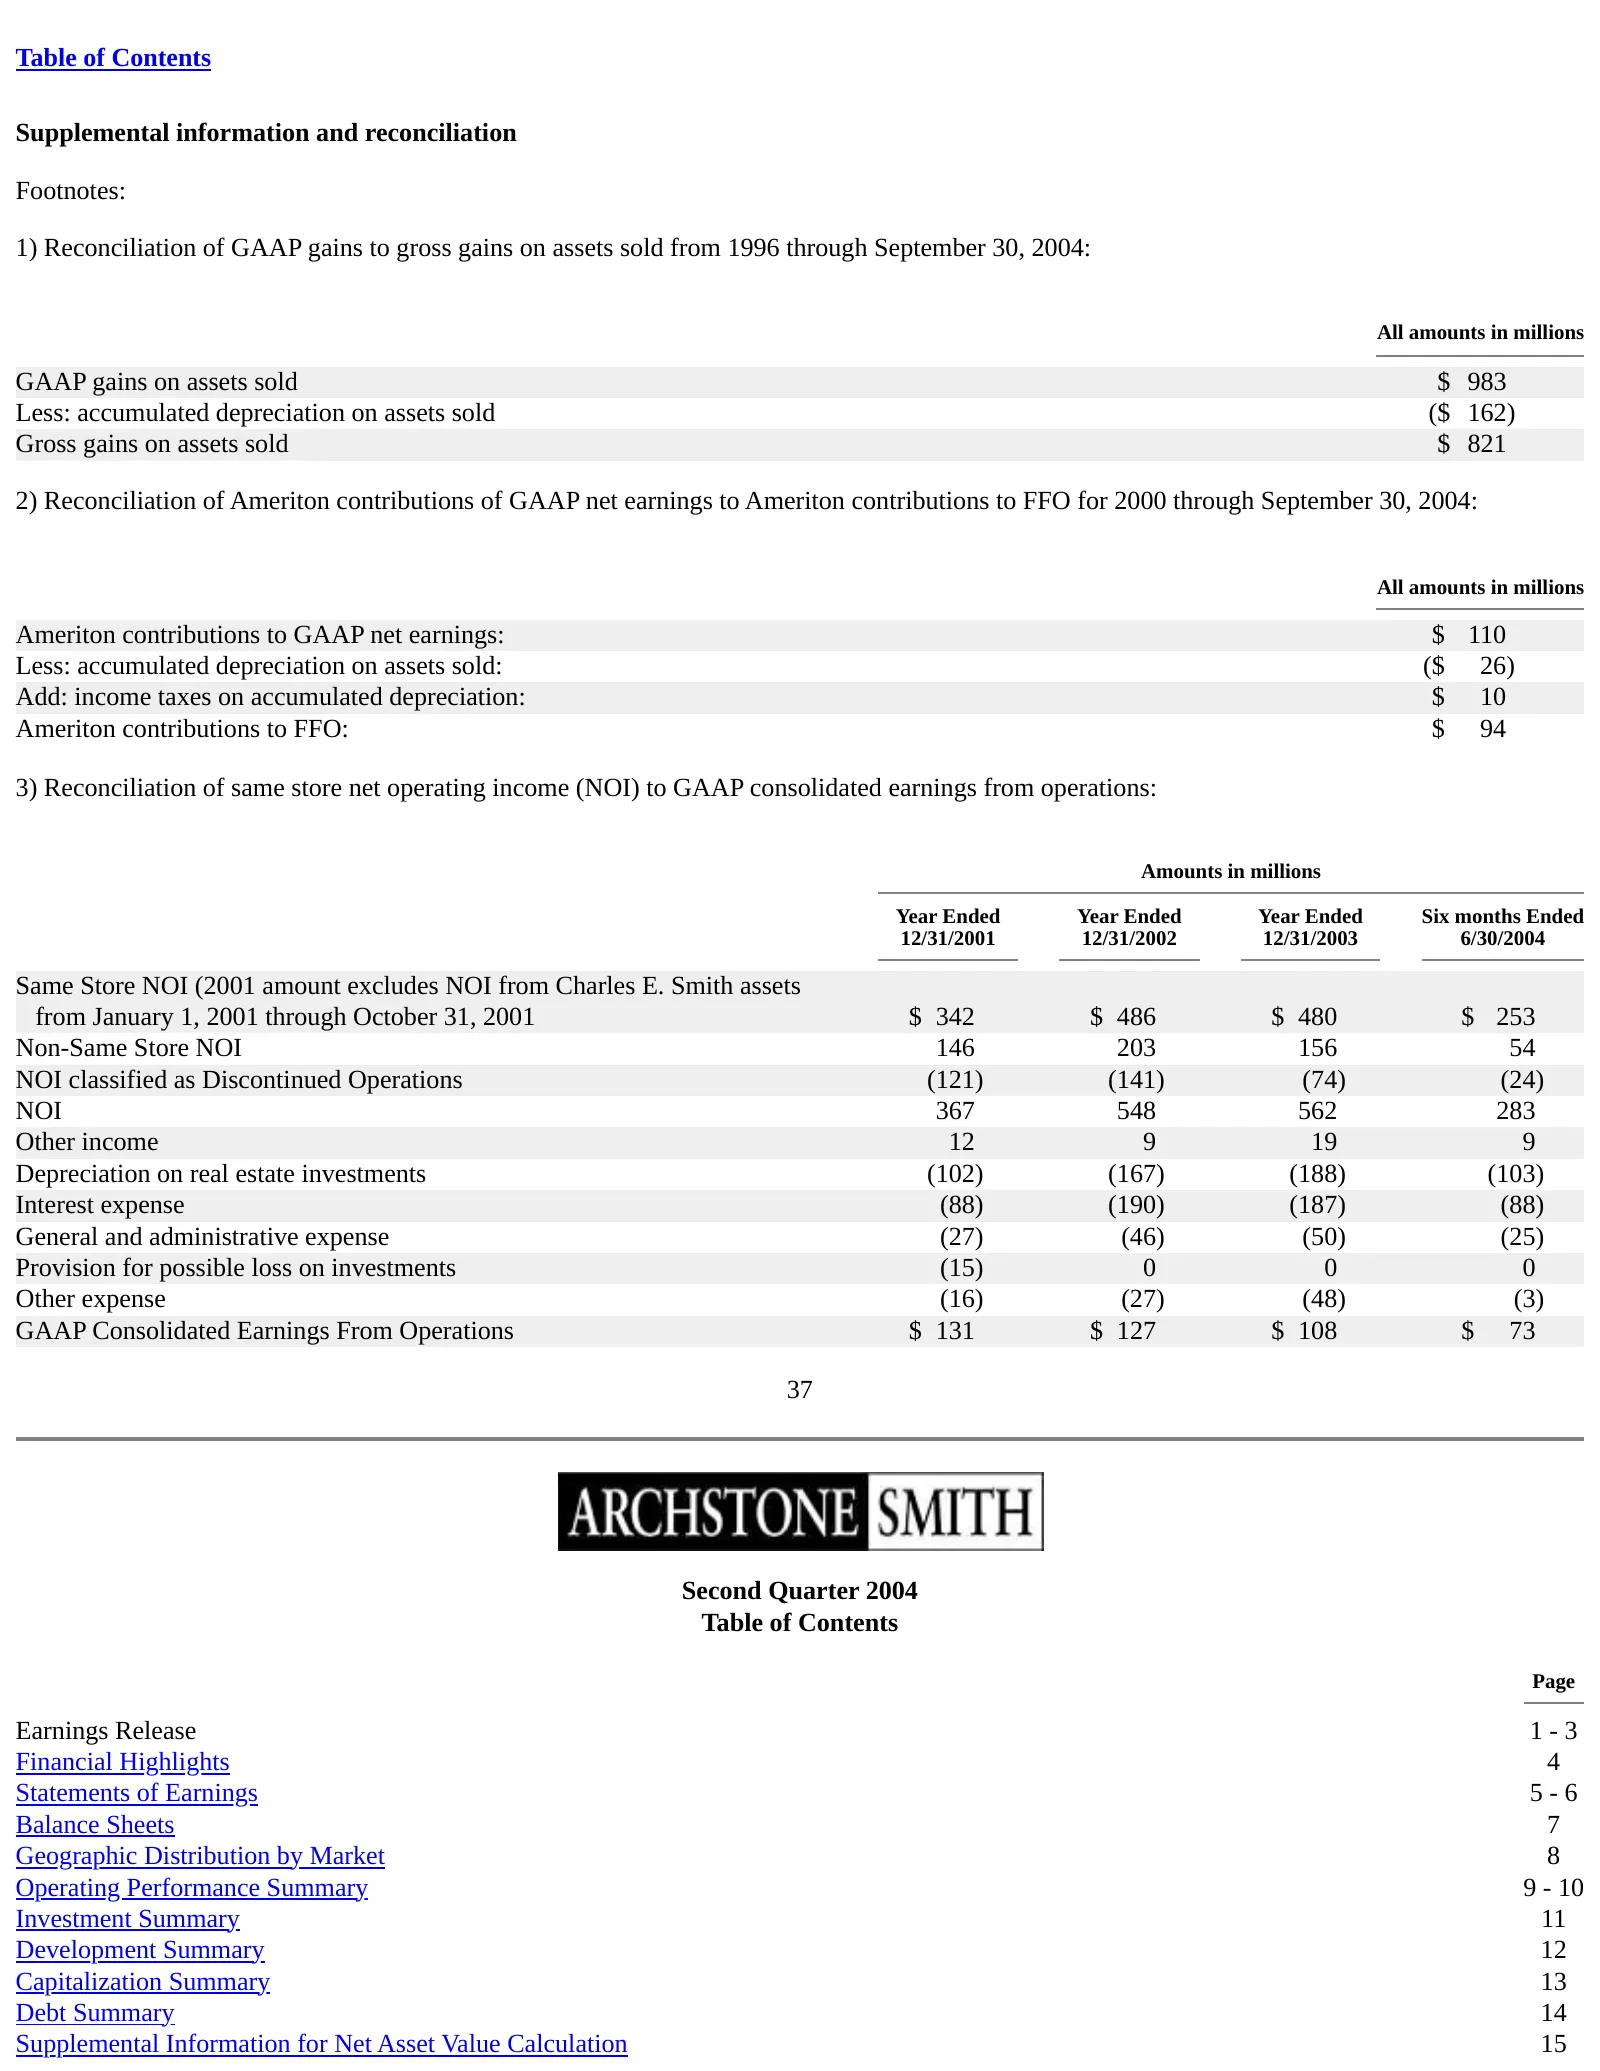
Table of Contents Supplemental information and reconciliation Footnotes: 1) Reconciliation of GAAP gains to gross gains on assets sold from 1996 through September 30, 2004: All amounts in millions GAAP gains on assets sold $ 983 Less: accumulated depreciation on assets sold ($ 162) Gross gains on as

Slide 38: Corporate Headquarters / non-GAAP note
Corporate Headquarters Address: 9200 E. Panorama Circle, Suite 400 Englewood, Colorado (303) 708-5959 Note: This press release supplement contains certain non-GAAP financial measures that management believes are helpful in understanding our business, as further described within this press release su
Slide 39: Archstone-Smith Announces Second Quarter 2004 Results
Table of Contents News Release Contact: Jack R. Callison, Jr. 800-982-9293 • 303-708-5959 Archstone-Smith Announces Second Quarter 2004 Results DENVER — August 6, 2004 — Archstone-Smith (NYSE:ASN) announced today that its net earnings per share (EPS) for the quarter ended June 30, 2004, was $0.39 pe
Slide 40: Archstone-Smith Announces 2004 Results (page 2)
Table of Contents Archstone-Smith Announces 2004 Results Page 2 Company Continues to Repurchase Its Common Shares; Maintains Strong Financial Position Also during the second quarter, Archstone-Smith repurchased 1.9 million of its common shares at an average price of $27.09, representing a total inve
Slide 41: Rental rates vs. cost of owning in core markets
Table of Contents EXHIBIT 1 The cornerstone of Archstone-Smith's strategy is to invest in protected markets with very expensive home prices, which in turn substantially reduced competition for the company's product. The following data illustrates this point by depicting the significant spread that e
Slide 42: Second Quarter 2004 Financial Highlights
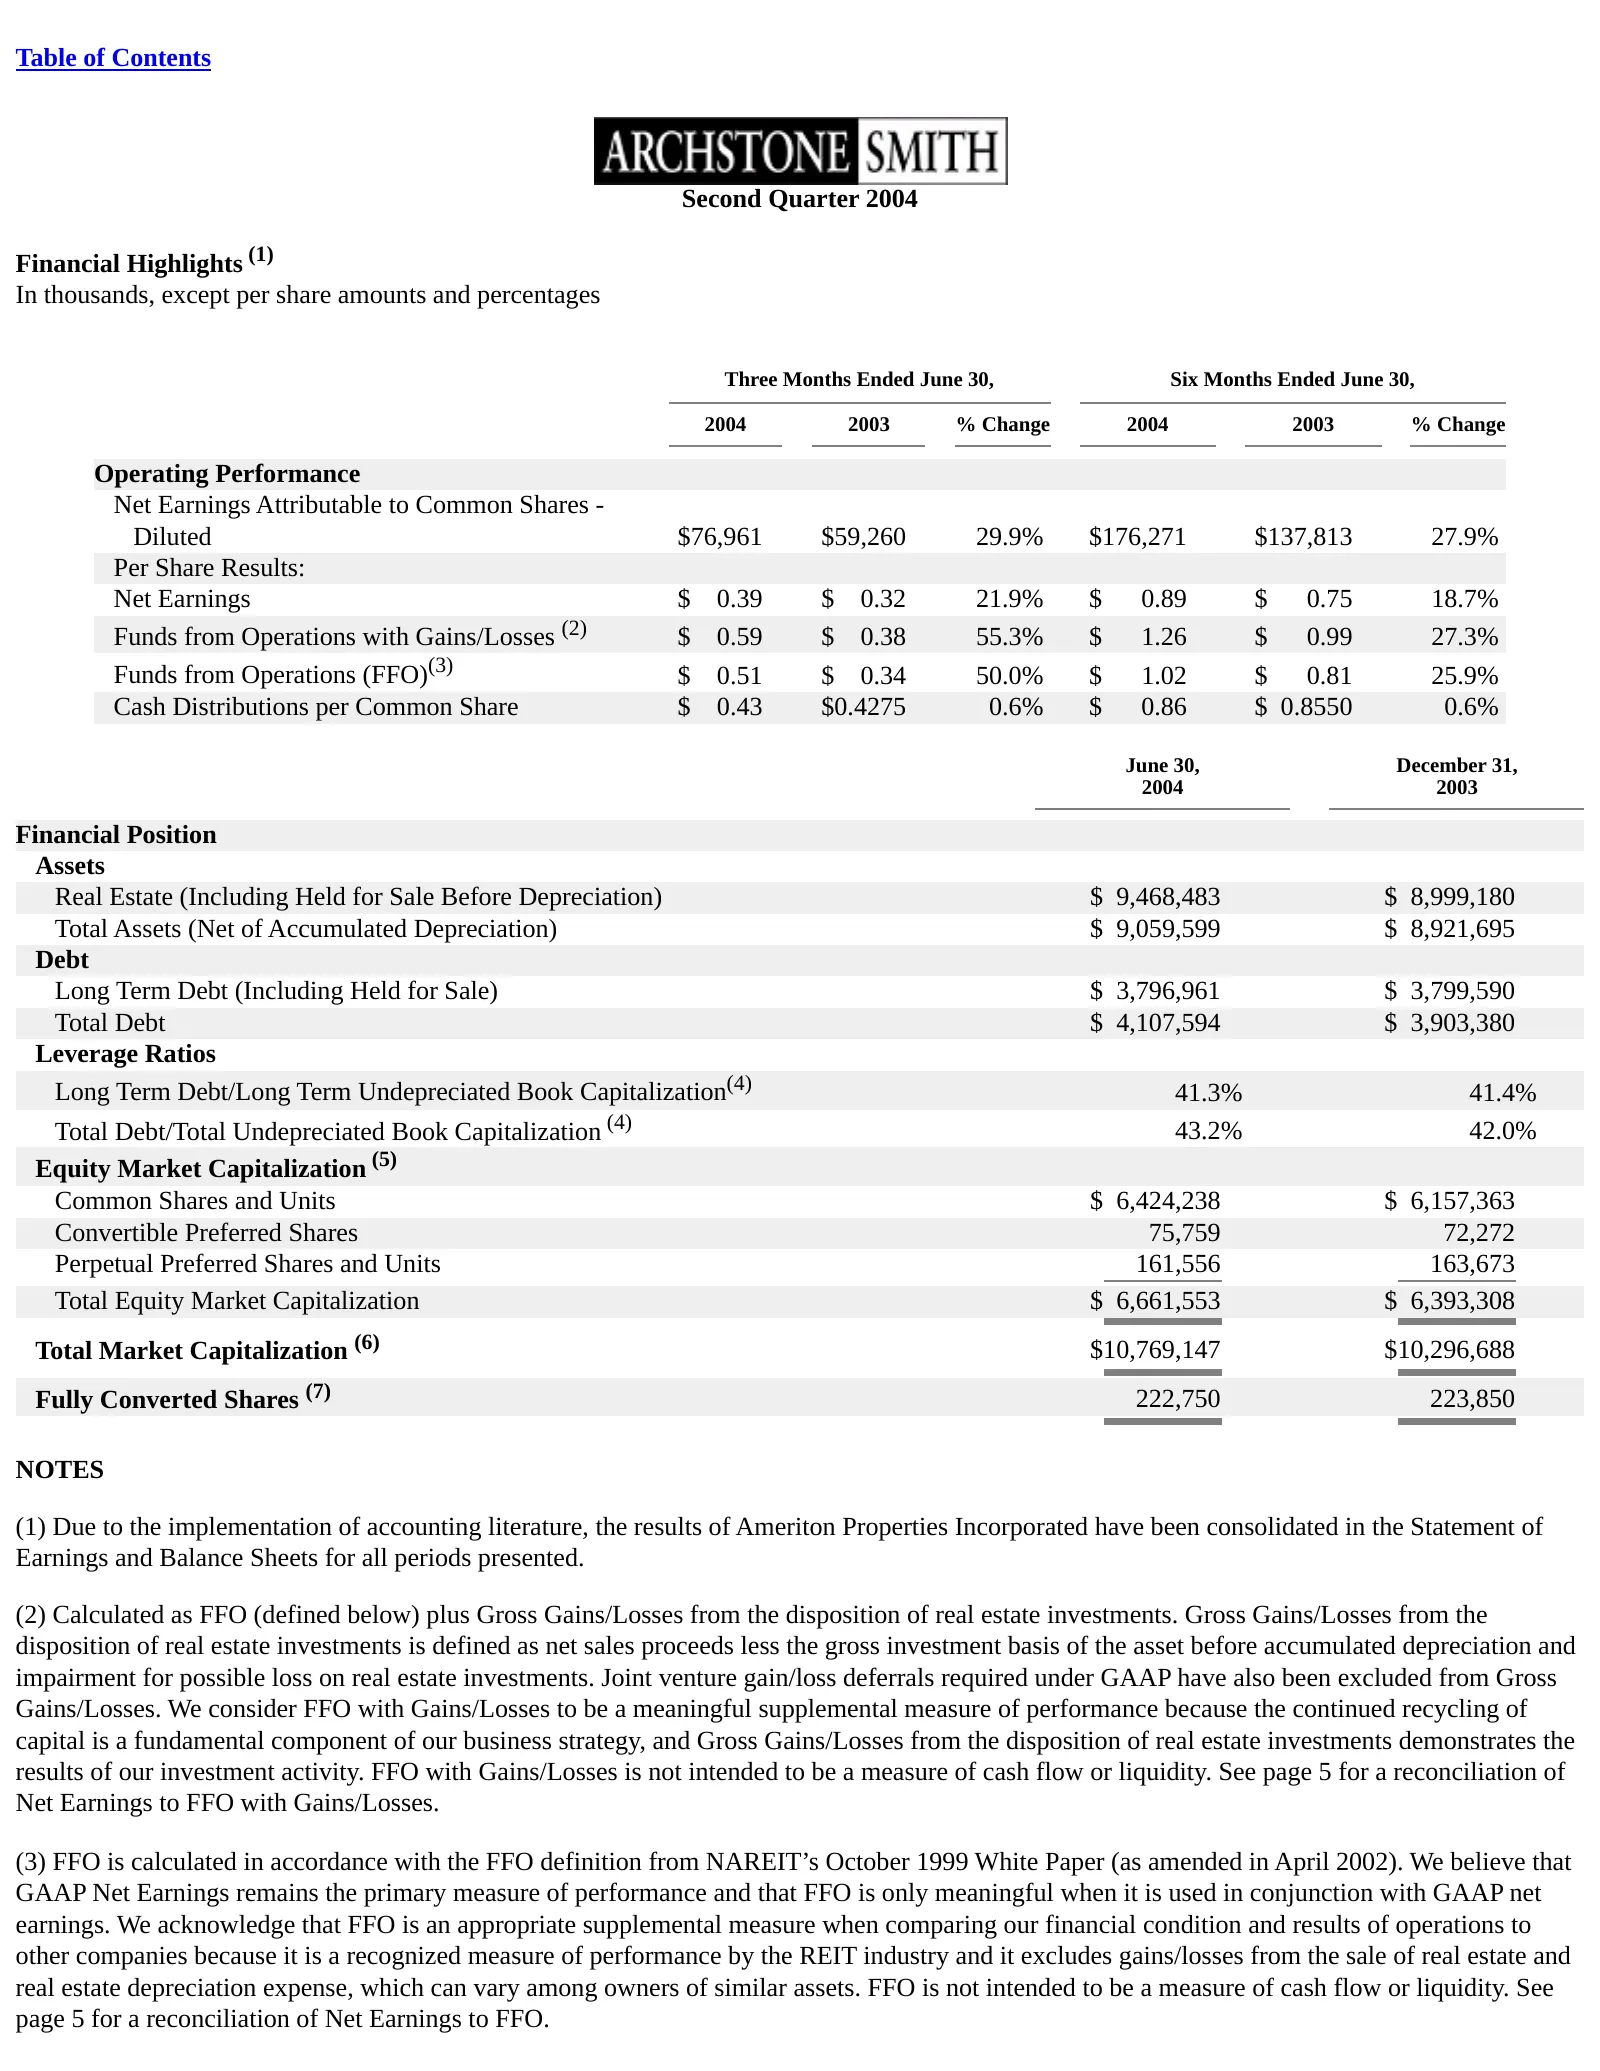
Table of Contents Second Quarter 2004 Financial Highlights (1) In thousands, except per share amounts and percentages Three Months Ended June 30, Six Months Ended June 30, 2004 2003 % Change 2004 2003 % Change Operating Performance Net Earnings Attributable to Common Shares - Diluted $76,961 $59,260

Slide 43: Financial highlights notes
(4) Represents total long term debt or total debt divided by the sum of shareholders’ equity, applicable debt, minority interest and accumulated depreciation, respectively. (5) Reflects the market capitalization based on the closing share price on the last trading day of the period for publicly trad
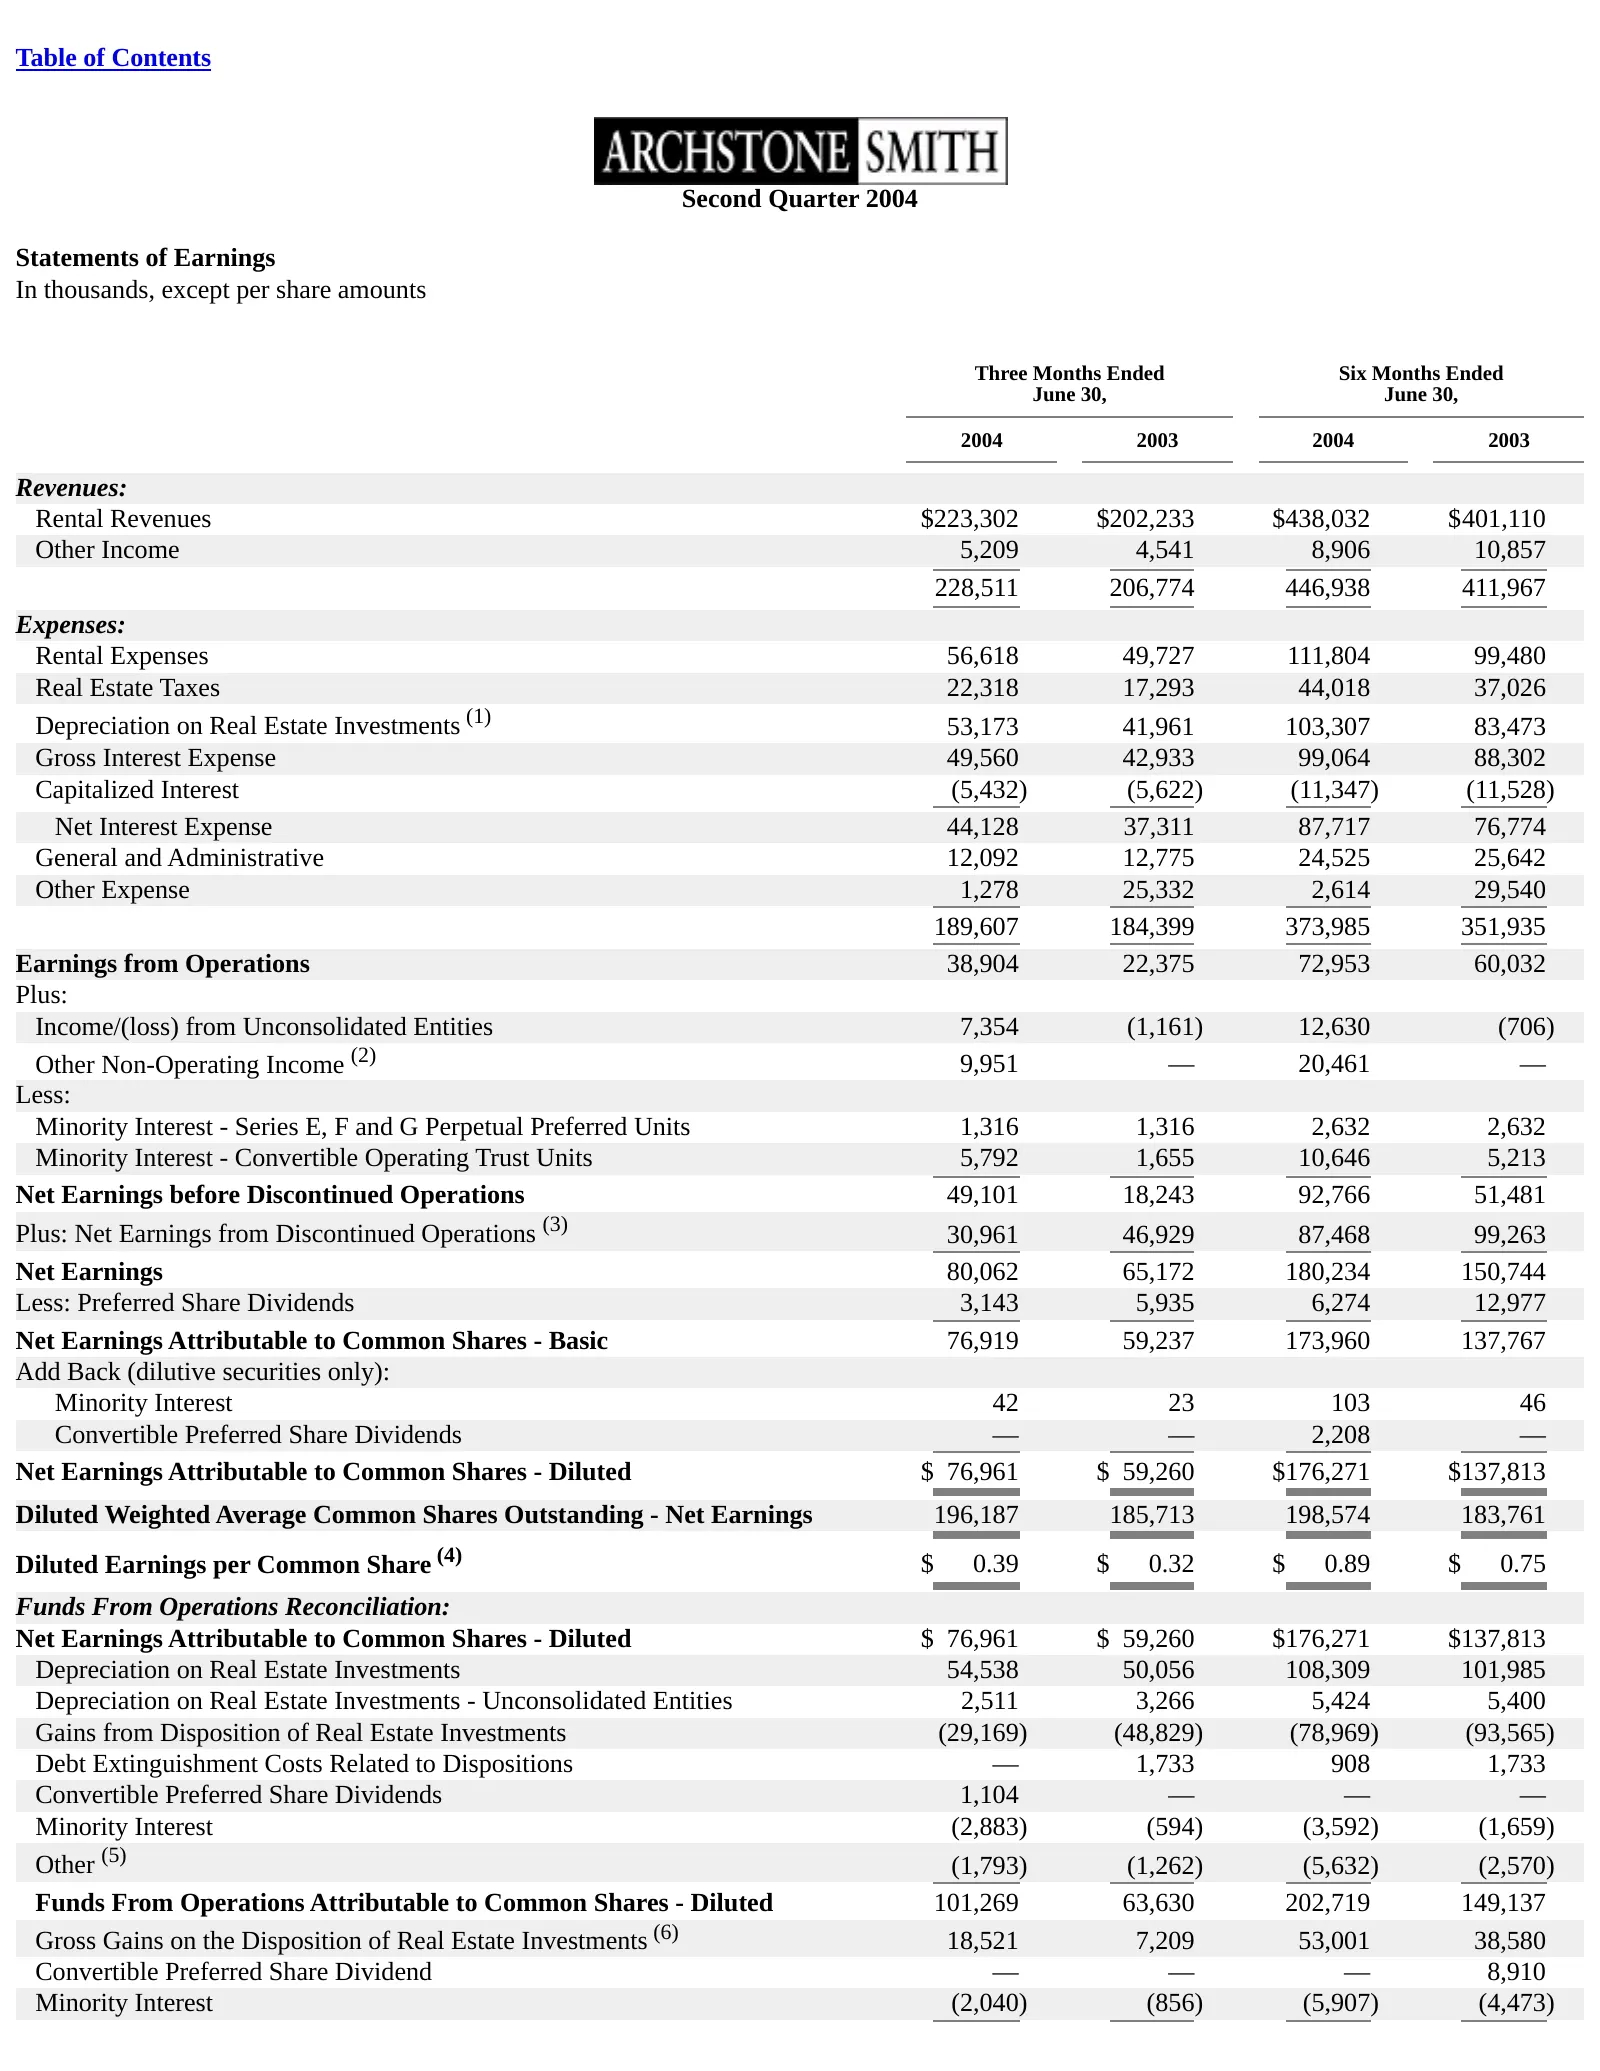
Slide 44: Second Quarter 2004 Statements of Earnings
Table of Contents Second Quarter 2004 Statements of Earnings In thousands, except per share amounts Three Months Ended Six Months Ended June 30, June 30, 2004 2003 2004 2003 Revenues: Rental Revenues $223,302 $202,233 $438,032 $401,110 Other Income 5,209 4,541 8,906 10,857 228,511 206,774 446,938 41
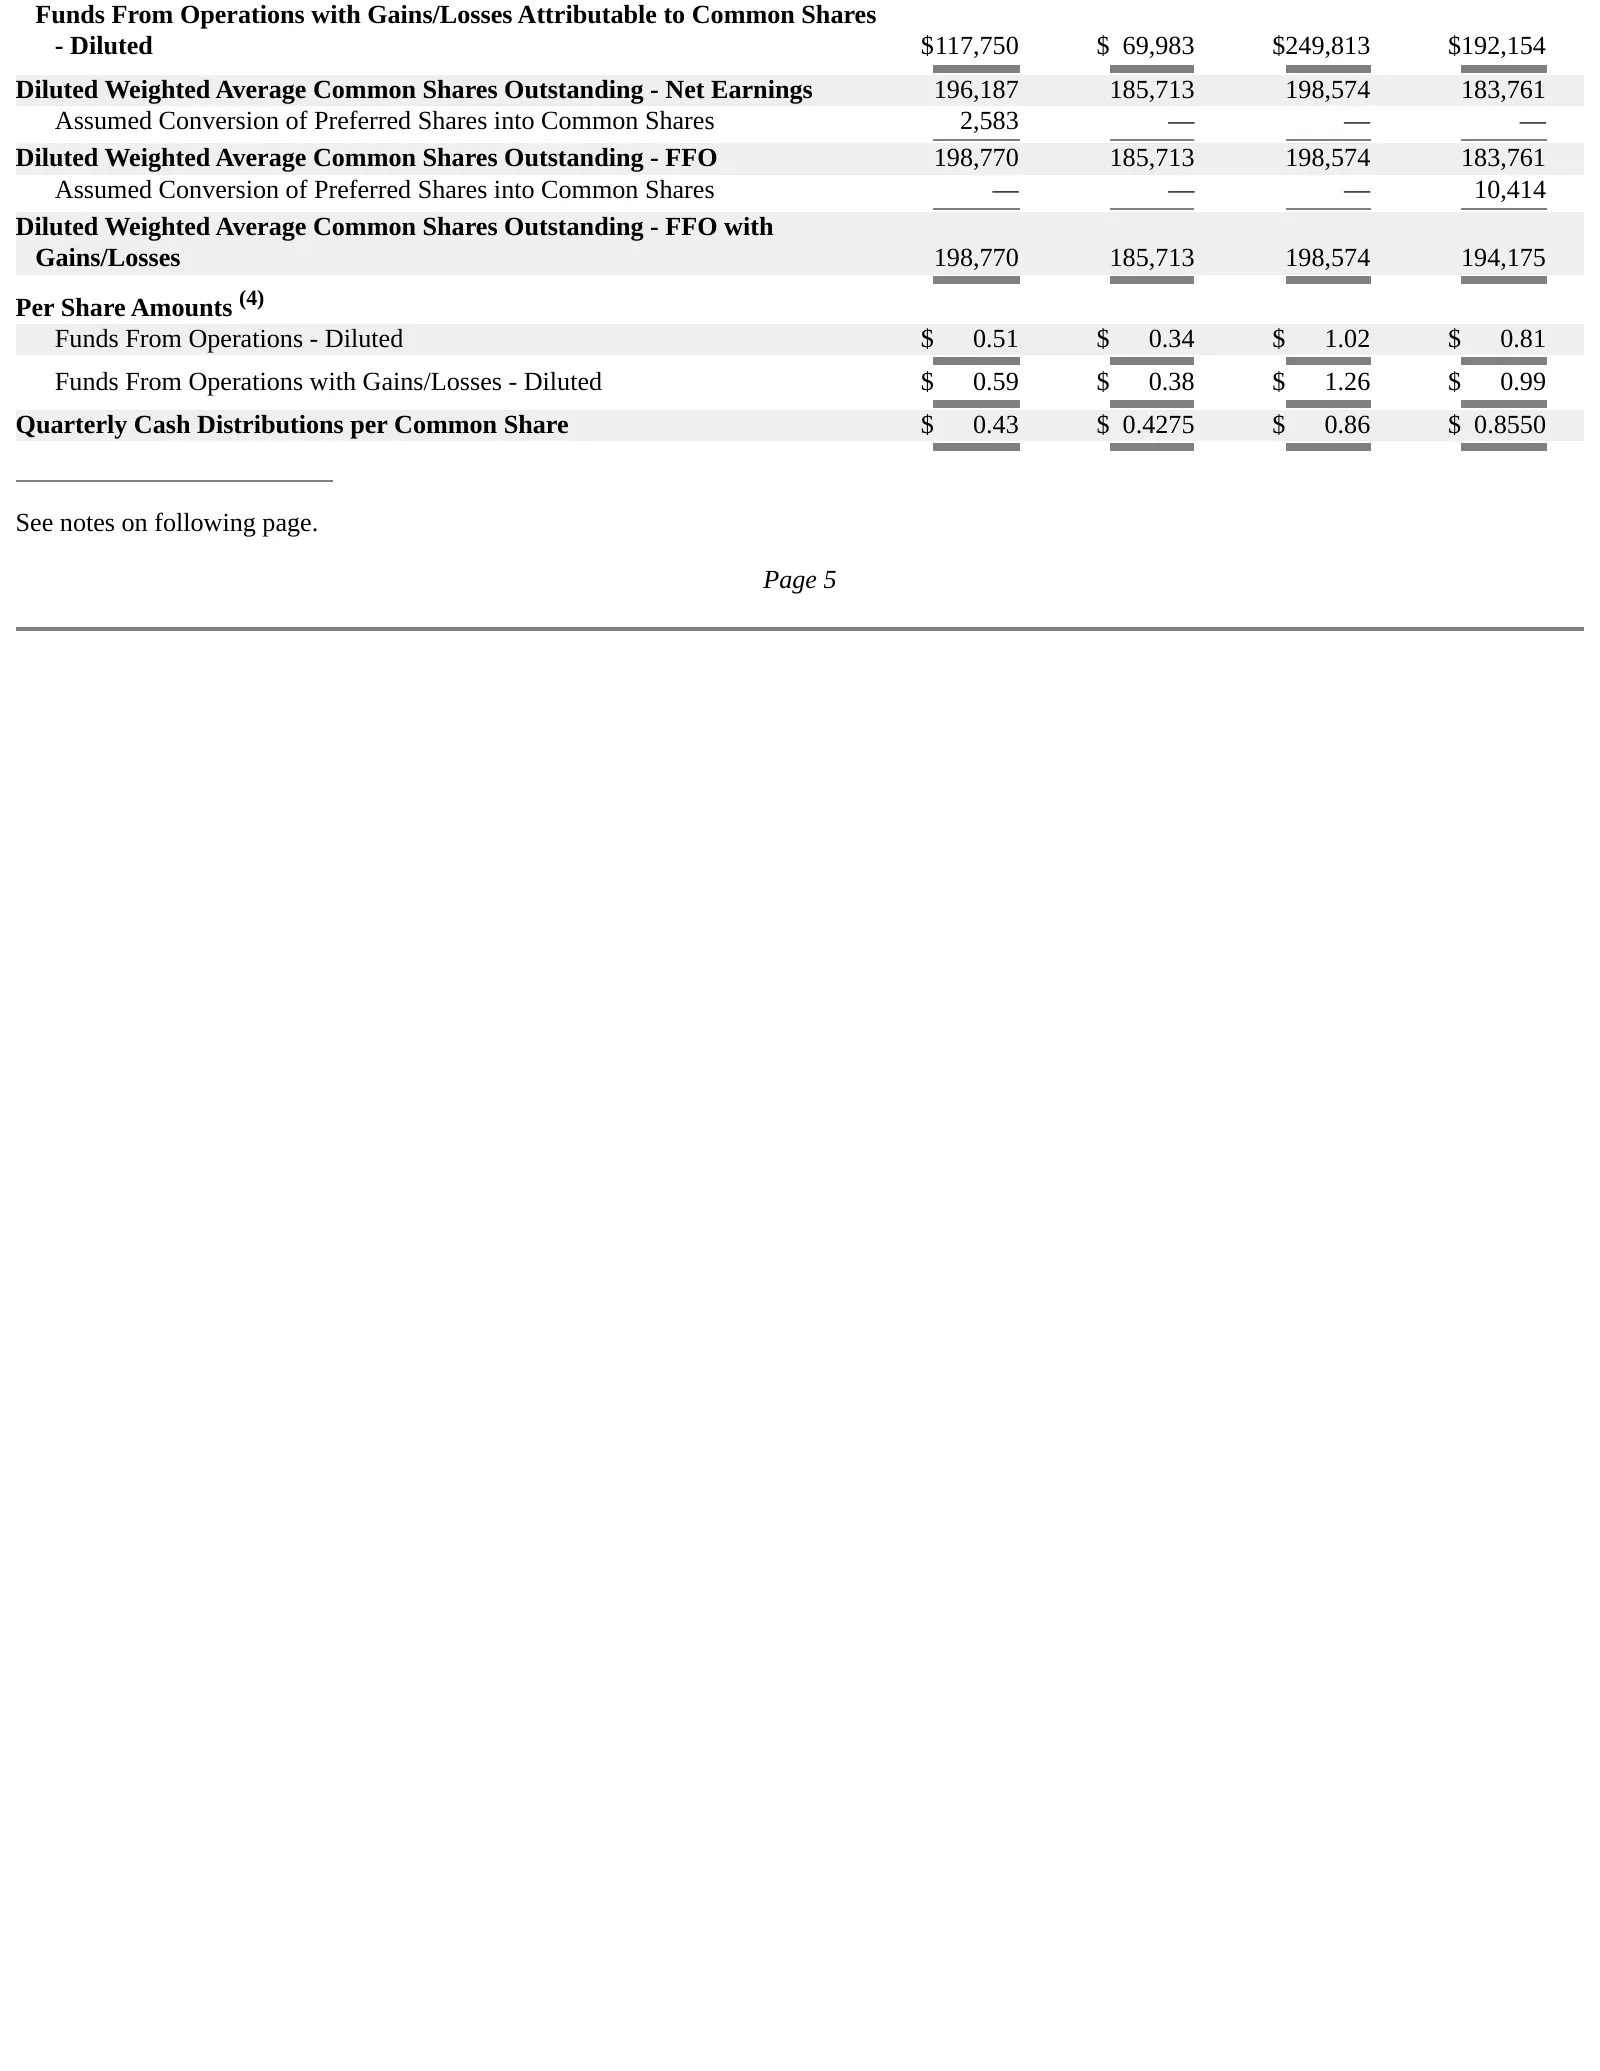
Slide 45: Funds From Operations with Gains/Losses
Funds From Operations with Gains/Losses Attributable to Common Shares - Diluted $117,750 $ 69,983 $249,813 $192,154 Diluted Weighted Average Common Shares Outstanding - Net Earnings 196,187 185,713 198,574 183,761 Assumed Conversion of Preferred Shares into Common Shares 2,583 — — — Diluted Weighted
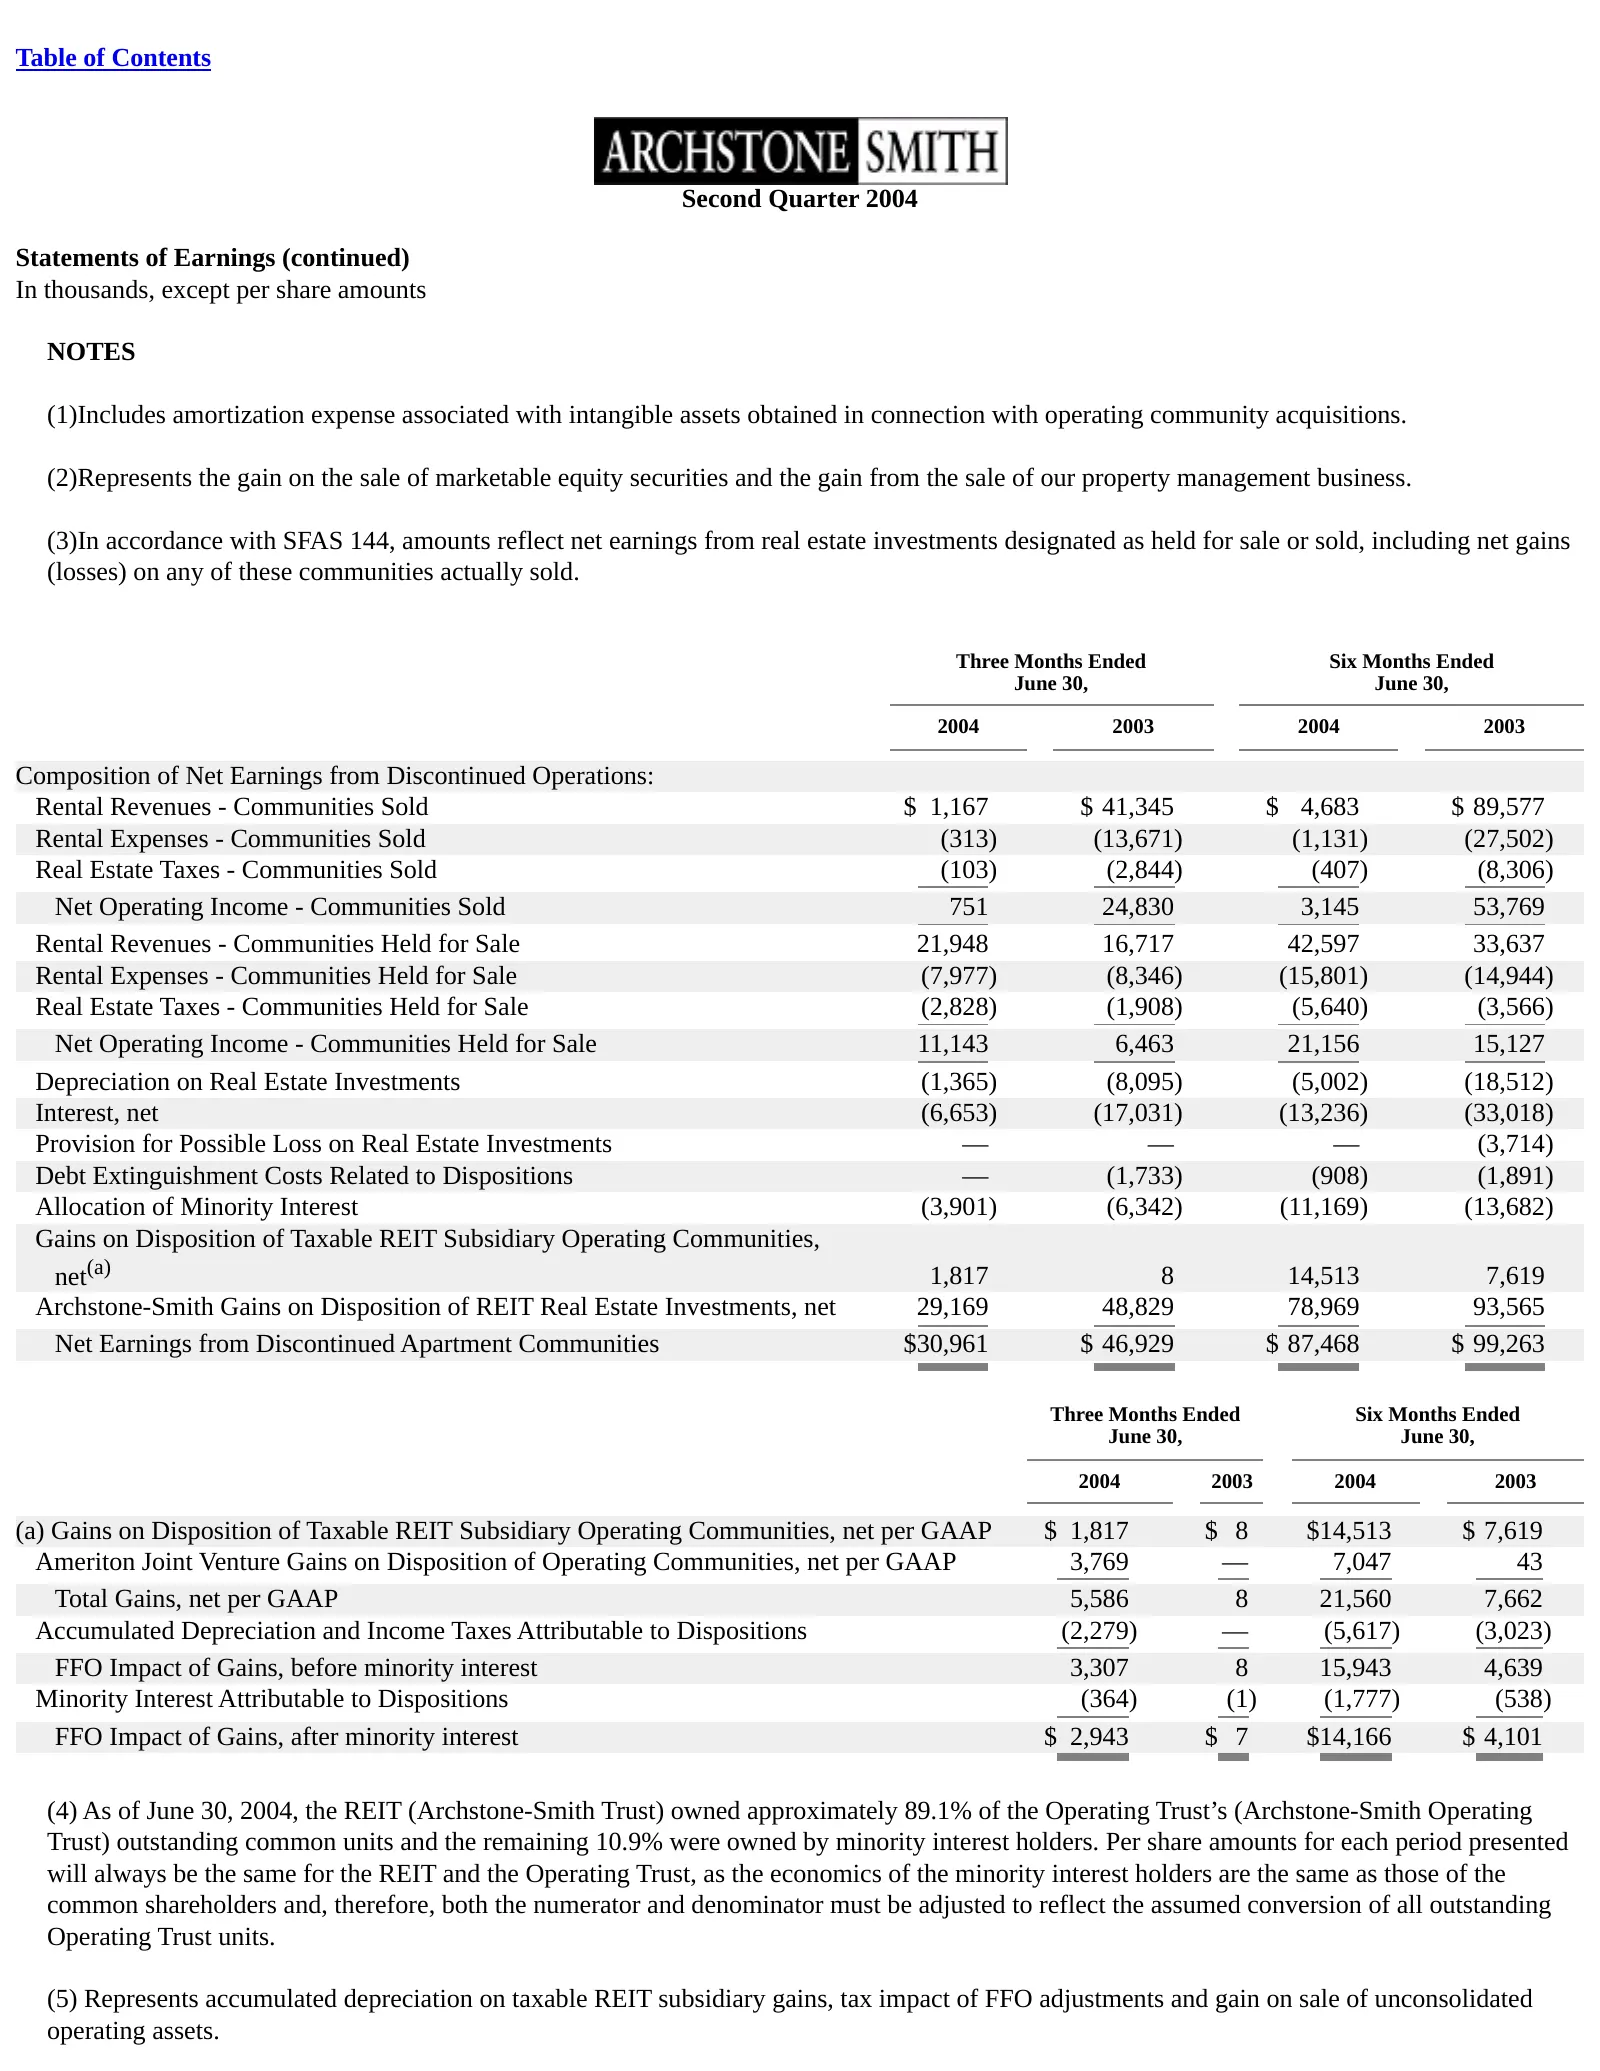
Slide 46: Statements of Earnings (continued)
Table of Contents Second Quarter 2004 Statements of Earnings (continued) In thousands, except per share amounts NOTES (1)Includes amortization expense associated with intangible assets obtained in connection with operating community acquisitions. (2)Represents the gain on the sale of marketable equi
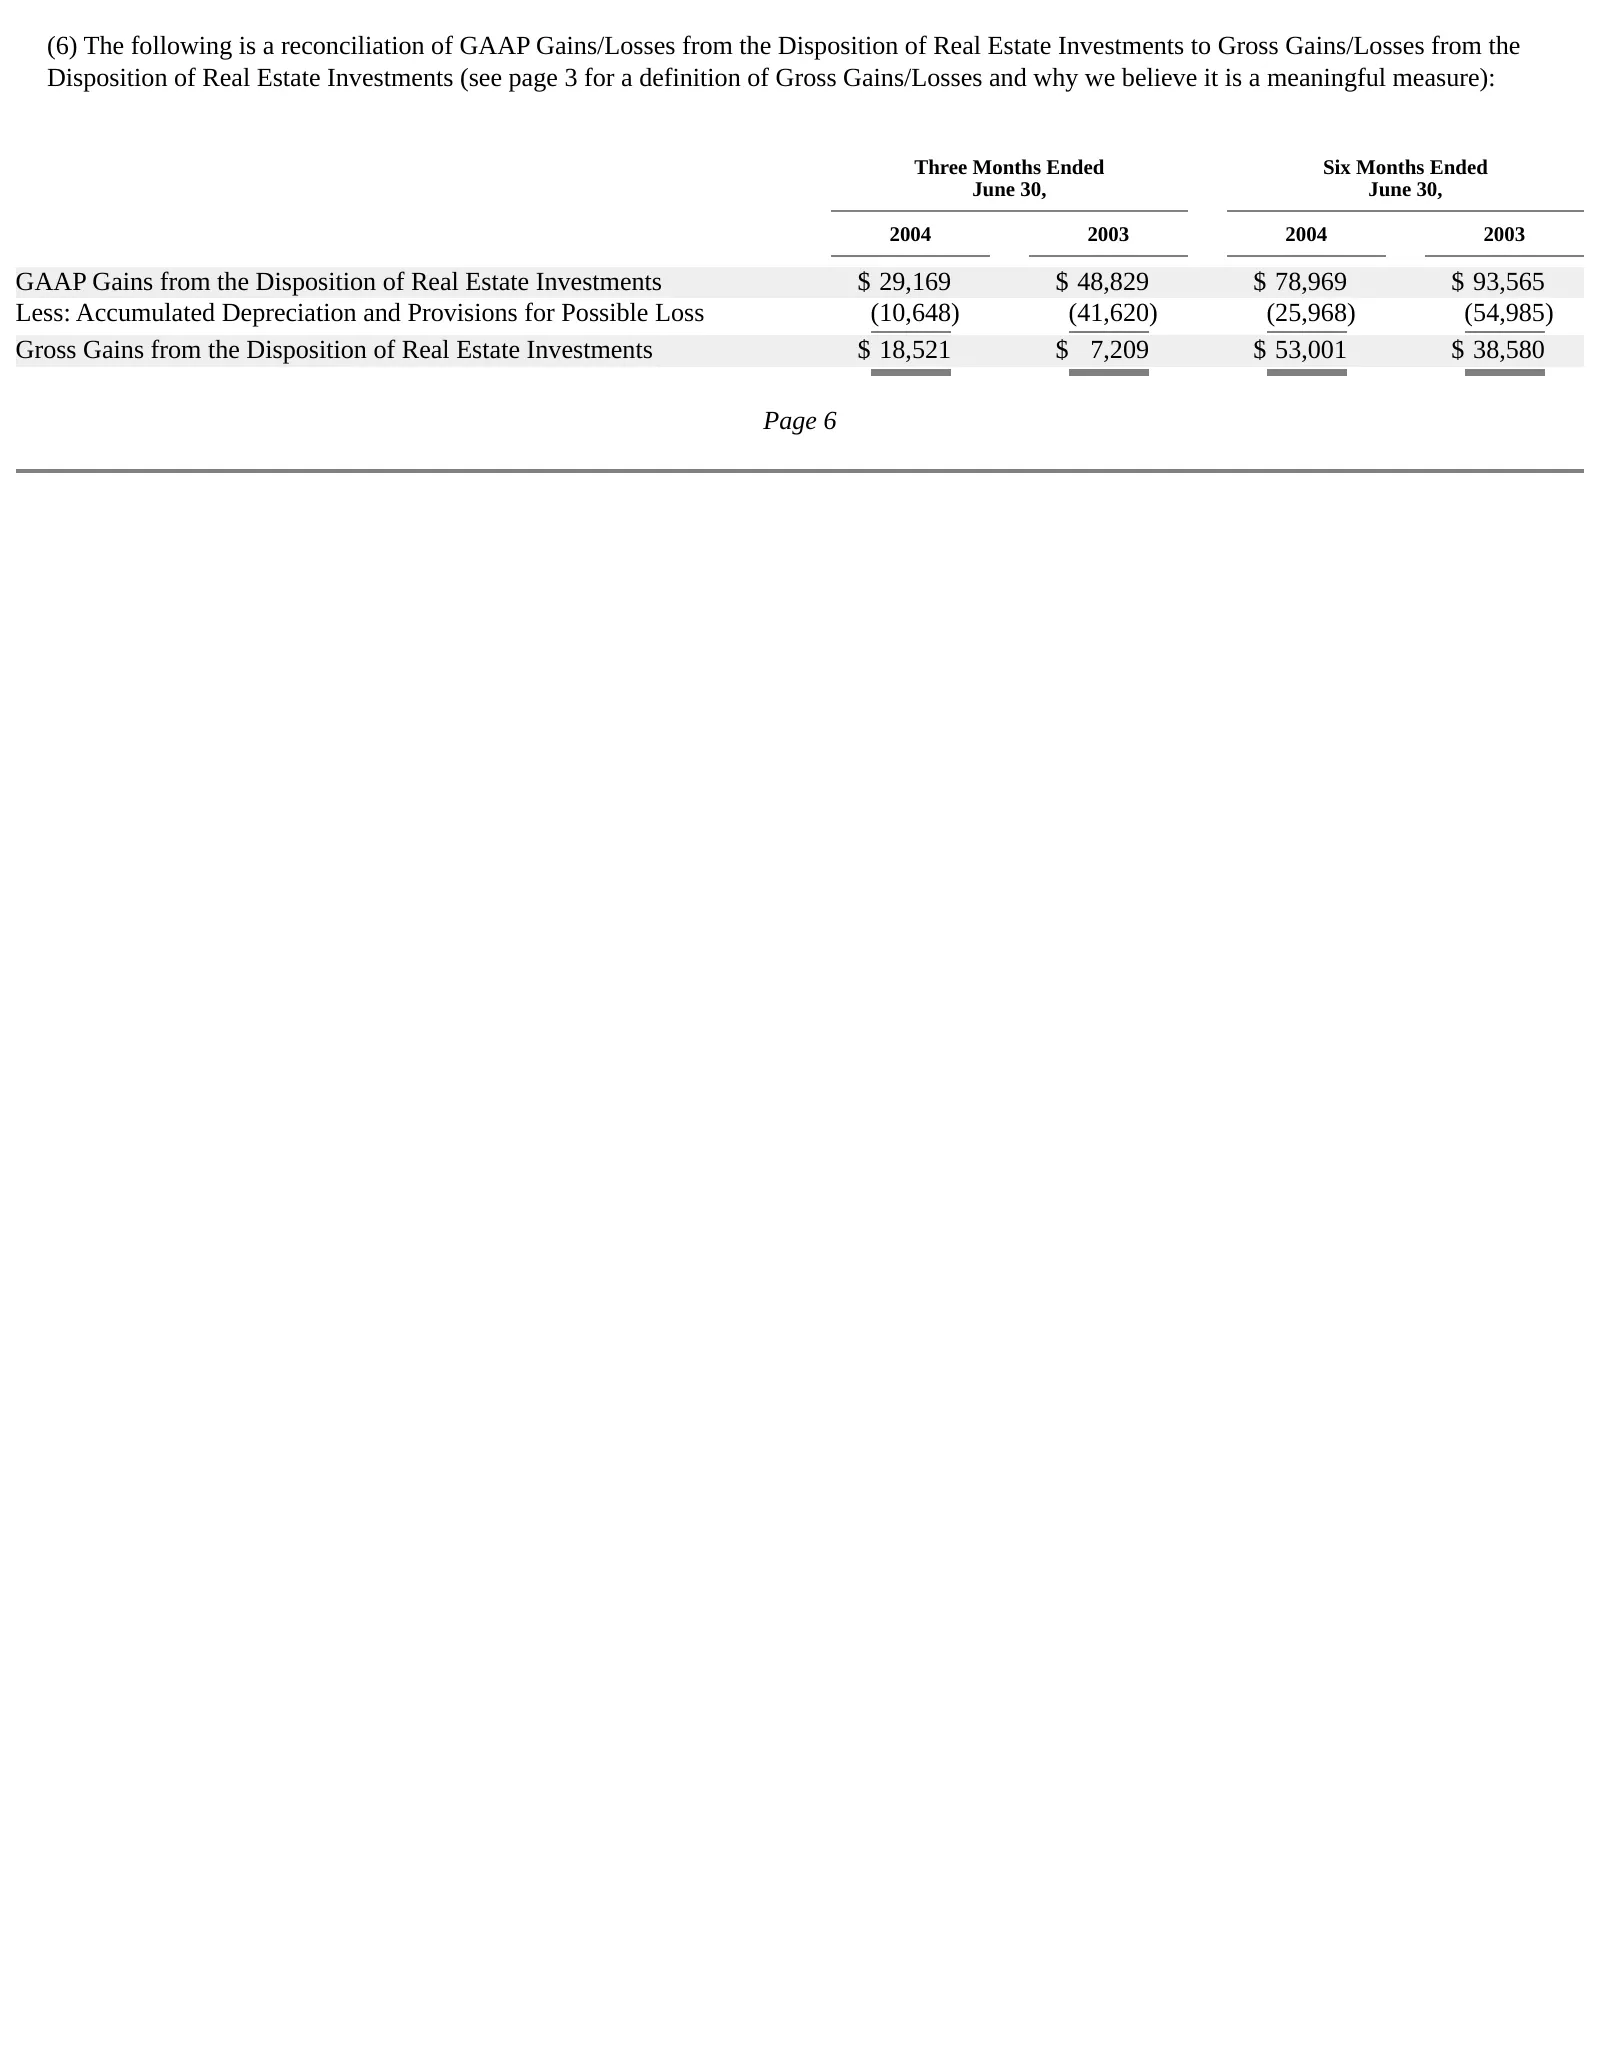
Slide 47: Reconciliation of GAAP gains to gross gains
(6) The following is a reconciliation of GAAP Gains/Losses from the Disposition of Real Estate Investments to Gross Gains/Losses from the Disposition of Real Estate Investments (see page 3 for a definition of Gross Gains/Losses and why we believe it is a meaningful measure): Three Months Ended Six M
Slide 48: Second Quarter 2004 Balance Sheets
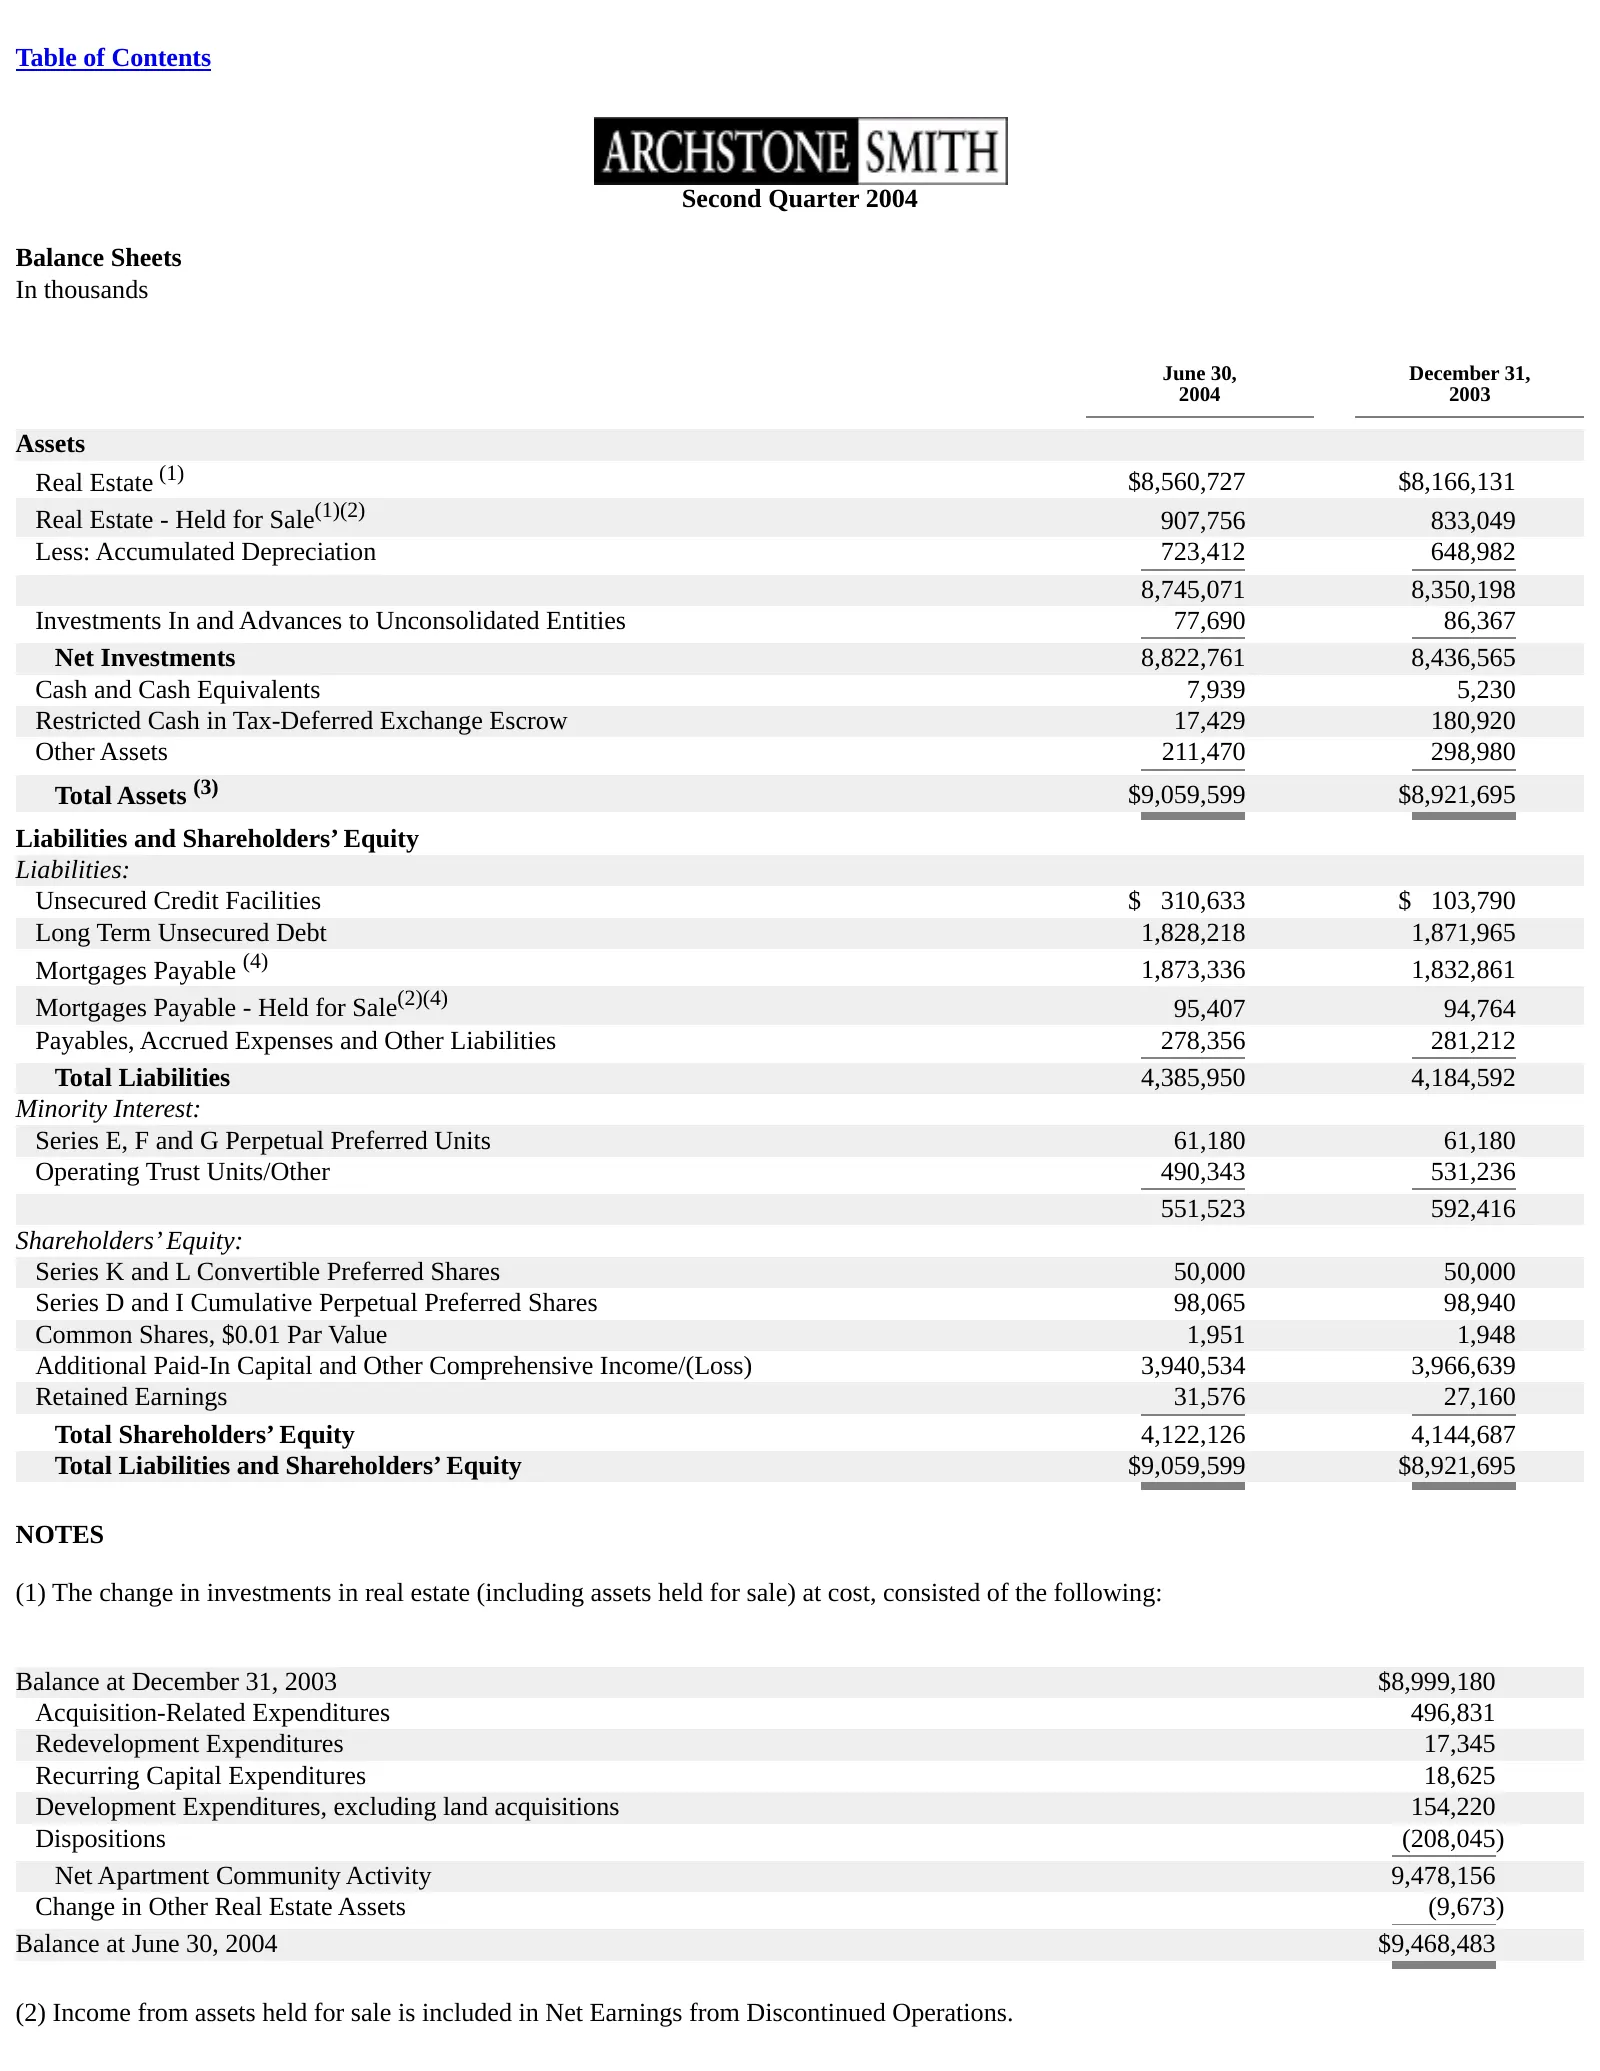
Table of Contents Second Quarter 2004 Balance Sheets In thousands June 30, December 31, 2004 2003 Assets Real Estate (1) $8,560,727 $8,166,131 Real Estate - Held for Sale(1)(2) 907,756 833,049 Less: Accumulated Depreciation 723,412 648,982 8,745,071 8,350,198 Investments In and Advances to Unconsoli

Slide 49: Balance sheet notes
(3) Includes $689.5 million and $551.0 million of Ameriton assets as of June 30, 2004 and December 31, 2003, respectively. (4) Includes a total of $84.0 million and $80.7 million of Ameriton third party debt as of June 30, 2004 and December 31, 2003, respectively. Page 7
Slide 50: Geographic Distribution at June 30, 2004
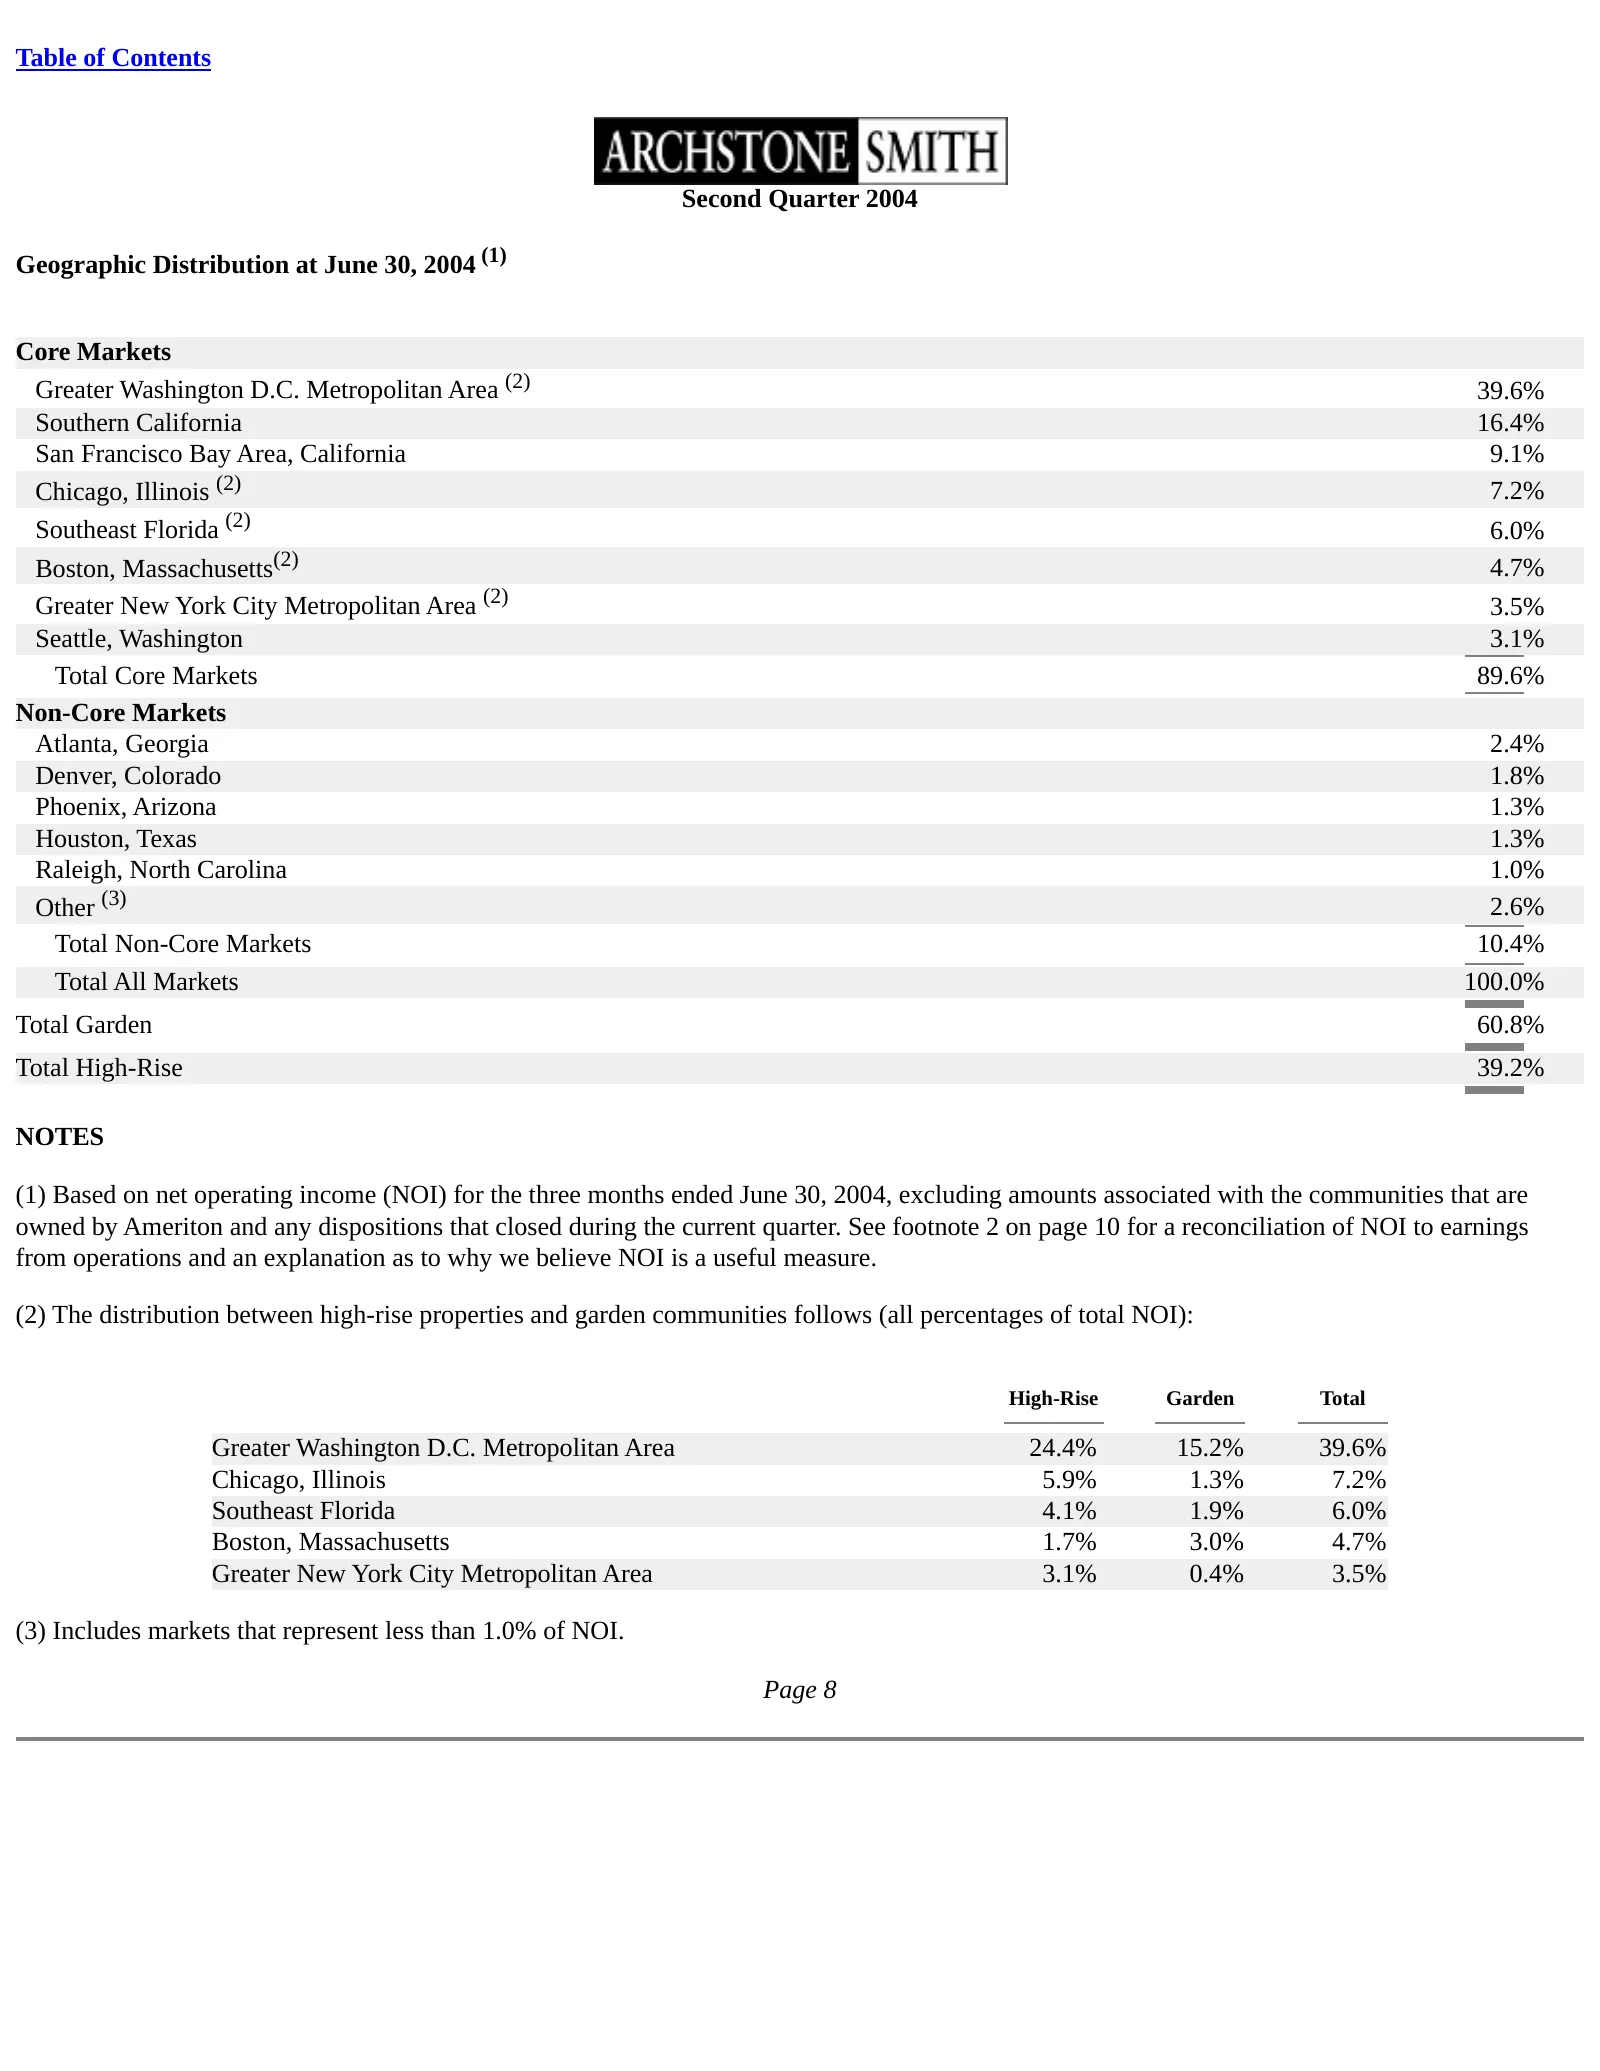
Table of Contents Second Quarter 2004 Geographic Distribution at June 30, 2004 (1) Core Markets Greater Washington D.C. Metropolitan Area (2) 39.6% Southern California 16.4% San Francisco Bay Area, California 9.1% Chicago, Illinois (2) 7.2% Southeast Florida (2) 6.0% Boston, Massachusetts(2) 4.7% Gr
Slide 51: Operating Performance Summary
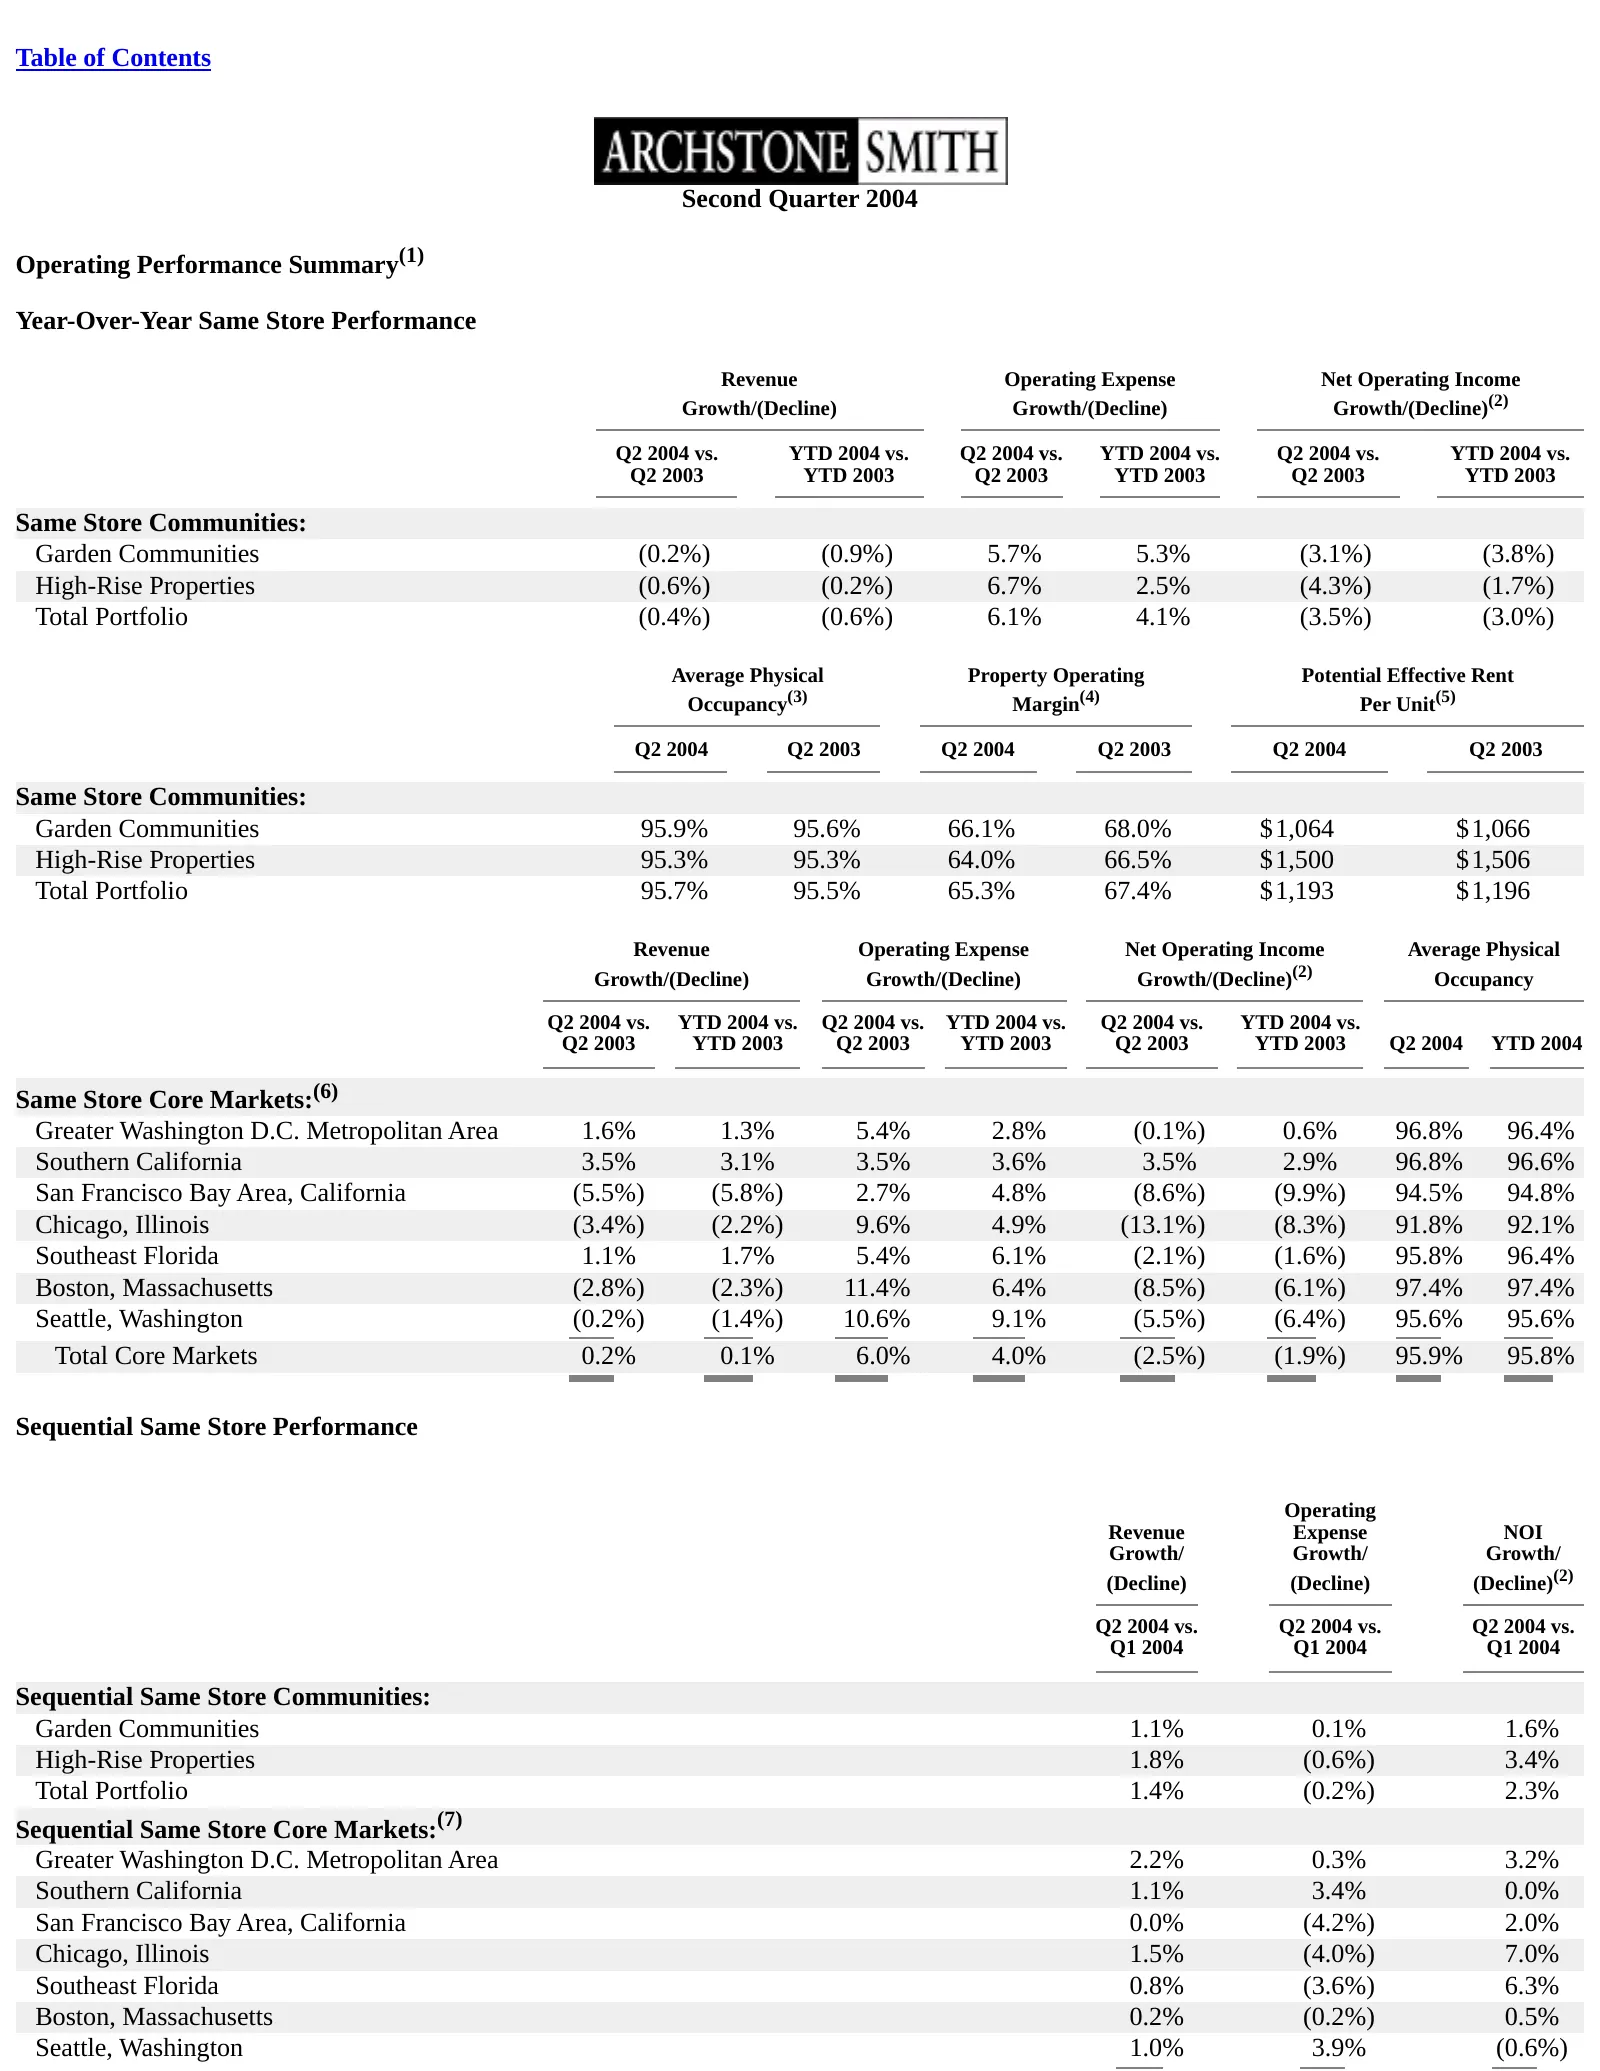
Table of Contents Second Quarter 2004 Operating Performance Summary(1) Year-Over-Year Same Store Performance Revenue Operating Expense Net Operating Income Growth/(Decline) Growth/(Decline) Growth/(Decline)(2) Q2 2004 vs. YTD 2004 vs. Q2 2004 vs. YTD 2004 vs. Q2 2004 vs. YTD 2004 vs. Q2 2003 YTD 200
Slide 52: Total Core Markets
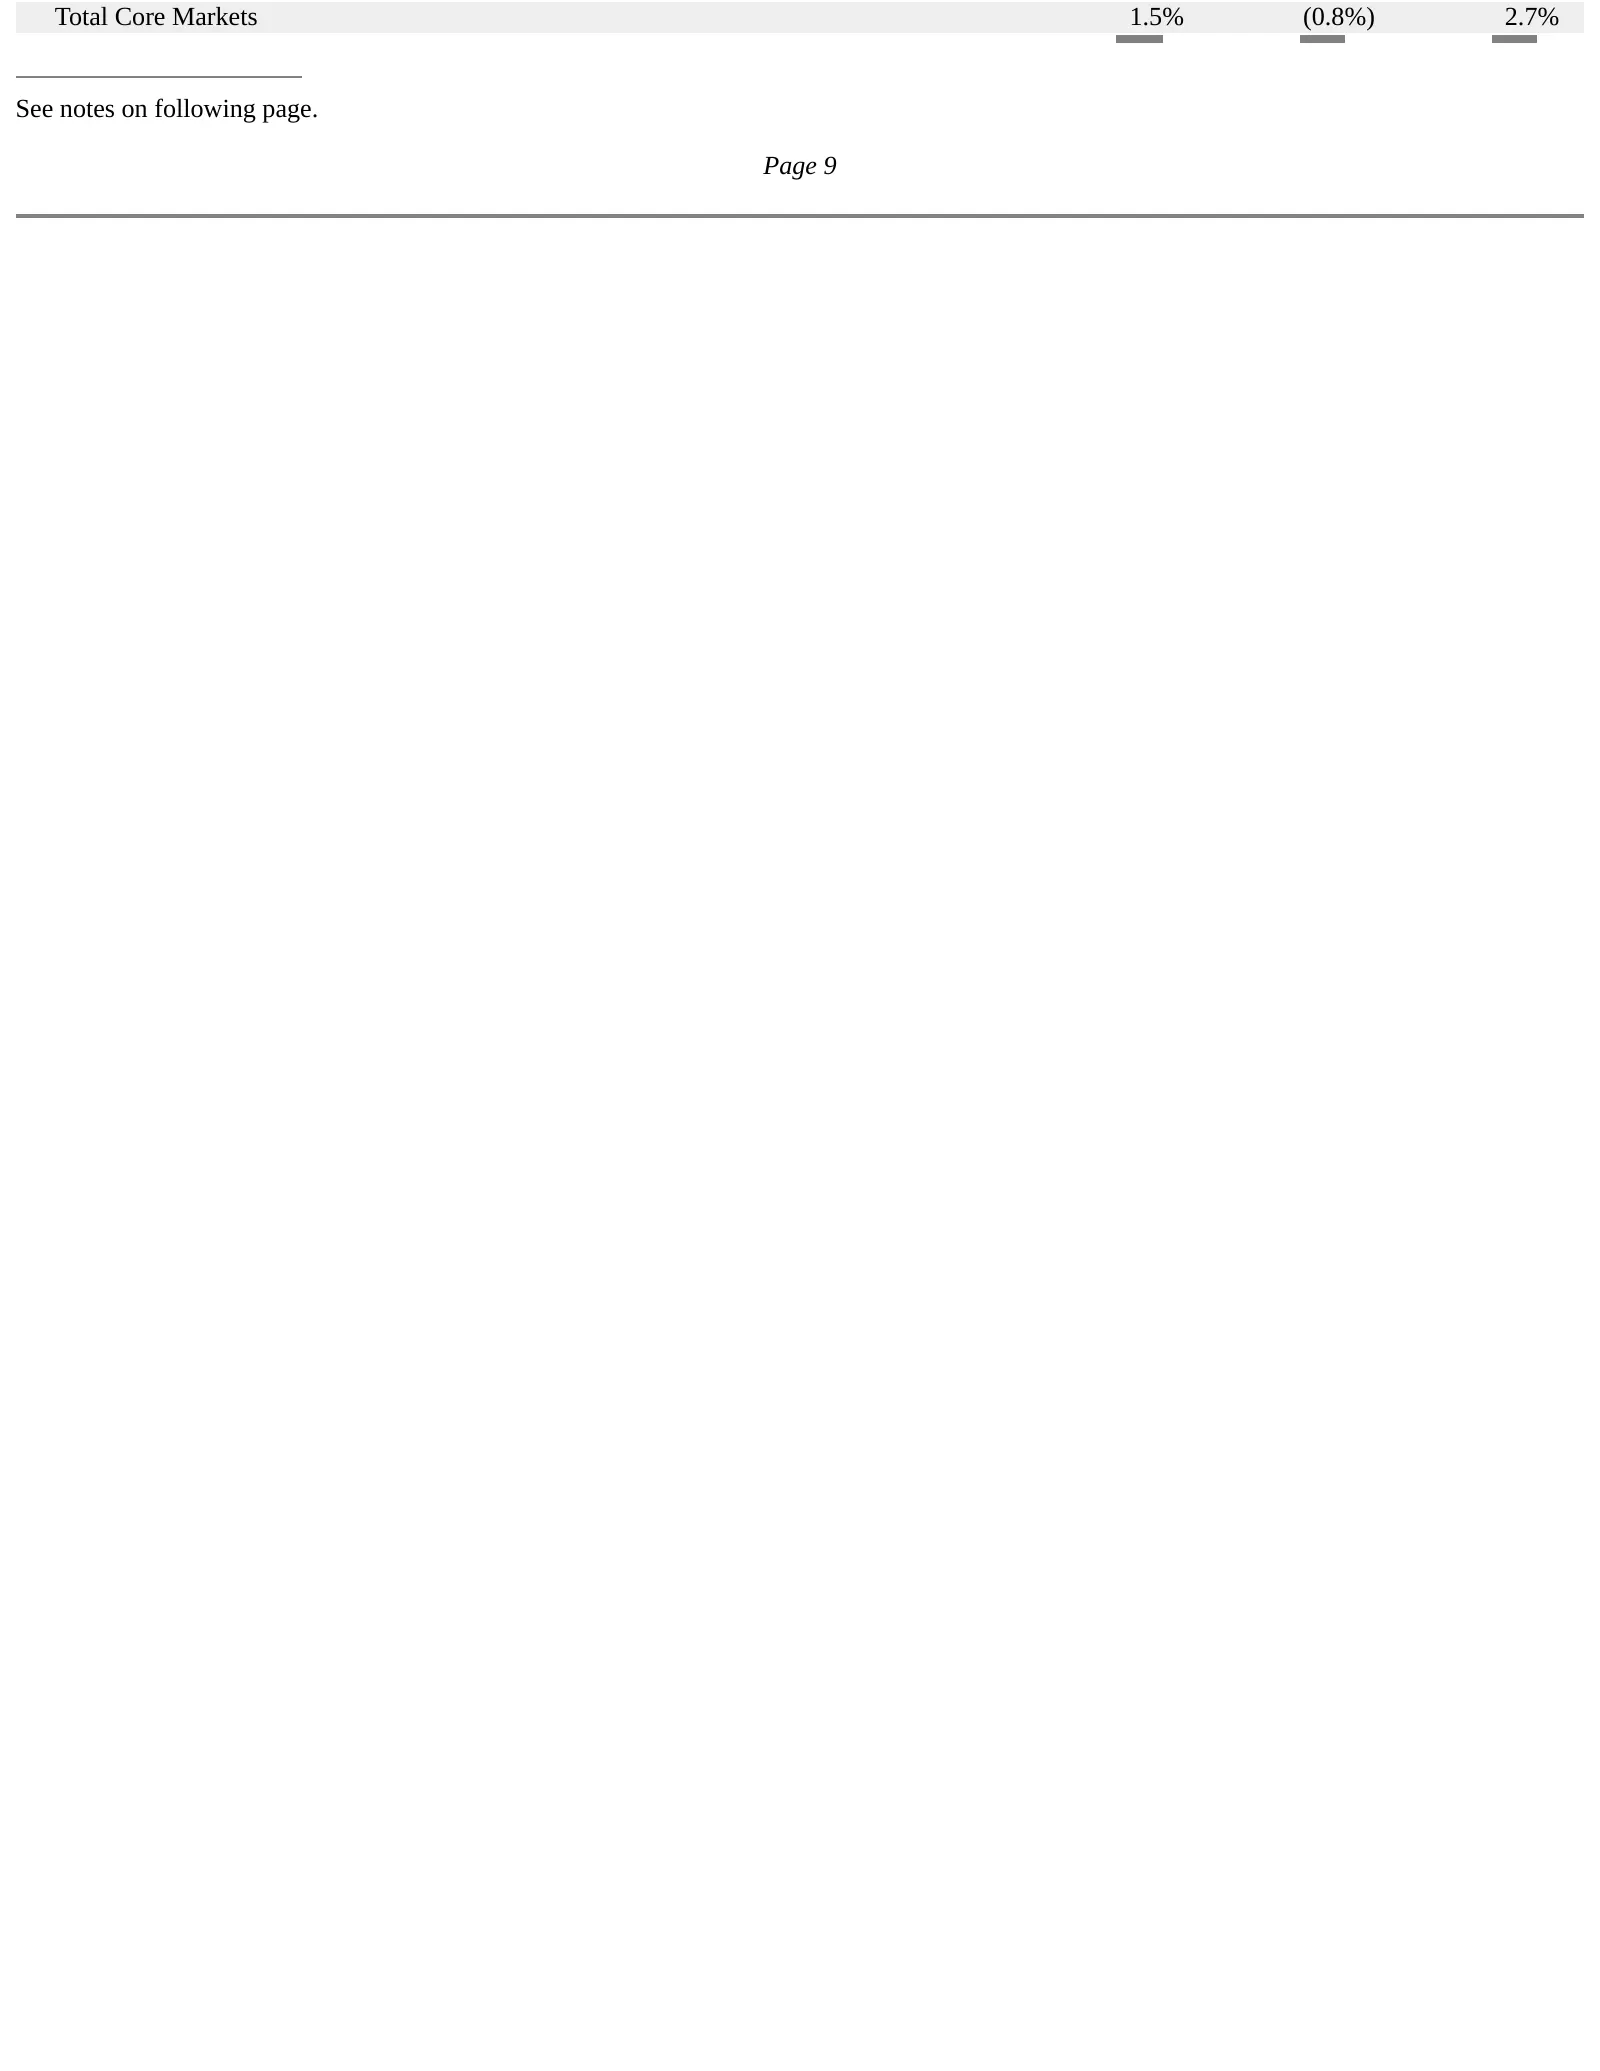
Total Core Markets 1.5% (0.8%) 2.7% See notes on following page. Page 9
Slide 53: Operating Performance Summary (continued)
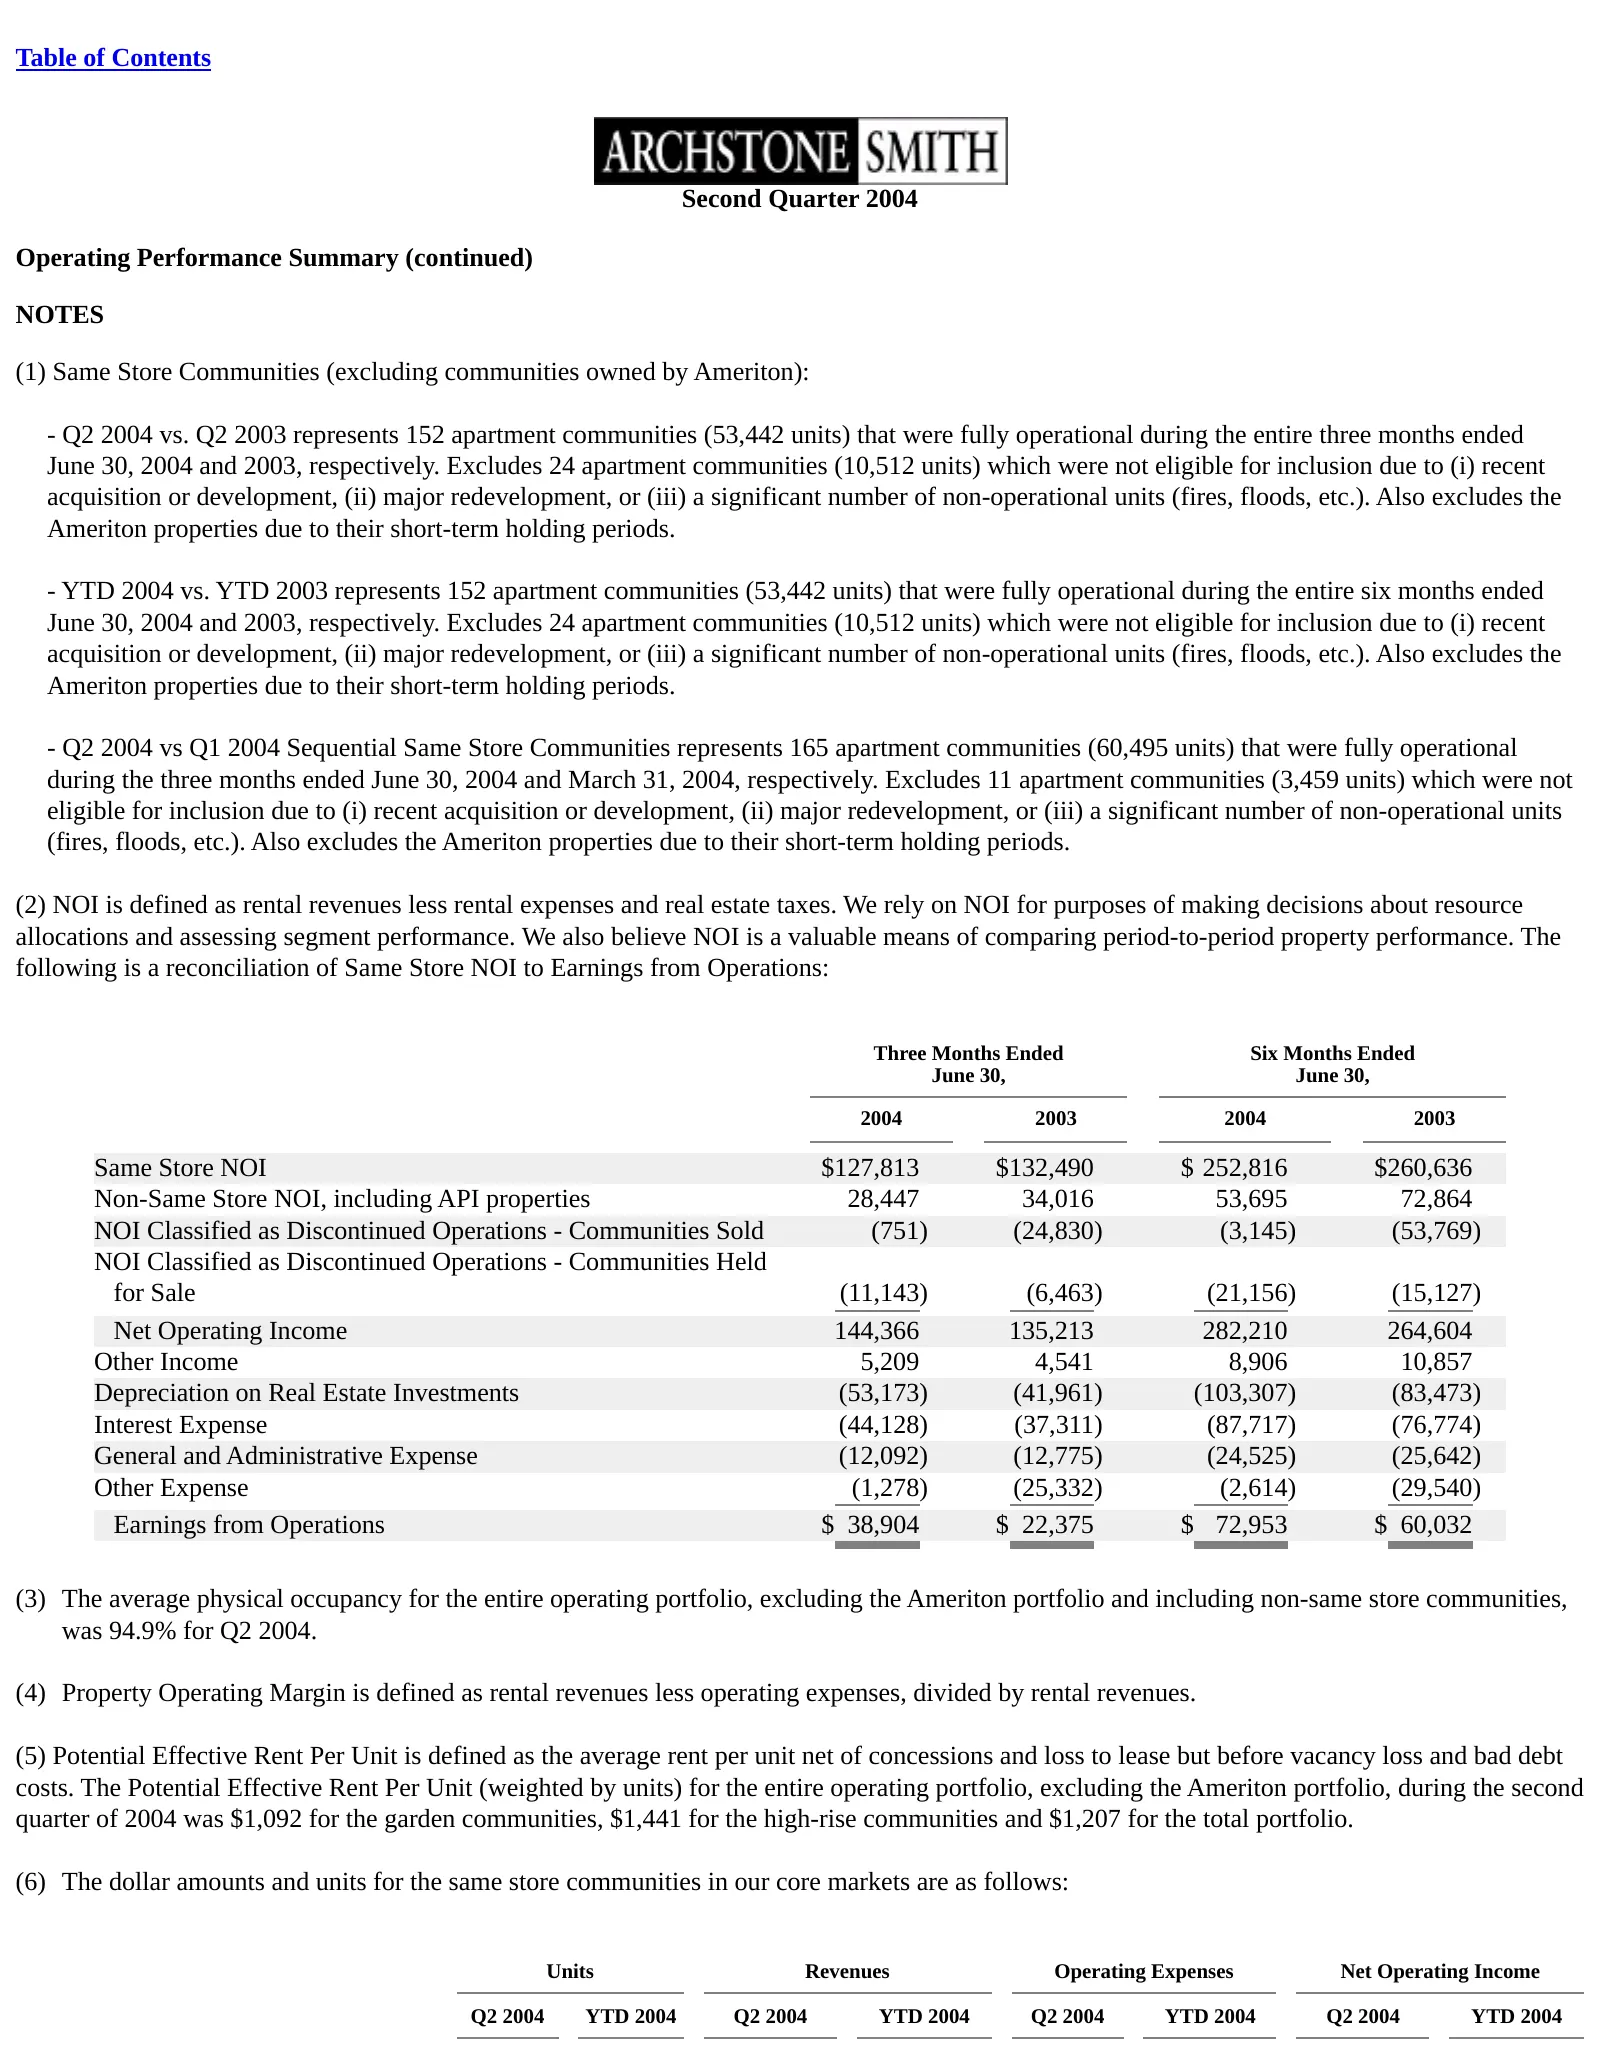
Table of Contents Second Quarter 2004 Operating Performance Summary (continued) NOTES (1) Same Store Communities (excluding communities owned by Ameriton): - Q2 2004 vs. Q2 2003 represents 152 apartment communities (53,442 units) that were fully operational during the entire three months ended June
Slide 54: Core Markets: Greater Washington D.C. Metropolitan Area
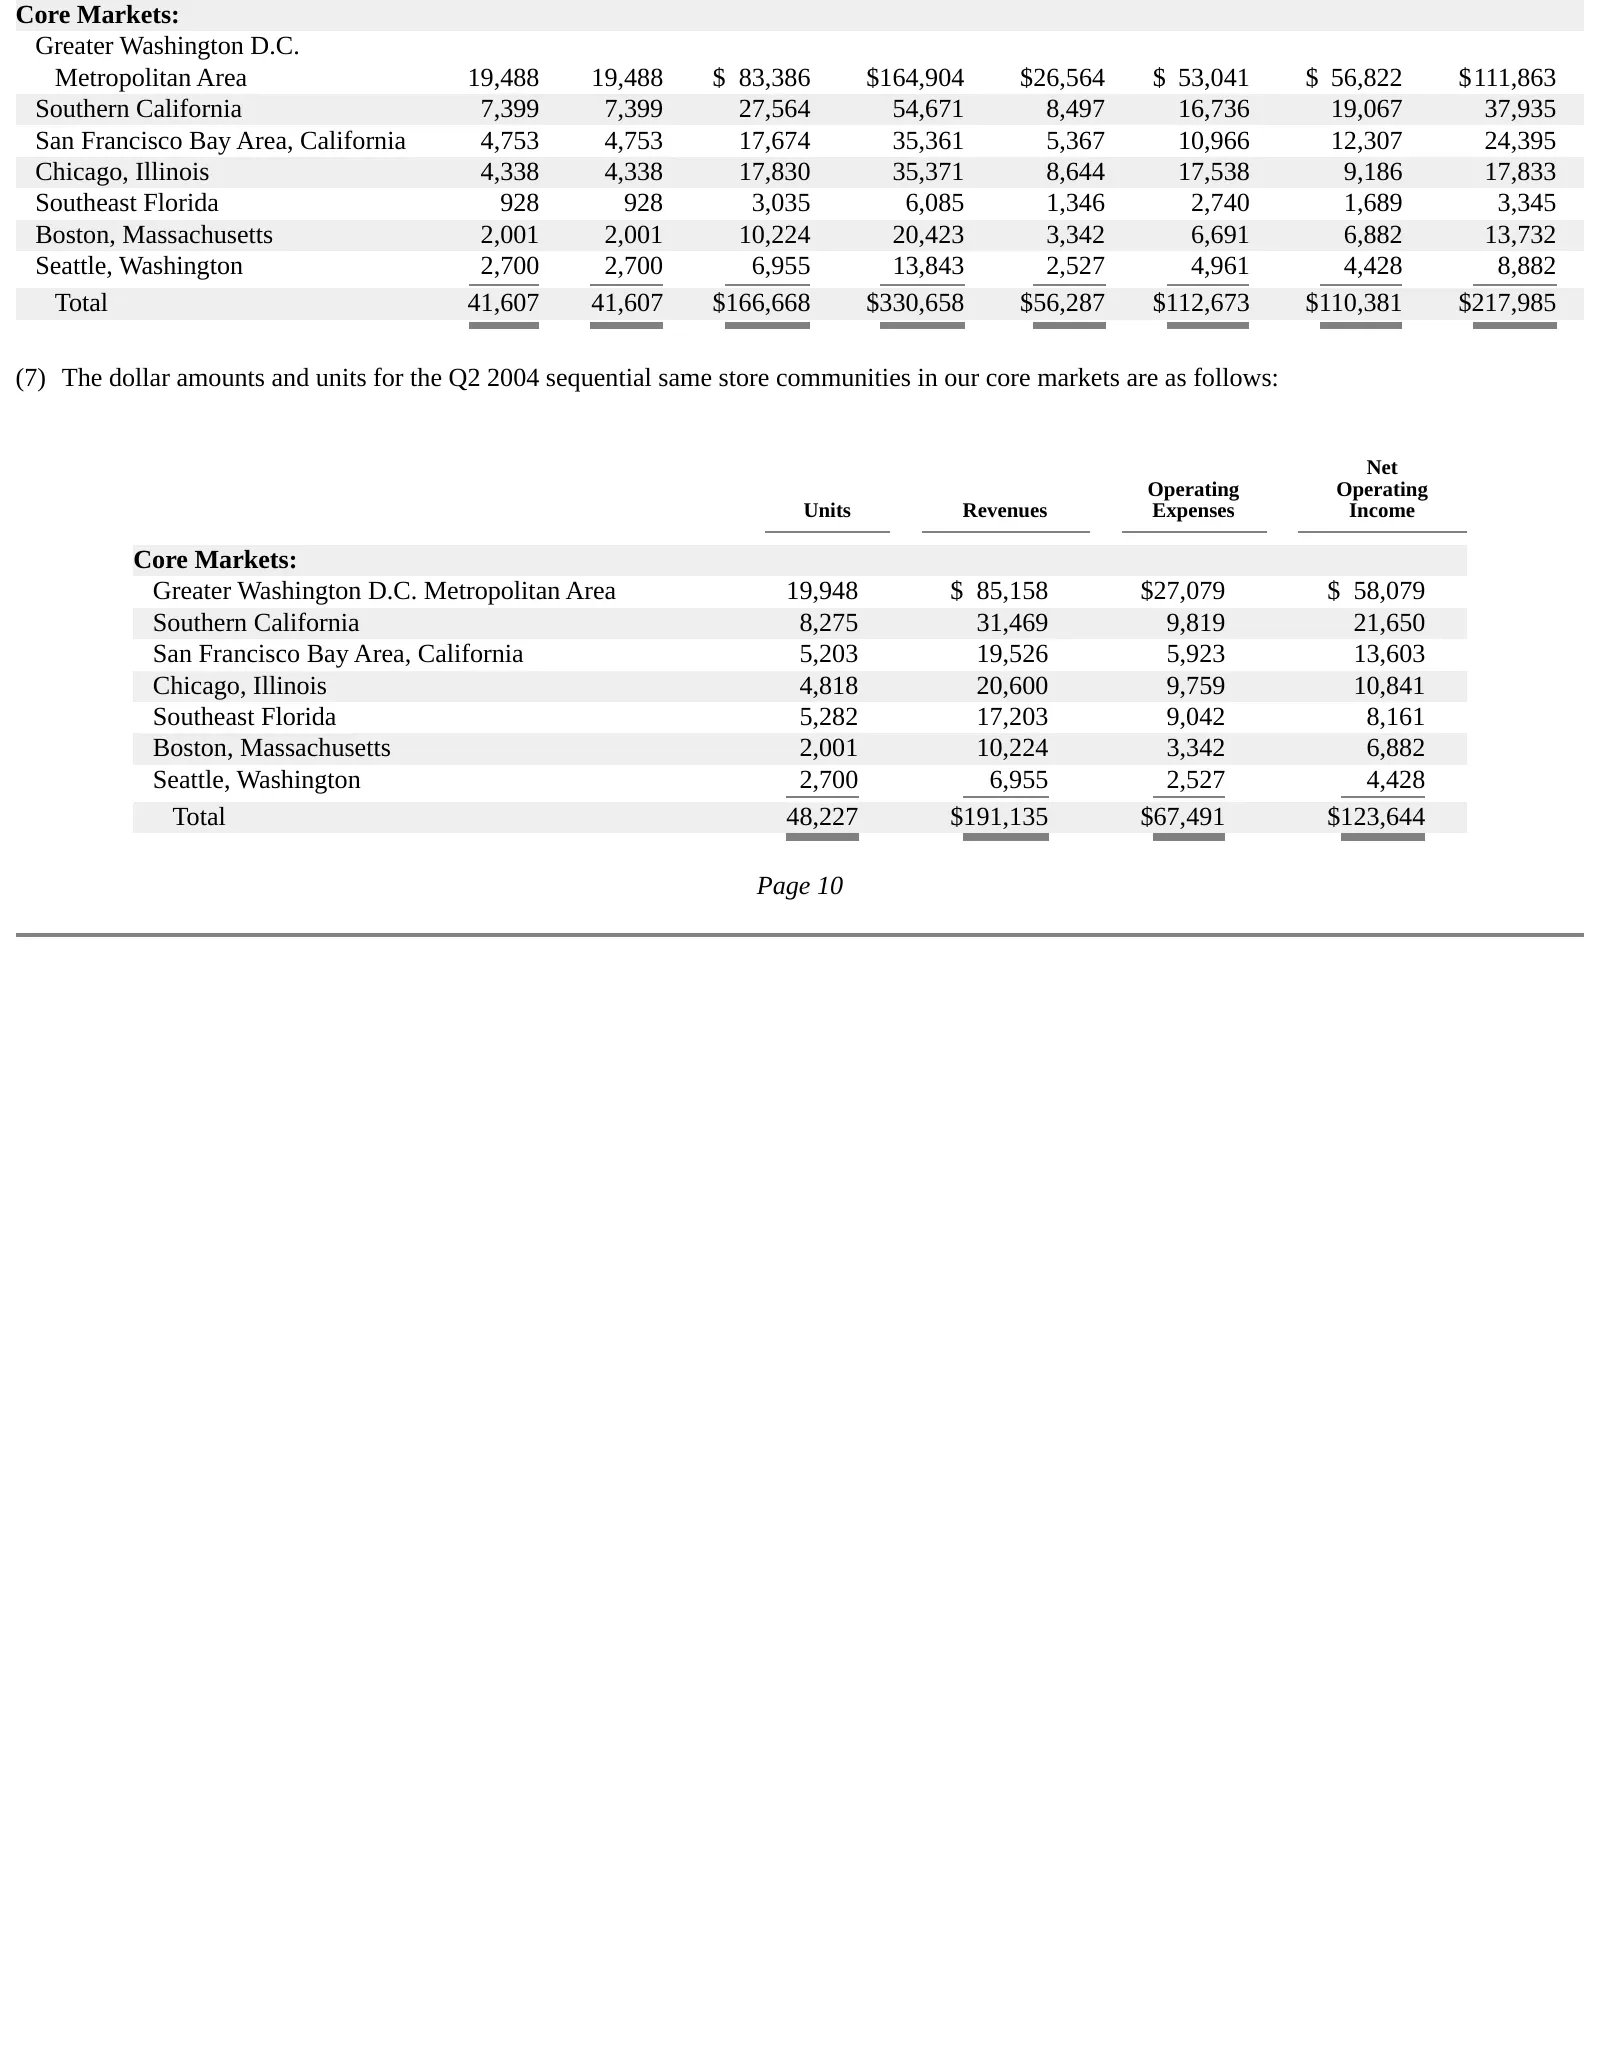
Core Markets: Greater Washington D.C. Metropolitan Area 19,488 19,488 $ 83,386 $164,904 $26,564 $ 53,041 $ 56,822 $111,863 Southern California 7,399 7,399 27,564 54,671 8,497 16,736 19,067 37,935 San Francisco Bay Area, California 4,753 4,753 17,674 35,361 5,367 10,966 12,307 24,395 Chicago, Illinoi
Slide 55: Second Quarter 2004 Investment Summary
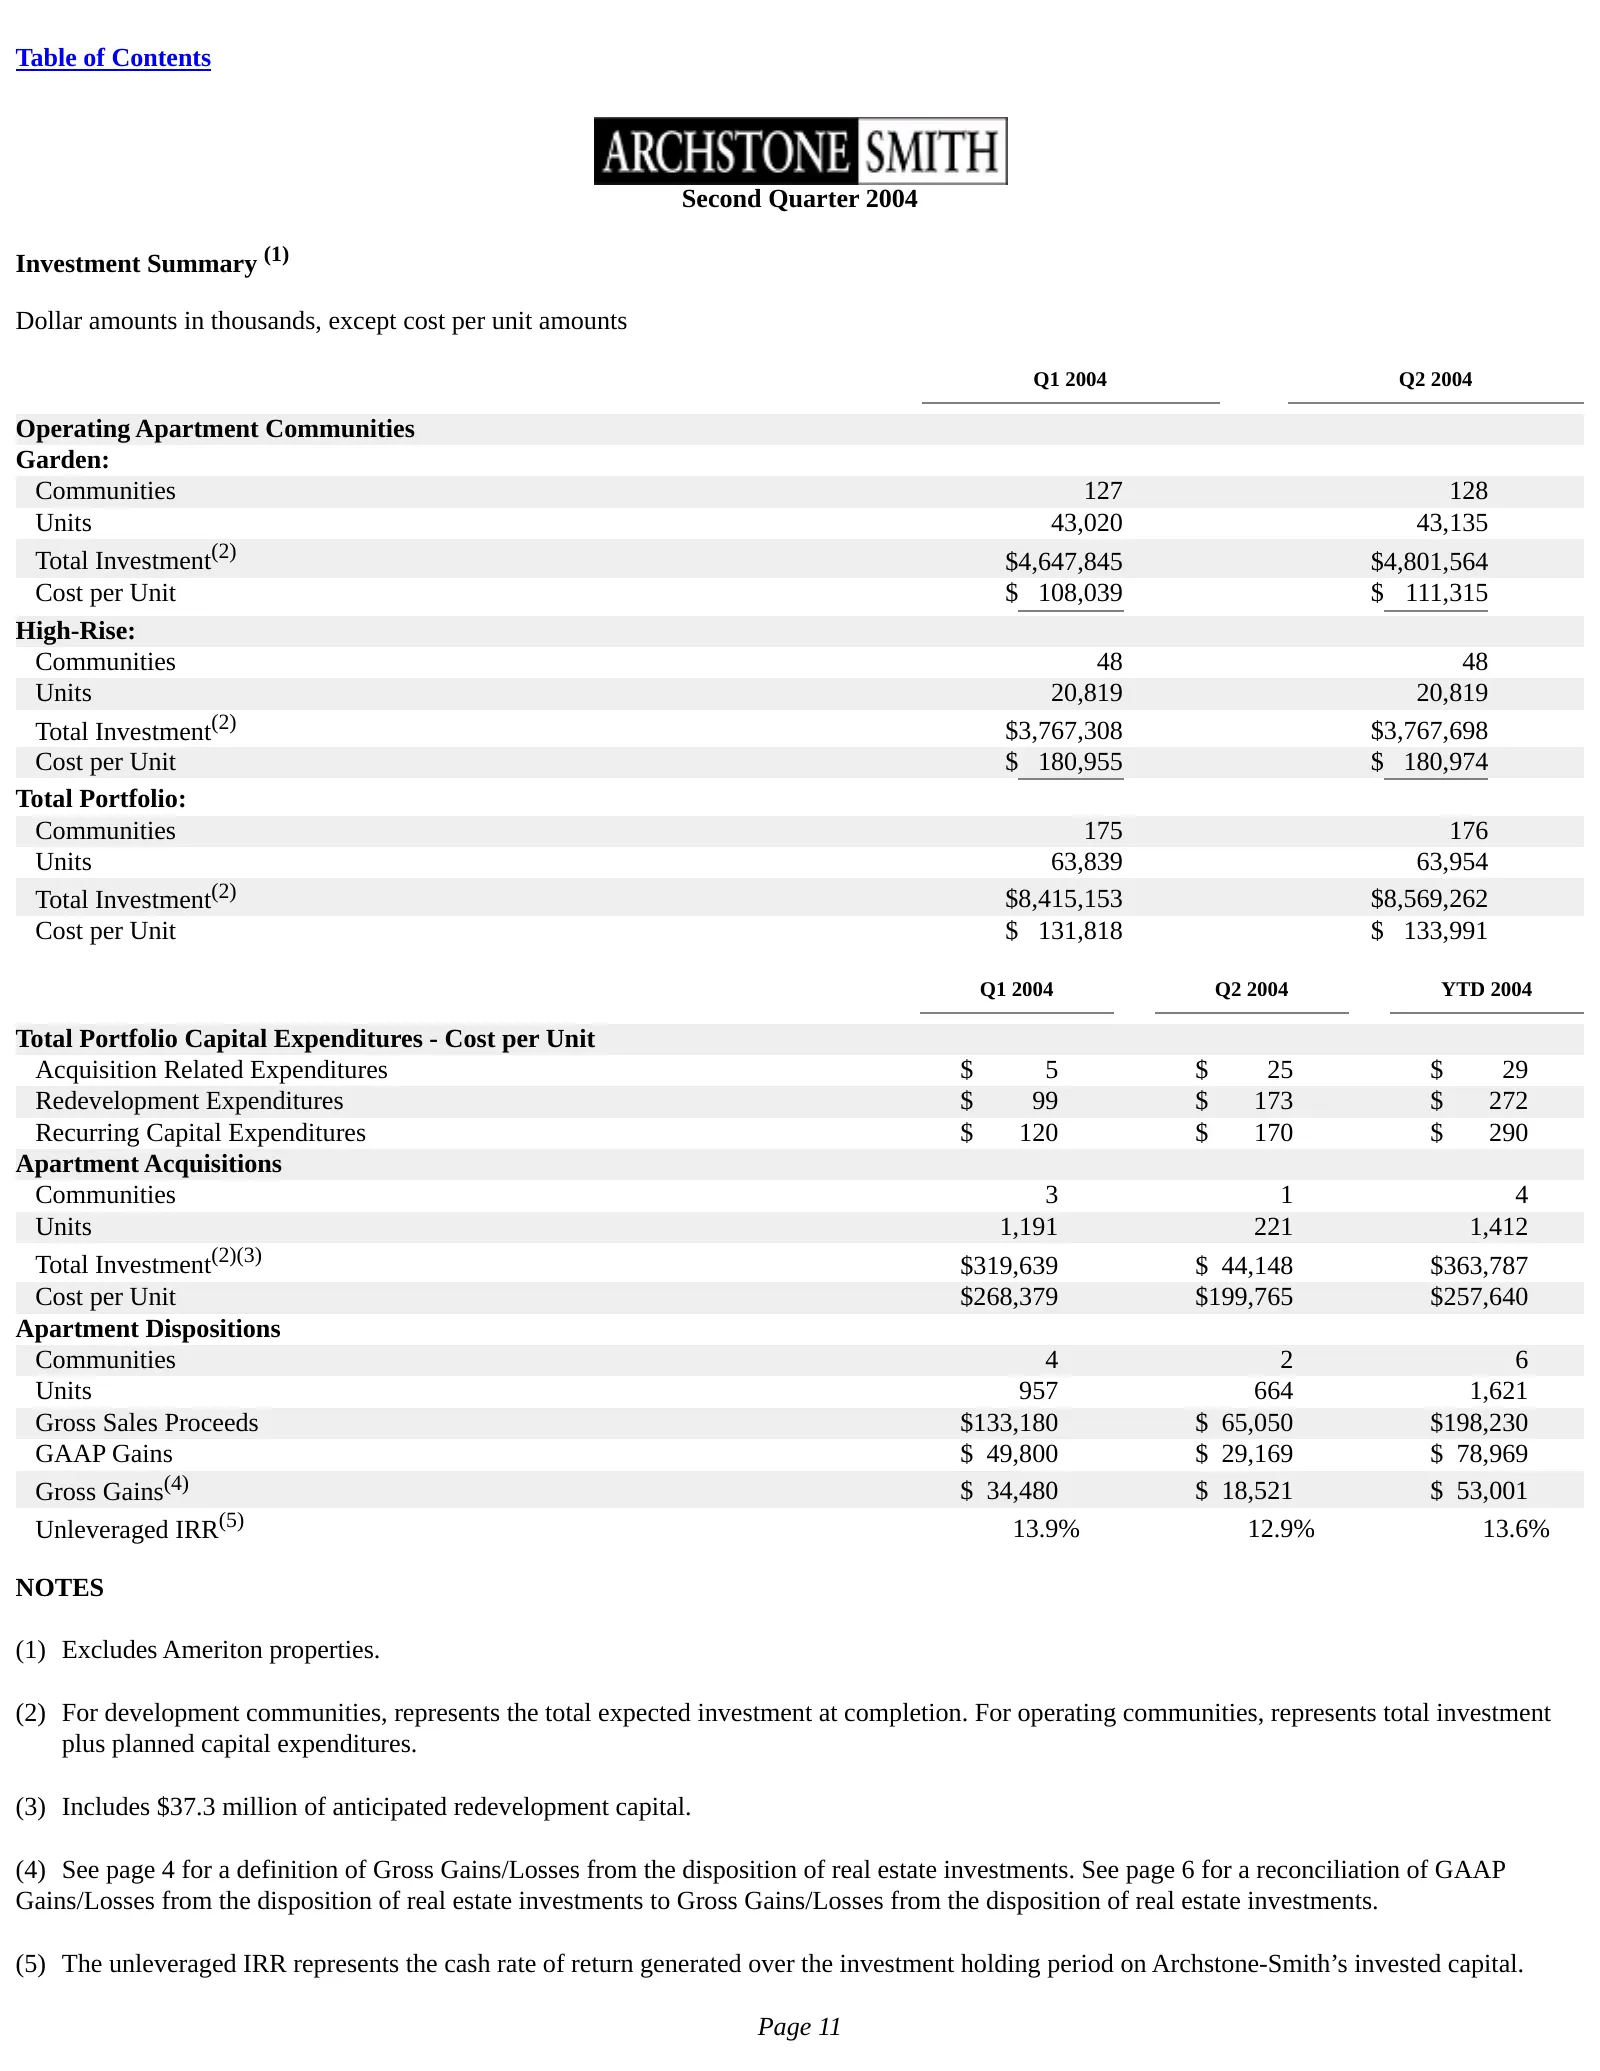
Table of Contents Second Quarter 2004 Investment Summary (1) Dollar amounts in thousands, except cost per unit amounts Q1 2004 Q2 2004 Operating Apartment Communities Garden: Communities 127 128 Units 43,020 43,135 Total Investment(2) $4,647,845 $4,801,564 Cost per Unit $ 108,039 $ 111,315 High-Rise

Slide 56
Slide 57: Second Quarter 2004 Development Summary
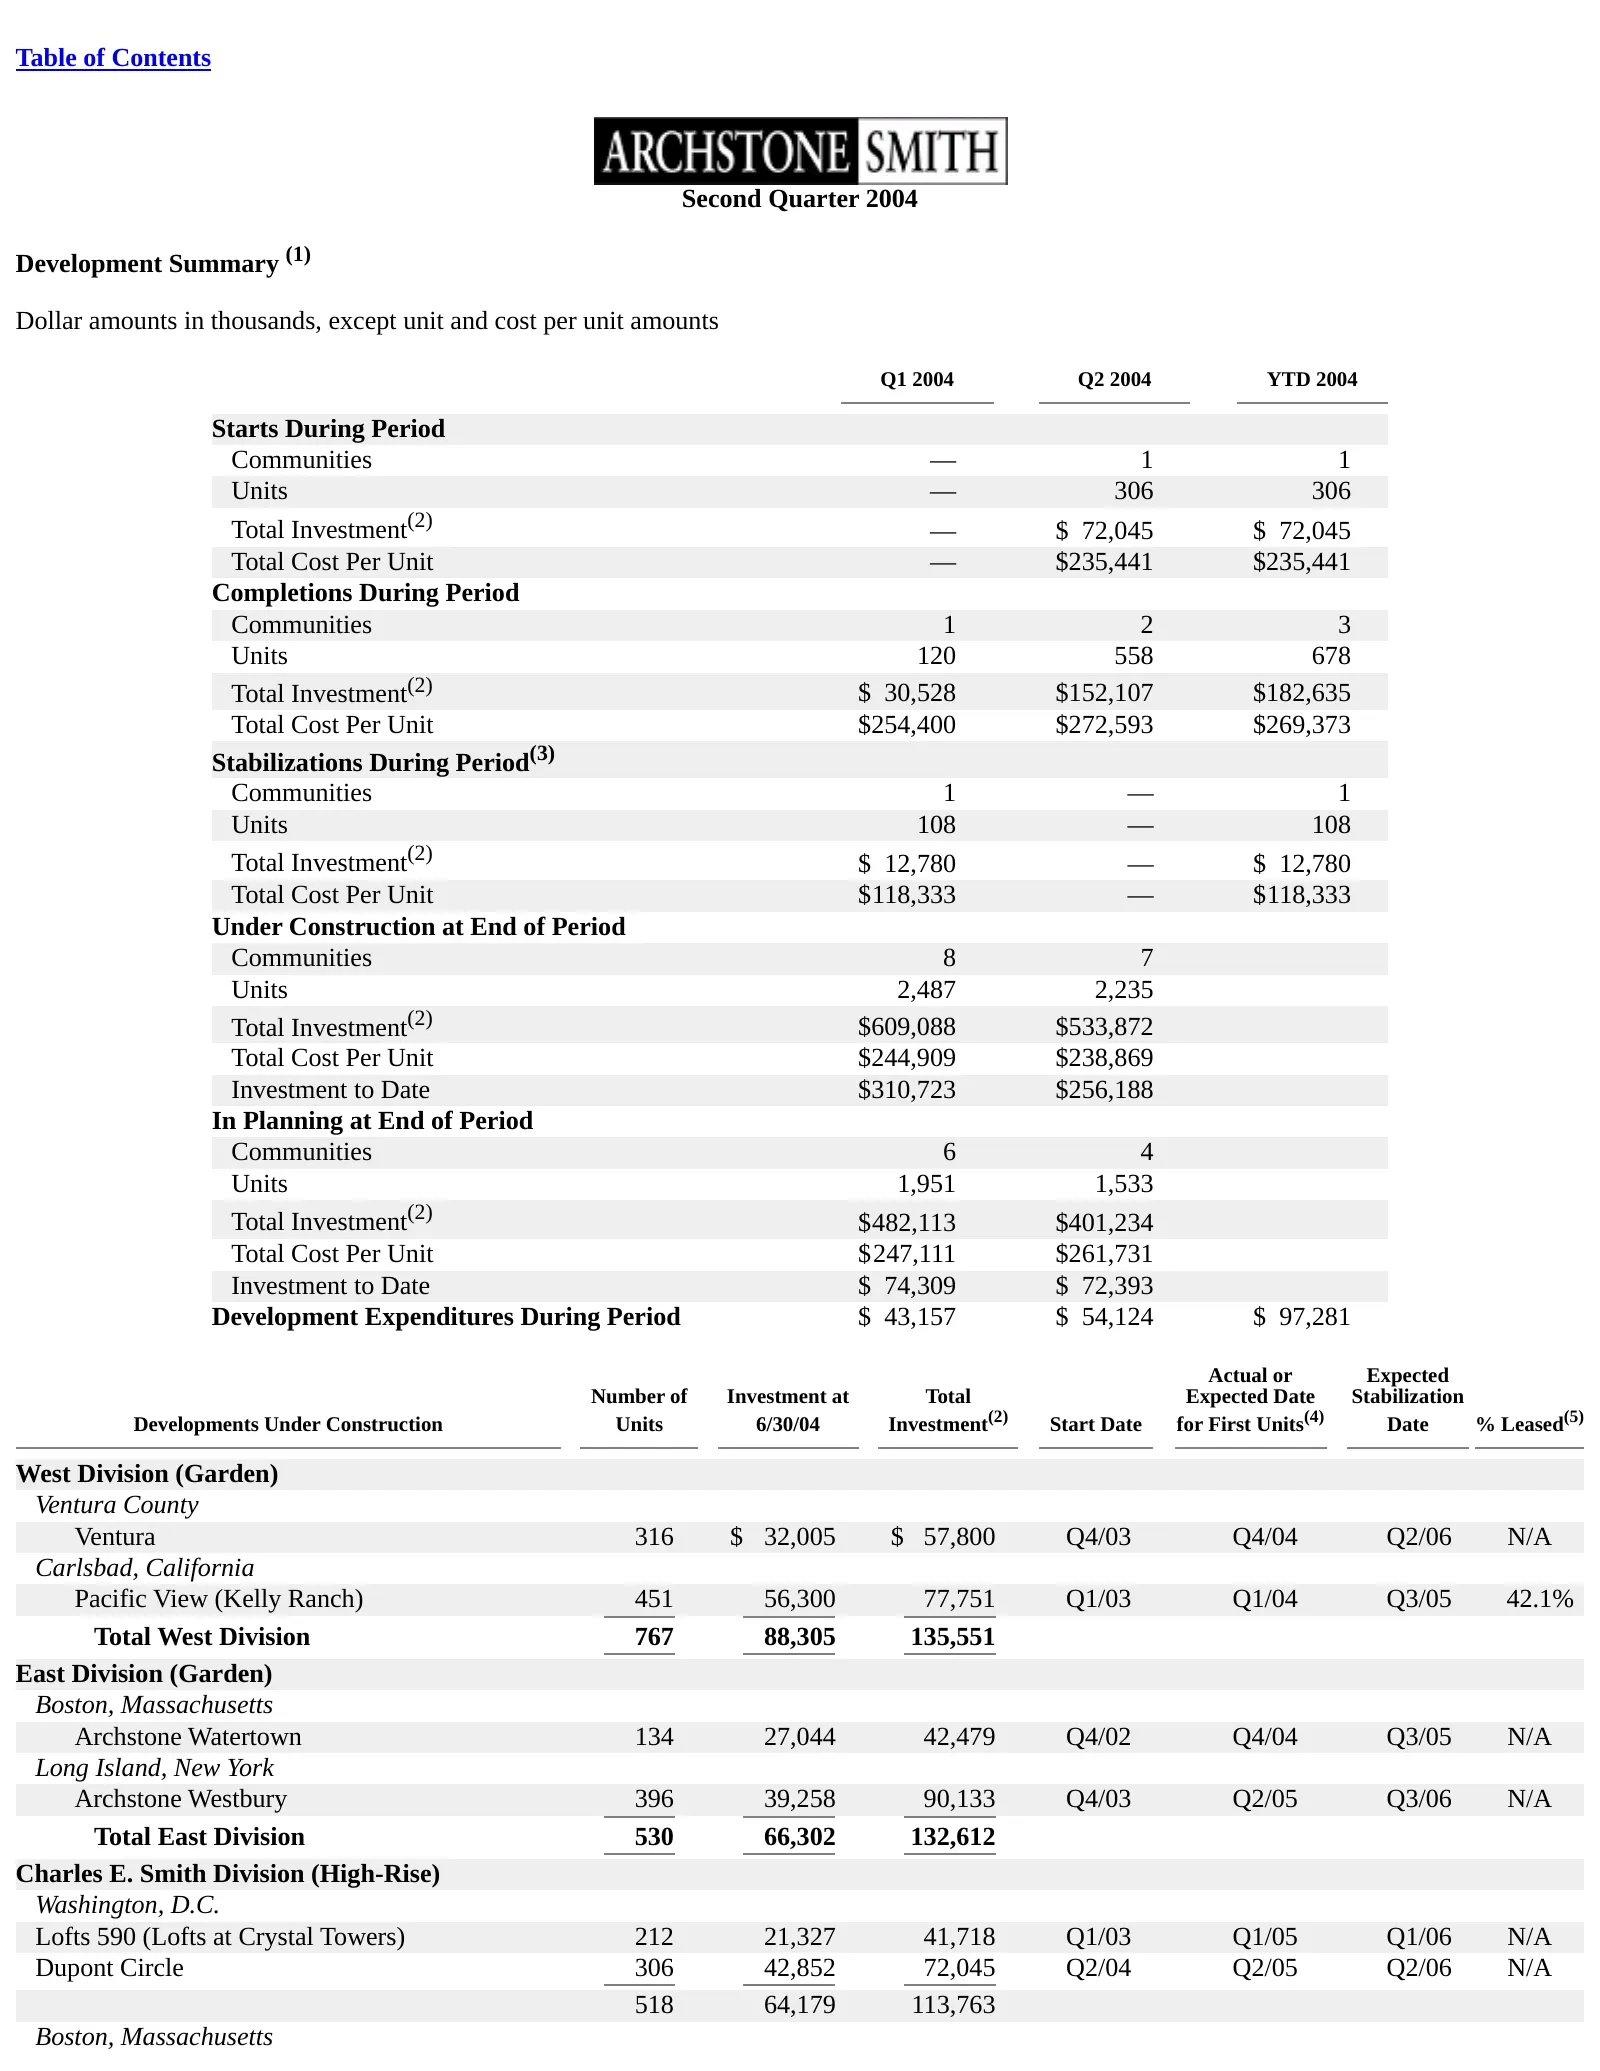
Table of Contents Second Quarter 2004 Development Summary (1) Dollar amounts in thousands, except unit and cost per unit amounts Q1 2004 Q2 2004 YTD 2004 Starts During Period Communities — 1 1 Units — 306 306 Total Investment(2) — $ 72,045 $ 72,045 Total Cost Per Unit — $235,441 $235,441 Completions
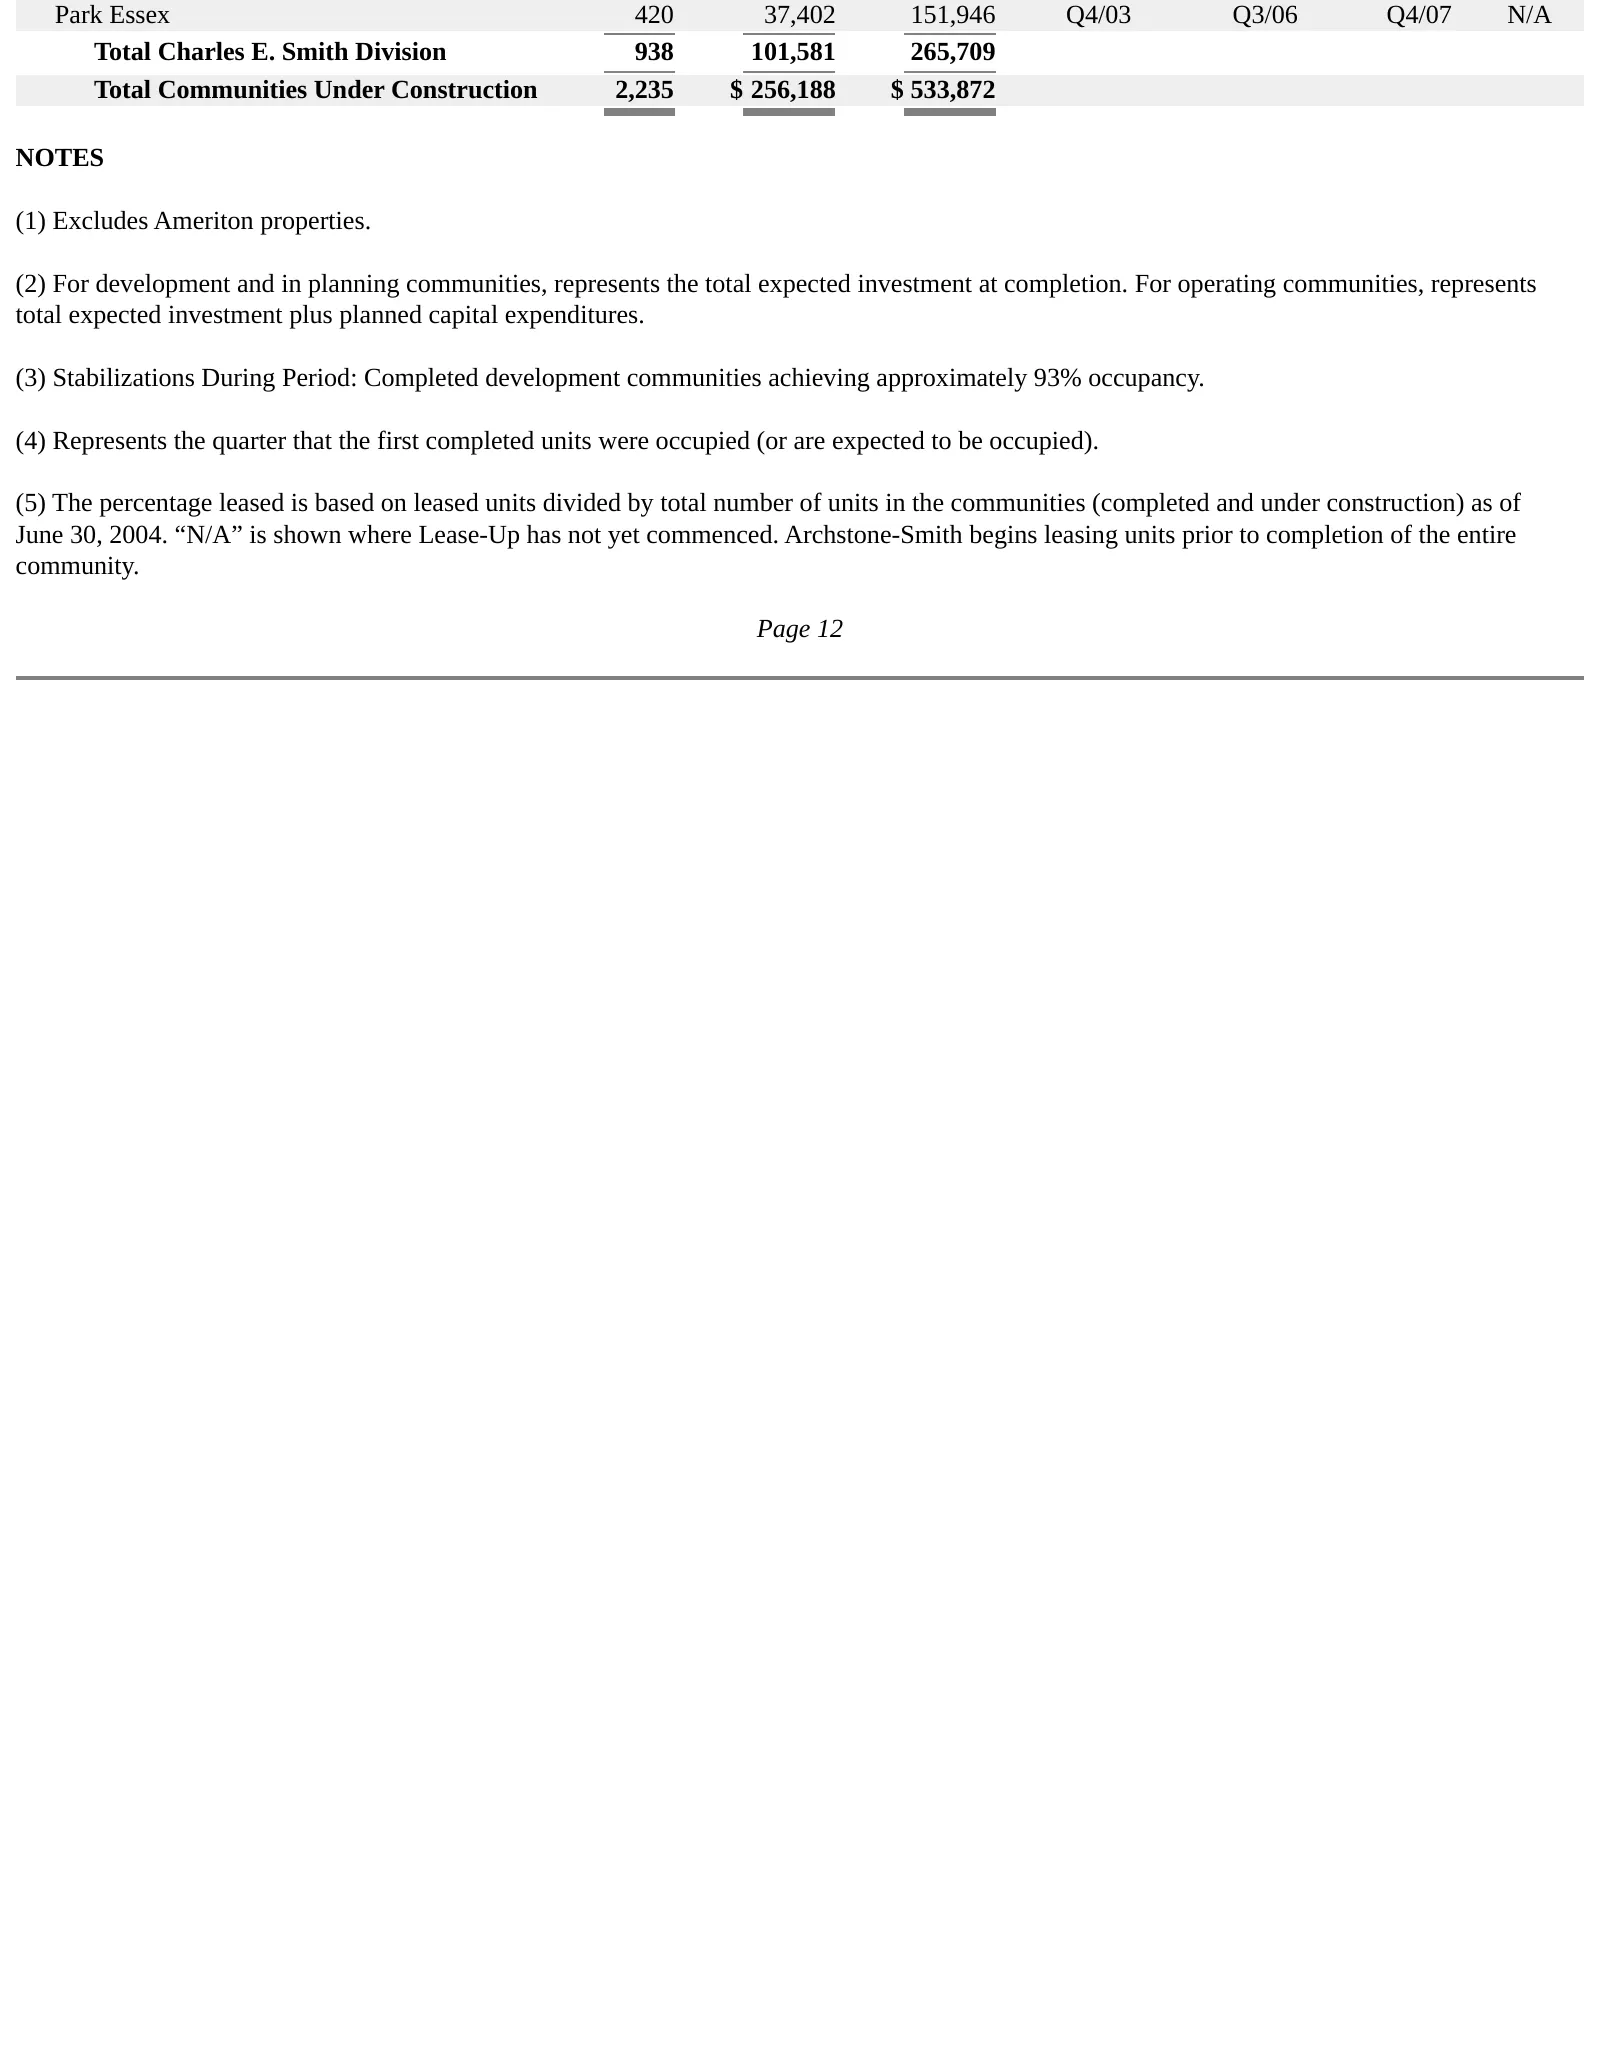
Slide 58: Communities Under Construction
Park Essex 420 37,402 151,946 Q4/03 Q3/06 Q4/07 N/A Total Charles E. Smith Division 938 101,581 265,709 Total Communities Under Construction 2,235 $ 256,188 $ 533,872 NOTES (1) Excludes Ameriton properties. (2) For development and in planning communities, represents the total expected investment at
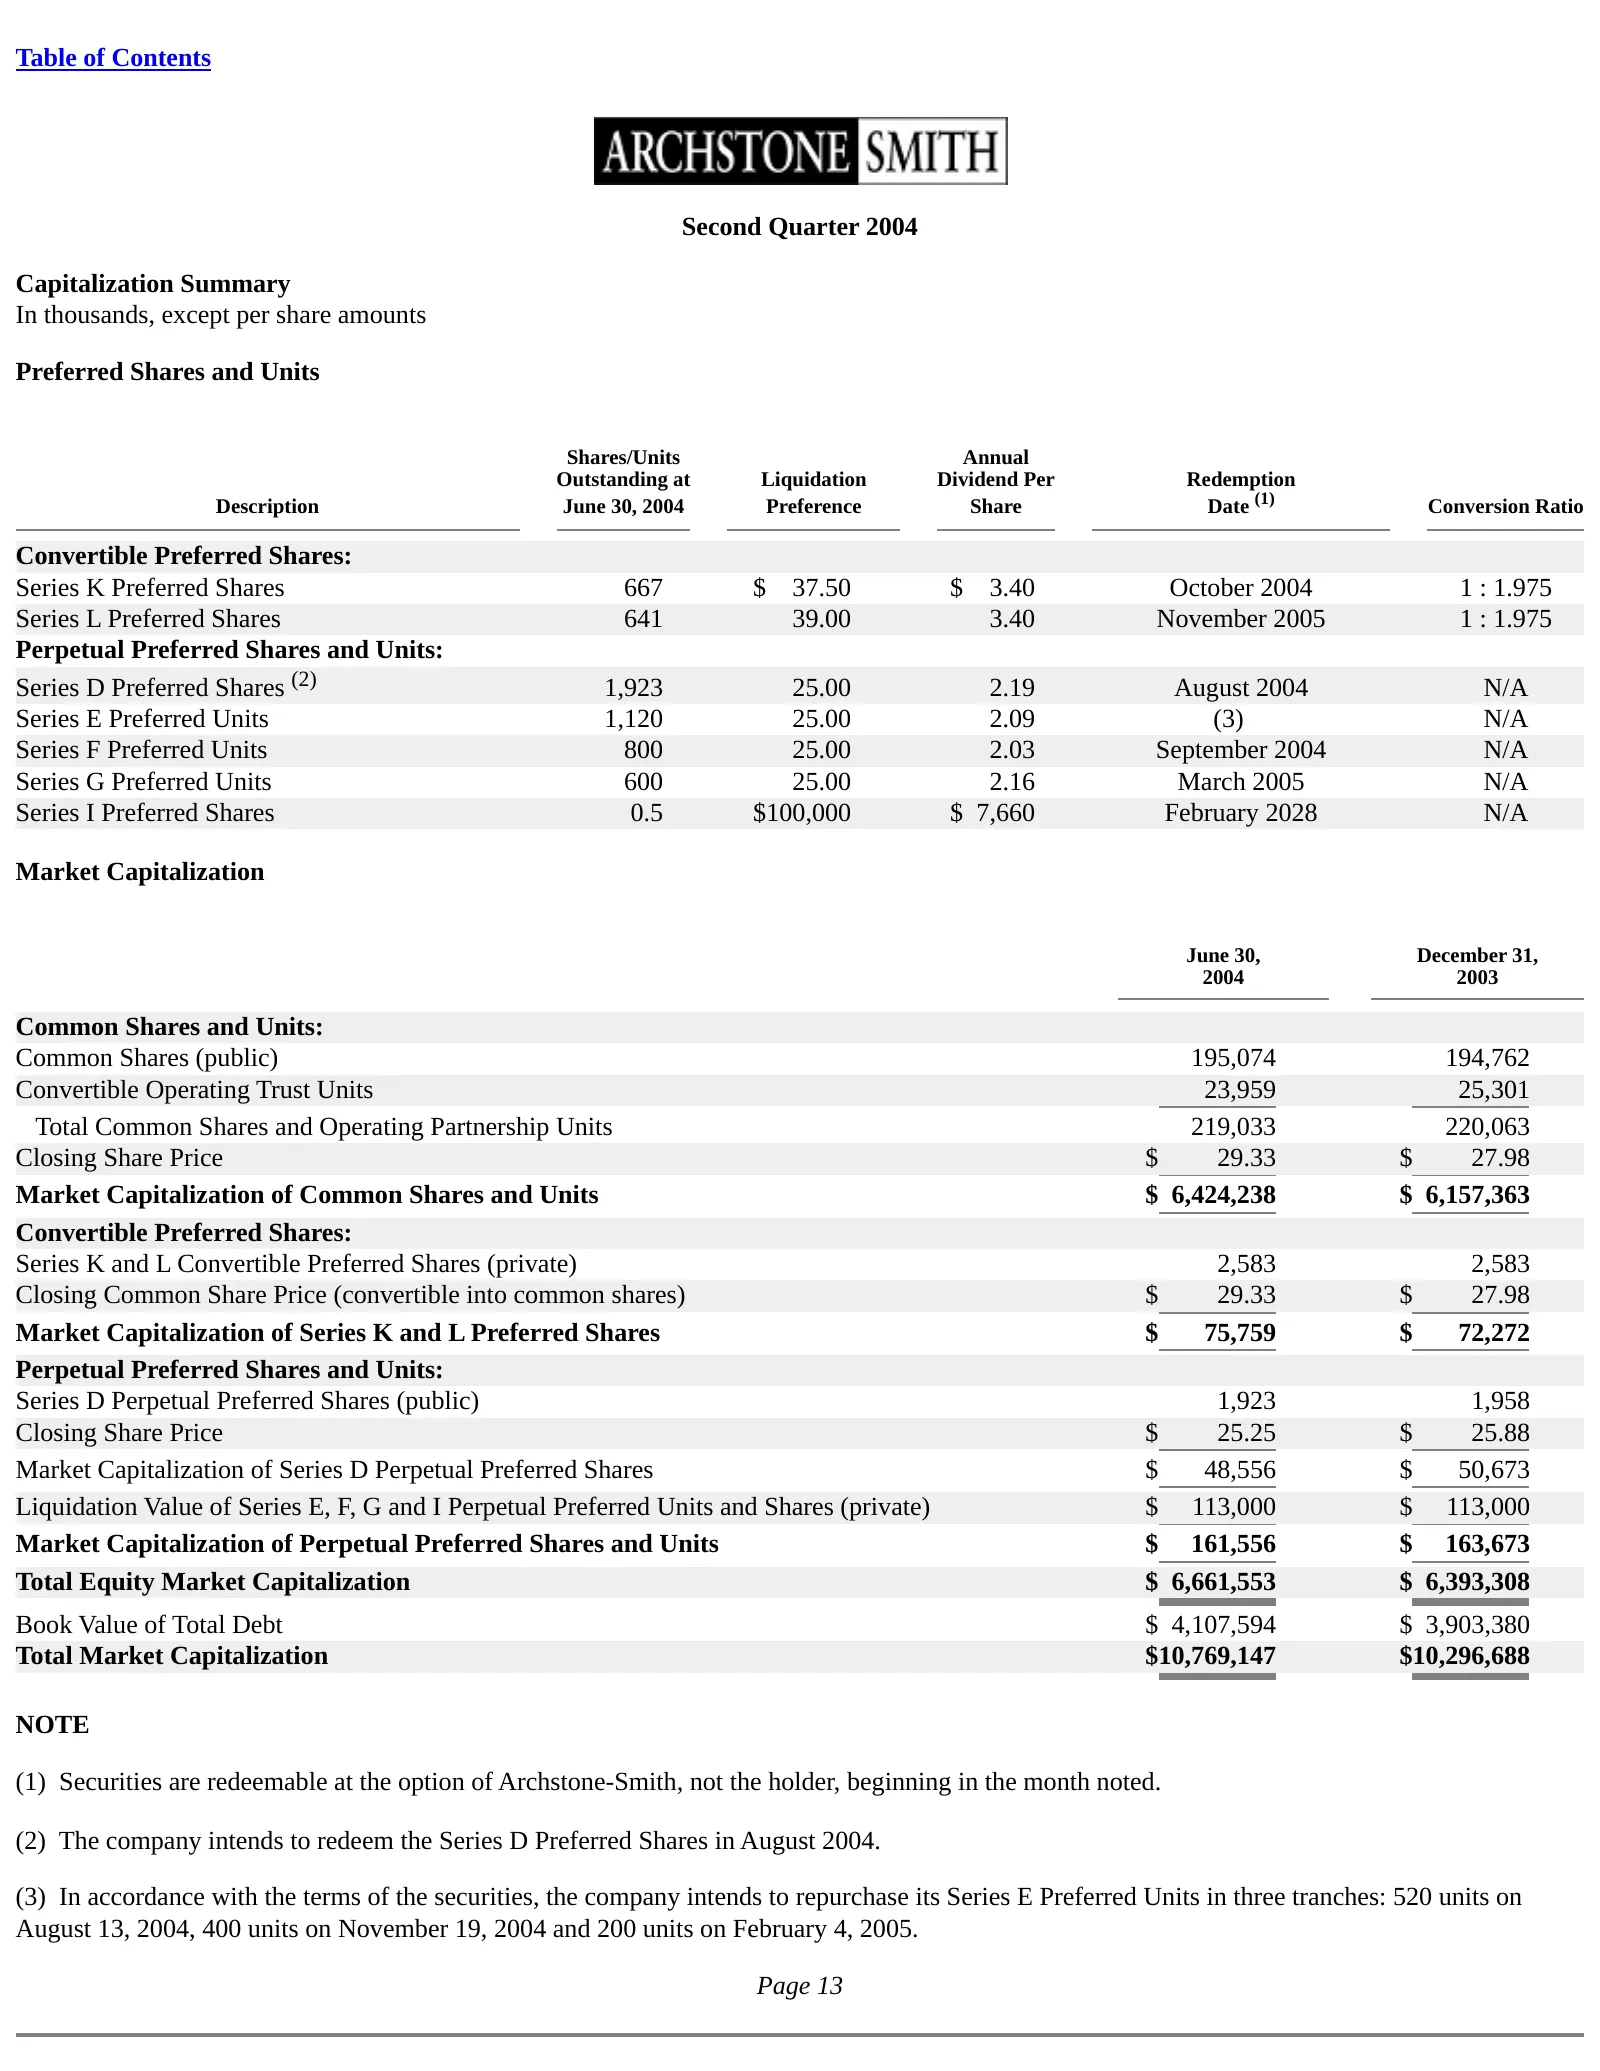
Slide 59: Second Quarter 2004 Capitalization Summary
Table of Contents Second Quarter 2004 Capitalization Summary In thousands, except per share amounts Preferred Shares and Units Shares/Units Annual Outstanding at Liquidation Dividend Per Redemption Description June 30, 2004 Preference Share Date (1) Conversion Ratio Convertible Preferred Shares: Ser
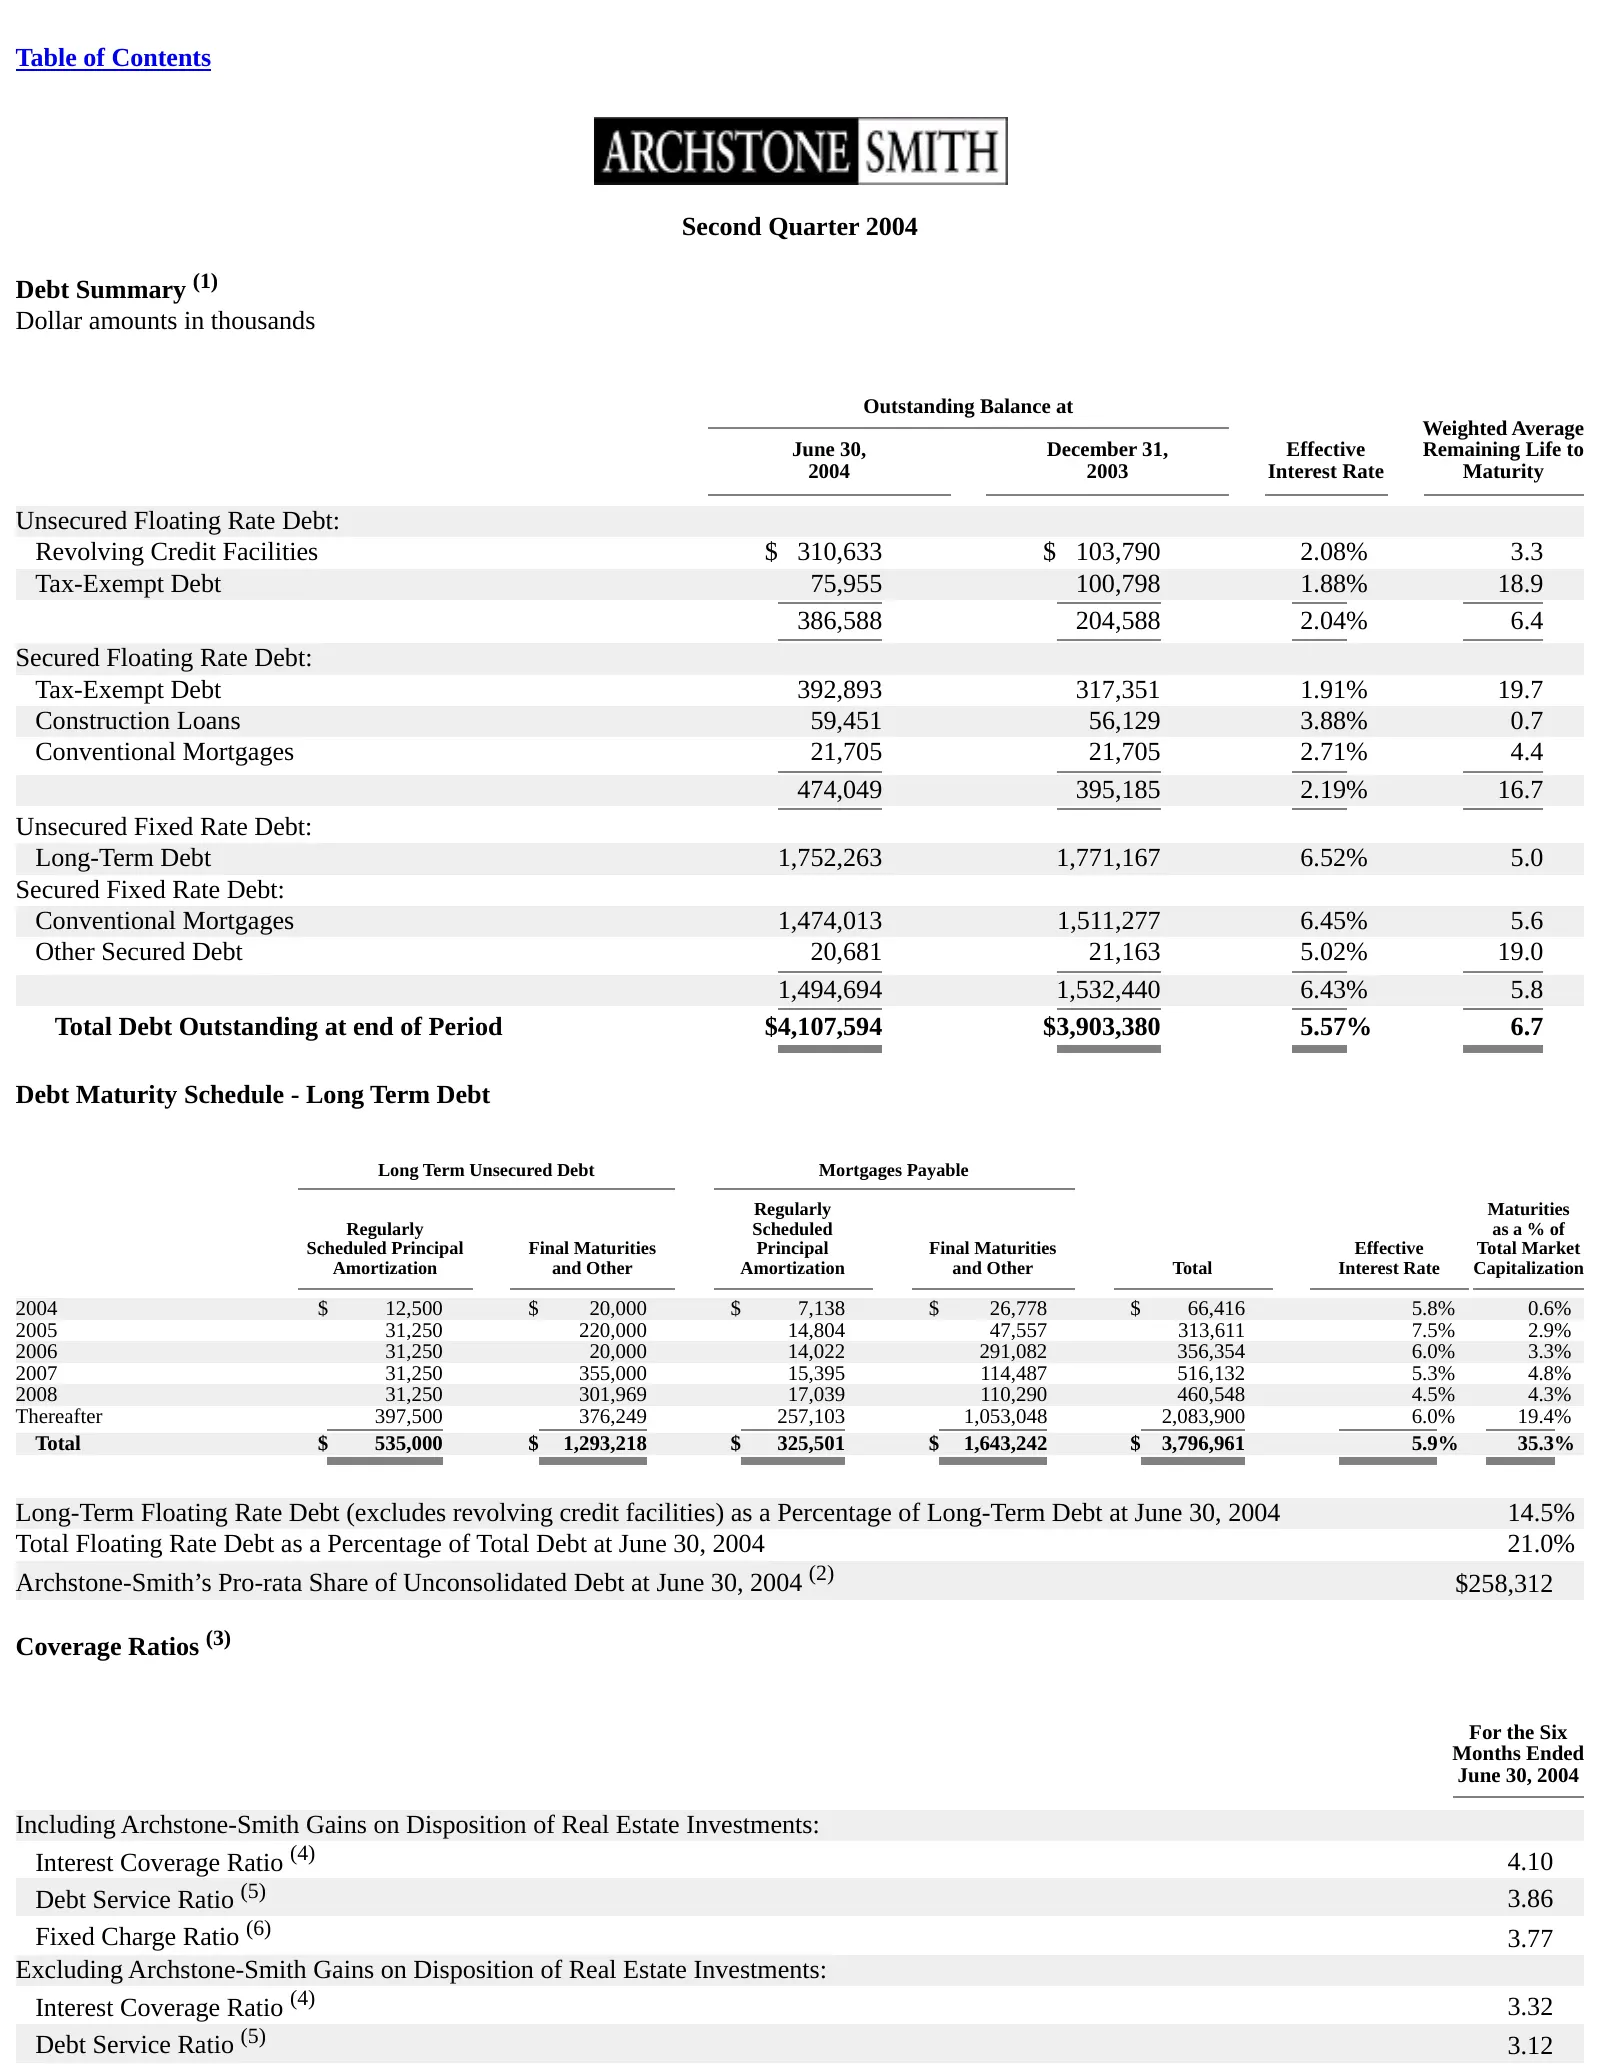
Slide 60: Second Quarter 2004 Debt Summary
Table of Contents Second Quarter 2004 Debt Summary (1) Dollar amounts in thousands Outstanding Balance at Weighted Average June 30, December 31, Effective Remaining Life to 2004 2003 Interest Rate Maturity Unsecured Floating Rate Debt: Revolving Credit Facilities $ 310,633 $ 103,790 2.08% 3.3 Tax-Ex
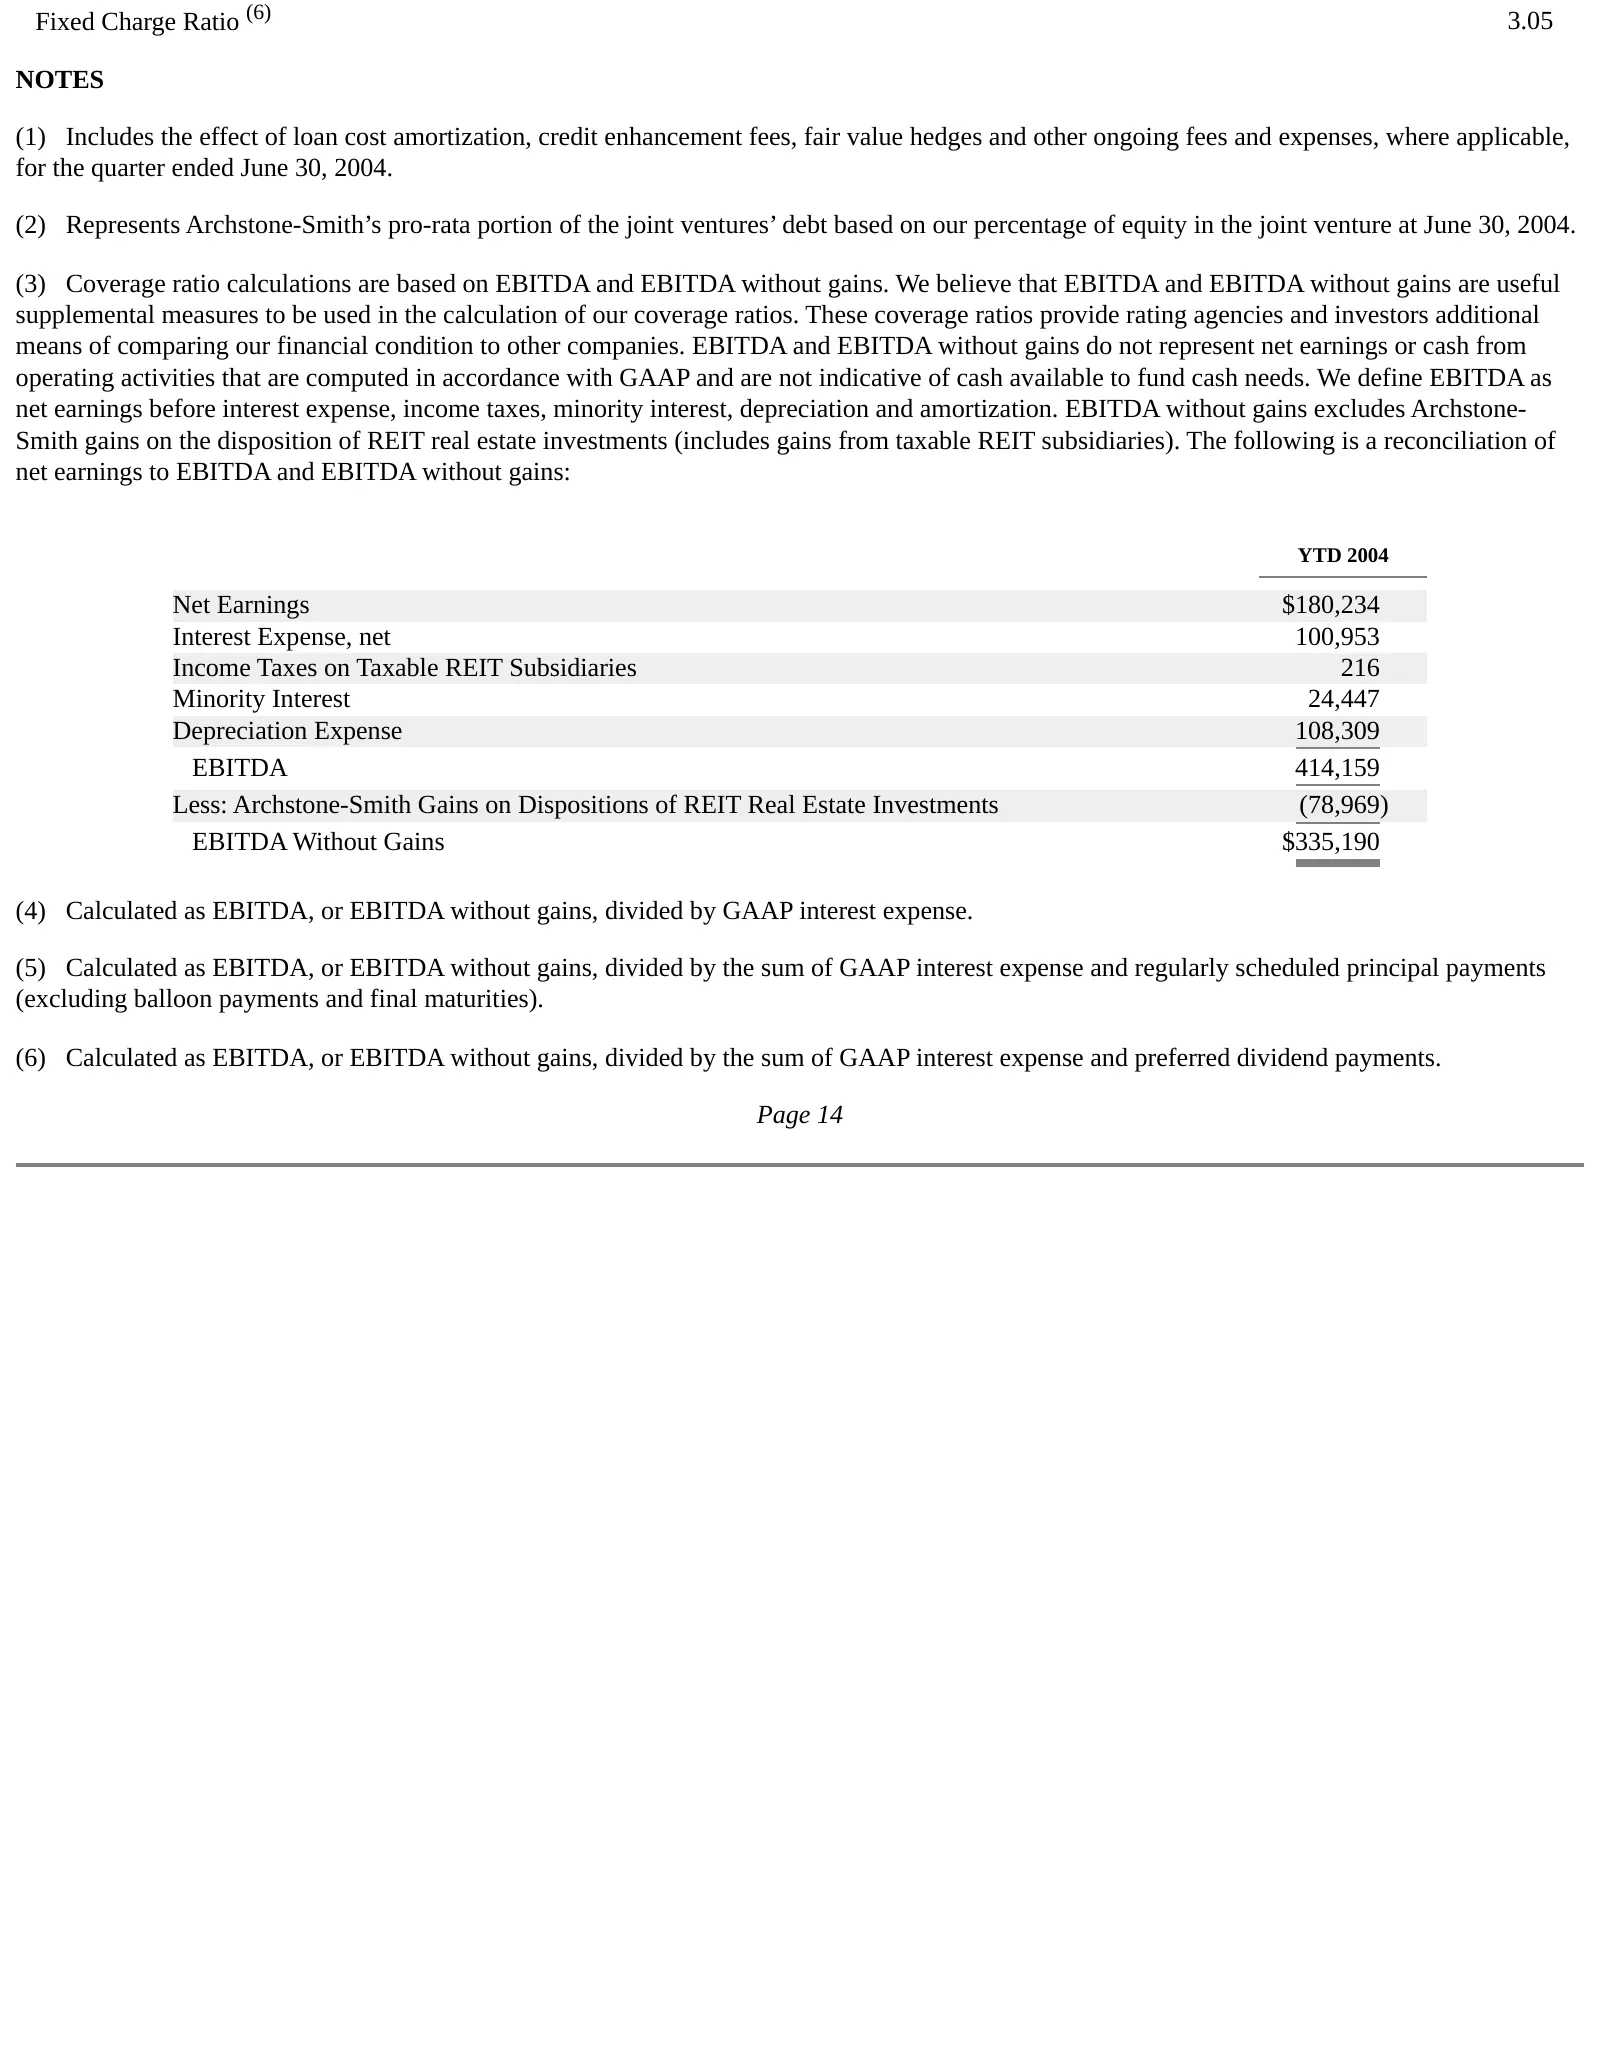
Slide 61: Fixed Charge Ratio and notes
Fixed Charge Ratio (6) 3.05 NOTES (1) Includes the effect of loan cost amortization, credit enhancement fees, fair value hedges and other ongoing fees and expenses, where applicable, for the quarter ended June 30, 2004. (2) Represents Archstone-Smith’s pro-rata portion of the joint ventures’ debt ba
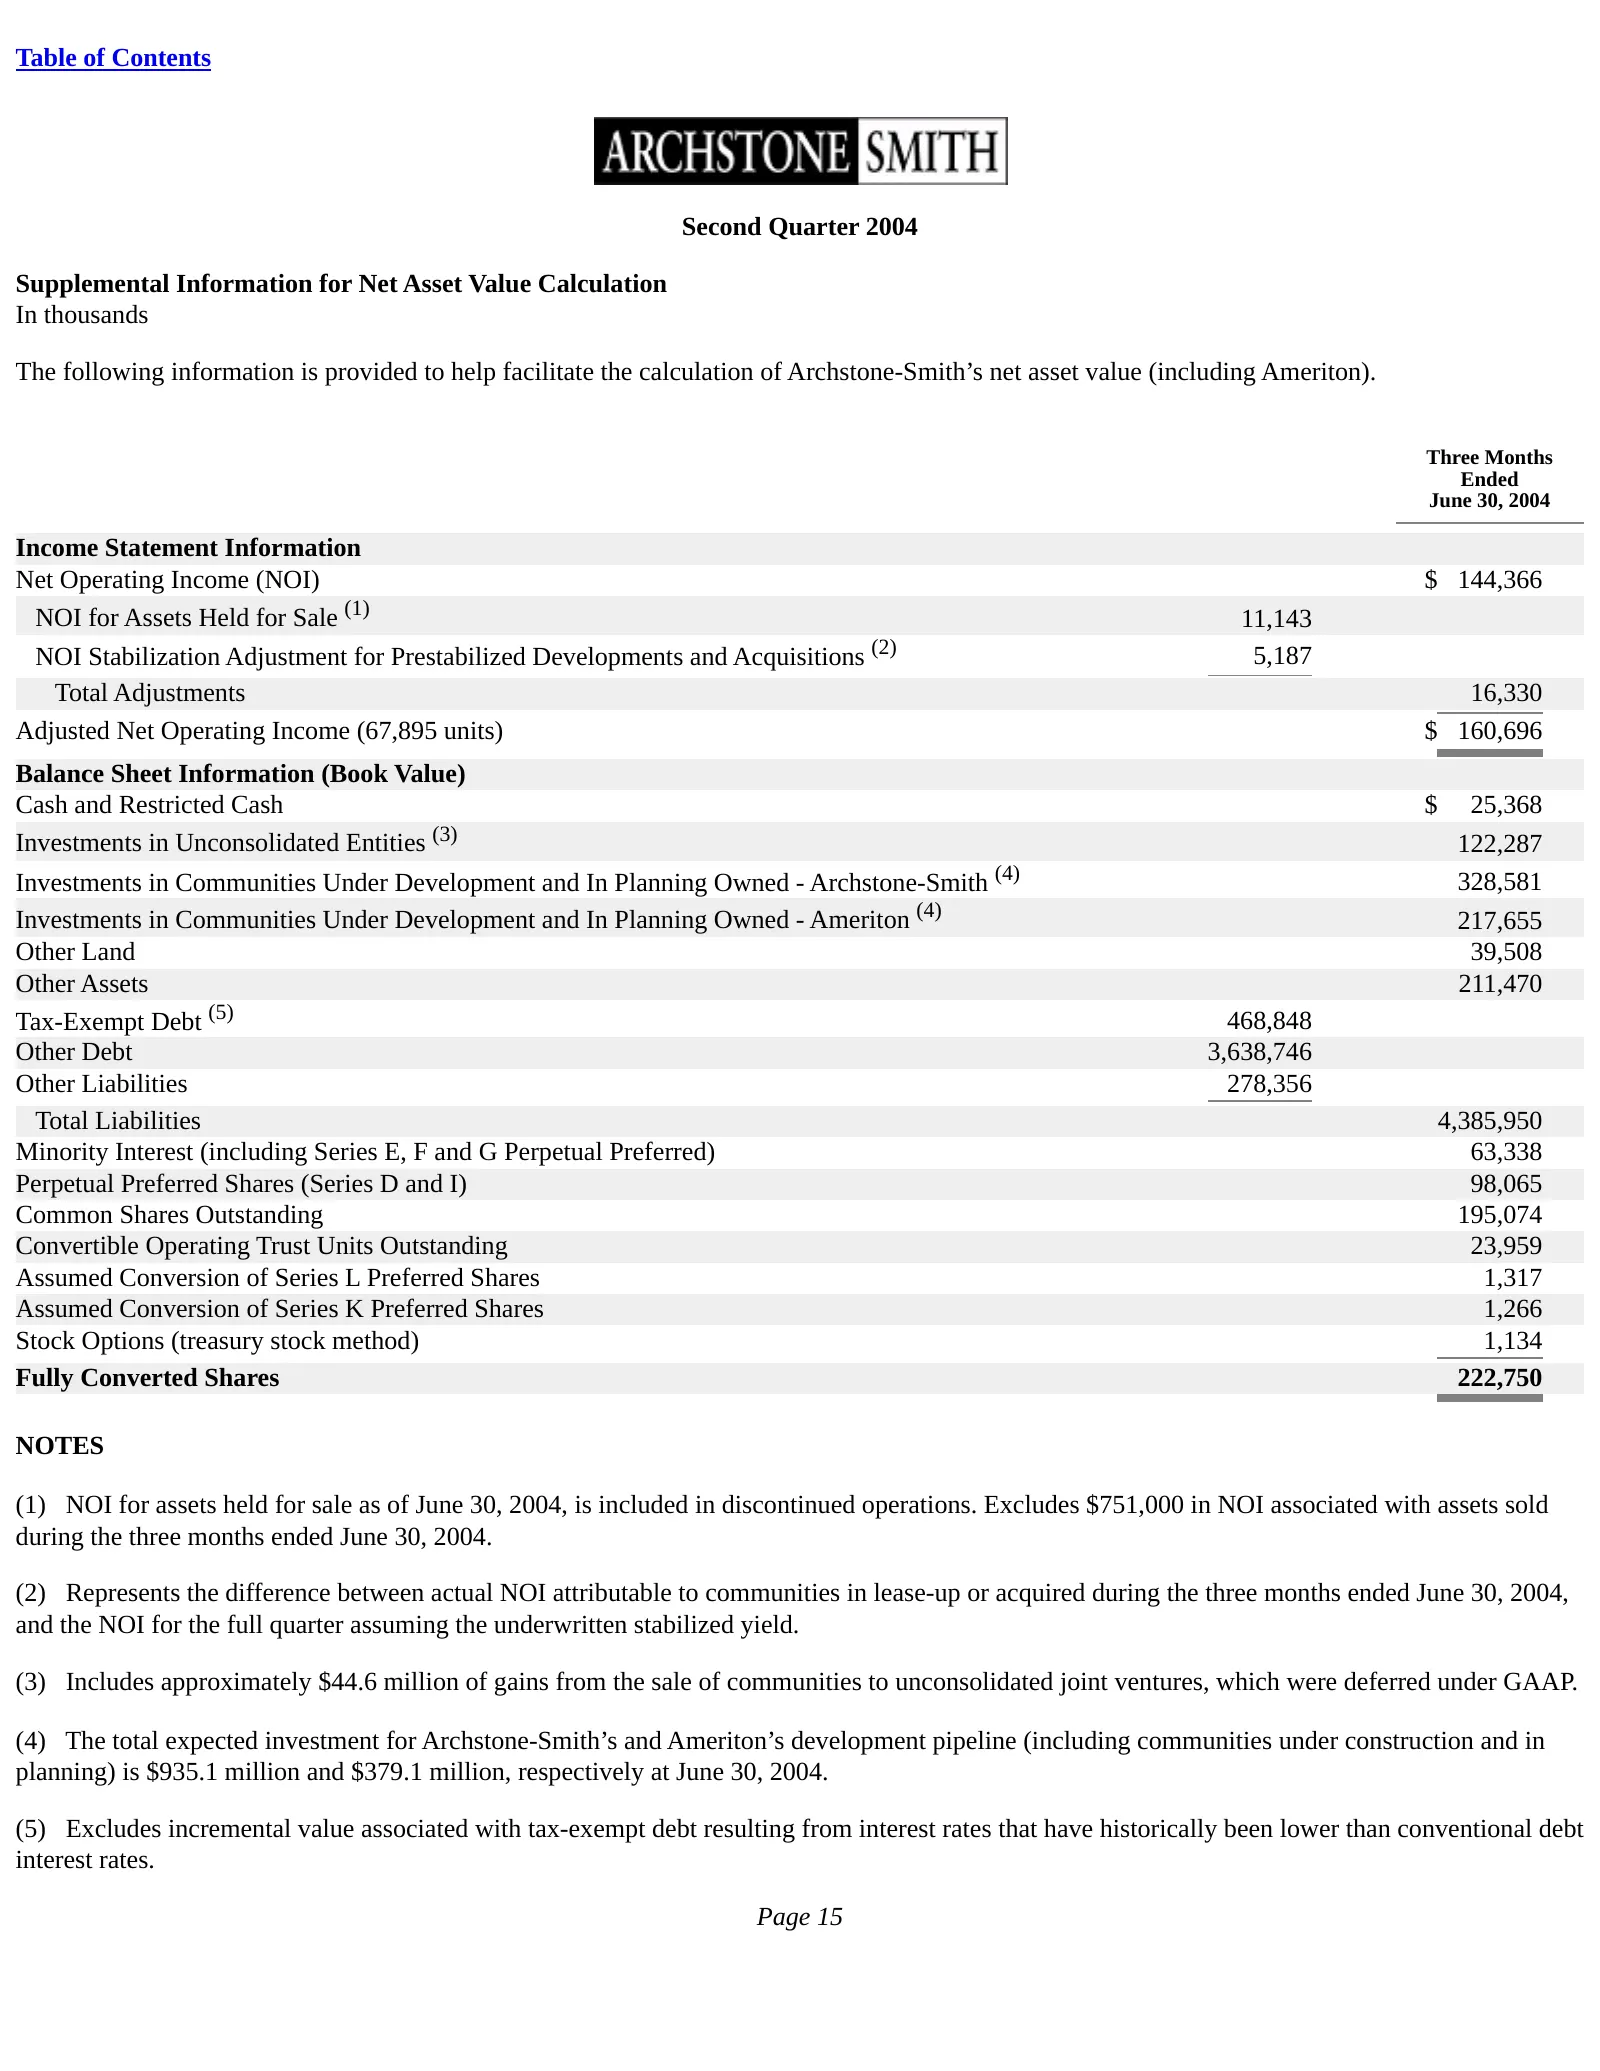
Slide 62: Supplemental Information for Net Asset Value Calculation
Table of Contents Second Quarter 2004 Supplemental Information for Net Asset Value Calculation In thousands The following information is provided to help facilitate the calculation of Archstone-Smith’s net asset value (including Ameriton). Three Months Ended June 30, 2004 Income Statement Informatio
Source: SEC EDGAR · 8-K filed Oct 12, 2004
More decks from Archstone Smith Trust
 Citigroup 2007 Global Property CEO Conference26 slides · Mar 5, 2007
 NAREIT Annual Convention 200625 slides · Nov 7, 2006
 NAREIT Institutional Investor Forum June 200626 slides · Jun 5, 2006
 Corporate Update (June 2006)14 slides · Jun 5, 2006
 Corporate Update (April 2006)17 slides · Apr 11, 2006
 Citigroup REIT CEO Conference March 200620 slides · Mar 7, 2006