Archstone Smith Trust — NAREIT Institutional Investor Forum June 2006
26 slides from Archstone Smith Trust's conference presentation, Jun 5, 2006
Slide 1: NAREIT Institutional Investor Forum June 2006
NAREIT Institutional Investor Forum June 2006
Slide 2: Safe Harbor
Safe Harbor In addition to historical information, this presentation contains forward-looking statements and information under the federal securities laws. These statements are based on current expectations, estimates and projections about the industry and markets in which Archstone-Smith and/or Ame
Slide 3: Archstone-Smith Profile
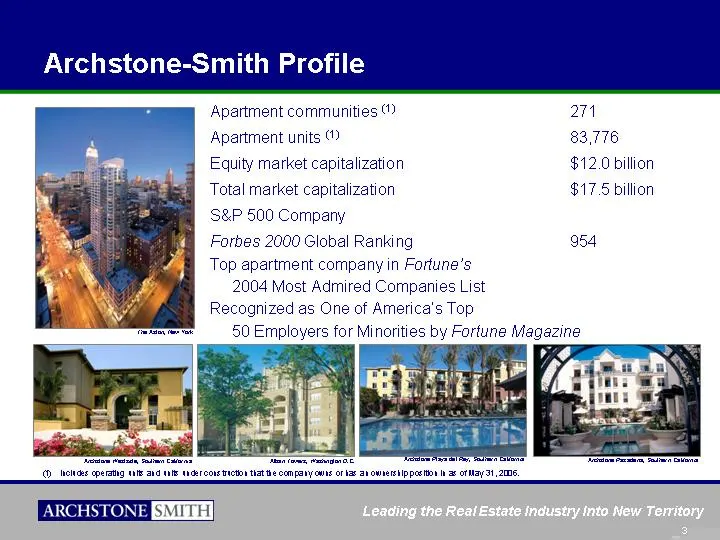
Archstone-Smith Profile Includes operating units and units under construction that the company owns or has an ownership position in as of May 31, 2006. Apartment communities (1) 271 Apartment units (1) 83,776 Equity market capitalization $12.0 billion Total market capitalization $17.5 billion S&P 50
Slide 4: The Result is Outstanding Performance
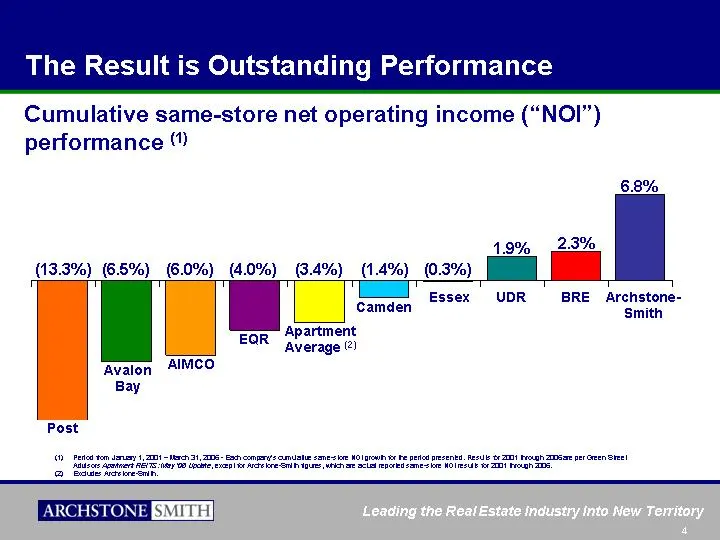
PPS AVB AIV EQR CPT ESS UDR BRE ASN -13.3 -6.5 -6 -4 -3.4 -1.4 -0.07 1.9 2.3 6.8 Cumulative same-store net operating income ("NOI") performance (1) The Result is Outstanding Performance Avalon Bay AIMCO EQR Camden Essex BRE UDR Archstone- Smith (13.3%) (6.0%) (4.0%) (1.4%) (0.3%) 1.9% 2.3% 6.8% Post
Slide 5: Spread is significantly larger in protected markets
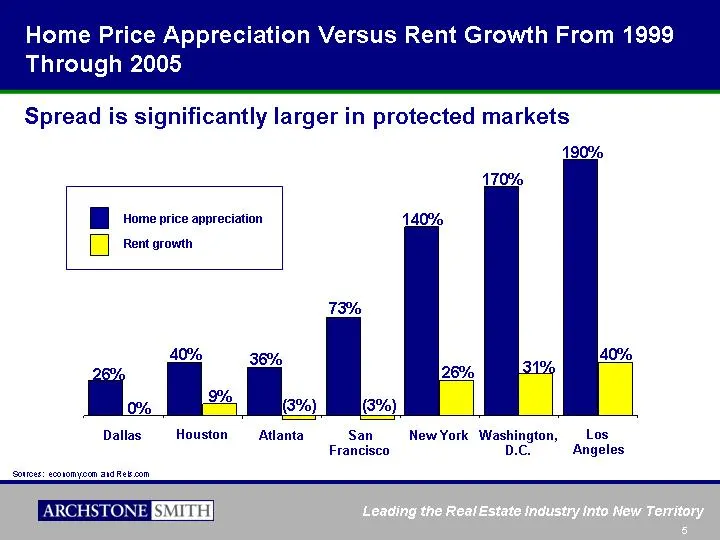
Spread is significantly larger in protected markets Home Price Appreciation Versus Rent Growth From 1999 Through 2005 Sources: economy.com and Reis.com 1 2 3 4 5 6 7 a 0.26 0.4 0.36 0.73 1.4 1.7 1.9 b 0 0.09 -0.03 -0.03 0.26 0.31 0.4 190% 40% 140% (3%) 36% 9% 40% 0% 26% (3%) 73% 31% 170% 26% Houston
Slide 6: Huge Gap Between Buying & Renting in Core Sub-Markets
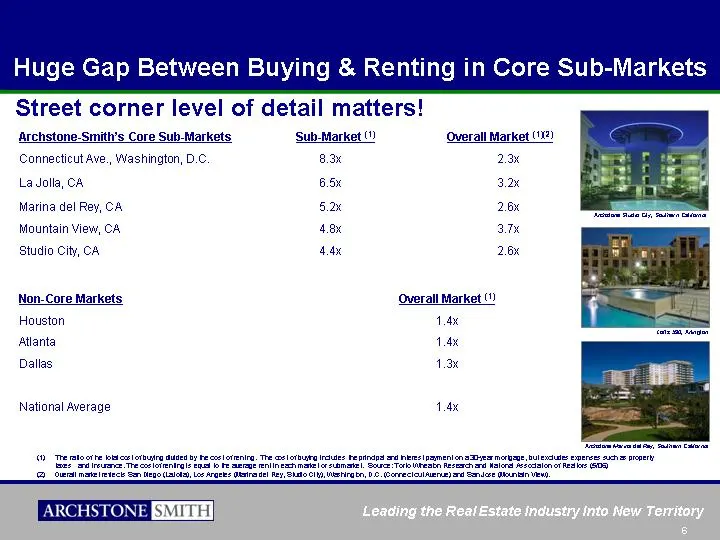
Huge Gap Between Buying & Renting in Core Sub-Markets The ratio of the total cost of buying divided by the cost of renting. The cost of buying includes the principal and interest payment on a 30-year mortgage, but excludes expenses such as property taxes and insurance. The cost of renting is equal t
Slide 7: Protected Versus Commodity Markets
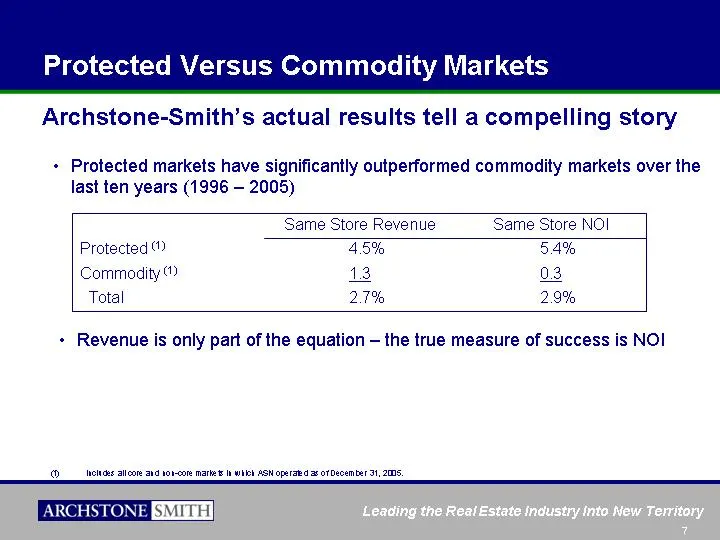
Protected markets have significantly outperformed commodity markets over the last ten years (1996 - 2005) Same Store Revenue Same Store NOI Protected (1) 4.5% 5.4% Commodity (1) 1.3 0.3 Total 2.7% 2.9% Includes all core and non-core markets in which ASN operated as of December 31, 2005. Archstone-Sm
Slide 8: Protected Versus Commodity Markets: Disposition Returns
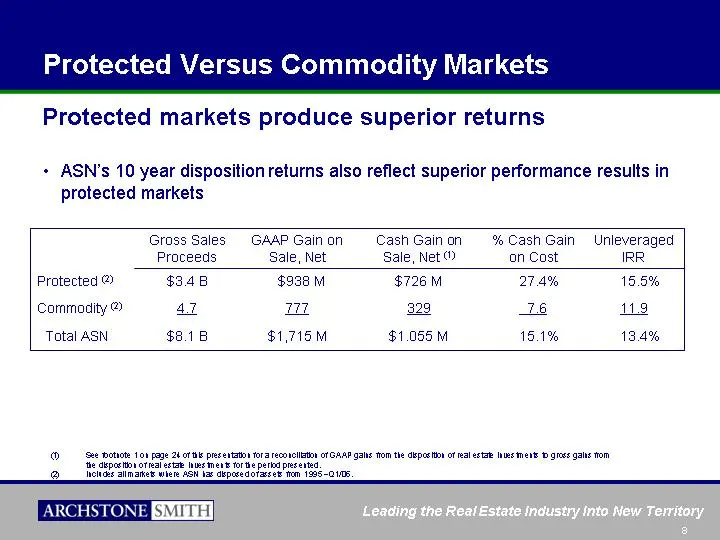
ASN's 10 year disposition returns also reflect superior performance results in protected markets Gross Sales Proceeds GAAP Gain on Sale, Net Cash Gain on Sale, Net (1) % Cash Gain on Cost Unleveraged IRR Protected (2) $3.4 B $938 M $726 M 27.4% 15.5% Commodity (2) 4.7 777 329 7.6 11.9 Total ASN $8.1
Slide 9: Successful Capital Redeployment Program
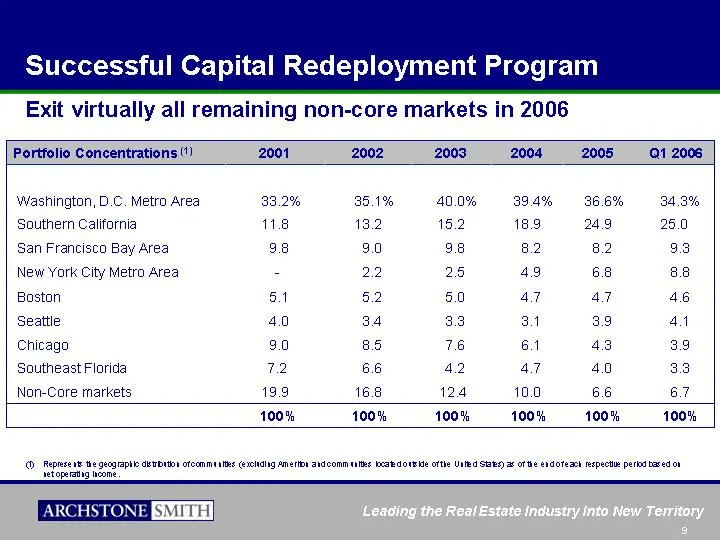
Successful Capital Redeployment Program Exit virtually all remaining non-core markets in 2006 Portfolio Concentrations (1) 2001 2002 2003 2004 2005 Q1 2006 Washington, D.C. Metro Area 33.2% 35.1% 40.0% 39.4% 36.6% 34.3% Southern California 11.8 13.2 15.2 18.9 24.9 25.0 San Francisco Bay Area 9.8 9.0
Slide 10: Greater New York City Metropolitan Area High-Rise Portfolio
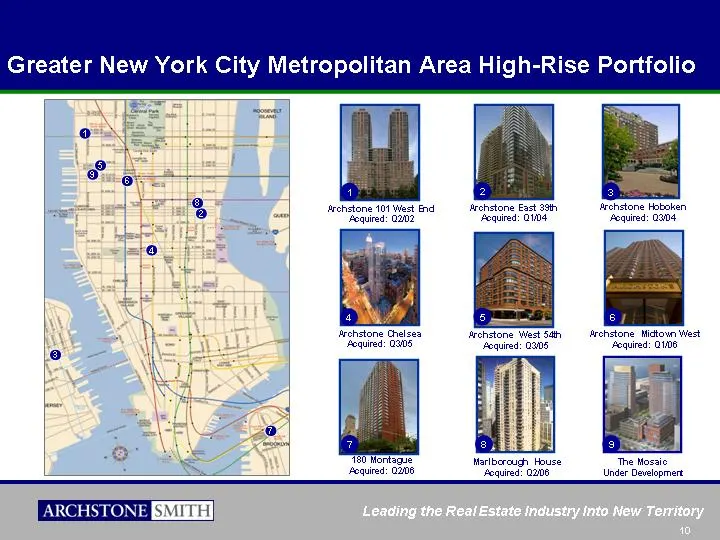
Greater New York City Metropolitan Area High-Rise Portfolio Archstone Hoboken Acquired: Q3/04 3 Archstone Chelsea Acquired: Q3/05 4 The Mosaic Under Development 9 Archstone East 39th Acquired: Q1/04 2 Archstone West 54th Acquired: Q3/05 5 180 Montague Acquired: Q2/06 7 Archstone 101 West End Acquire
Slide 11: Incremental Value Embedded in $4.1 Billion Development Pipeline
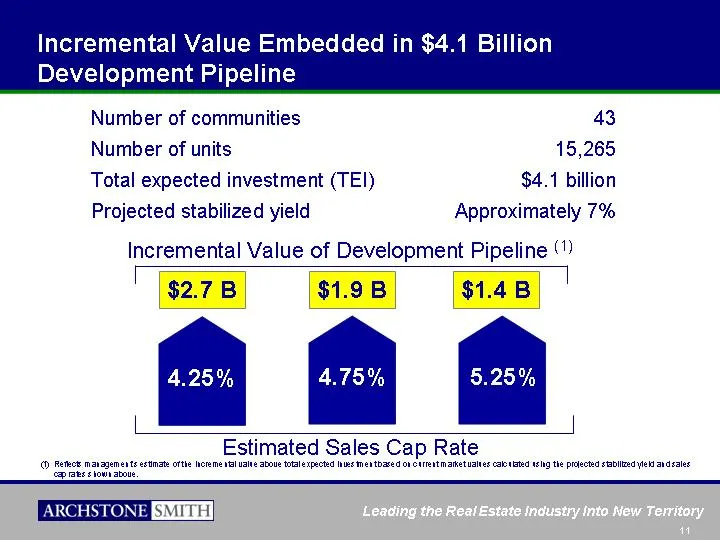
Incremental Value Embedded in $4.1 Billion Development Pipeline Estimated Sales Cap Rate Incremental Value of Development Pipeline (1) 4.75% 5.25% $2.7 B $1.9 B $1.4 B Number of communities 43 Number of units 15,265 Total expected investment (TEI) $4.1 billion Projected stabilized yield Approximatel
Slide 12: Ameriton Properties Incorporated
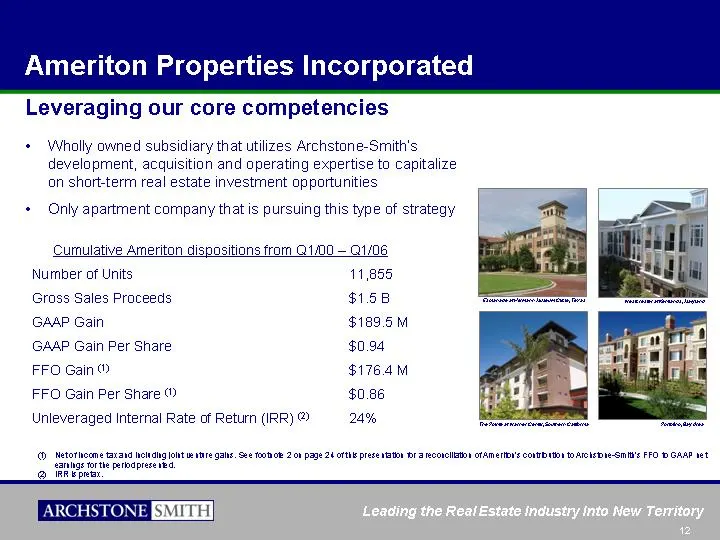
Ameriton Properties Incorporated Net of income tax and including joint venture gains. See footnote 2 on page 24 of this presentation for a reconciliation of Ameriton's contribution to Archstone-Smith's FFO to GAAP net earnings for the period presented. IRR is pretax. Leveraging our core competencies
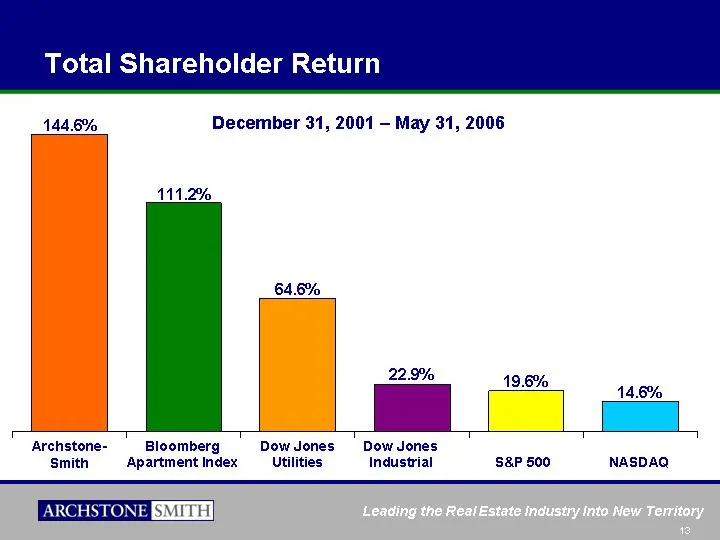
Slide 13: Total Shareholder Return
ASN Bloomberg DJUA S&P 500 DJIA NASDAQ 3-year 144.6 111.2 64.6 22.9 19.6 14.6 Archstone- Smith Dow Jones Industrial Bloomberg Apartment Index S&P 500 144.6% 111.2% 22.9% 19.6% NASDAQ 14.6% December 31, 2001 - May 31, 2006 64.6% Dow Jones Utilities Total Shareholder Return
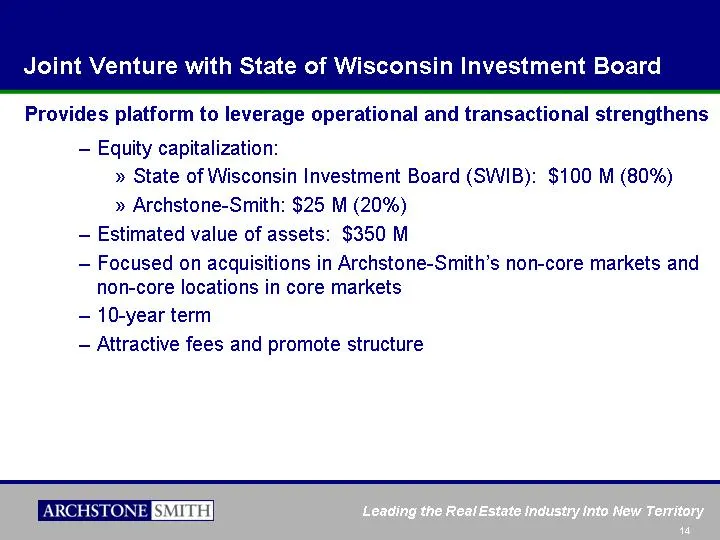
Slide 14: Joint Venture with State of Wisconsin Investment Board
Equity capitalization: State of Wisconsin Investment Board (SWIB): $100 M (80%) Archstone-Smith: $25 M (20%) Estimated value of assets: $350 M Focused on acquisitions in Archstone-Smith's non-core markets and non-core locations in core markets 10-year term Attractive fees and promote structure Provi
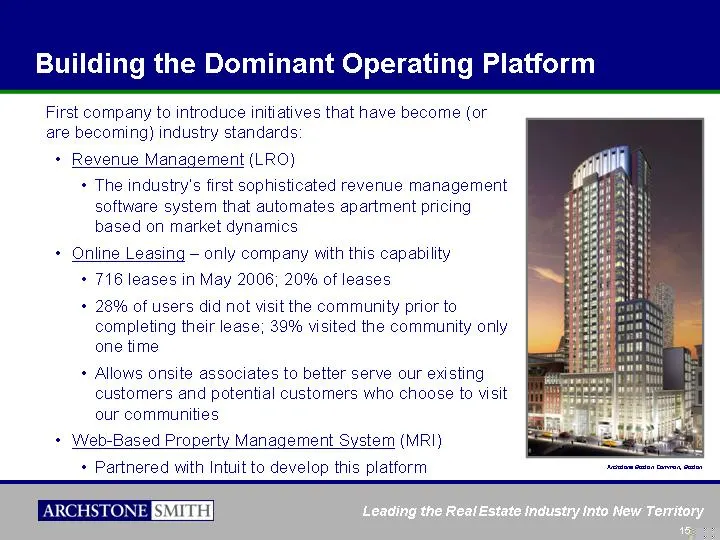
Slide 15: Building the Dominant Operating Platform
Building the Dominant Operating Platform First company to introduce initiatives that have become (or are becoming) industry standards: Revenue Management (LRO) The industry's first sophisticated revenue management software system that automates apartment pricing based on market dynamics Online Leasi
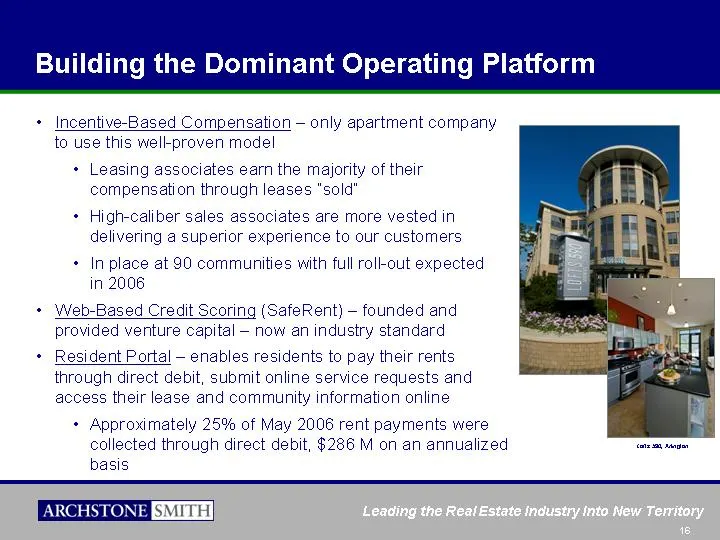
Slide 16: Building the Dominant Operating Platform
Building the Dominant Operating Platform Incentive-Based Compensation - only apartment company to use this well-proven model Leasing associates earn the majority of their compensation through leases "sold" High-caliber sales associates are more vested in delivering a superior experience to our custo
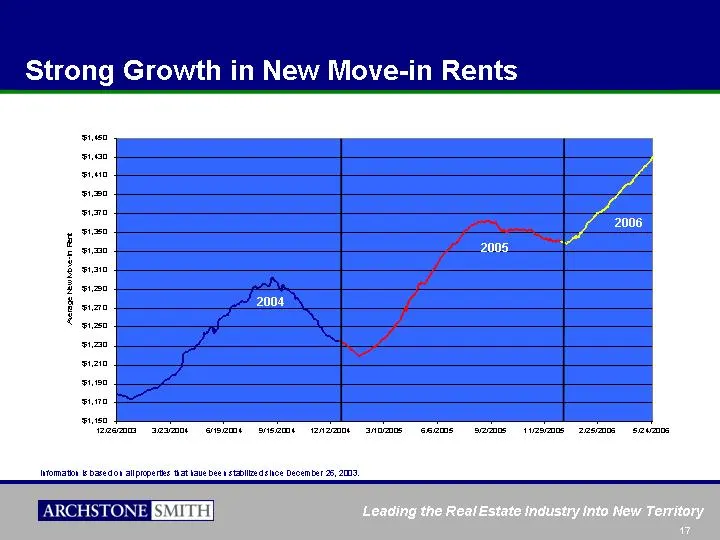
Slide 17: Strong Growth in New Move-in Rents
Strong Growth in New Move-in Rents Information is based on all properties that have been stabilized since December 26, 2003. 2004 2005 2006
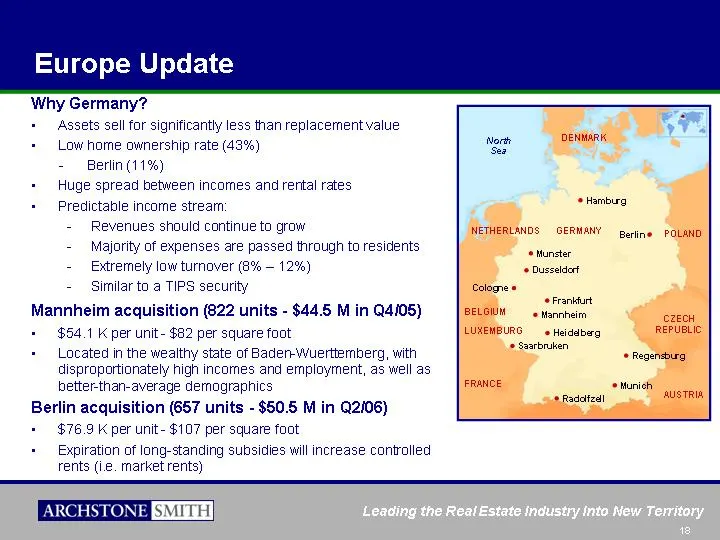
Slide 18: Europe Update
Europe Update Why Germany? Assets sell for significantly less than replacement value Low home ownership rate (43%) - Berlin (11%) Huge spread between incomes and rental rates Predictable income stream: Revenues should continue to grow Majority of expenses are passed through to residents Extremely lo
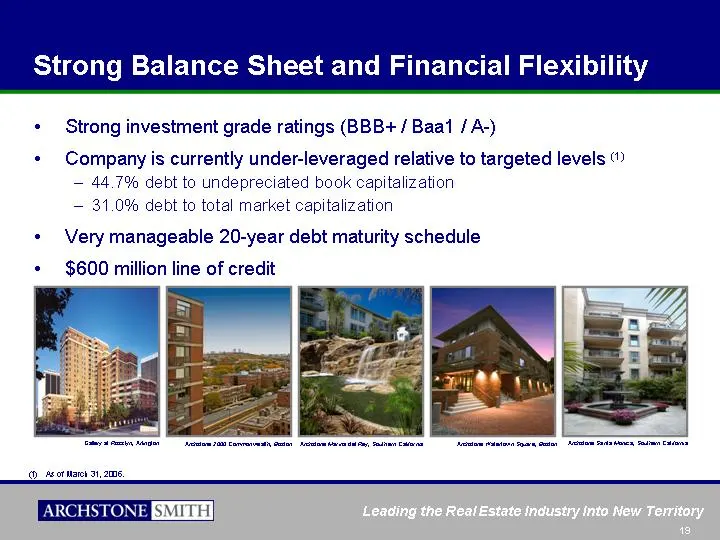
Slide 19: Strong Balance Sheet and Financial Flexibility
Strong Balance Sheet and Financial Flexibility Strong investment grade ratings (BBB+ / Baa1 / A-) Company is currently under-leveraged relative to targeted levels (1) 44.7% debt to undepreciated book capitalization 31.0% debt to total market capitalization Very manageable 20-year debt maturity sched
Slide 20: Appendix: Renting Versus Buying - Sample Market Comparisons
Appendix Renting Versus Buying - Sample Market Comparisons
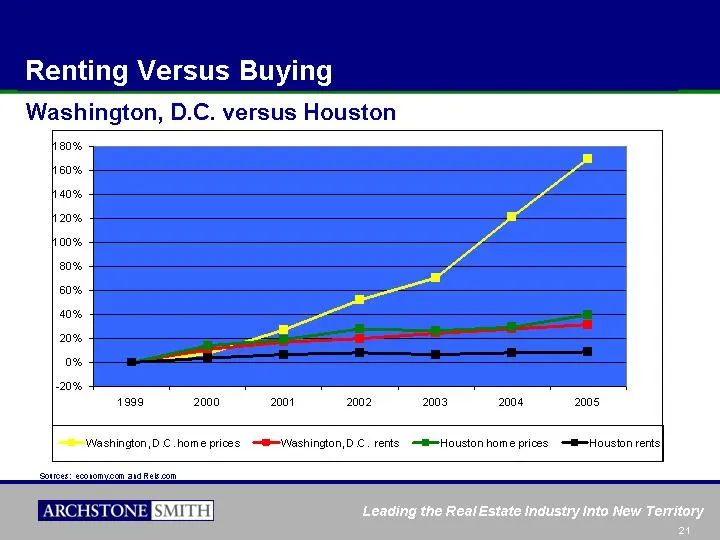
Slide 21: Renting Versus Buying: Washington, D.C. versus Houston
Renting Versus Buying Sources: economy.com and Reis.com Washington, D.C. versus Houston 2004 2005 2006
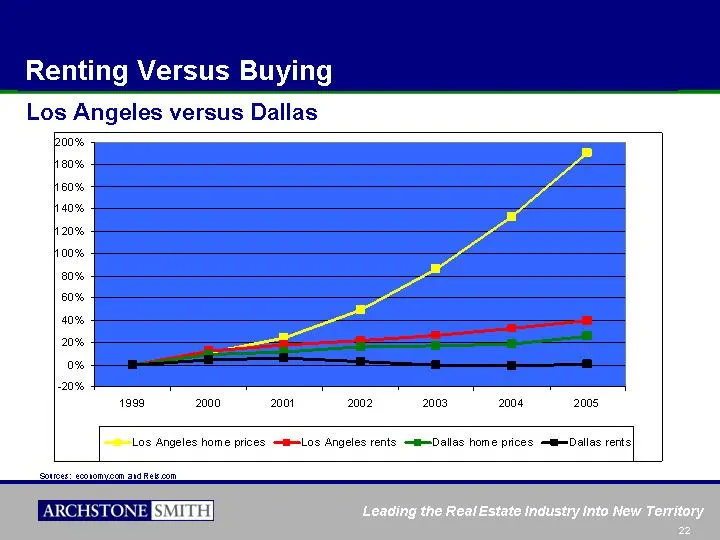
Slide 22: Renting Versus Buying: Los Angeles versus Dallas
Renting Versus Buying Sources: economy.com and Reis.com Los Angeles versus Dallas 2004 2005 2006
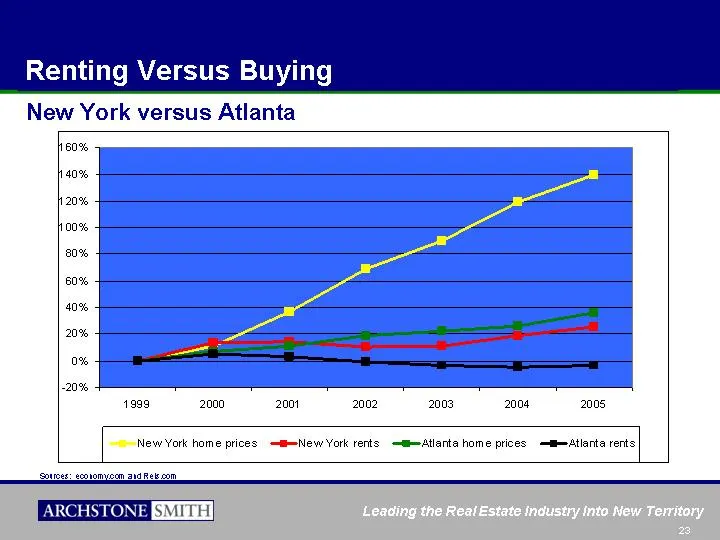
Slide 23: Renting Versus Buying: New York versus Atlanta
Renting Versus Buying Sources: economy.com and Reis.com New York versus Atlanta 2004 2005 2006
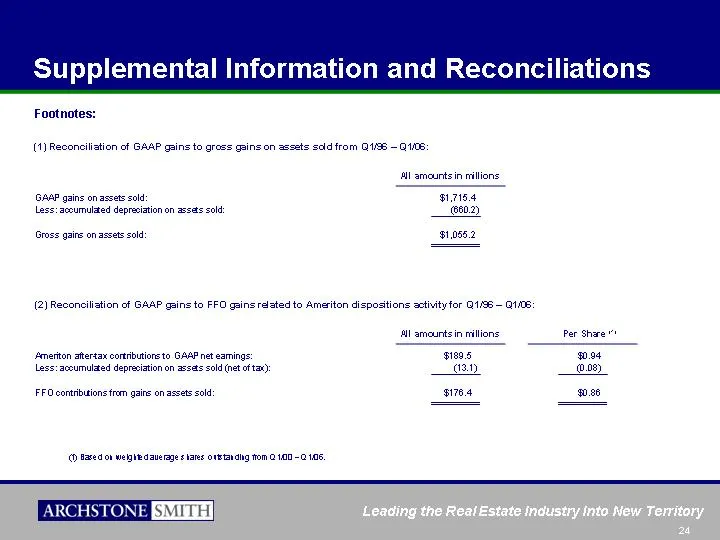
Slide 24: Supplemental Information and Reconciliations
Supplemental Information and Reconciliations Footnotes: All amounts in millions GAAP gains on assets sold: $1,715.4 Less: accumulated depreciation on assets sold: (660.2) Gross gains on assets sold: $1,055.2 (1) Reconciliation of GAAP gains to gross gains on assets sold from Q1/96 - Q1/06: All amoun
Slide 25: Supplemental Information and Reconciliations: General Notes
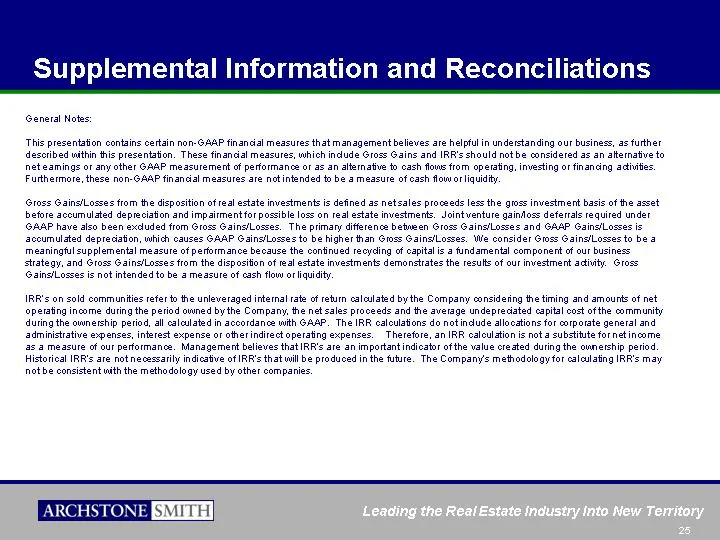
Supplemental Information and Reconciliations General Notes: This presentation contains certain non-GAAP financial measures that management believes are helpful in understanding our business, as further described within this presentation. These financial measures, which include Gross Gains and IRR's

Slide 26: Investor Relations Contact
Investor Relations Contact: H. Andrew Cantor (303) 708-5959 (800) 982-9293 acantor@archstonesmith.com
Source: SEC EDGAR · 8-K filed Jun 5, 2006
More decks from Archstone Smith Trust
 Citigroup 2007 Global Property CEO Conference26 slides · Mar 5, 2007
 NAREIT Annual Convention 200625 slides · Nov 7, 2006
 Corporate Update (June 2006)14 slides · Jun 5, 2006
 Corporate Update (April 2006)17 slides · Apr 11, 2006
 Citigroup REIT CEO Conference March 200620 slides · Mar 7, 2006
 Investor Presentation (February 2006)16 slides · Feb 2, 2006