Archstone Smith Trust — Citigroup REIT CEO Conference March 2006
20 slides from Archstone Smith Trust's conference presentation, Mar 7, 2006
Slide 1: Citigroup REIT CEO Conference March 2006
Citigroup REIT CEO Conference March 2006
Slide 2: Safe harbor
Safe harbor In addition to historical information, this presentation contains forward-looking statements and information under the federal securities laws. These statements are based on current expectations, estimates and projections about the industry and markets in which Archstone-Smith and/or Ame
Slide 3: Archstone-Smith profile
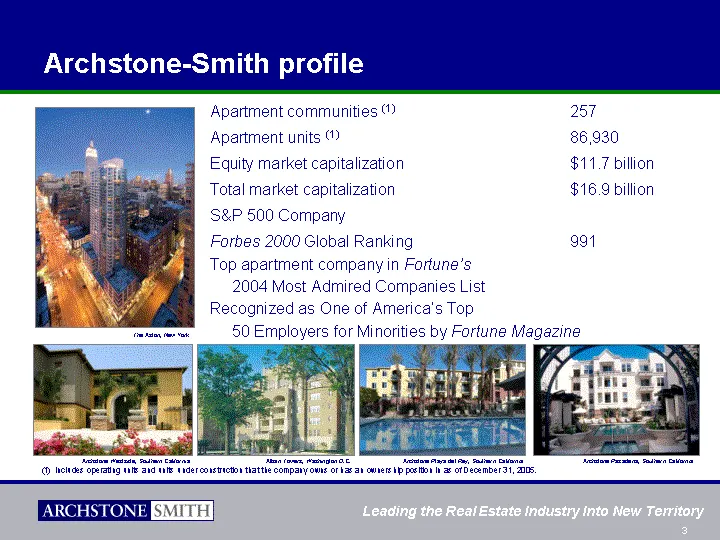
Archstone-Smith profile (1) Includes operating units and units under construction that the company owns or has an ownership position in as of December 31, 2005. Apartment communities (1) 257 Apartment units (1) 86,930 Equity market capitalization $11.7 billion Total market capitalization $16.9 billi
Slide 4: Successful capital redeployment program
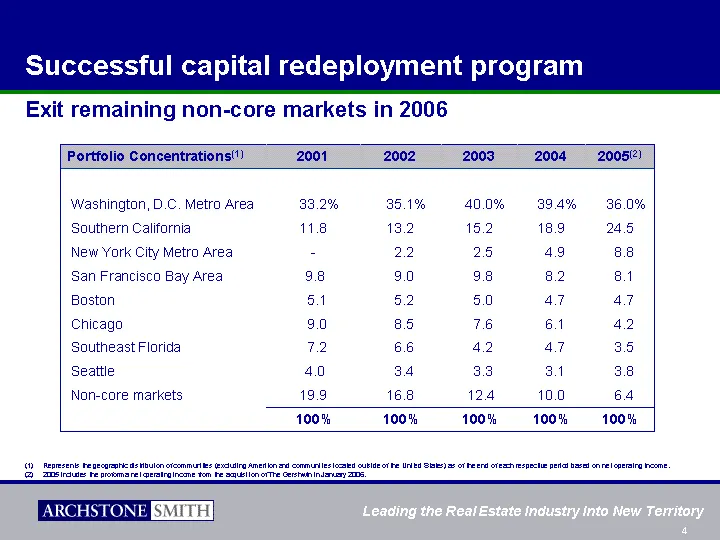
Successful capital redeployment program Exit remaining non-core markets in 2006 Portfolio Concentrations(1) 2001 2002 2003 2004 2005(2) Washington, D.C. Metro Area 33.2% 35.1% 40.0% 39.4% 36.0% Southern California 11.8 13.2 15.2 18.9 24.5 New York City Metro Area - 2.2 2.5 4.9 8.8 San Francisco Bay
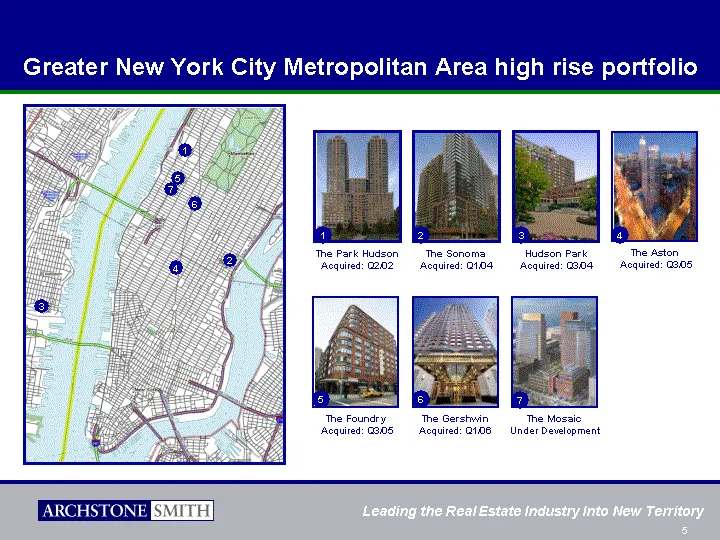
Slide 5: Greater New York City Metropolitan Area high rise portfolio
The Aston Acquired: Q3/05 The Park Hudson Acquired: Q2/02 Greater New York City Metropolitan Area high rise portfolio 1 5 7 3 6 2 4 The Mosaic Under Development Hudson Park Acquired: Q3/04 The Gershwin Acquired: Q1/06 The Sonoma Acquired: Q1/04 1 The Foundry Acquired: Q3/05 2 3 4 5 6 7
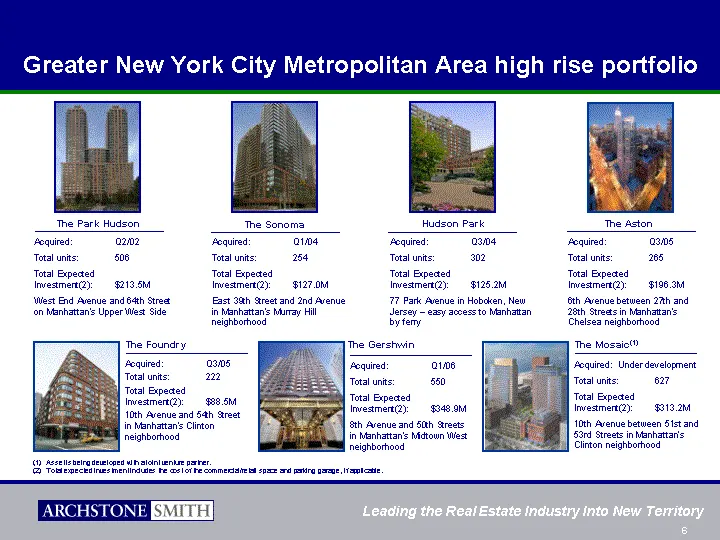
Slide 6: Greater New York City Metropolitan Area high rise portfolio
Greater New York City Metropolitan Area high rise portfolio Hudson Park The Sonoma The Aston Acquired: Q1/04 Total units: 254 Total Expected Investment(2): $127.0M East 39th Street and 2nd Avenue in Manhattan's Murray Hill neighborhood The Park Hudson Acquired: Q2/02 Total units: 506 Total Expected
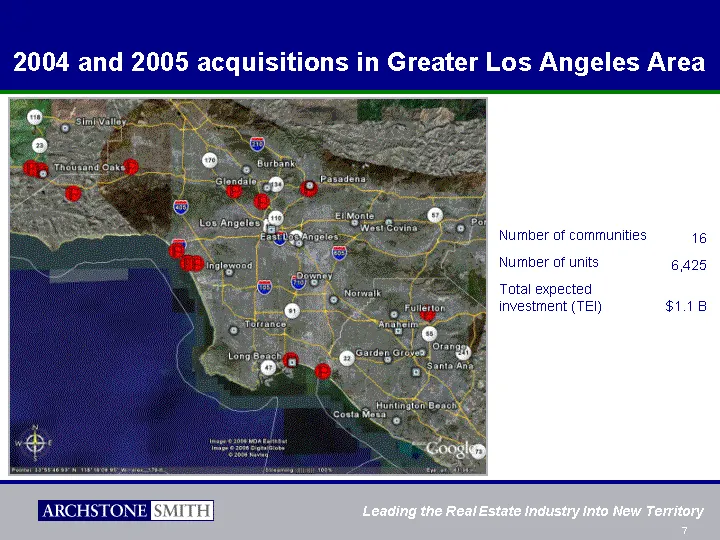
Slide 7: 2004 and 2005 acquisitions in Greater Los Angeles Area
2004 and 2005 acquisitions in Greater Los Angeles Area Number of communities 16 Number of units 6,425 Total expected investment (TEI) $1.1 B
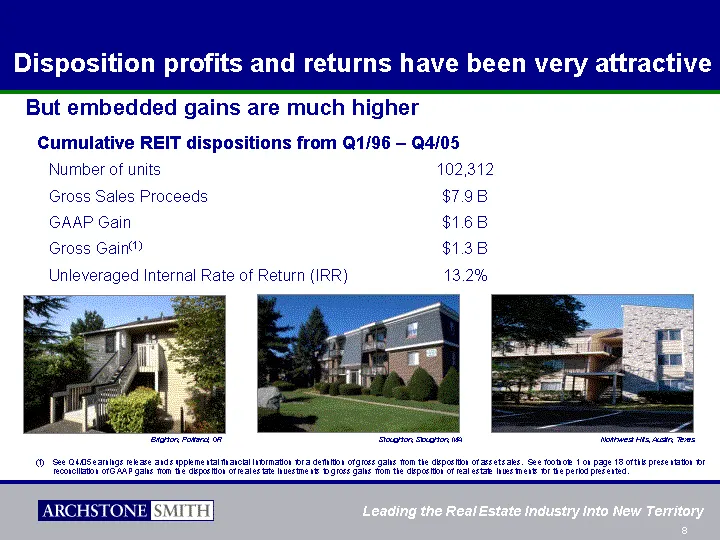
Slide 8: Disposition profits and returns have been very attractive
Disposition profits and returns have been very attractive Number of units 102,312 Gross Sales Proceeds $7.9 B GAAP Gain $1.6 B Gross Gain(1) $1.3 B Unleveraged Internal Rate of Return (IRR) 13.2% Cumulative REIT dispositions from Q1/96 - Q4/05 Stoughton, Stoughton, MA But embedded gains are much hig
Slide 9: Incremental value embedded in $2.9 billion development pipeline
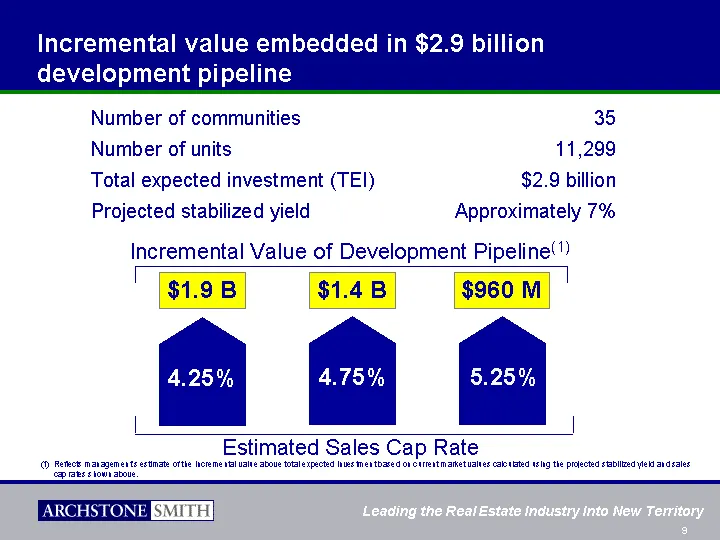
Incremental value embedded in $2.9 billion development pipeline Estimated Sales Cap Rate Incremental Value of Development Pipeline(1) 4.75% 5.25% $1.9 B $1.4 B $960 M Number of communities 35 Number of units 11,299 Total expected investment (TEI) $2.9 billion Projected stabilized yield Approximately
Slide 10: Strong development track record
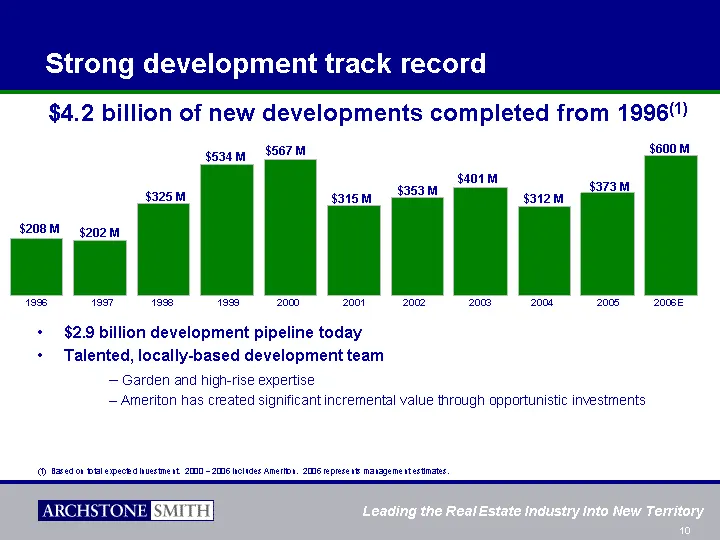
1996 1997 1998 1999 2000 2001 2002 2003 2004 2005 2006 208 202 325 534 567 315 353 401 312 373 600 Strong development track record $2.9 billion development pipeline today Talented, locally-based development team Garden and high-rise expertise Ameriton has created significant incremental value throug
Slide 11: Strong growth in new move-in rents
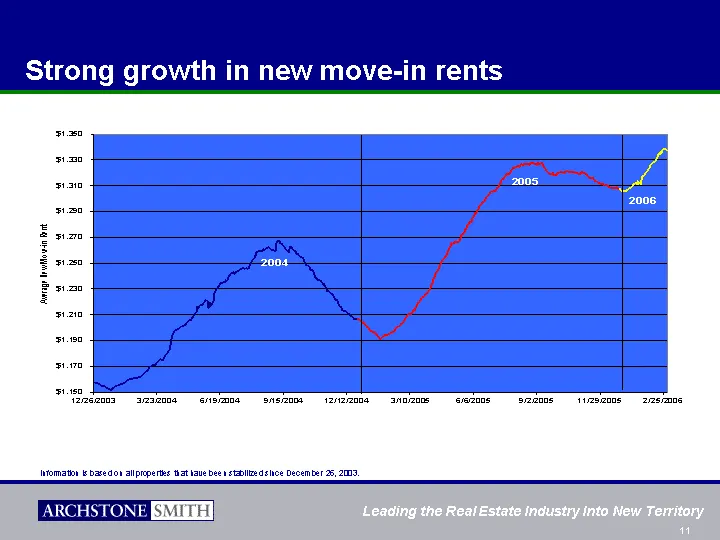
Strong growth in new move-in rents Information is based on all properties that have been stabilized since December 26, 2003.
Slide 12: Building the Dominant Operating Platform
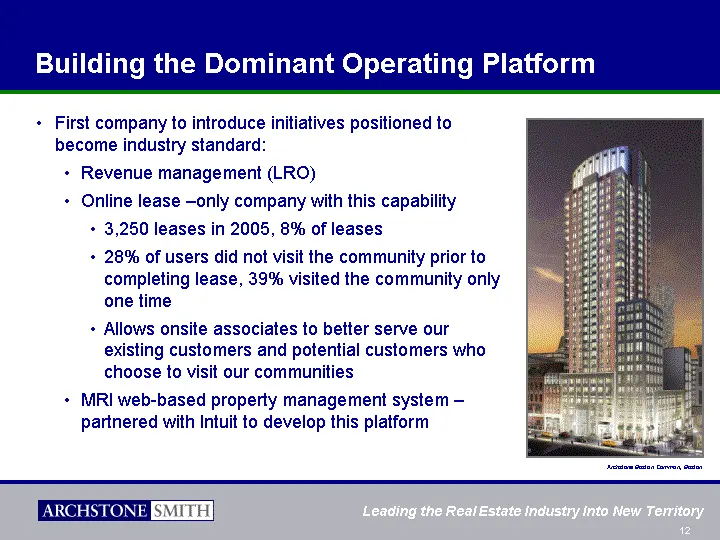
Building the Dominant Operating Platform First company to introduce initiatives positioned to become industry standard: Revenue management (LRO) Online lease -only company with this capability 3,250 leases in 2005, 8% of leases 28% of users did not visit the community prior to completing lease, 39%
Slide 13: Building the Dominant Operating Platform
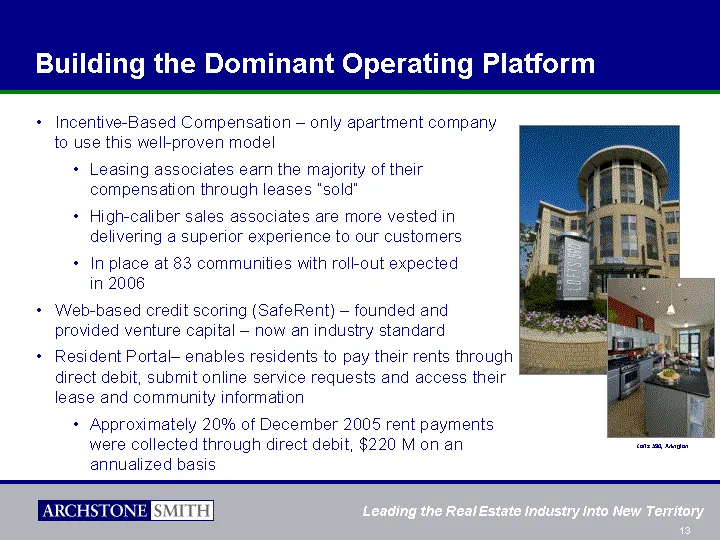
Building the Dominant Operating Platform Incentive-Based Compensation - only apartment company to use this well-proven model Leasing associates earn the majority of their compensation through leases "sold" High-caliber sales associates are more vested in delivering a superior experience to our custo
Slide 14: We have dramatically outperformed our peers
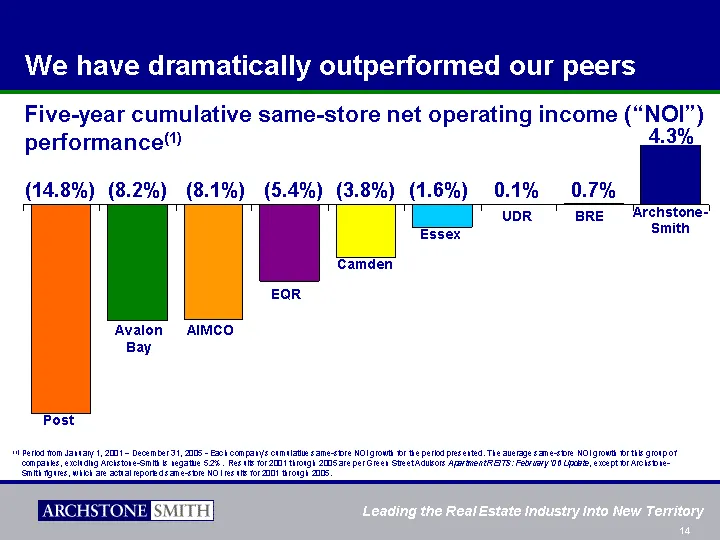
PPS AIV AVB EQR CPT ESS BRE UDR ASN -14.8 -8.2 -8.1 -5.4 -3.8 -1.6 0.001 0.007 4.3 Five-year cumulative same-store net operating income ("NOI") performance(1) We have dramatically outperformed our peers AIMCO Avalon Bay EQR Camden Essex BRE UDR Archstone- Smith (14.8%) (8.2%) (5.4%) (3.8%) (1.6%) 0.
Slide 15: Ameriton Properties Incorporated
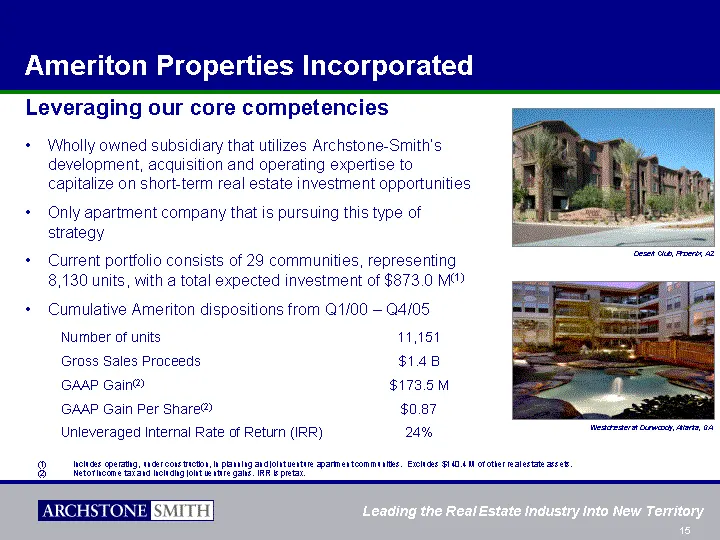
Ameriton Properties Incorporated Includes operating, under construction, in planning and joint venture apartment communities. Excludes $140.4 M of other real estate assets. Net of income tax and including joint venture gains. IRR is pretax. Number of units 11,151 Gross Sales Proceeds $1.4 B GAAP Gai
Slide 16: Strong balance sheet and financial flexibility
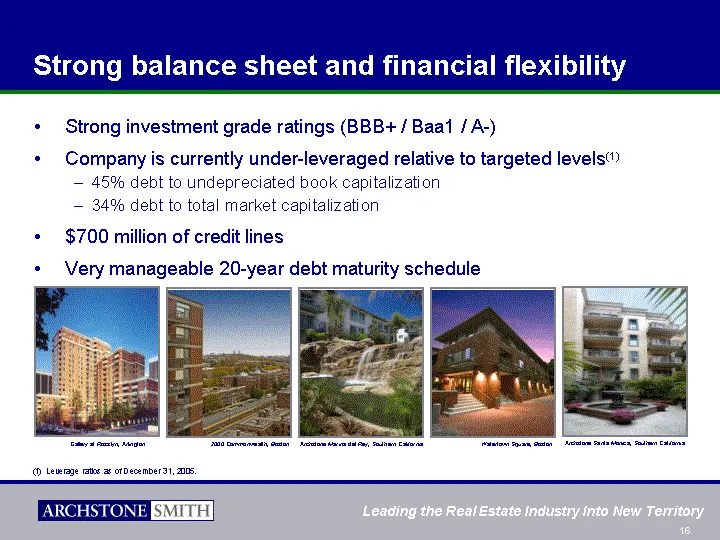
Strong balance sheet and financial flexibility Strong investment grade ratings (BBB+ / Baa1 / A-) Company is currently under-leveraged relative to targeted levels(1) 45% debt to undepreciated book capitalization 34% debt to total market capitalization $700 million of credit lines Very manageable 20-
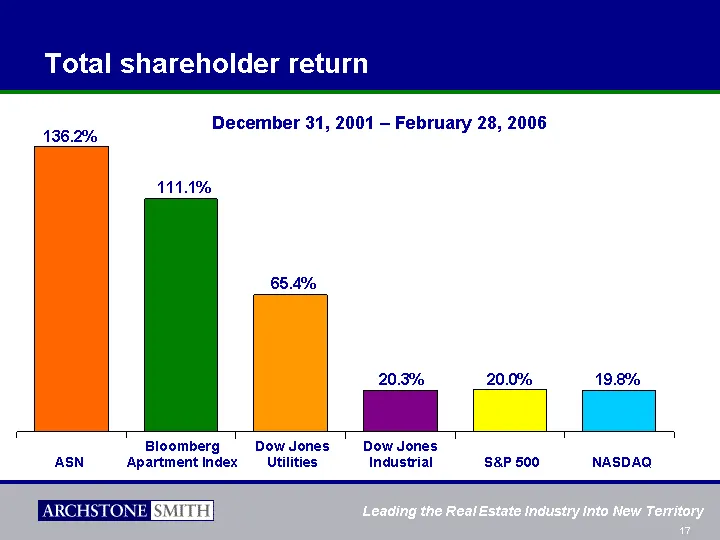
Slide 17: Total shareholder return
ASN Bloomberg DJUA S&P 500 DJIA NASDAQ 3-year 136.2 111.1 65.4 20 20.3 19.8 ASN Dow Jones Industrial Bloomberg Apartment Index S&P 500 136.2% 111.1% 20.3% 20.0% NASDAQ 19.8% December 31, 2001 - February 28, 2006 65.4% Dow Jones Utilities Total shareholder return
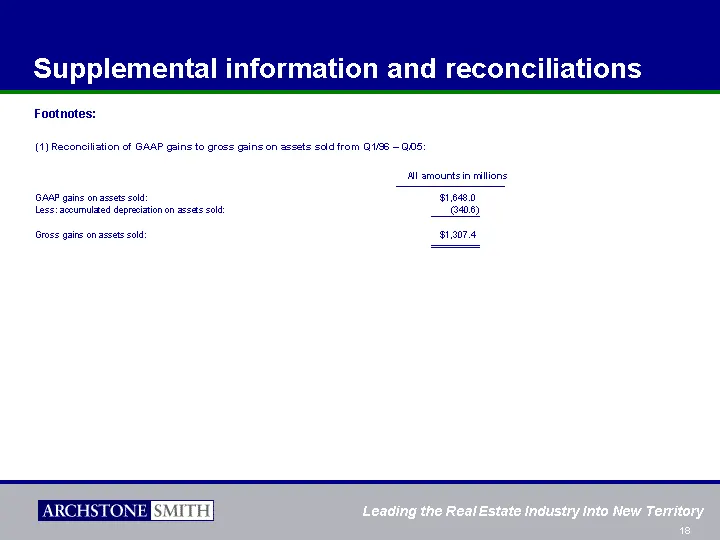
Slide 18: Supplemental information and reconciliations
Supplemental information and reconciliations Footnotes: All amounts in millions GAAP gains on assets sold: $1,648.0 Less: accumulated depreciation on assets sold: (340.6) Gross gains on assets sold: $1,307.4 (1) Reconciliation of GAAP gains to gross gains on assets sold from Q1/96 - Q/05:
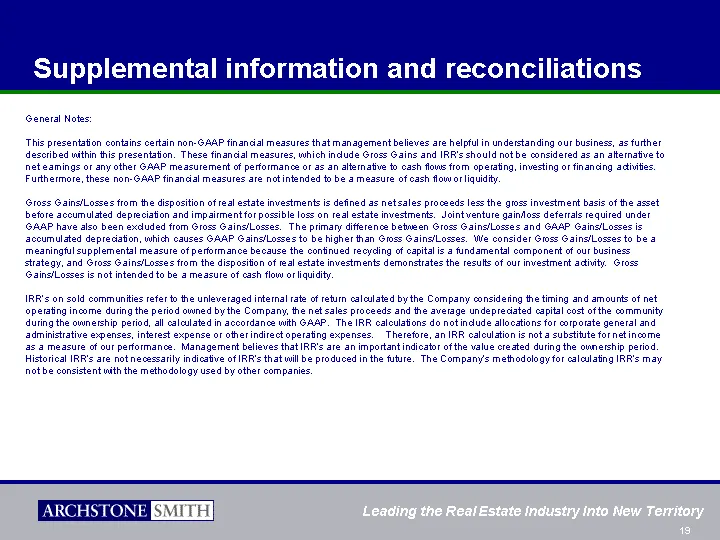
Slide 19: Supplemental information and reconciliations
Supplemental information and reconciliations General Notes: This presentation contains certain non-GAAP financial measures that management believes are helpful in understanding our business, as further described within this presentation. These financial measures, which include Gross Gains and IRR's

Slide 20: Investor Relations Contact
Investor Relations Contact: H. Andrew Cantor (303) 708-5959 (800) 982-9293 acantor@archstonesmith.com
Source: SEC EDGAR · 8-K filed Mar 7, 2006
More decks from Archstone Smith Trust
 Citigroup 2007 Global Property CEO Conference26 slides · Mar 5, 2007
 NAREIT Annual Convention 200625 slides · Nov 7, 2006
 NAREIT Institutional Investor Forum June 200626 slides · Jun 5, 2006
 Corporate Update (June 2006)14 slides · Jun 5, 2006
 Corporate Update (April 2006)17 slides · Apr 11, 2006
 Investor Presentation (February 2006)16 slides · Feb 2, 2006