Estee Lauder Companies, Inc. (the) · NYSE:EL
Estee Lauder Companies, Inc. (the) — The Estée Lauder Companies — Shareholder Meeting (November 2018)
71 slides from Estee Lauder Companies, Inc. (the)'s shareholder meeting presentation, Nov 13, 2018

Slide 1: The Global House of Prestige Beauty
THE GLOBAL HOUSE OF PRESTIGE BEAUTY NOVEMBER 13, 2018 FABRIZIO FREDA PRESIDENT AND CHIEF EXECUTIVE OFFICER
Slide 2: Forward-Looking Information
FORWARD-LOOKING INFORMATION Statements in this presentation may constitute forward-looking statements within the meaning of the Private Securities Litigation Reform Act of 1995. Such statements may address our expectations regarding sales, earnings or other future financial performance and liquidity
Slide 3: Non-GAAP Disclosures
NON-GAAP DISCLOSURES These materials include some non-GAAP financial measures relating to: constant currency; charges associated with restructuring and other activities; changes in the fair value of contingent consideration; the transition tax under the U.S. government enacted comprehensive tax legi

Slide 4: Fiscal 2018 Highlights
FISCAL 2018 HIGHLIGHTS Gained share in global prestige beauty Double-digit growth in sales and EPS Higher sales in every region and product category Sales in China and La Mer topped $1 billion Improved diversity and enhanced employee benefits
Slide 5: Fiscal 2018 Financial Results
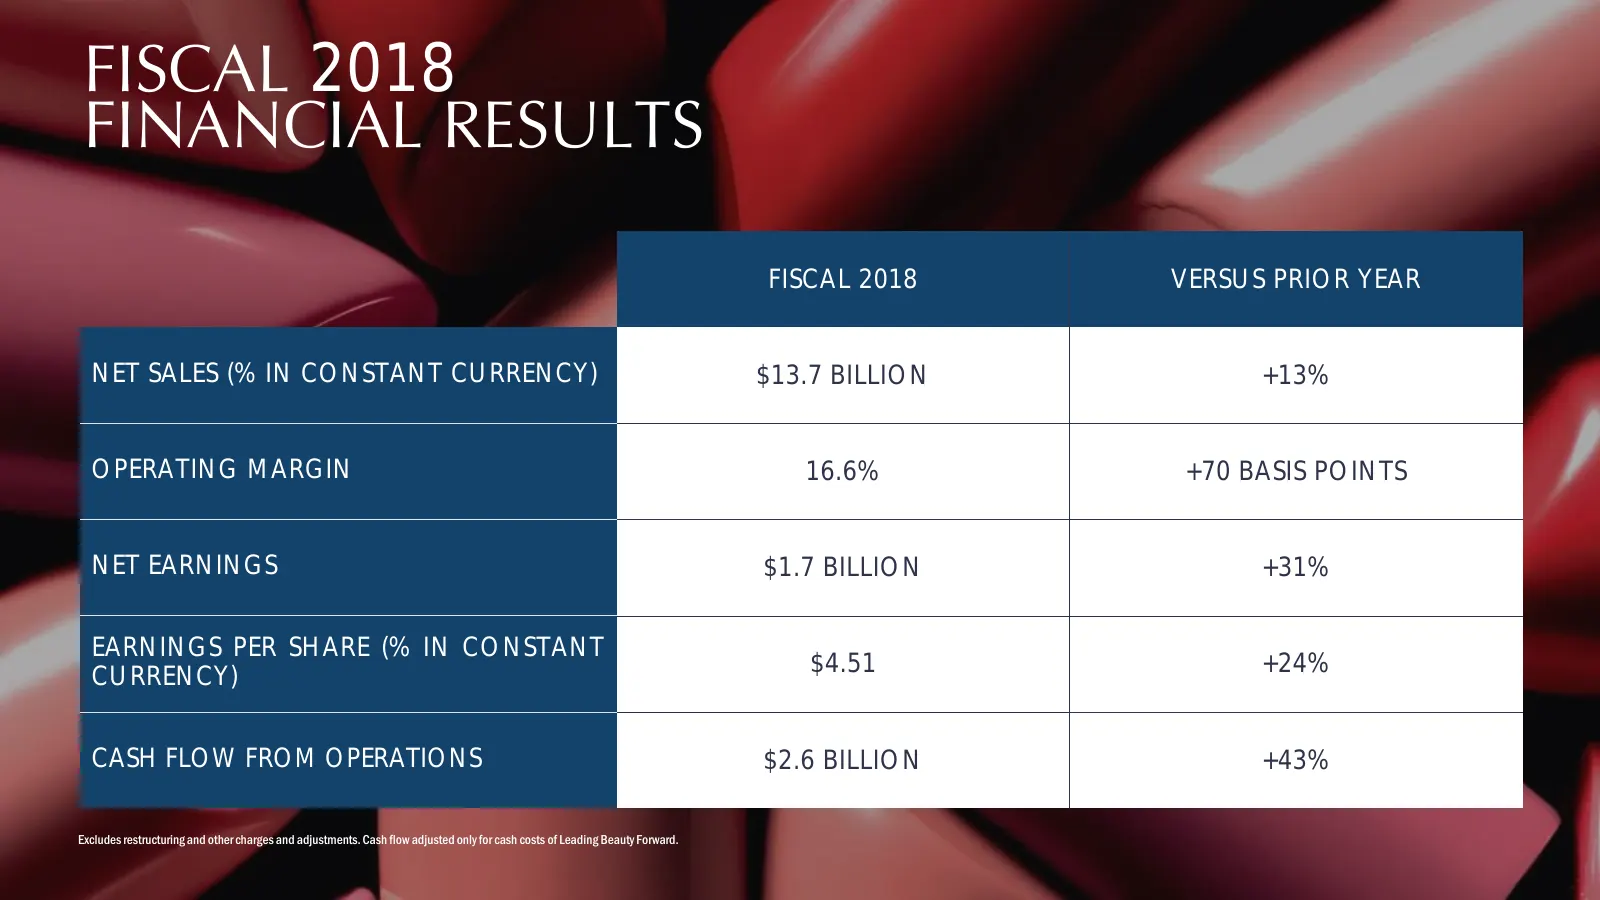
FISCAL 2018 FINANCIAL RESULTS FISCAL 2018 VERSUS PRIOR YEAR NET SALES (% IN CONSTANT CURRENCY) $13.7 BILLION +13% OPERATING MARGIN 16.6% +70 BASIS POINTS NET EARNINGS $1.7 BILLION +31% EARNINGS PER SHARE (% IN CONSTANT CURRENCY) $4.51 +24% CASH FLOW FROM OPERATIONS $2.6 BILLION +43% Excludes restruc
Slide 6: Broad-Based Regional Sales Growth
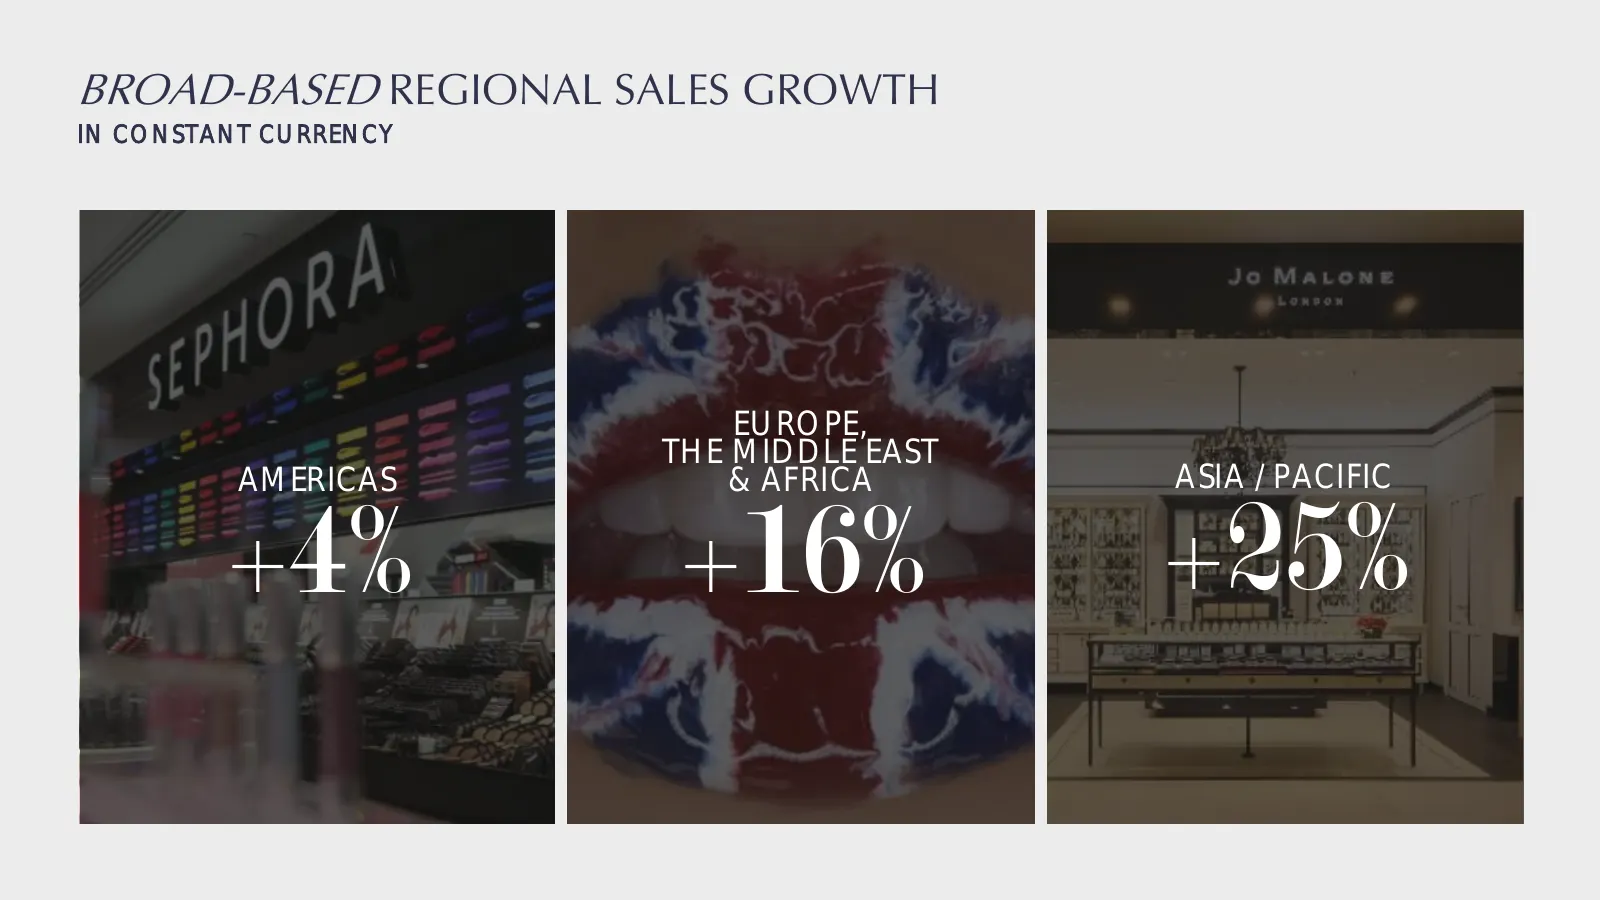
BROAD-BASED REGIONAL SALES GROWTH IN CONSTANT CURRENCY EUROPE, THE MIDDLE EAST AMERICAS & AFRICA ASIA / PACIFIC +4% +16% +25%
Slide 7: Broad-Based Category Growth
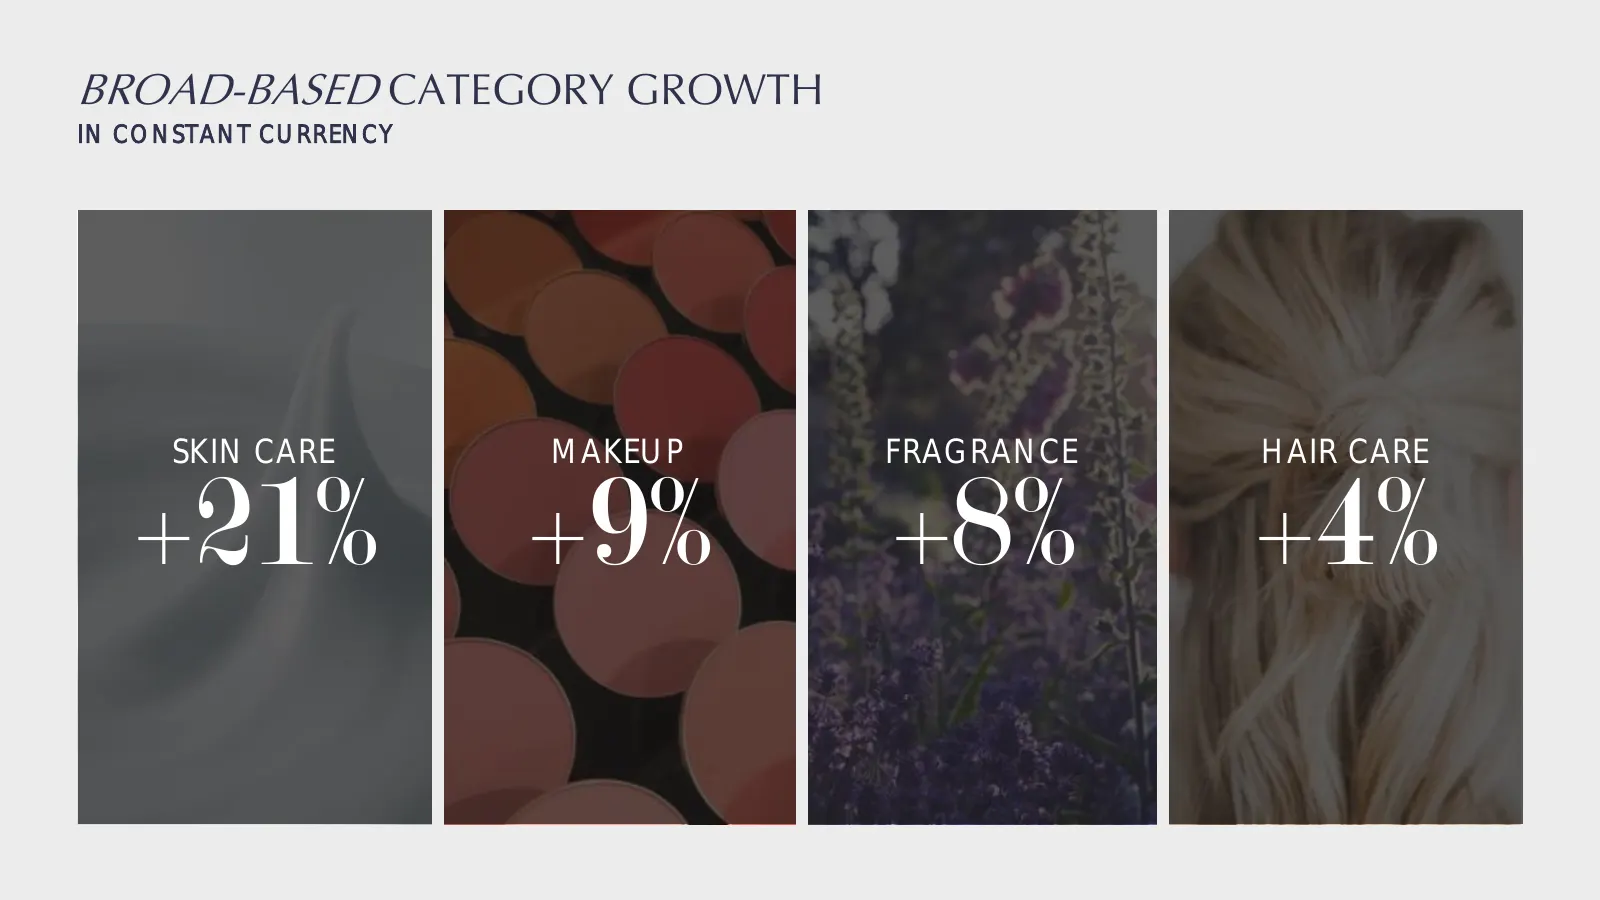
BROAD-BASED CATEGORY GROWTH IN CONSTANT CURRENCY SKIN CARE MAKEUP FRAGRANCE HAIR CARE +21% +9% +8% +4%
Slide 8: Fiscal 2018 Stockholder Value Created
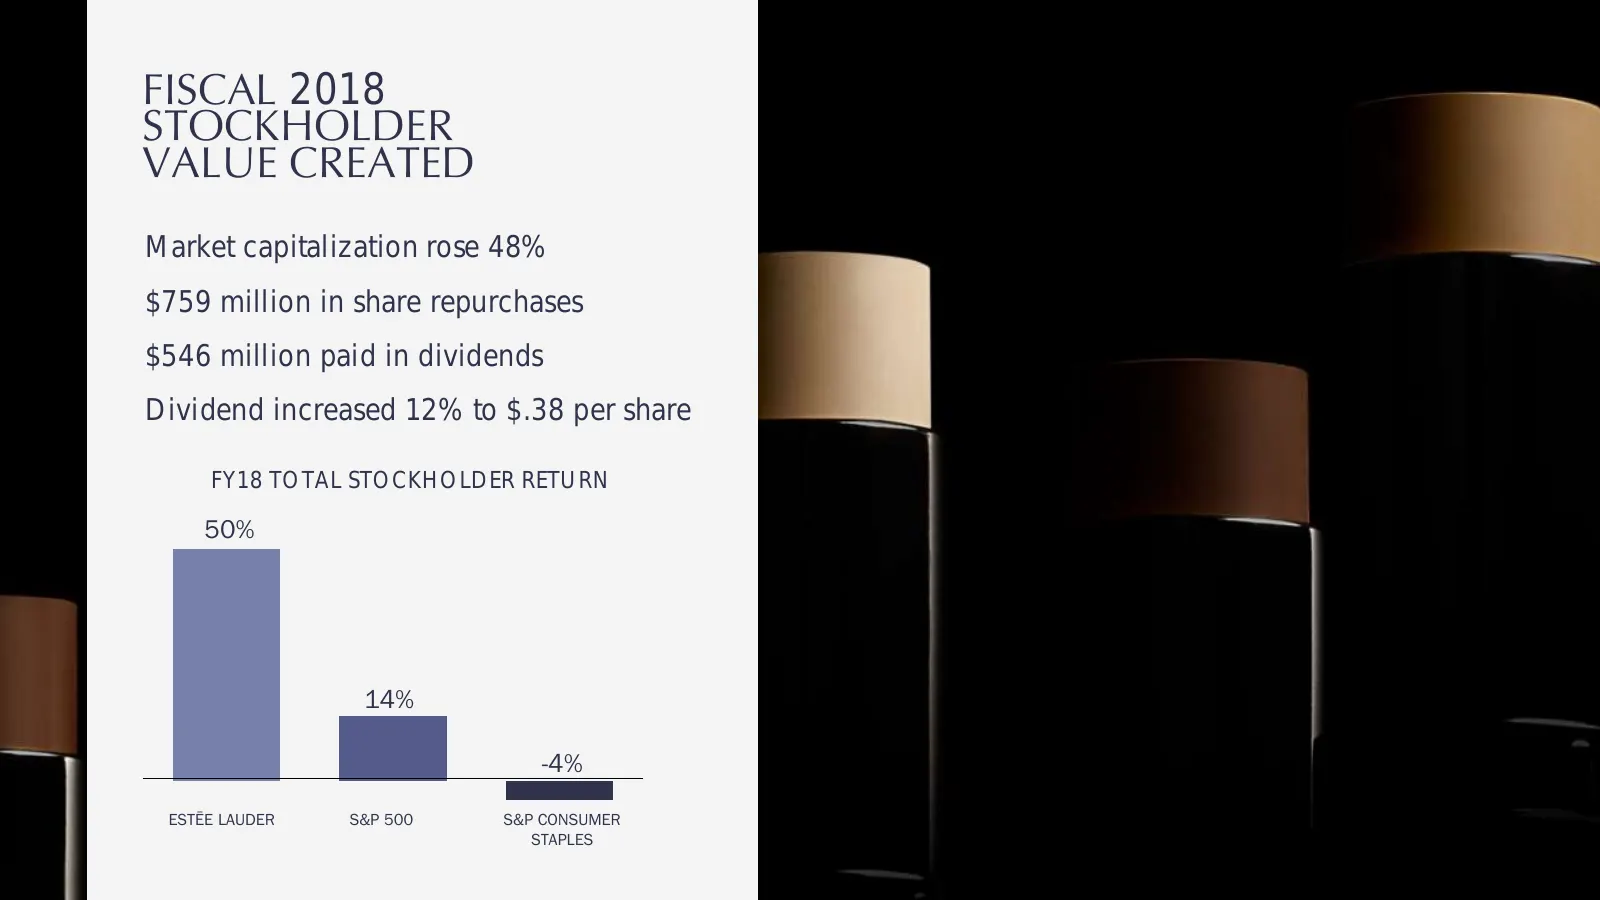
FISCAL 2018 STOCKHOLDER VALUE CREATED Market capitalization rose 48% $759 million in share repurchases $546 million paid in dividends Dividend increased 12% to $.38 per share FY18 TOTAL STOCKHOLDER RETURN 50% 14% -4% ESTĒE LAUDER S&P 500 S&P CONSUMER STAPLES
Slide 9: Fiscal 2019 First Quarter
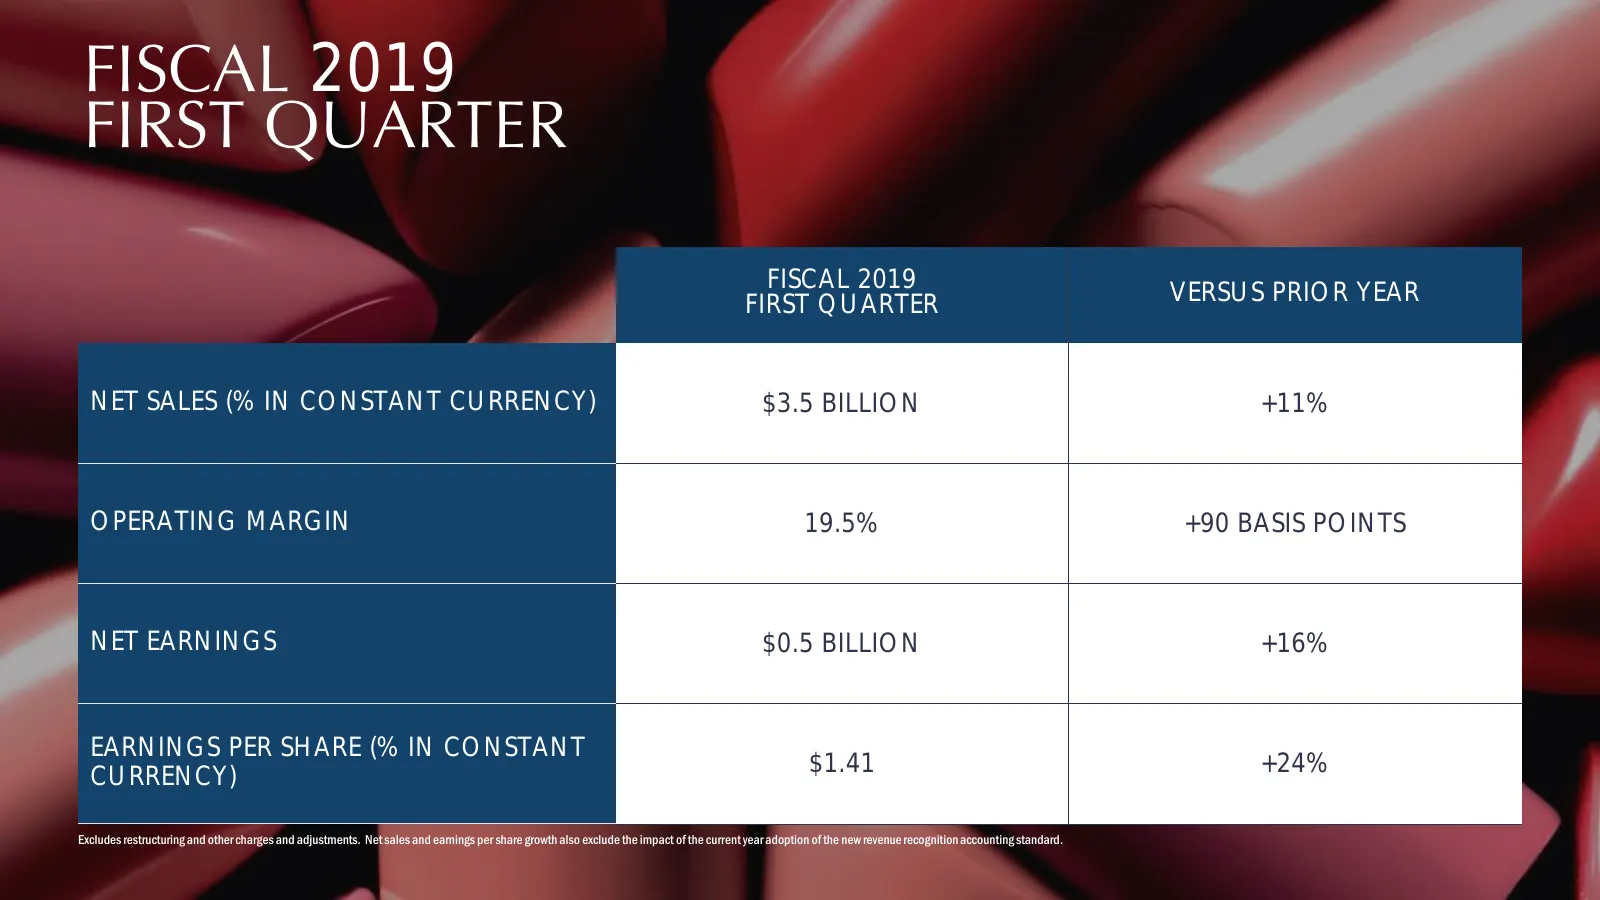
FISCAL 2019 FIRST QUARTER FISCAL 2019 VERSUS PRIOR YEAR FIRST QUARTER NET SALES (% IN CONSTANT CURRENCY) $3.5 BILLION +11% OPERATING MARGIN 19.5% +90 BASIS POINTS NET EARNINGS $0.5 BILLION +16% EARNINGS PER SHARE (% IN CONSTANT CURRENCY) $1.41 +24% Excludes restructuring and other charges and adjust
Slide 10: Near and Long-Term Goals
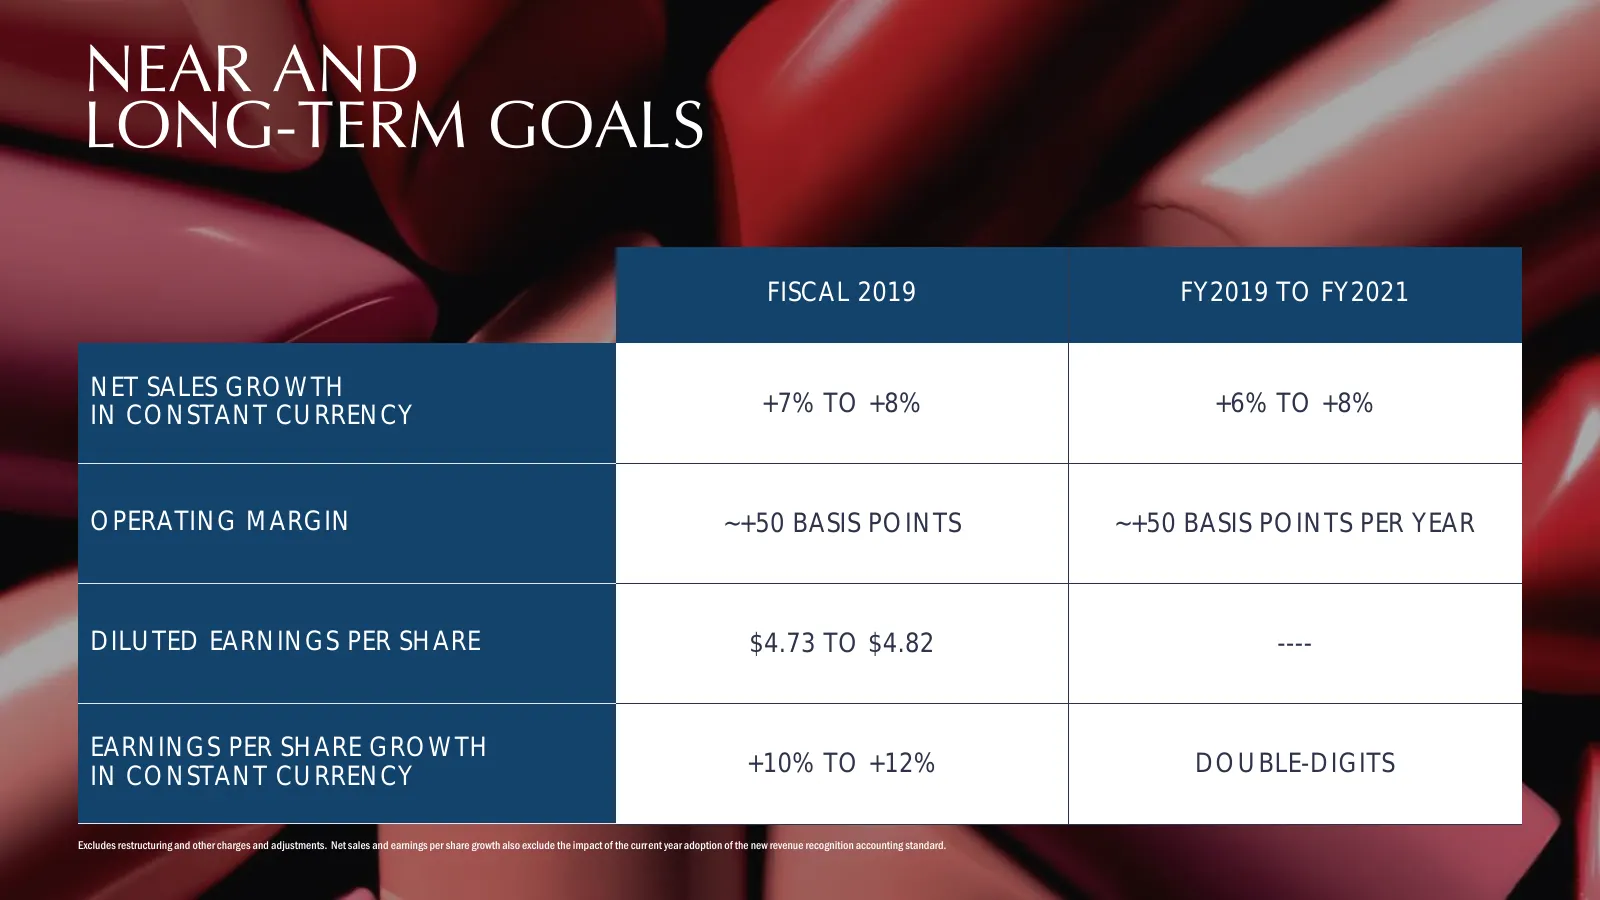
NEAR AND LONG-TERM GOALS FISCAL 2019 FY2019 TO FY2021 NET SALES GROWTH IN CONSTANT CURRENCY +7% TO +8% +6% TO +8% OPERATING MARGIN ~+50 BASIS POINTS ~+50 BASIS POINTS PER YEAR DILUTED EARNINGS PER SHARE $4.73 TO $4.82 ---- EARNINGS PER SHARE GROWTH IN CONSTANT CURRENCY +10% TO +12% DOUBLE-DIGITS Exc

Slide 11: Driving Tomorrow's Success
ia? trek be ae. ». DRWING:- TOMORROWS. ~ ~ SU ESS. 6c © CCl = ull vE- , ‘ « J “— * ithe é © ™@ 3 s f « a Sf? - - é y fu FS ' ot | é : ¥ ae * 4 oer b af i. o-* ae tS, Ss, et on bl t " .< ae & |. r fn GS —— Si t ‘ é or ¢? «a eo ad . ms o - ss a a é i 2 “ é re om. ce Lf * " oe oo f wr _ ‘* a ie c as os
Slide 12: We Are a Growth Company in a Dynamic, Growing Industry
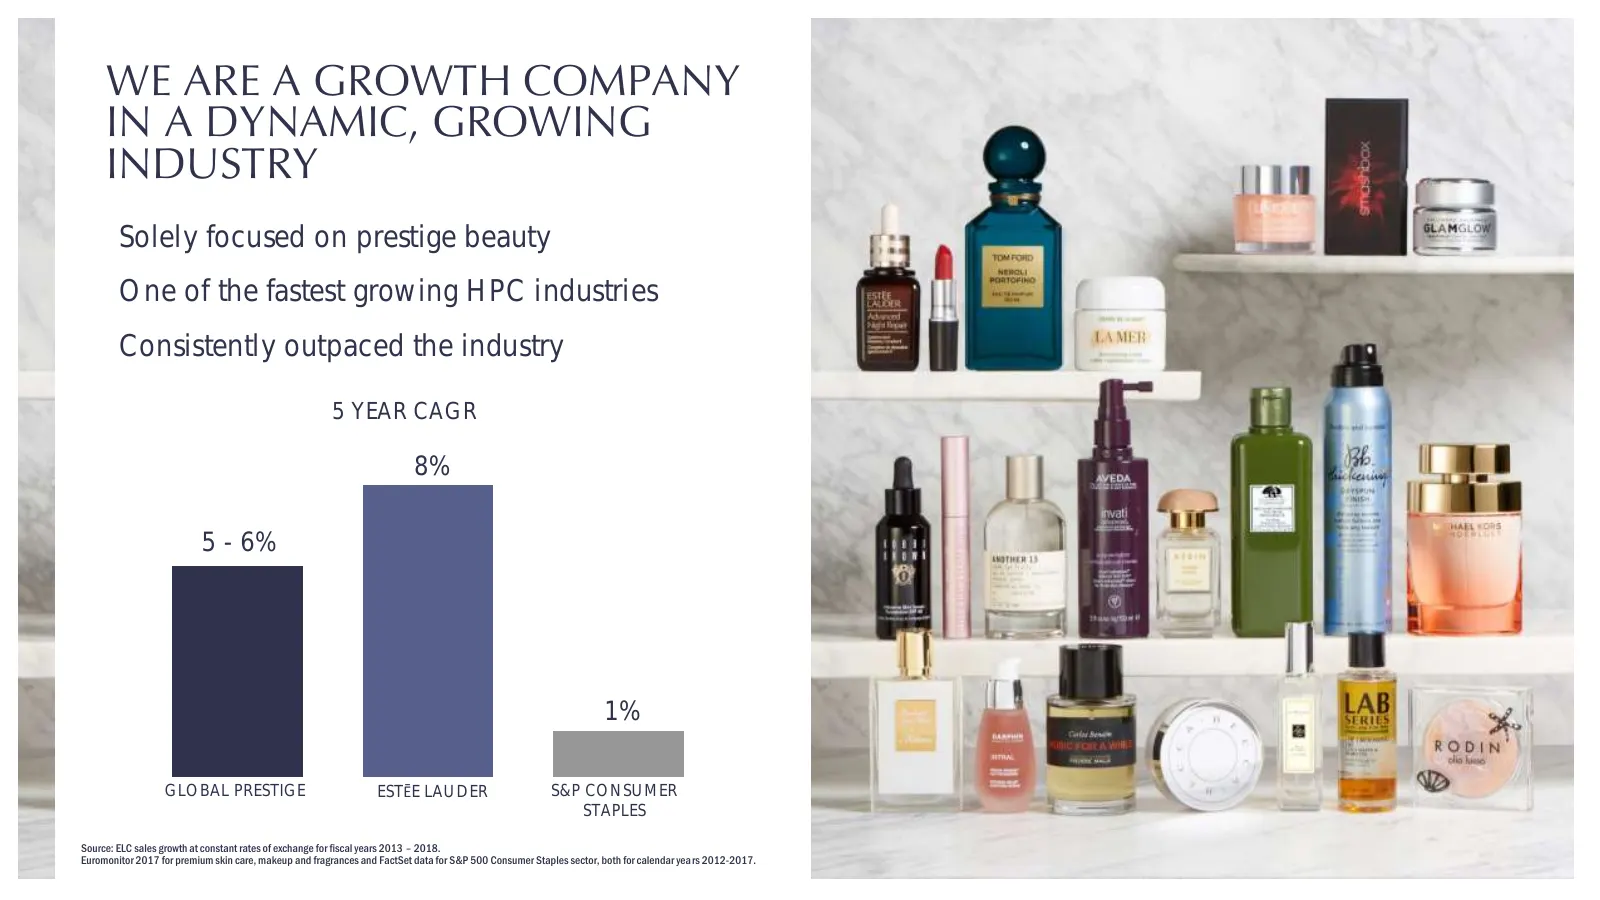
WE ARE A GROWTH COMPANY IN A DYNAMIC, GROWING INDUSTRY Solely focused on prestige beauty One of the fastest growing HPC industries Consistently outpaced the industry 5 YEAR CAGR 8% 5 - 6% 1% GLOBAL PRESTIGE ESTĒE LAUDER S&P CONSUMER STAPLES Source: ELC sales growth at constant rates of exchange for
Slide 13: We Have Delivered Reliable, Increasingly Profitable Growth
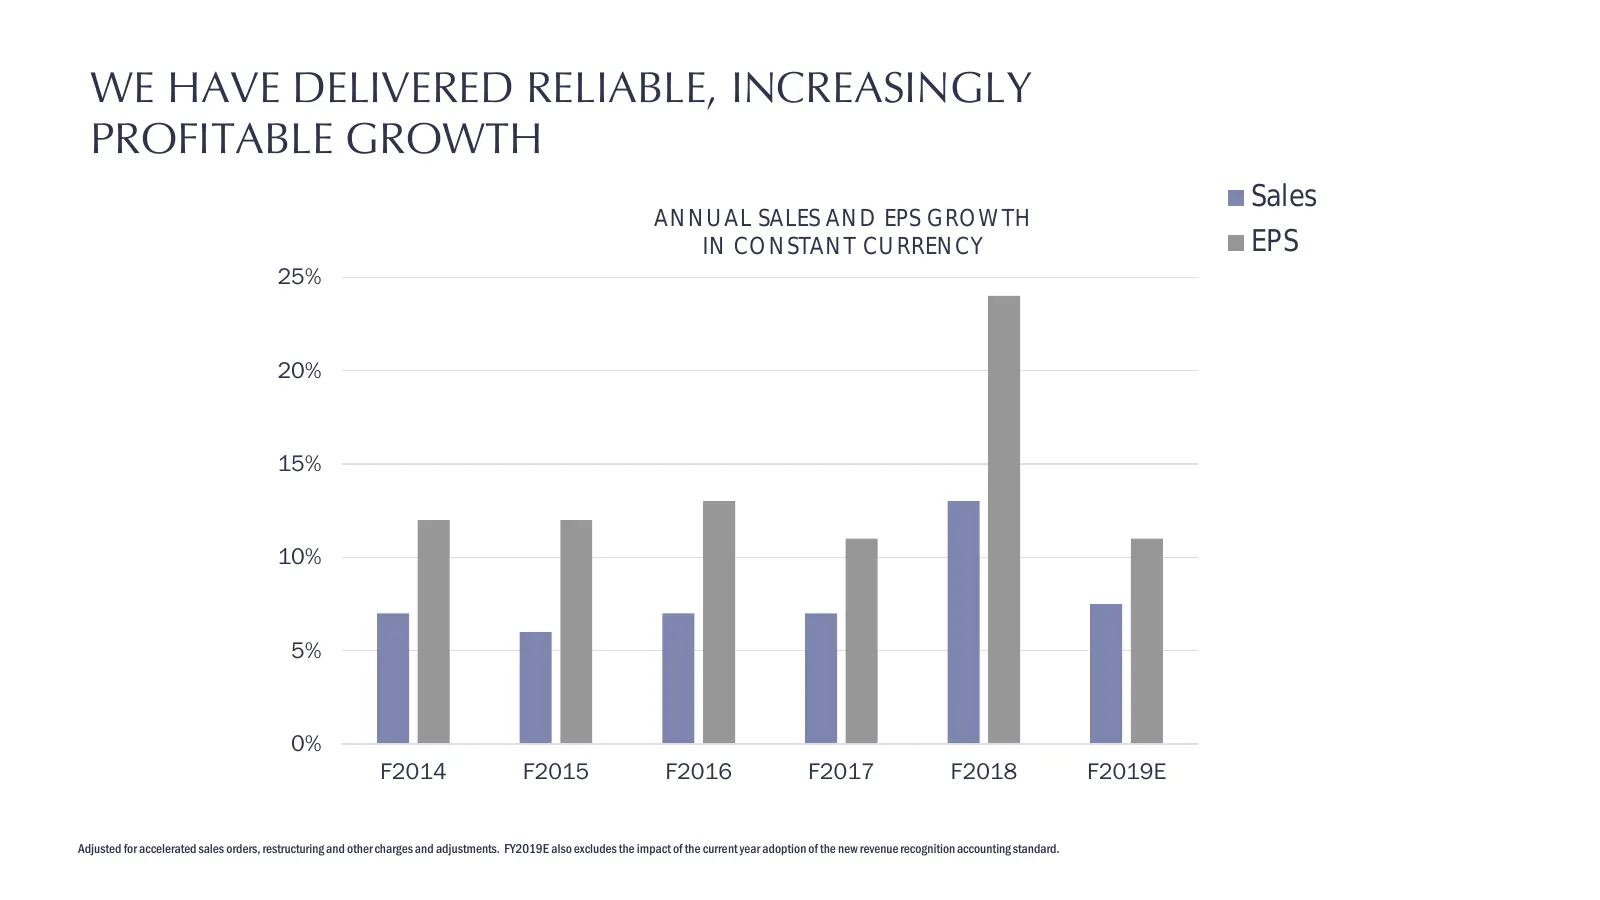
WE HAVE DELIVERED RELIABLE, INCREASINGLY PROFITABLE GROWTH Sales ANNUAL SALES AND EPS GROWTH IN CONSTANT CURRENCY EPS 25% 20% 15% 10% 5% 0% F2014 F2015 F2016 F2017 F2018 F2019E Adjusted for accelerated sales orders, restructuring and other charges and adjustments. FY2019E also excludes the impact of
Slide 14: Our Multiple Engines of Growth Are Powered by Our Long-Term Strategy
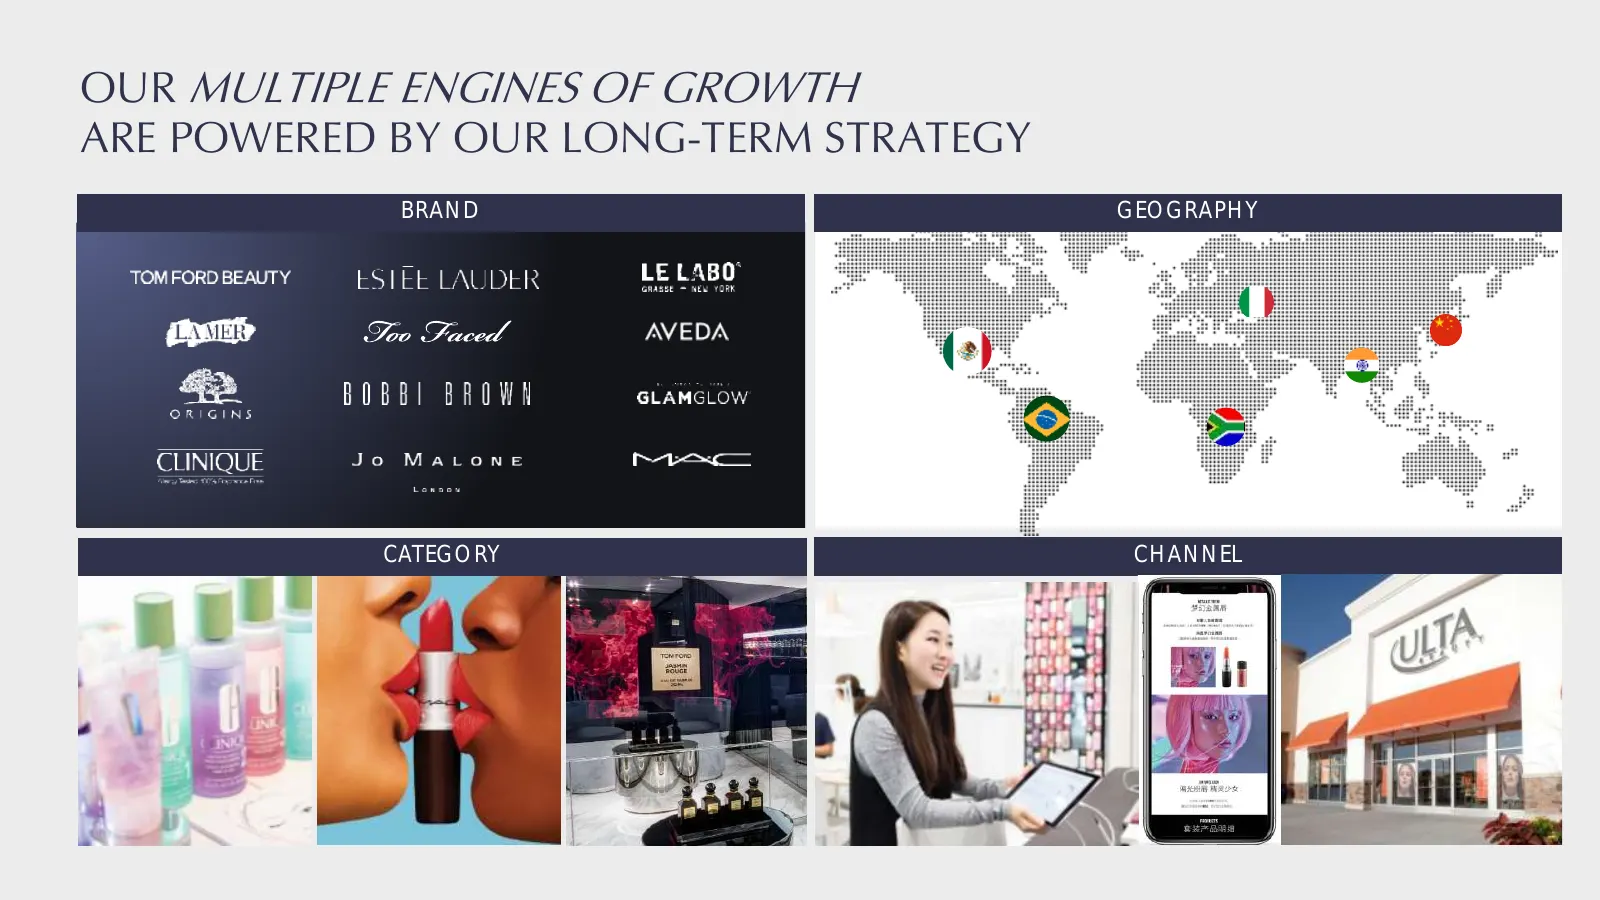
OUR MULTIPLE ENGINES OF GROWTH ARE POWERED BY OUR LONG-TERM STRATEGY BRAND GEOGRAPHY CATEGORY CHANNEL
Slide 15: We Deploy Our Powerful Brand Portfolio
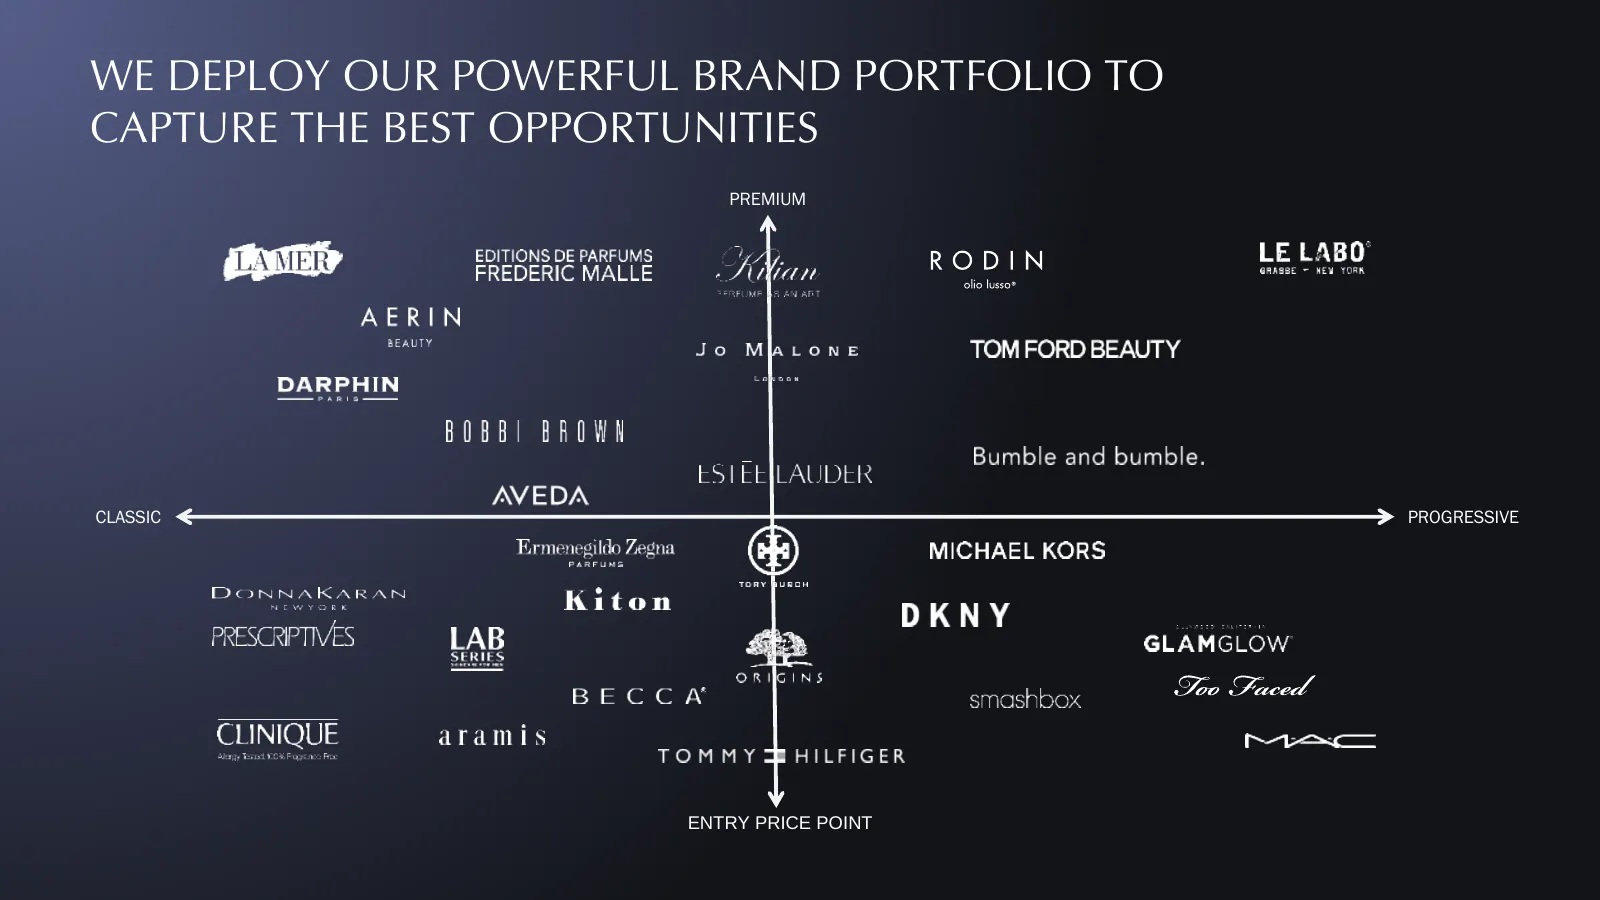
WE DEPLOY OUR POWERFUL BRAND PORTFOLIO TO CAPTURE THE BEST OPPORTUNITIES PREMIUM CLASSIC PROGRESSIVE ENTRY PRICE POINT
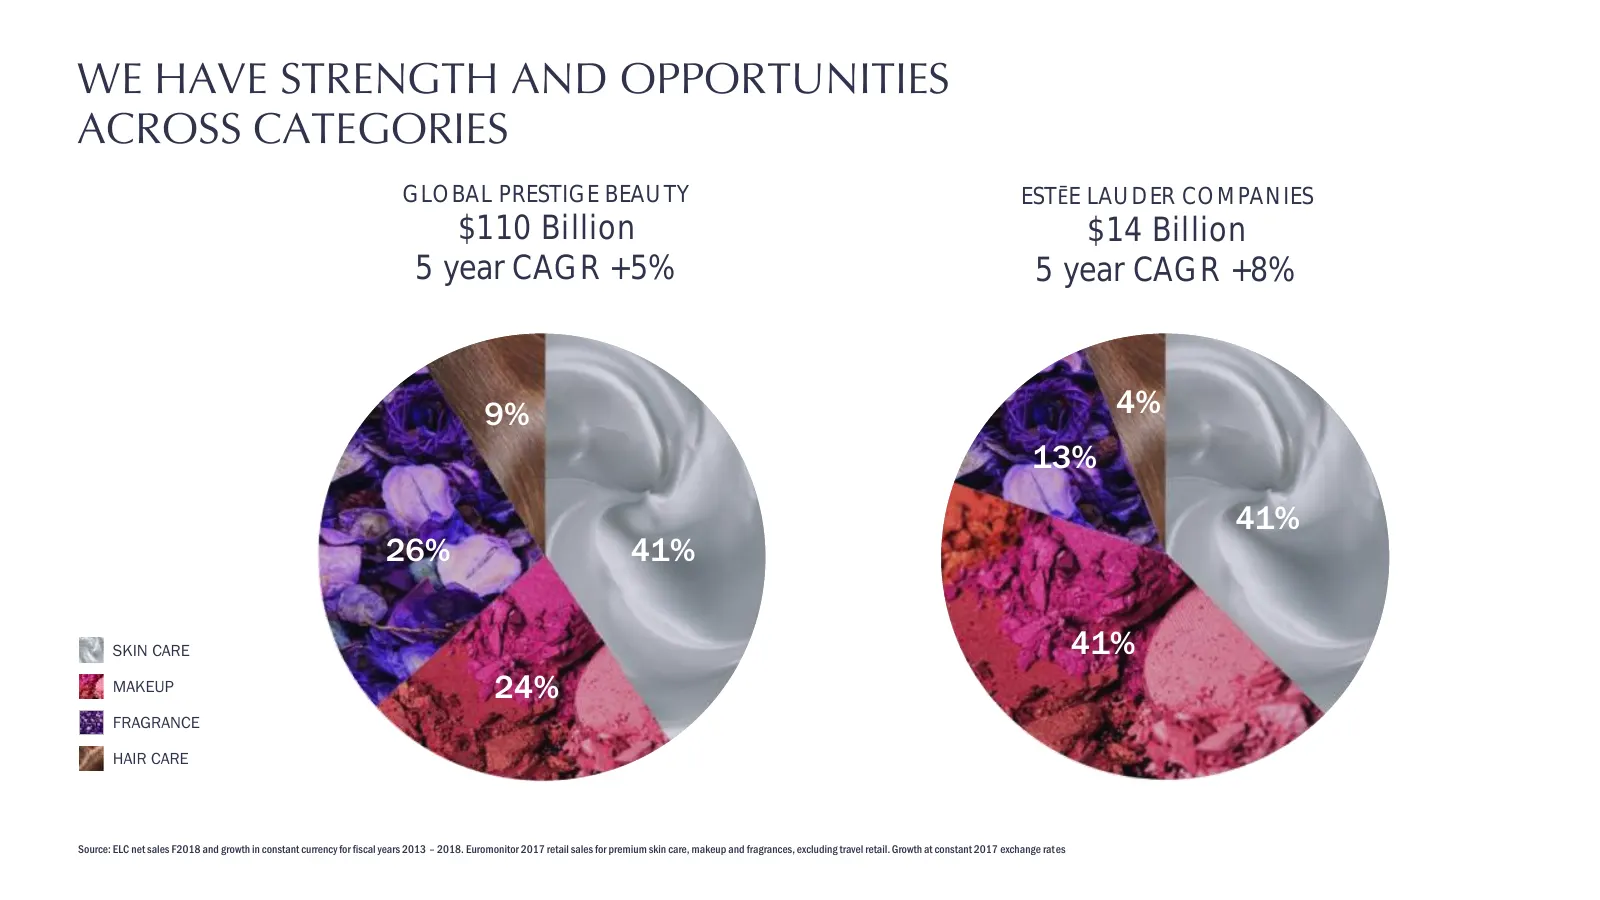
Slide 16: We Have Strength and Opportunities Across Categories
WE HAVE STRENGTH AND OPPORTUNITIES ACROSS CATEGORIES GLOBAL PRESTIGE BEAUTY ESTĒE LAUDER COMPANIES $110 Billion $14 Billion 5 year CAGR +5% 5 year CAGR +8% 9% 4% 13% 41% 26% 41% SKIN CARE 41% MAKEUP 24% FRAGRANCE HAIR CARE Source: ELC net sales F2018 and growth in constant currency for fiscal years
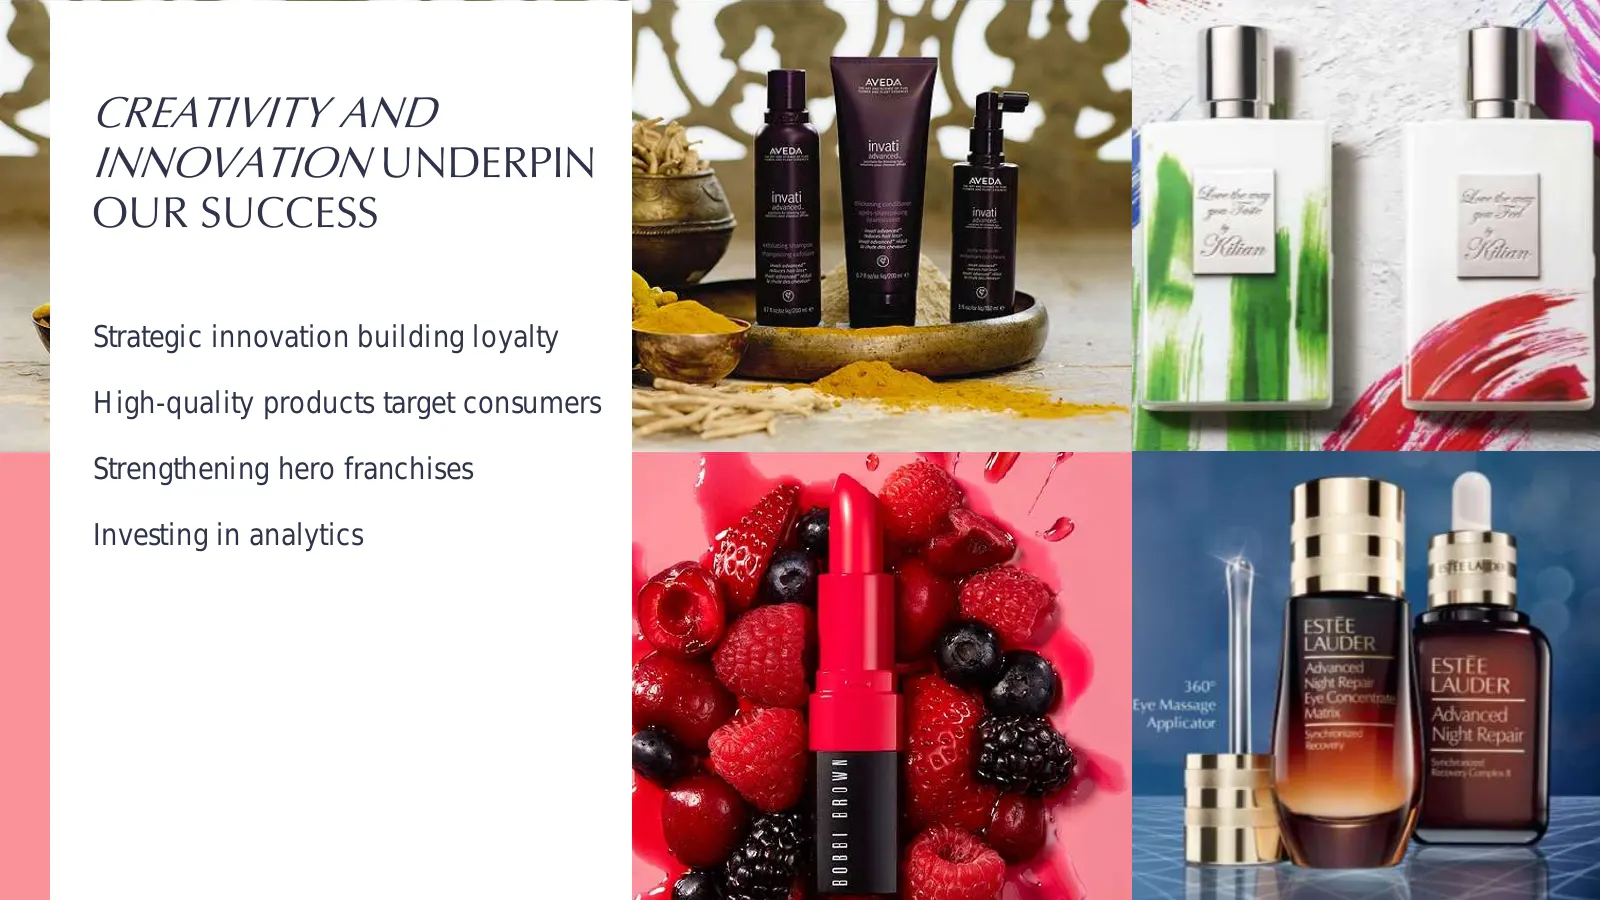
Slide 17: Creativity and Innovation Underpin Our Success
CREATIVITY AND INNOVATION UNDERPIN OUR SUCCESS Strategic innovation building loyalty High-quality products target consumers Strengthening hero franchises Investing in analytics
Slide 18: Breadth of Skin Care Innovation
BREADTH OF SKIN CARE INNOVATION

Slide 19: Clinique Moisture Surge
‘Moisture Surger 72-Hour Auto-ReplenishingHydrator ‘Alergy Tested 10024 Fragrance Fee. Now, give your skin the power to rehydrate itself. Ournewest Moisture Surge" with activated alos water helps skin creat its own intemal water source. Keepsitalmost twice as hydrated at the end of the day than it d
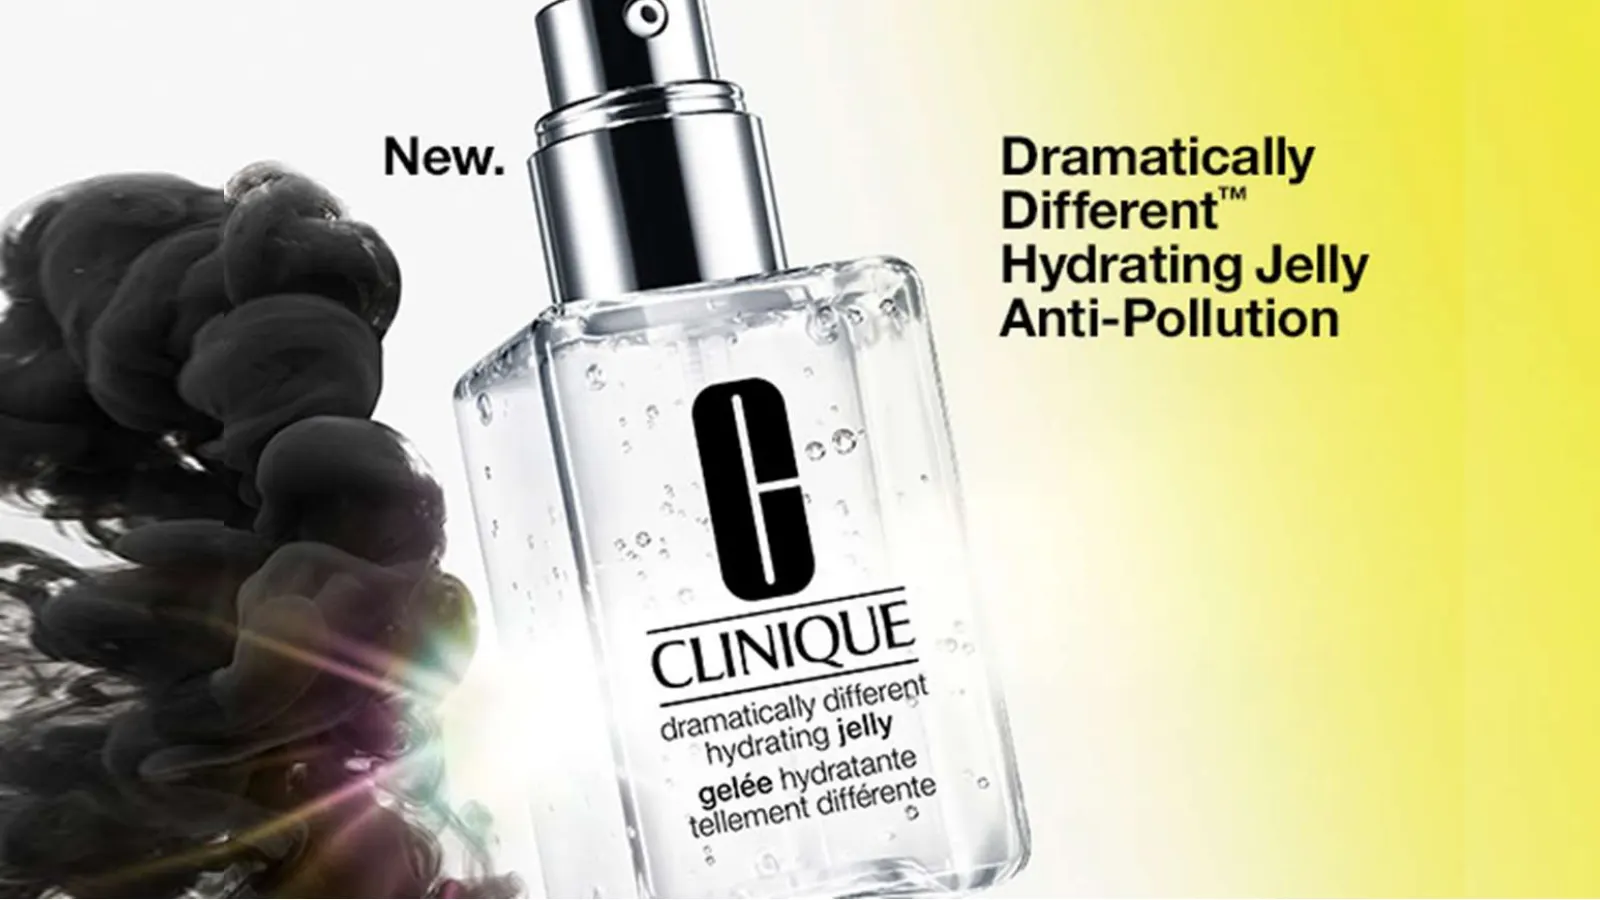
Slide 20: Dramatically Different
Dramatically Different” Hydrating Jelly Anti-Pollution
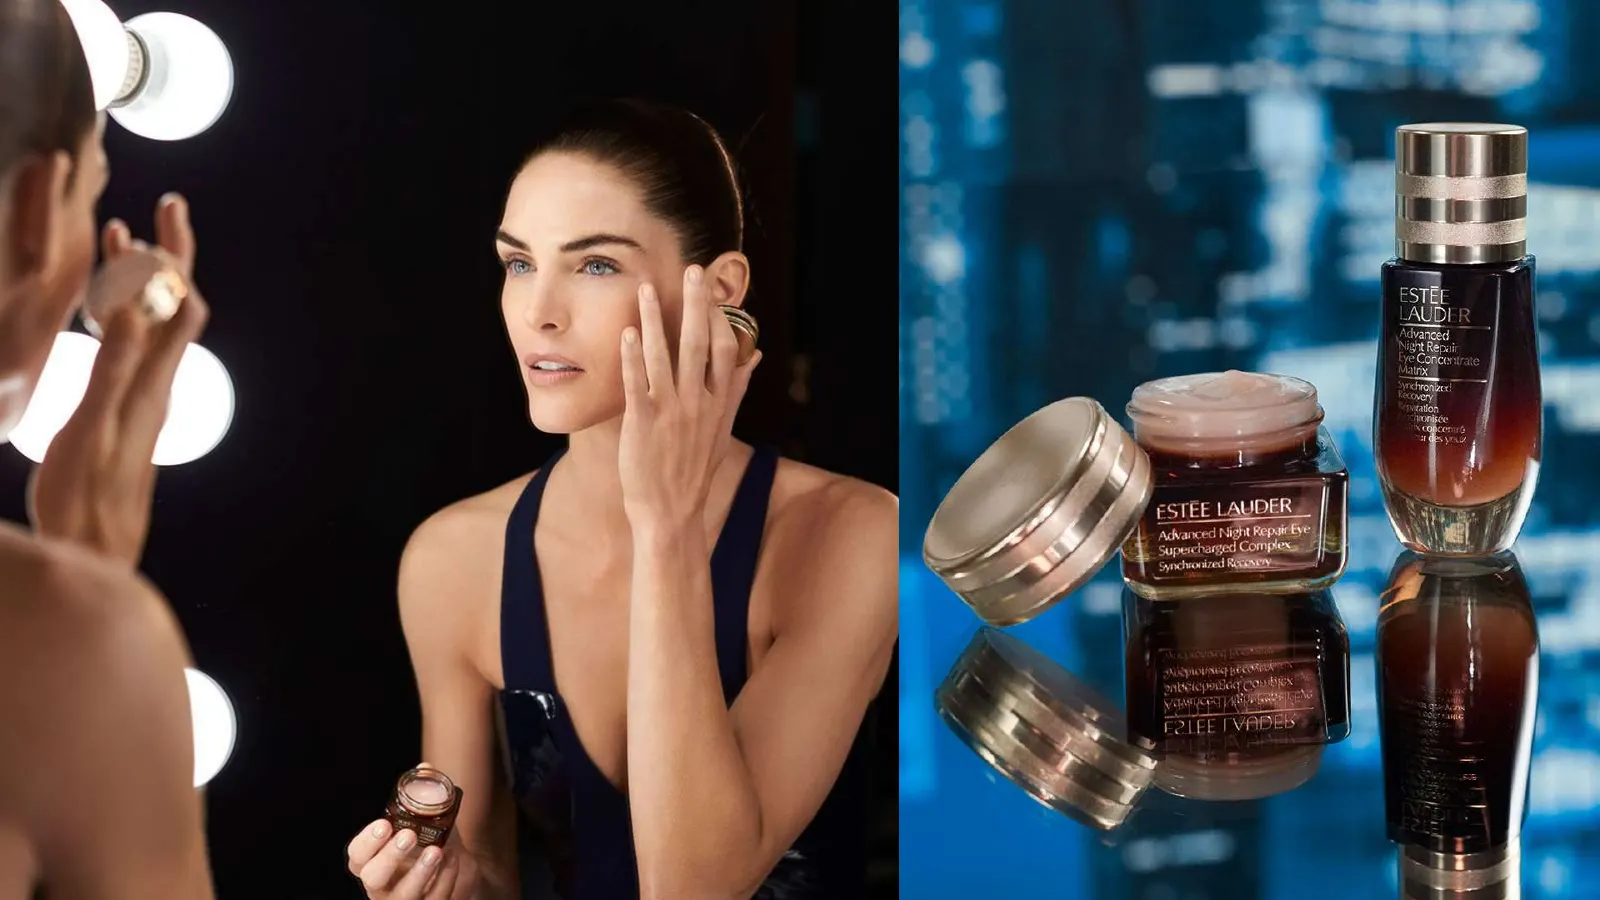
Slide 21: Estée Lauder Advanced Night Repair
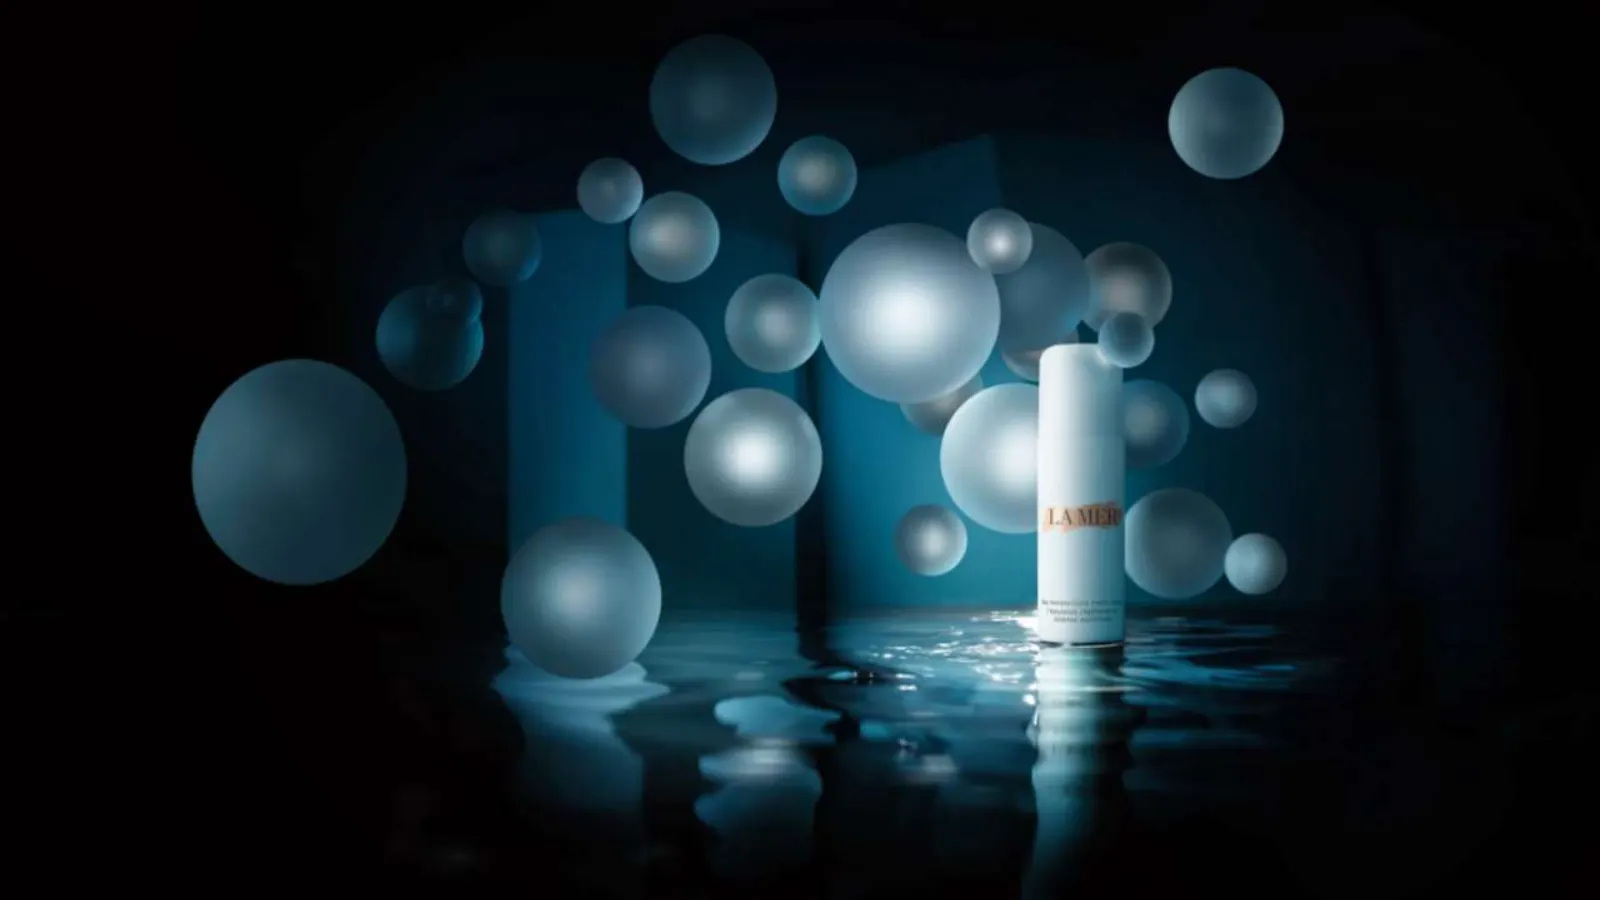
Slide 22: La Mer
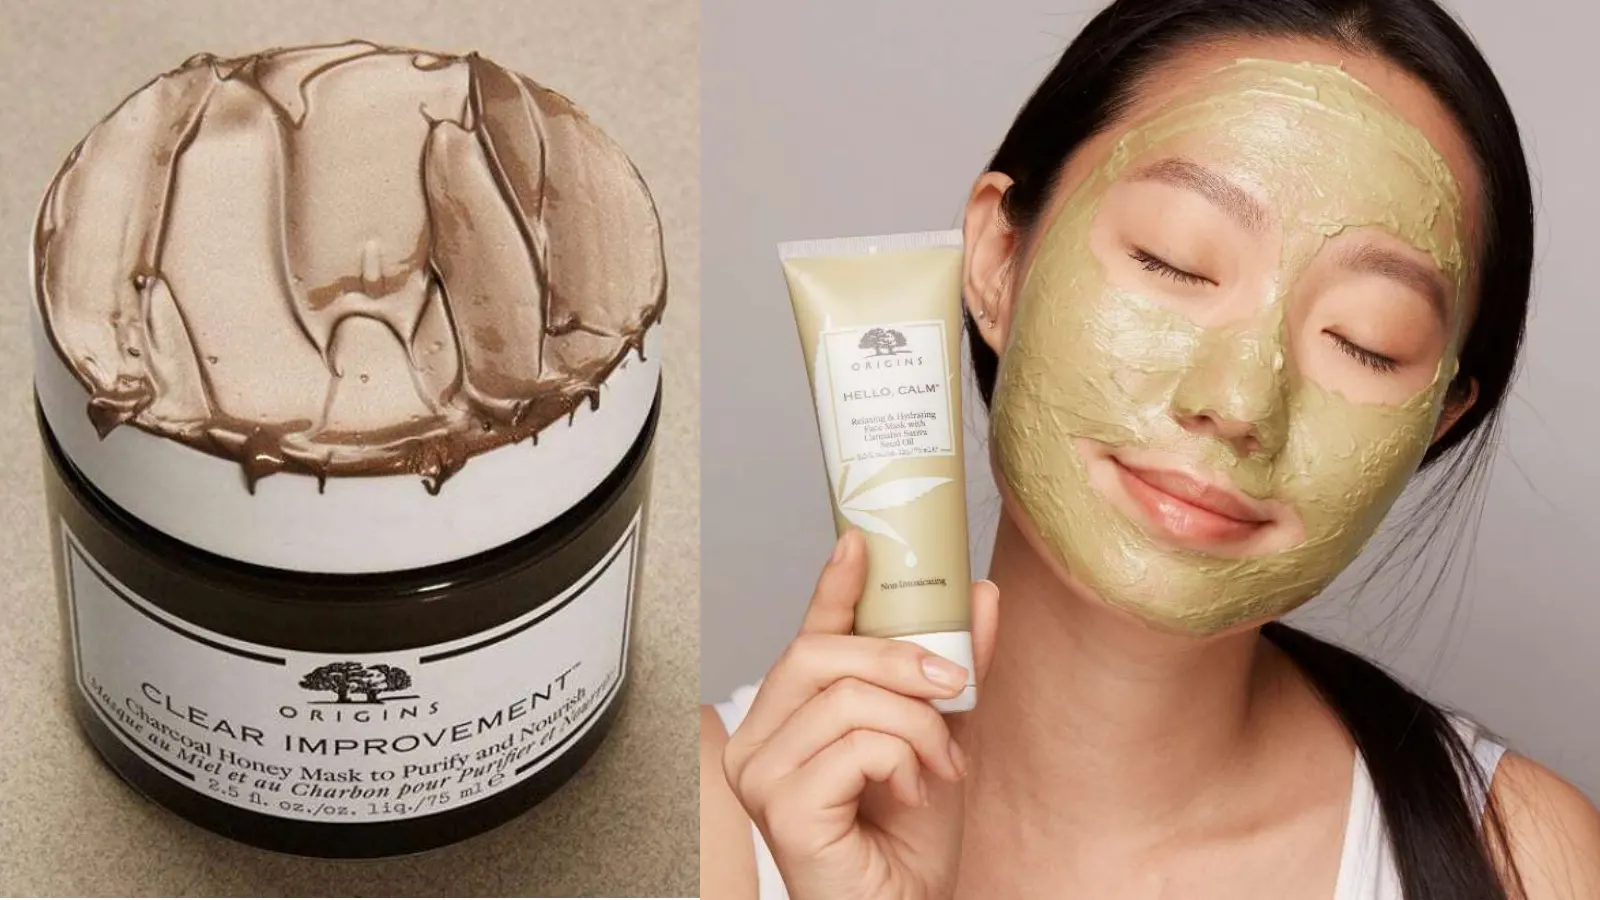
Slide 23: Origins masks
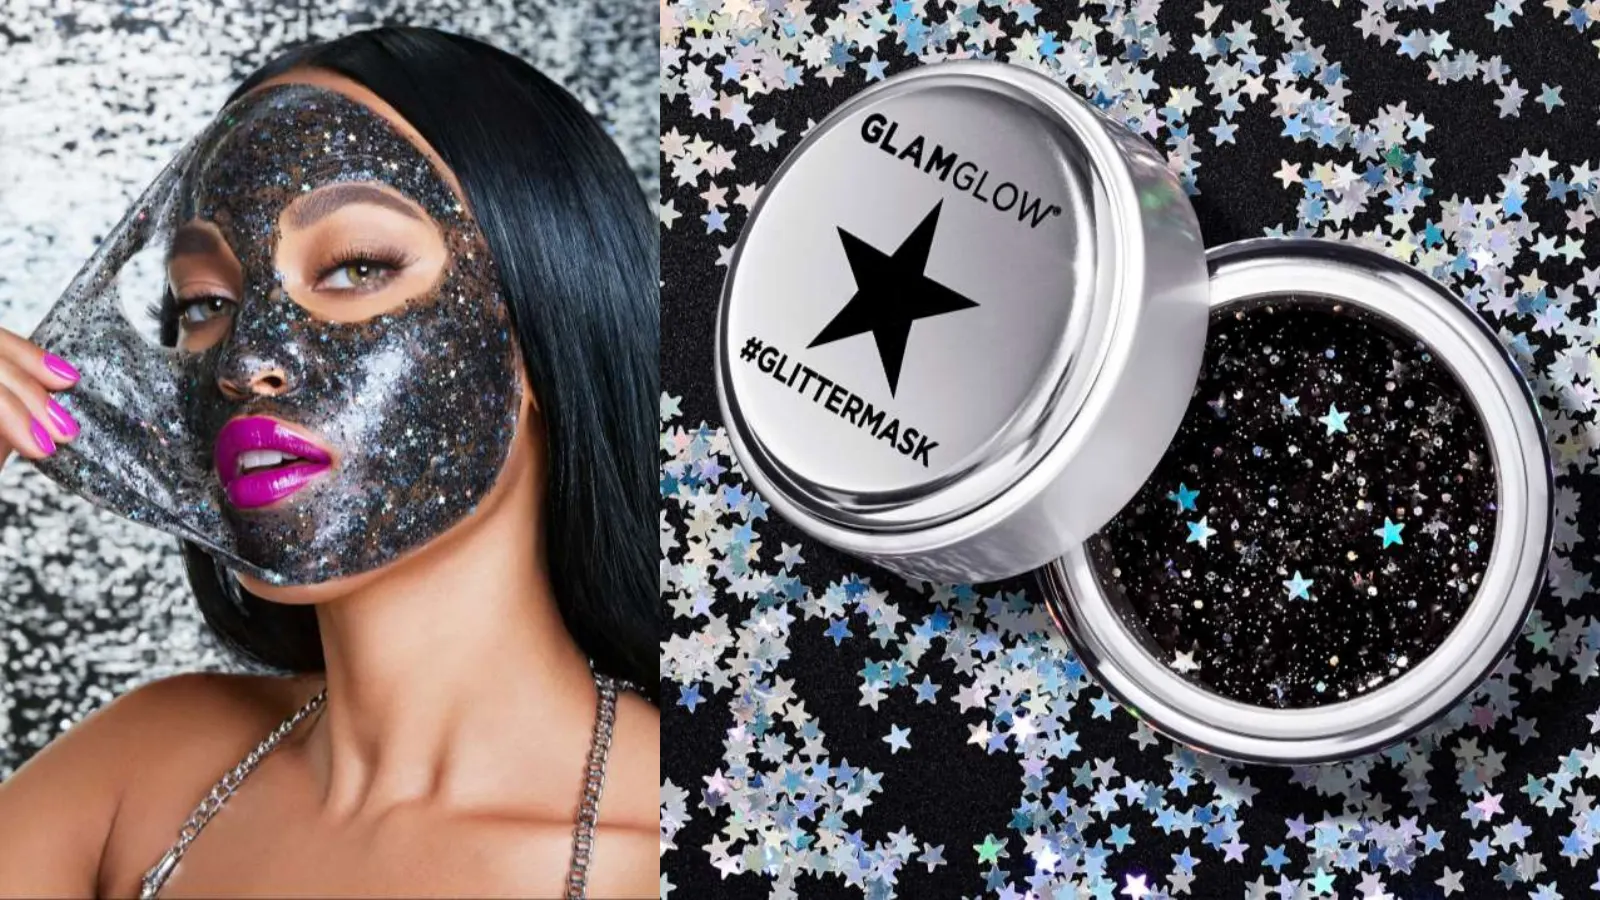
Slide 24: Glamglow Glittermask
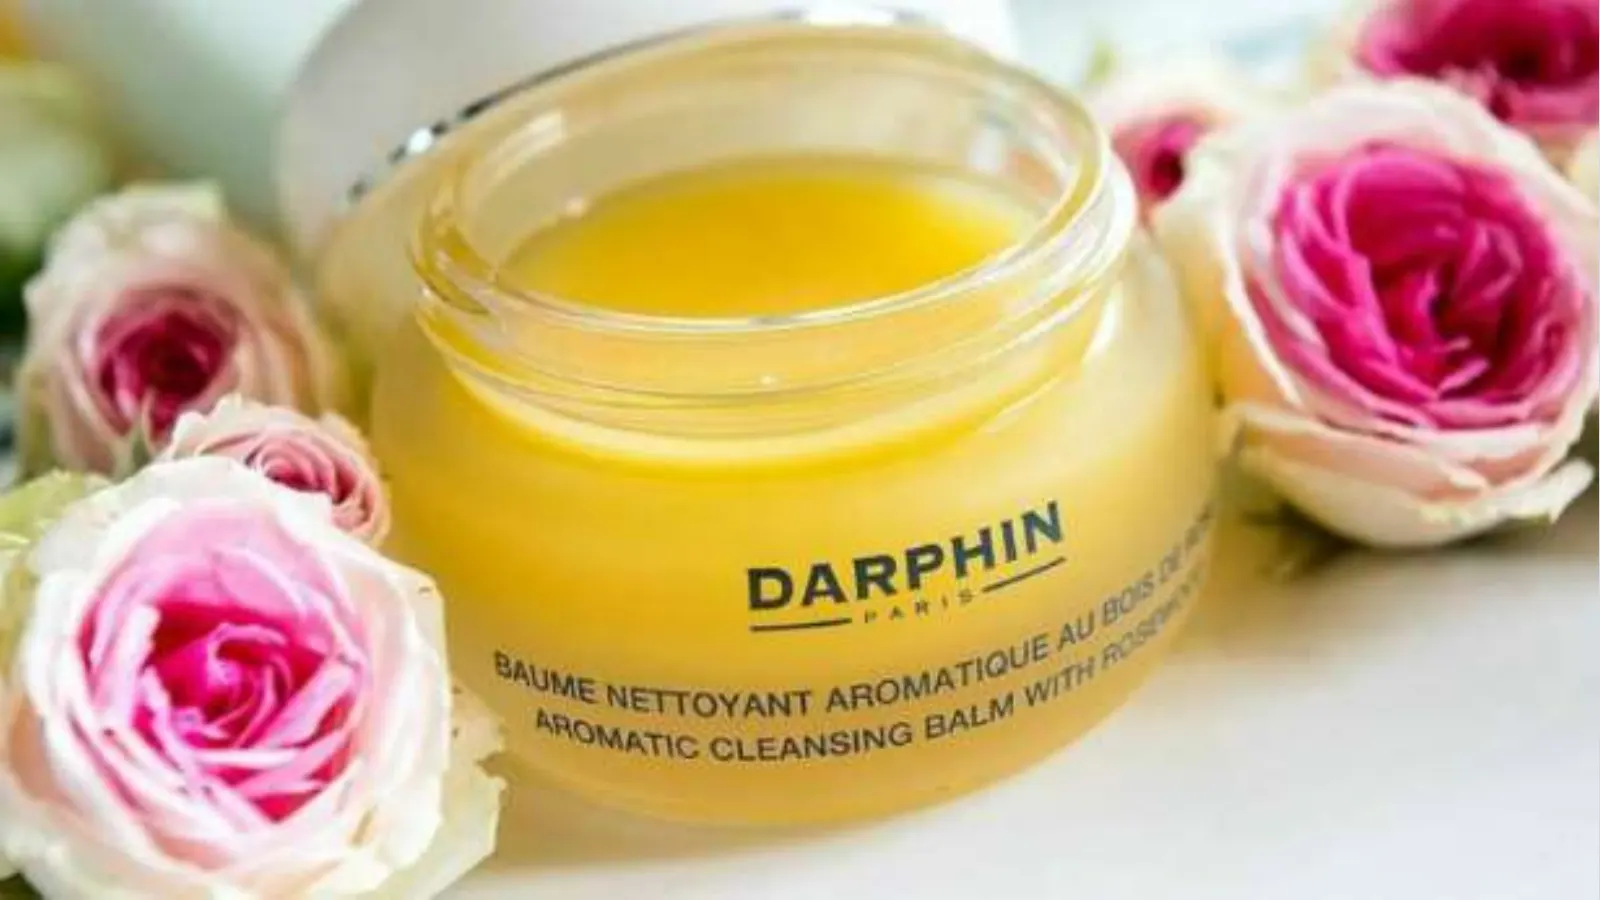
Slide 25: Darphin cleansing balm

Slide 26: Skin care product retail

Slide 27: Capturing & Creating Makeup Trends
CAPTURING & CREATING MAKEUP TRENDS

Slide 28: MAC Powder Kiss Lipstick
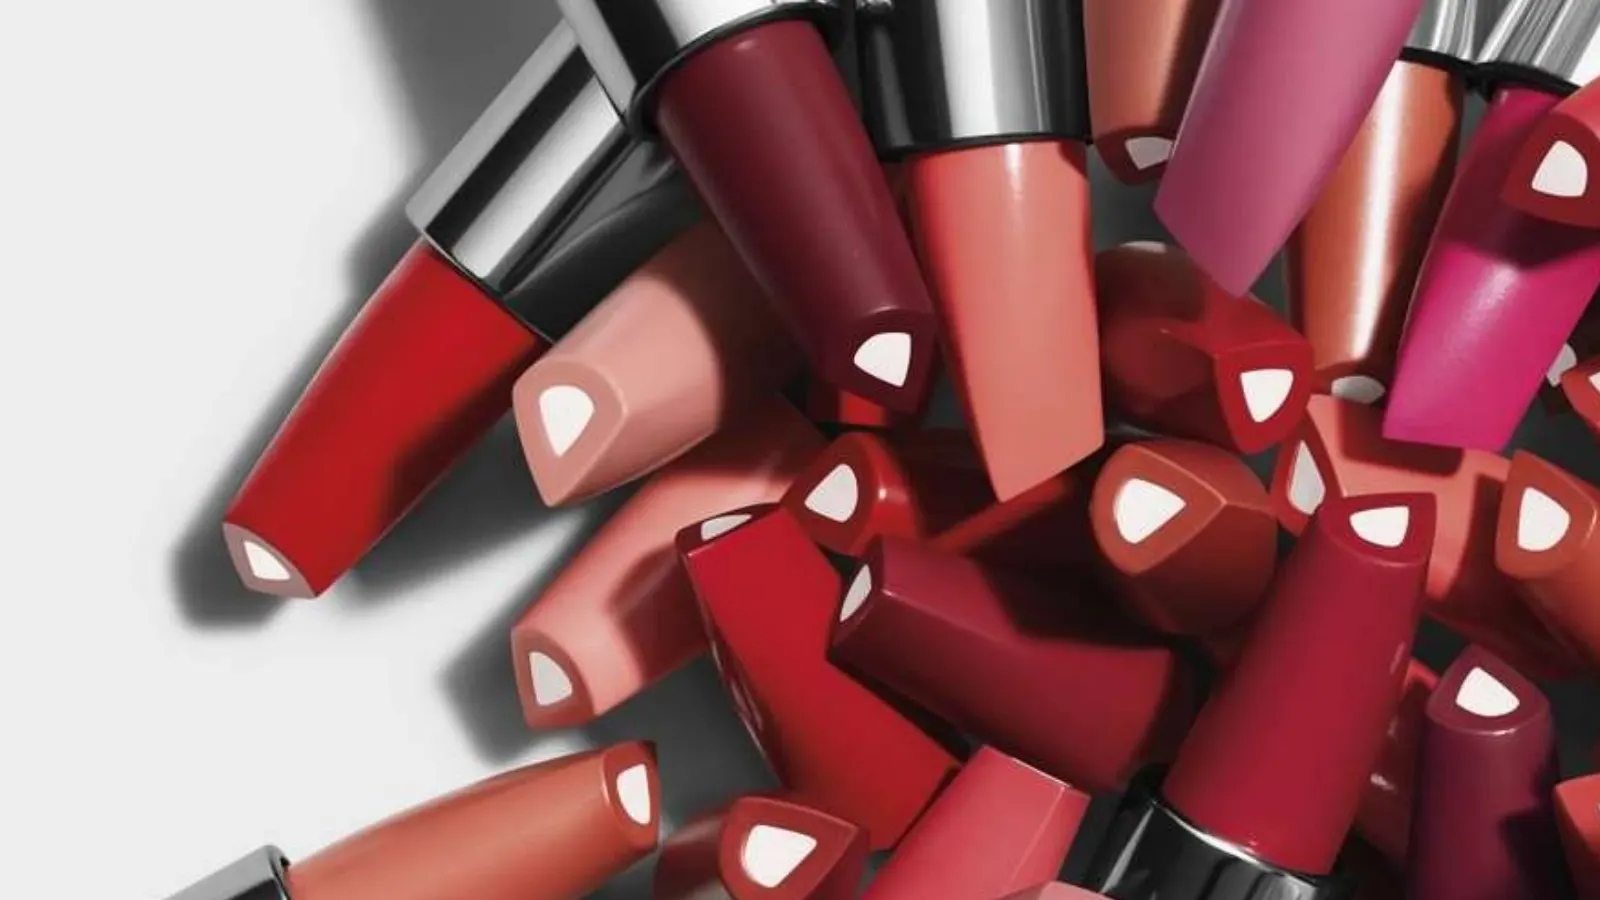
Slide 29: Lipstick innovation
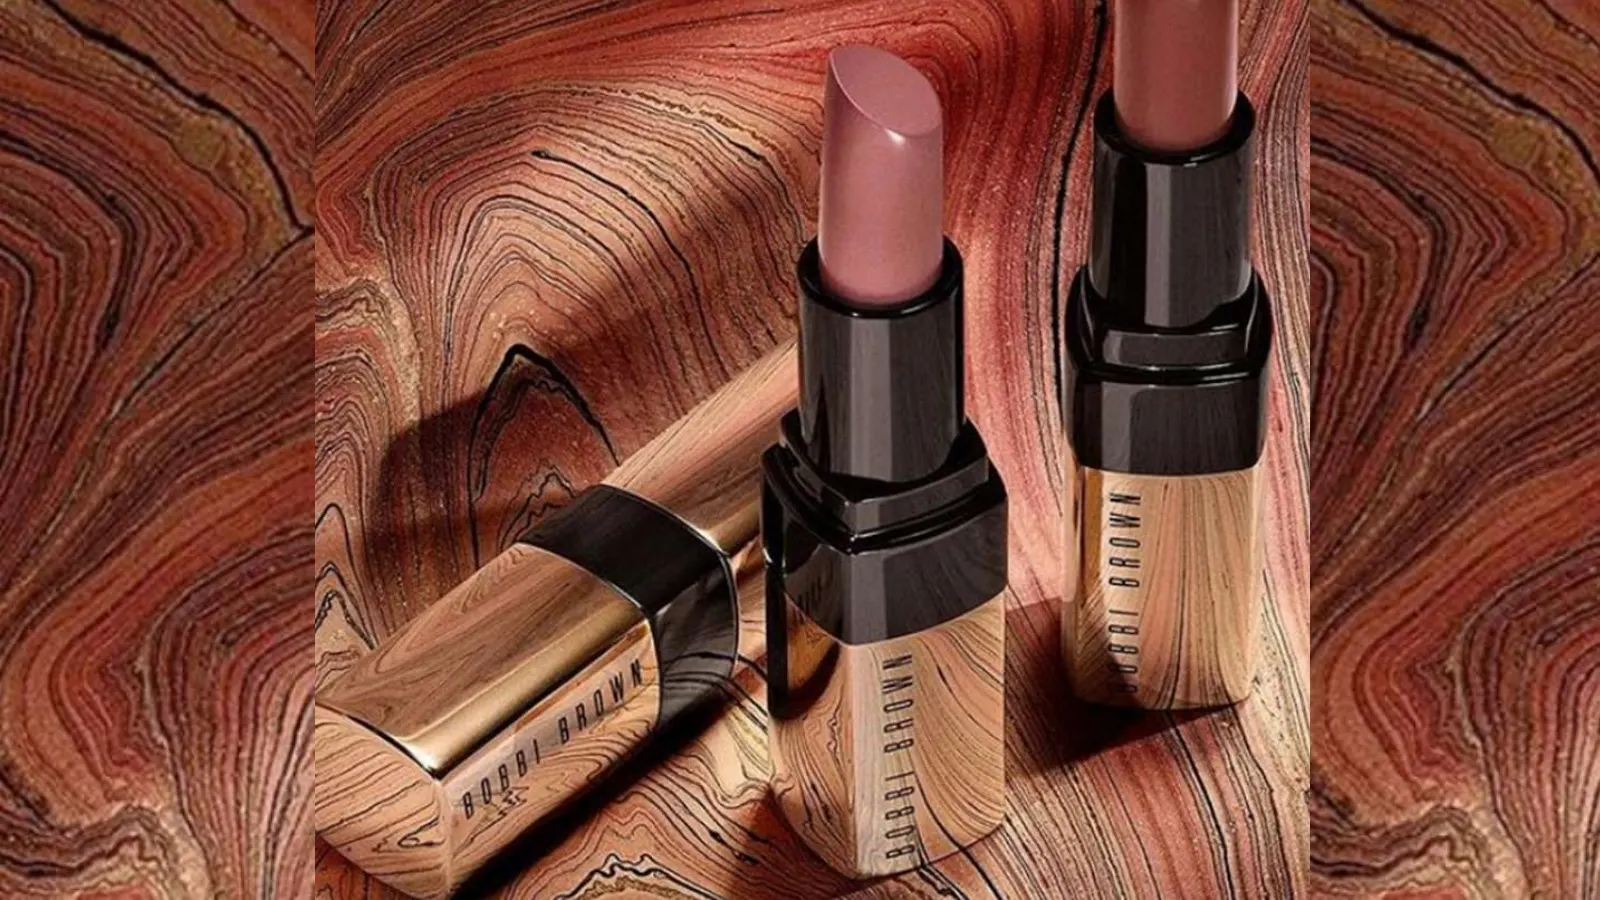
Slide 30: Bobbi Brown Luxe Lip Color
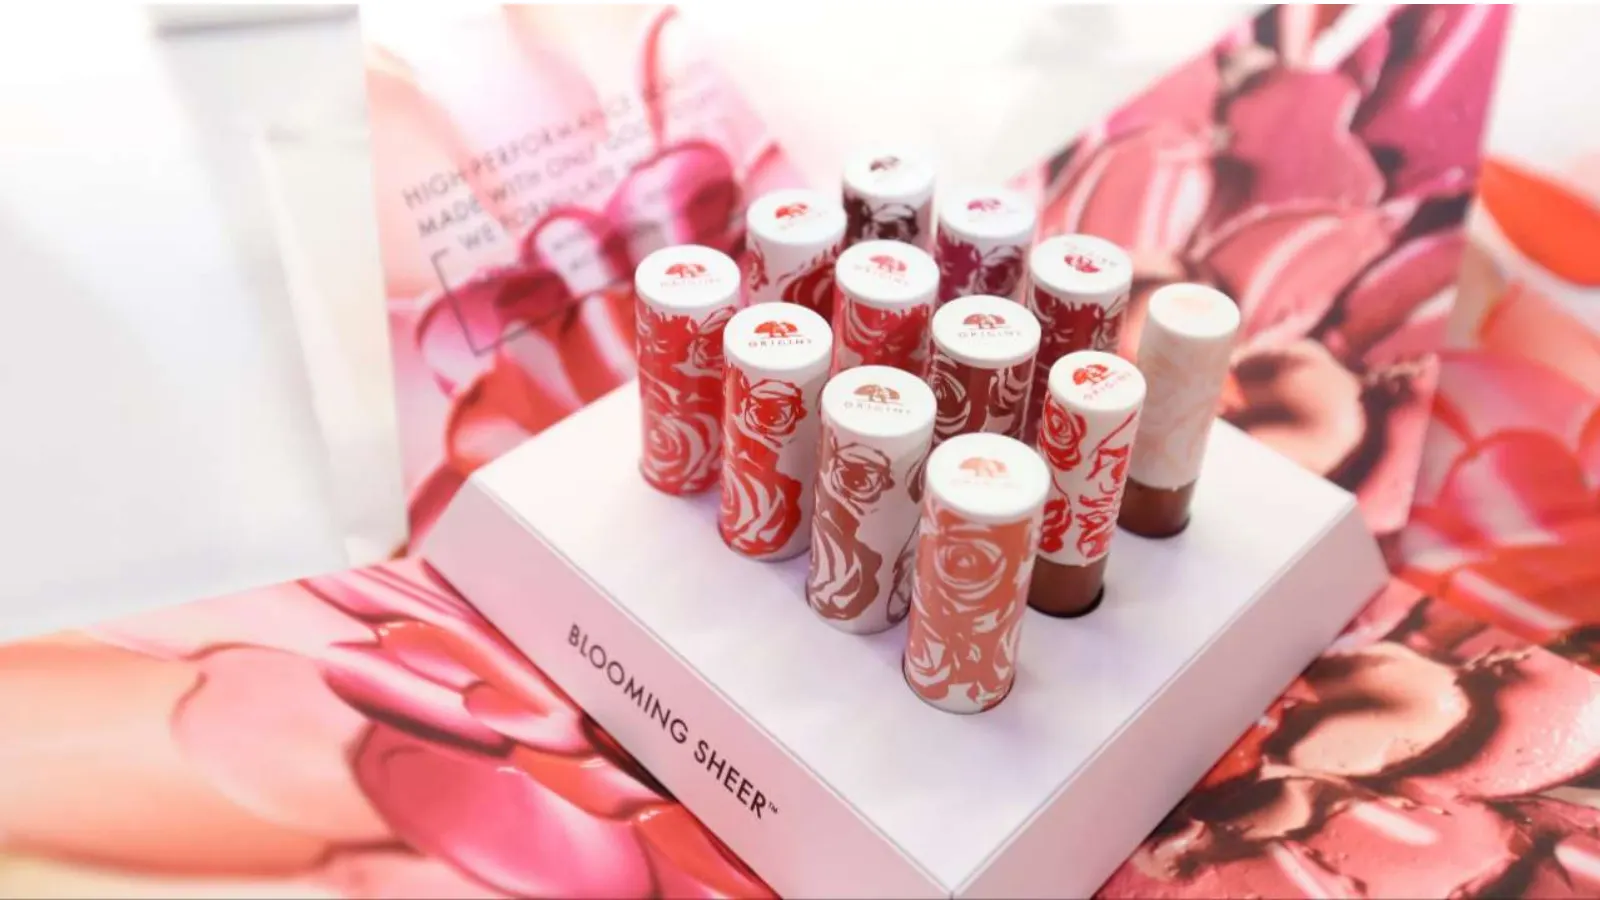
Slide 31: Origins Blooming Sheer

Slide 32: Too Faced eyeshadows
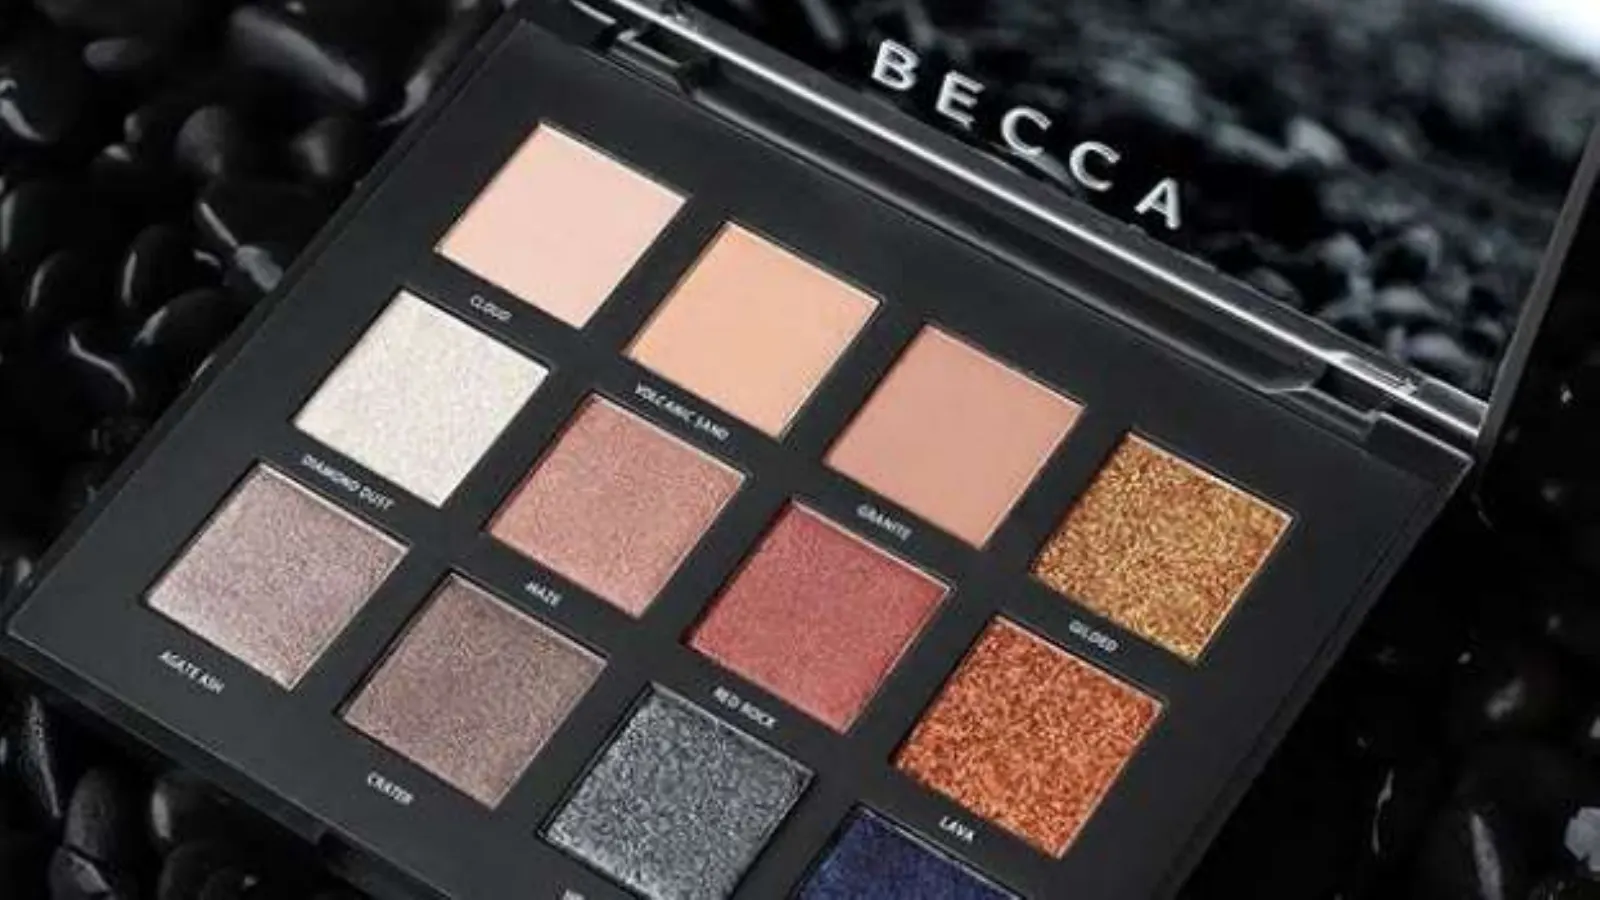
Slide 33: Becca palette
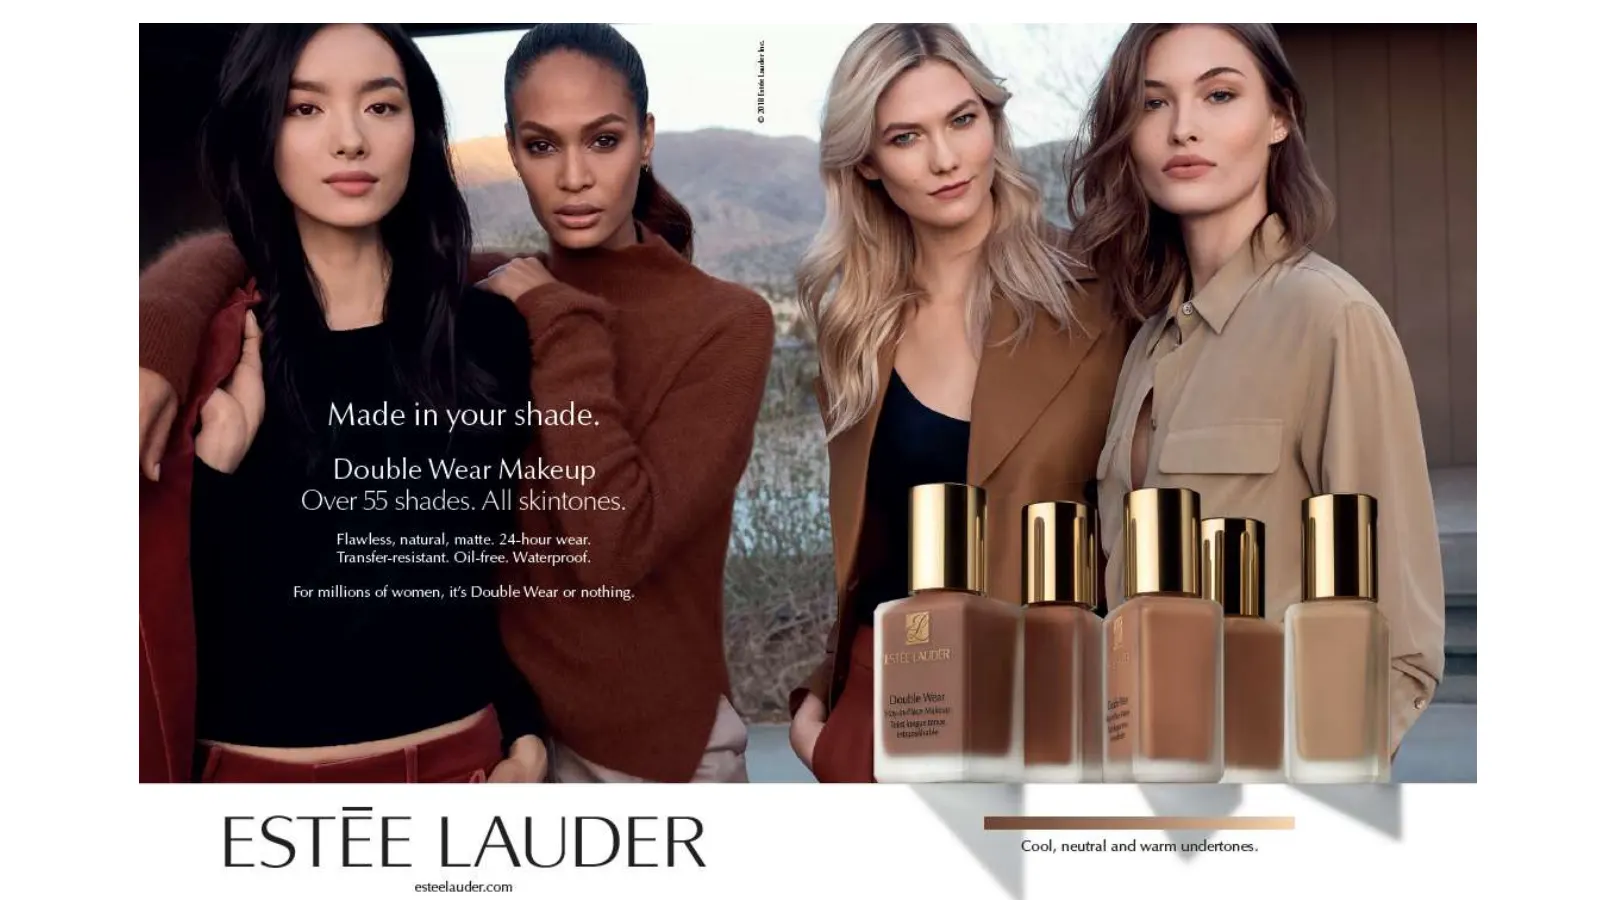
Slide 34: Made in Your Shade
Made in your shade. Double Wear Makeup Over 55 shades. All skintones Flawless, natural, matt Tra stant. O For millions of women, it’s Double Wear or nothing, ESTEE LAUDER — esteelauder.com
Slide 35: The Emotional Art of Fragrance
THE EMOTIONAL ART OF FRAGRANCE

Slide 36: Le Labo Tonka 25
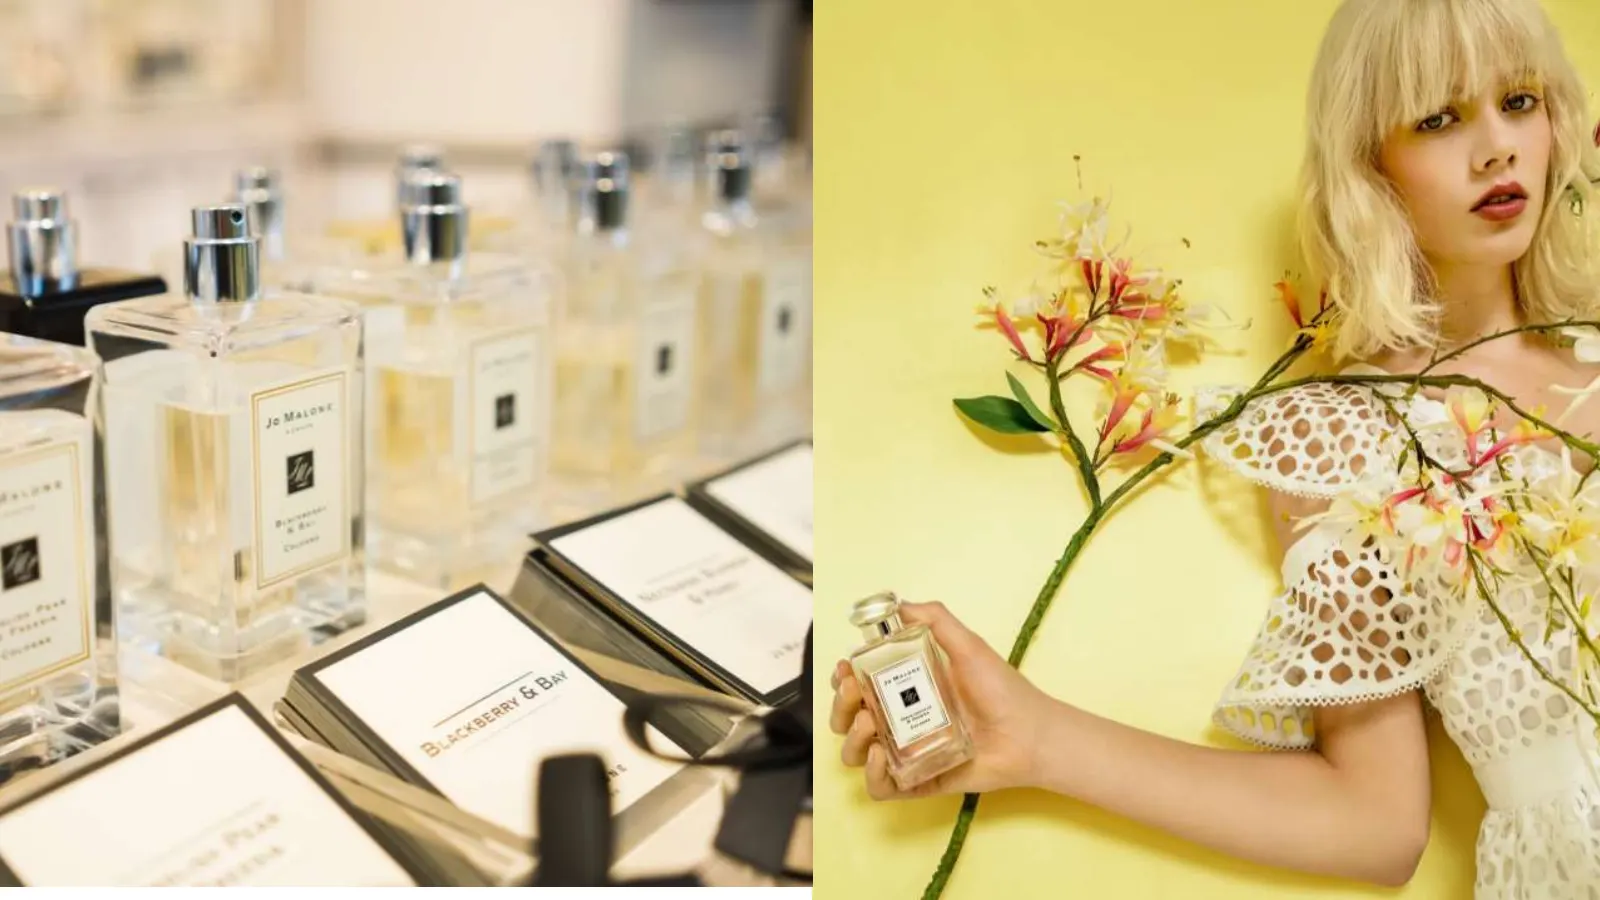
Slide 37: Jo Malone London
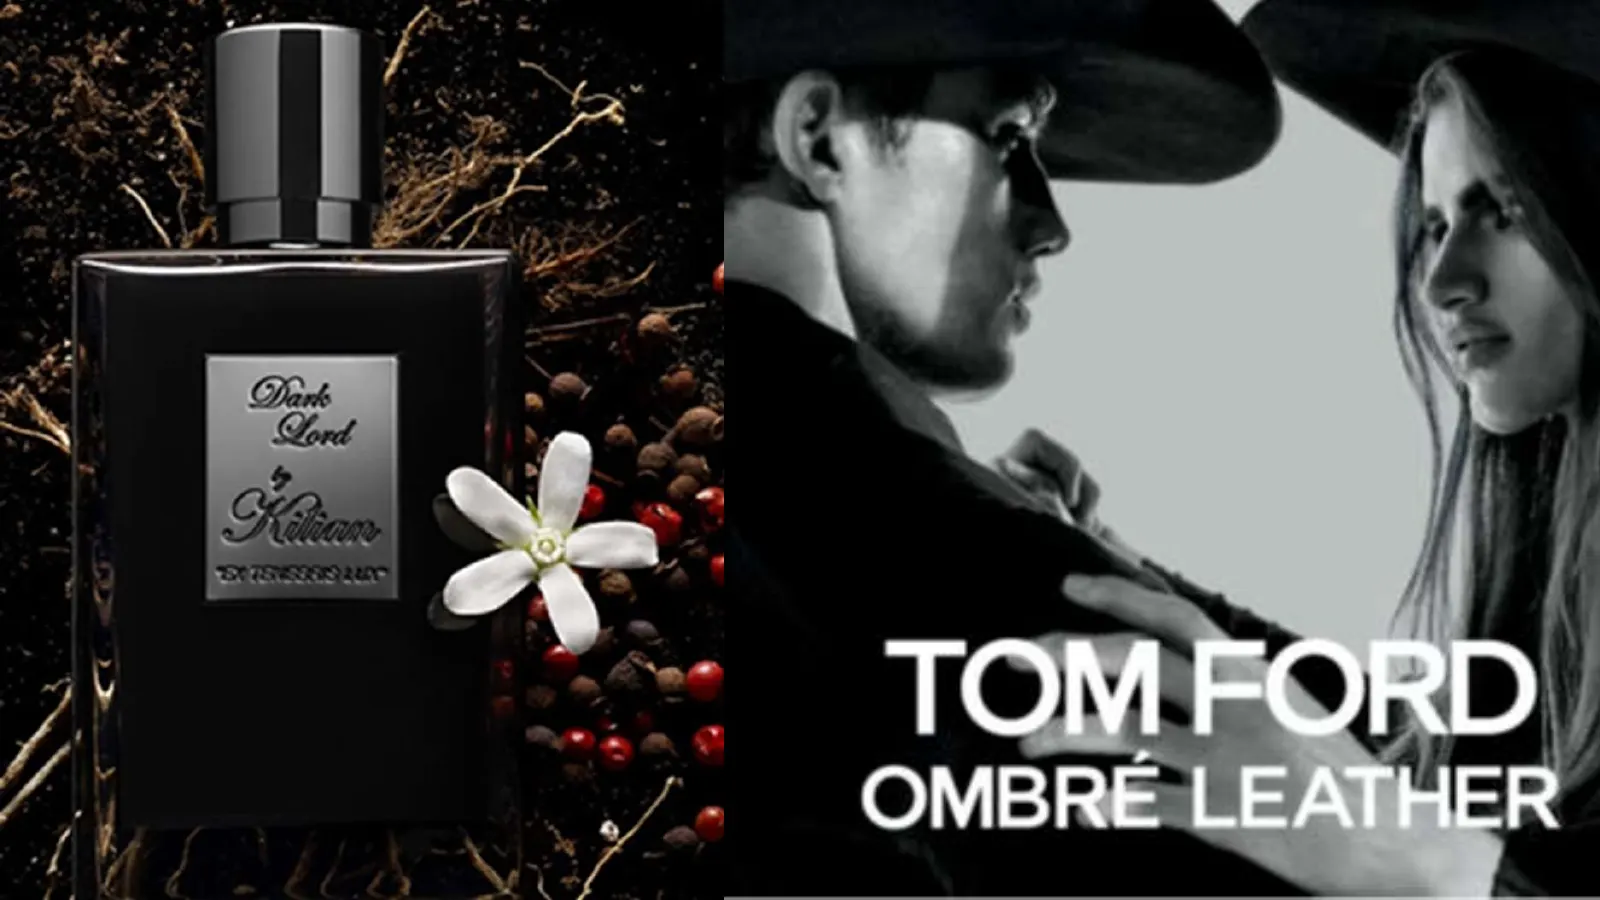
Slide 38: Kilian and Tom Ford fragrances

Slide 39: Editions de Parfums Frédéric Malle
A PERFUME COMPOSED BY CARLOS BENAIM MUSIC -OR WHILE@® EDITIONS DE PARFUMS FREDERIC MALLE No, 23/25

Slide 40: Estée Lauder Beautiful Belle

Slide 41: Advances in Hair Care
ADVANCES IN HAIR CARE

Slide 42: Aveda hair care
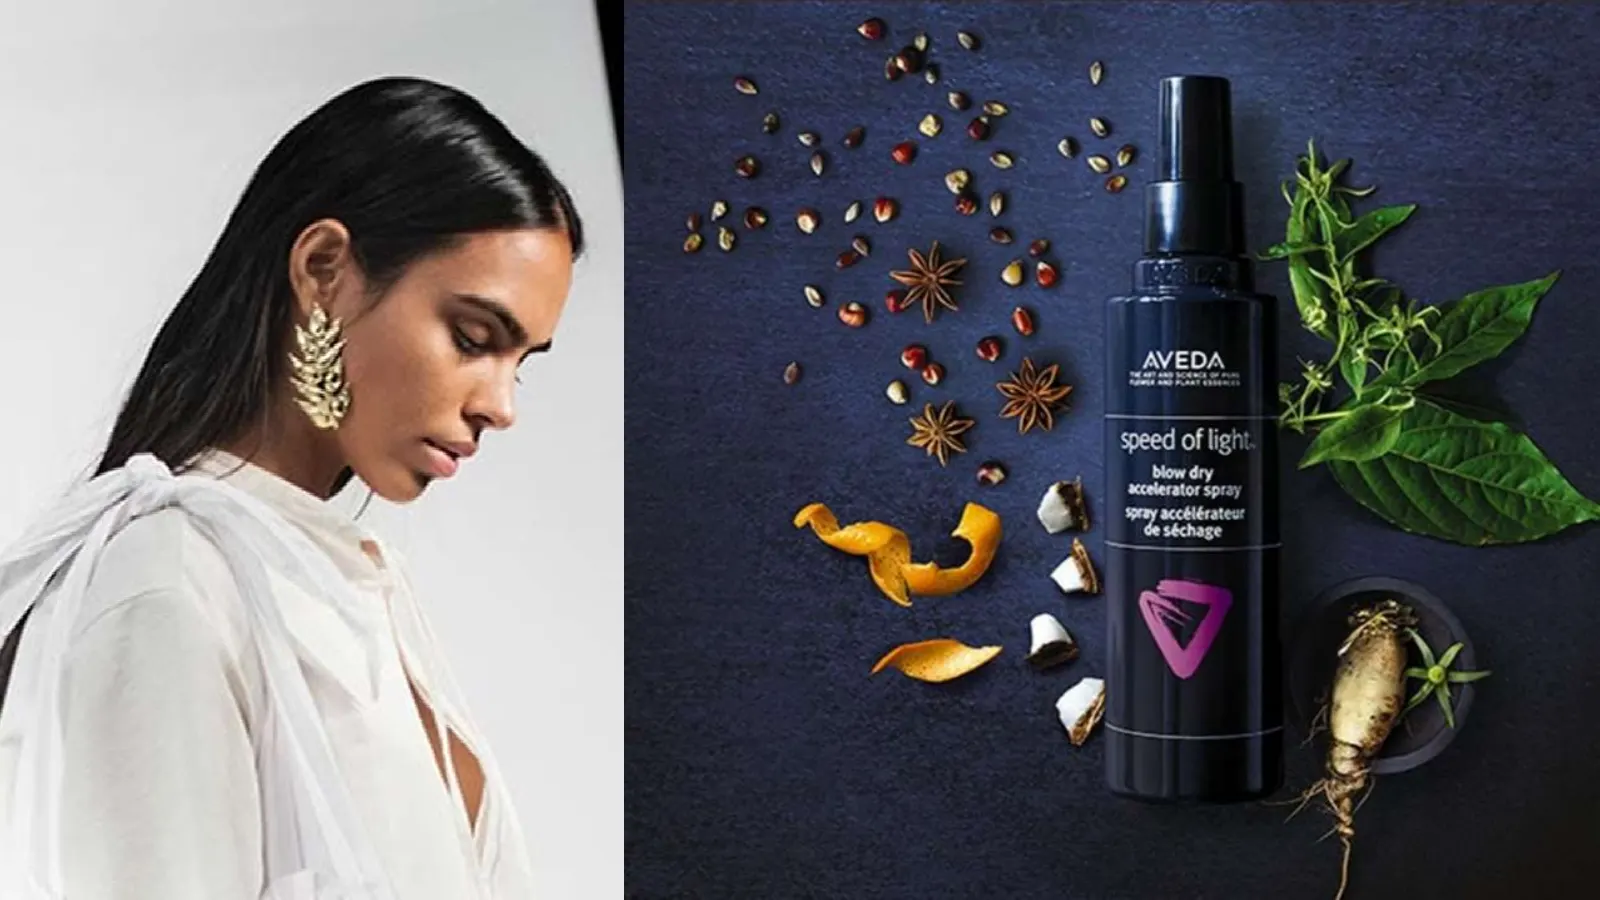
Slide 43: Hair care innovation
¢. Sue 6 ws | 4 e ce ¥ » ov e v e ’/¥ 7 OF (ee & Fe ¥ — « ‘ © . < f\ ign Go rpettenee 4 séchage

Slide 44: Bumble and bumble Thickening
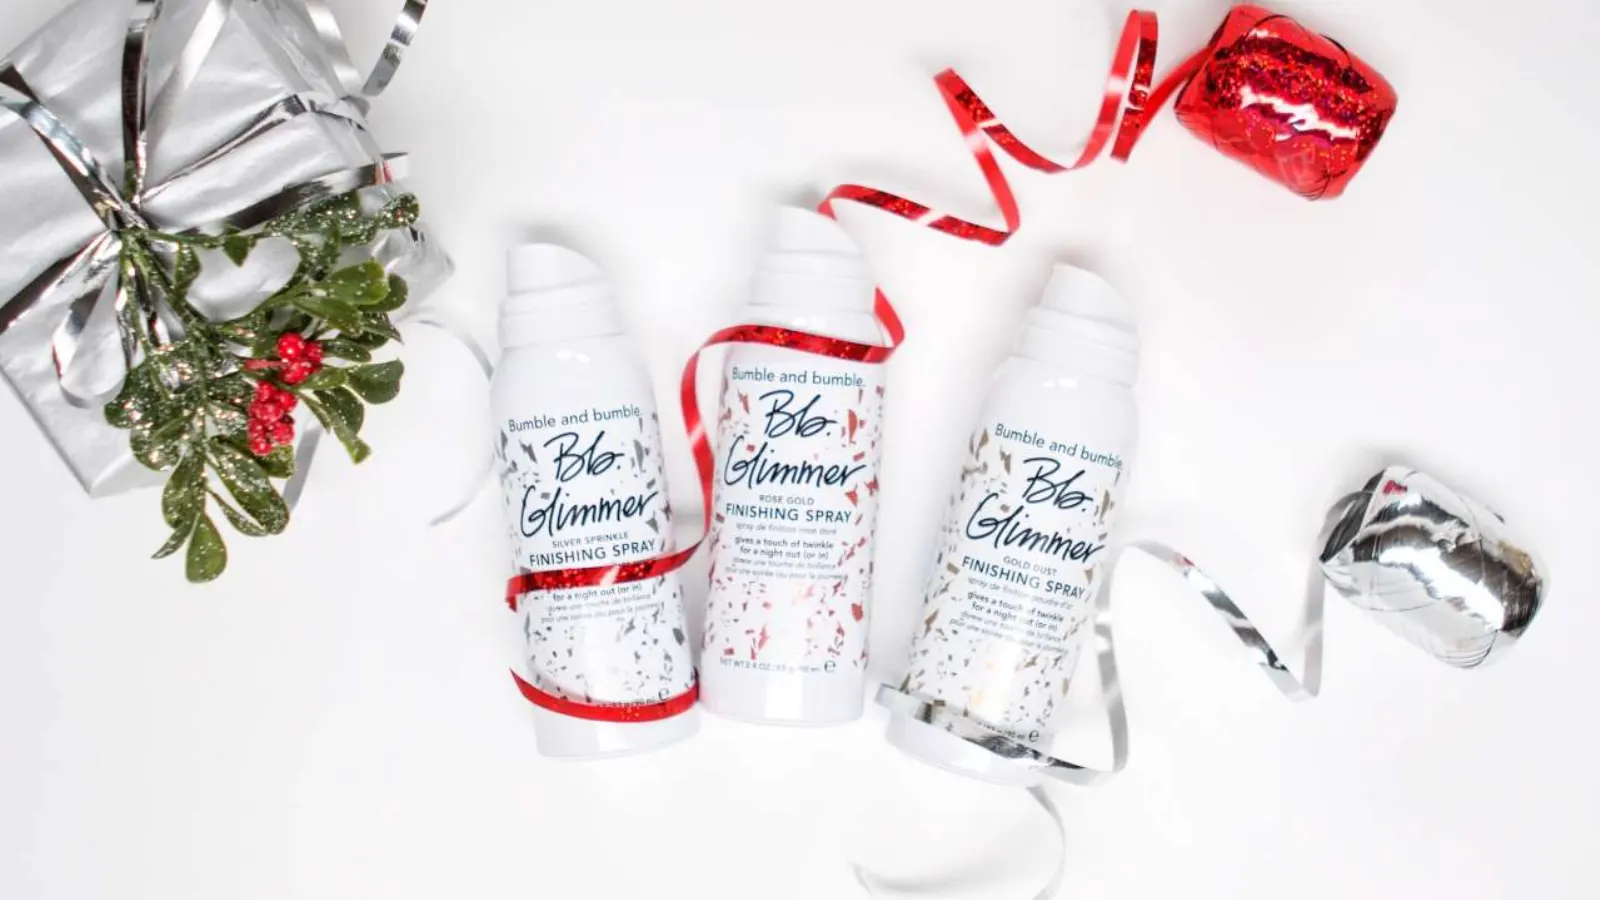
Slide 45: Bumble and bumble Glimmer
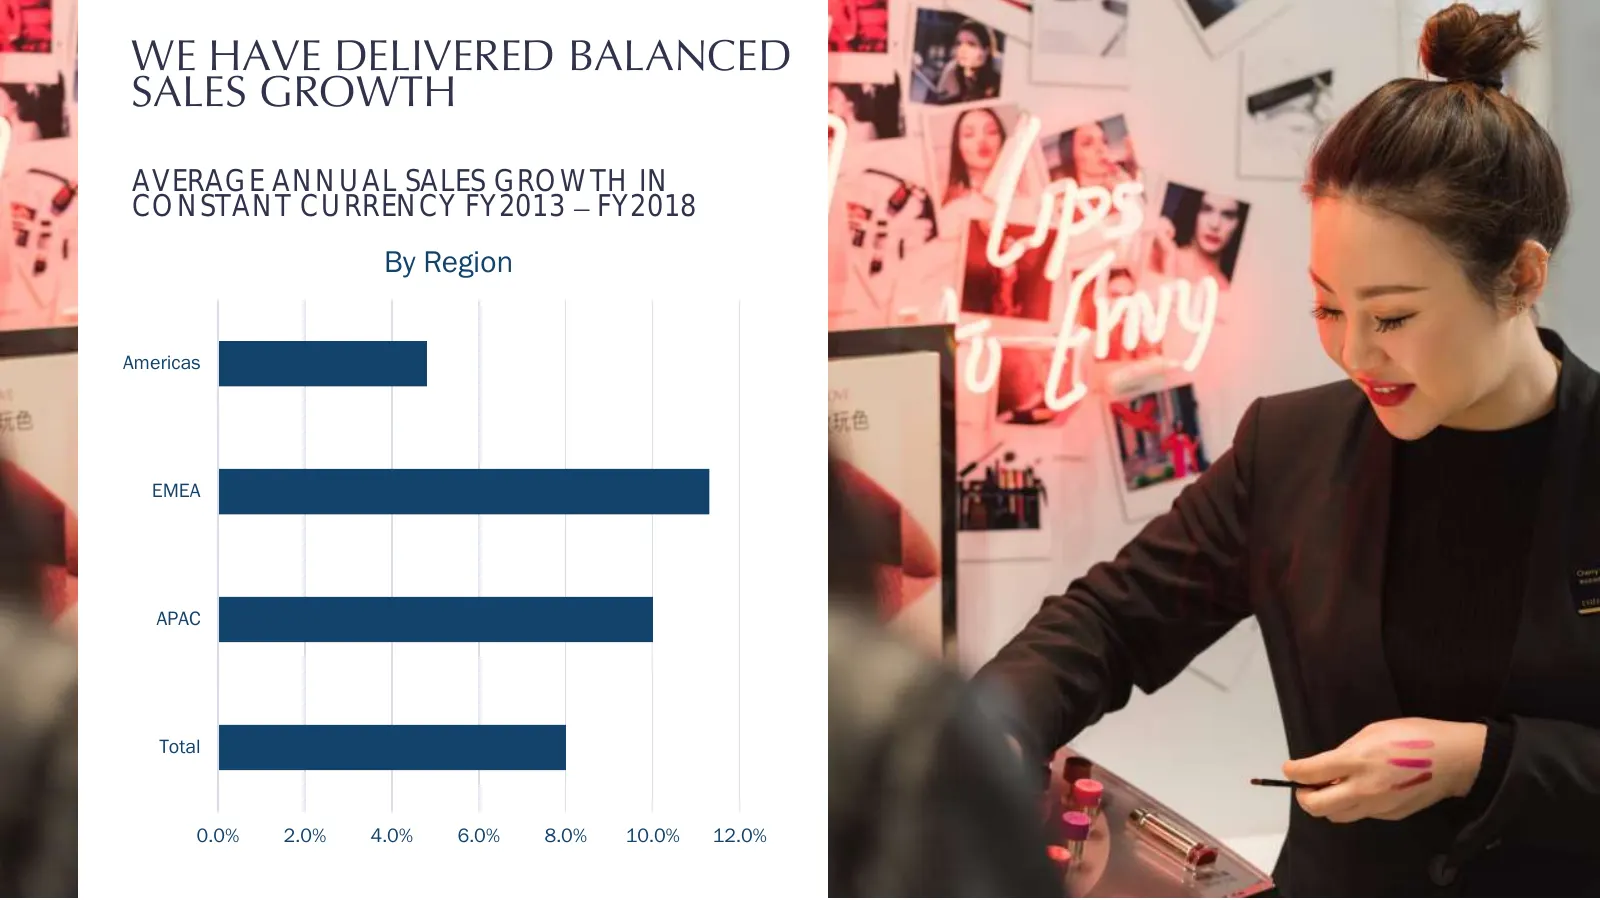
Slide 46: We Have Delivered Balanced Sales Growth
WE HAVE DELIVERED BALANCED SALES GROWTH AVERAGE ANNUAL SALES GROWTH IN CONSTANT CURRENCY FY2013 FY2018 By Region Americas EMEA APAC Total 0.0% 2.0% 4.0% 6.0% 8.0% 10.0% 12.0%
Slide 47: Driving Momentum Around the World
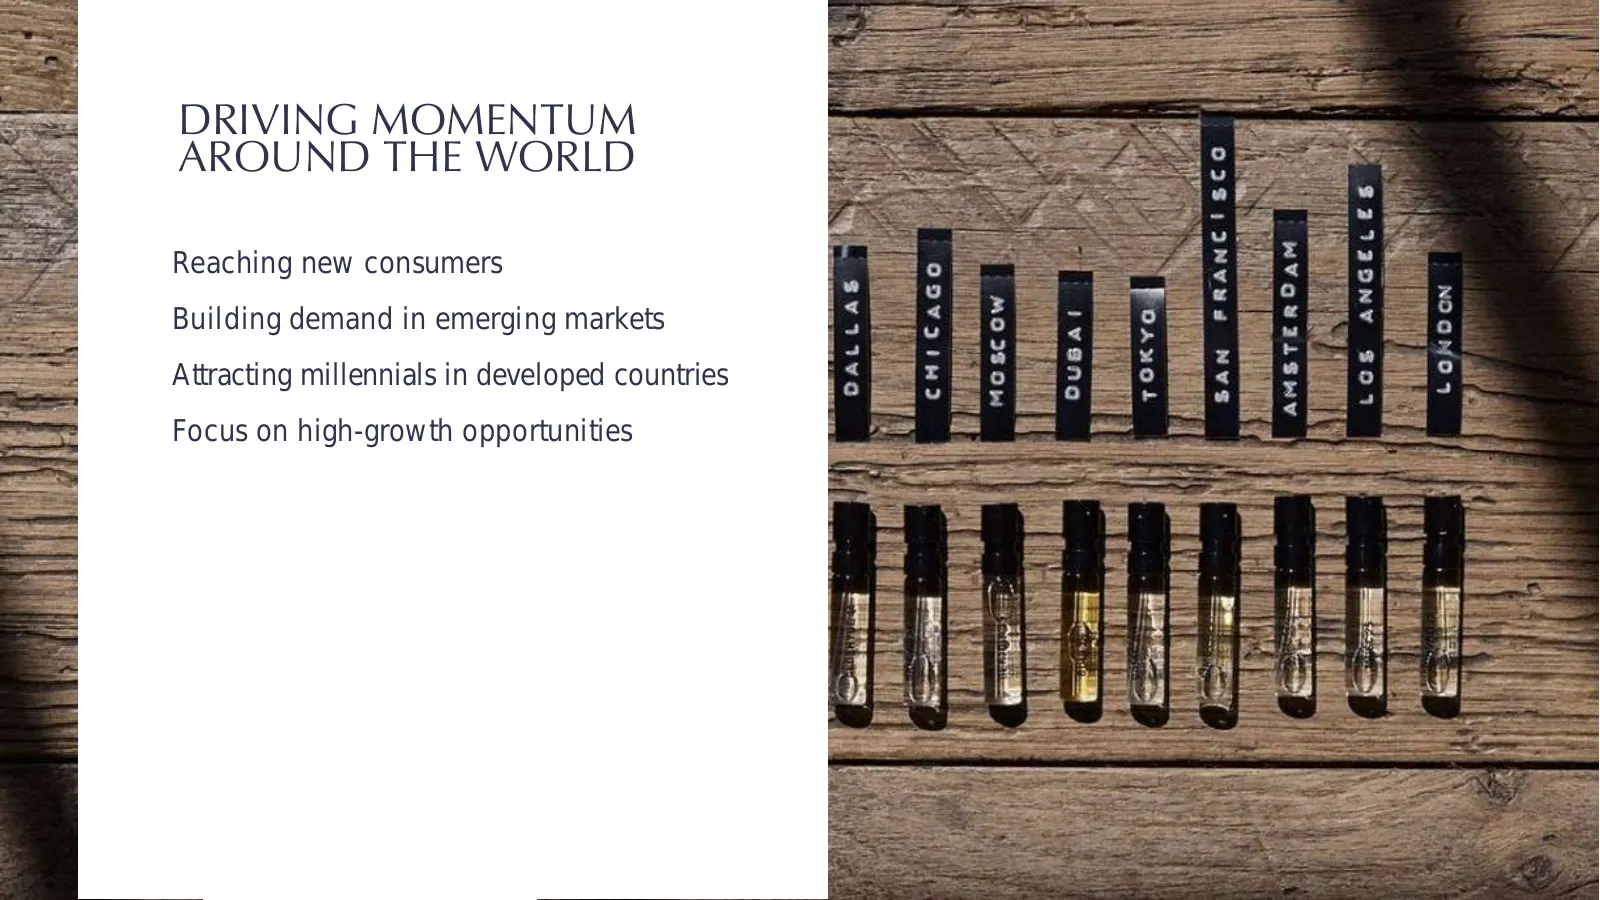
DRIVING MOMENTUM AROUND THE WORLD Reaching new consumers Building demand in emerging markets Attracting millennials in developed countries Focus on high-growth opportunities
Slide 48: Strength Across Multiple Channels
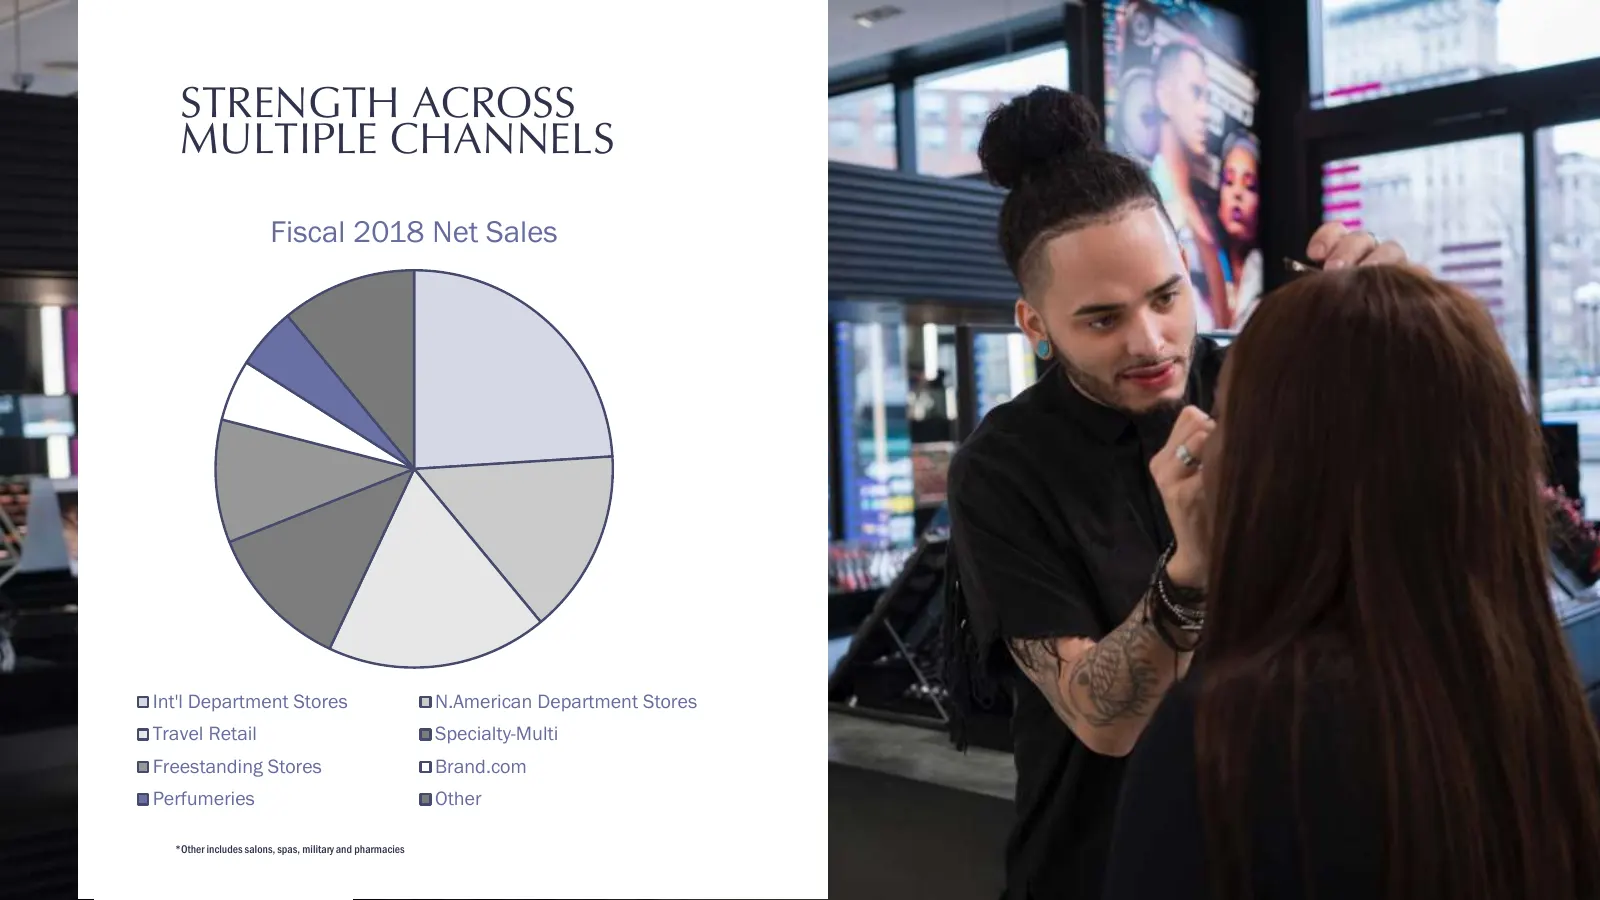
STRENGTH ACROSS MULTIPLE CHANNELS Fiscal 2018 Net Sales Int'l Department Stores N.American Department Stores Travel Retail Specialty-Multi Freestanding Stores Brand.com Perfumeries Other *Other includes salons, spas, military and pharmacies
Slide 49: Travel Retail
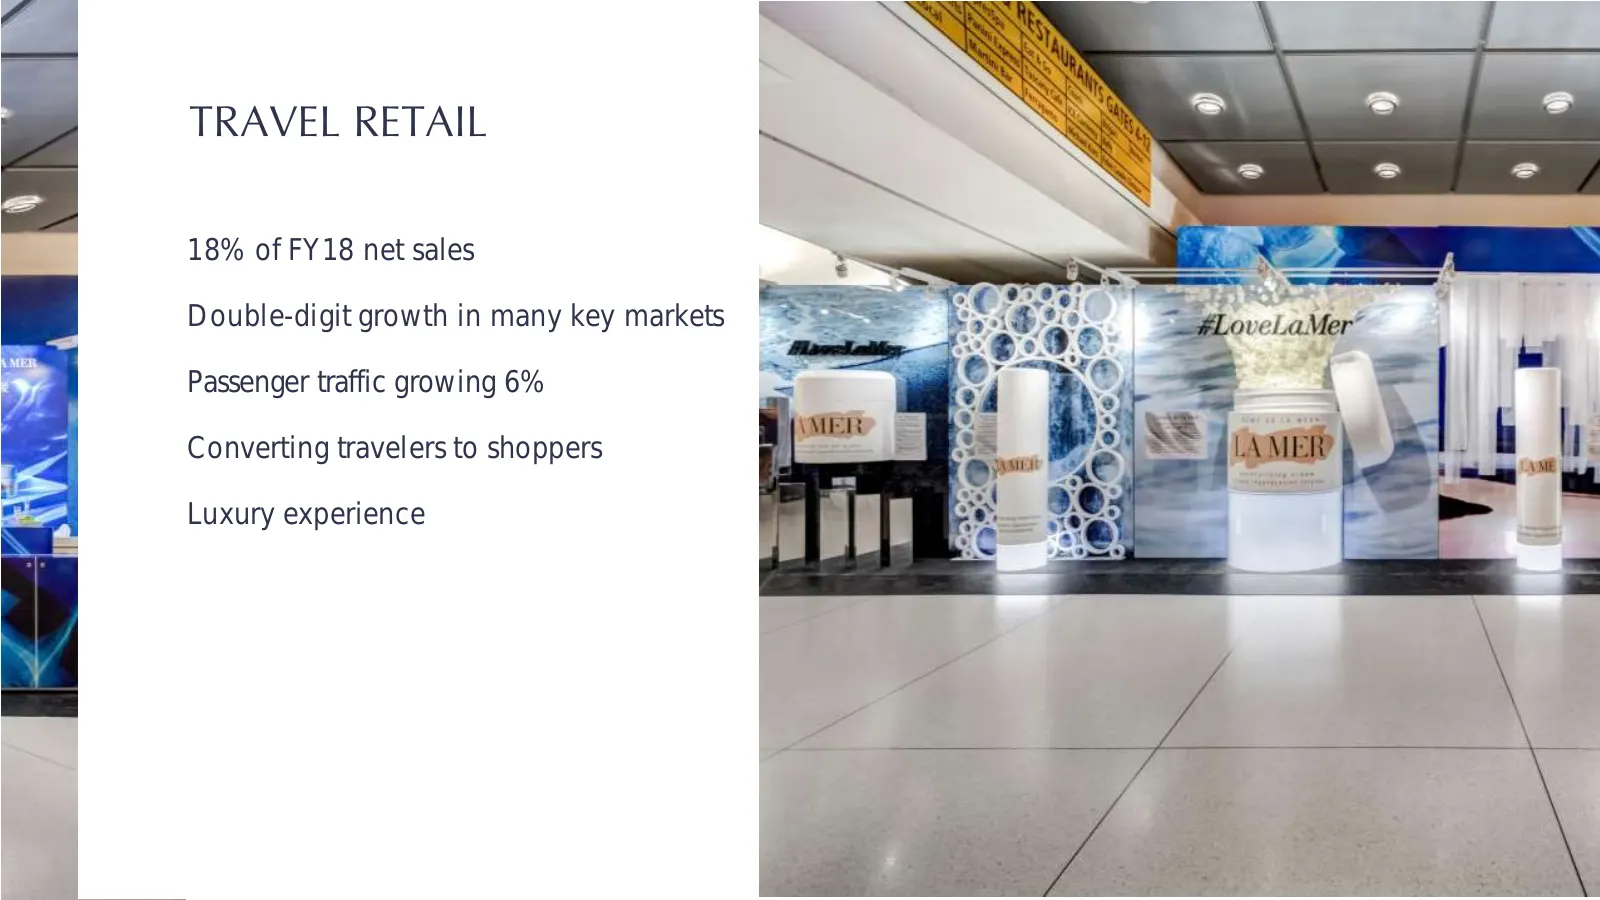
TRAVEL RETAIL 18% of FY18 net sales Double-digit growth in many key markets Passenger traffic growing 6% Converting travelers to shoppers Luxury experience
Slide 50: Specialty-Multi Retail: MAC in Ulta, Davenport Iowa
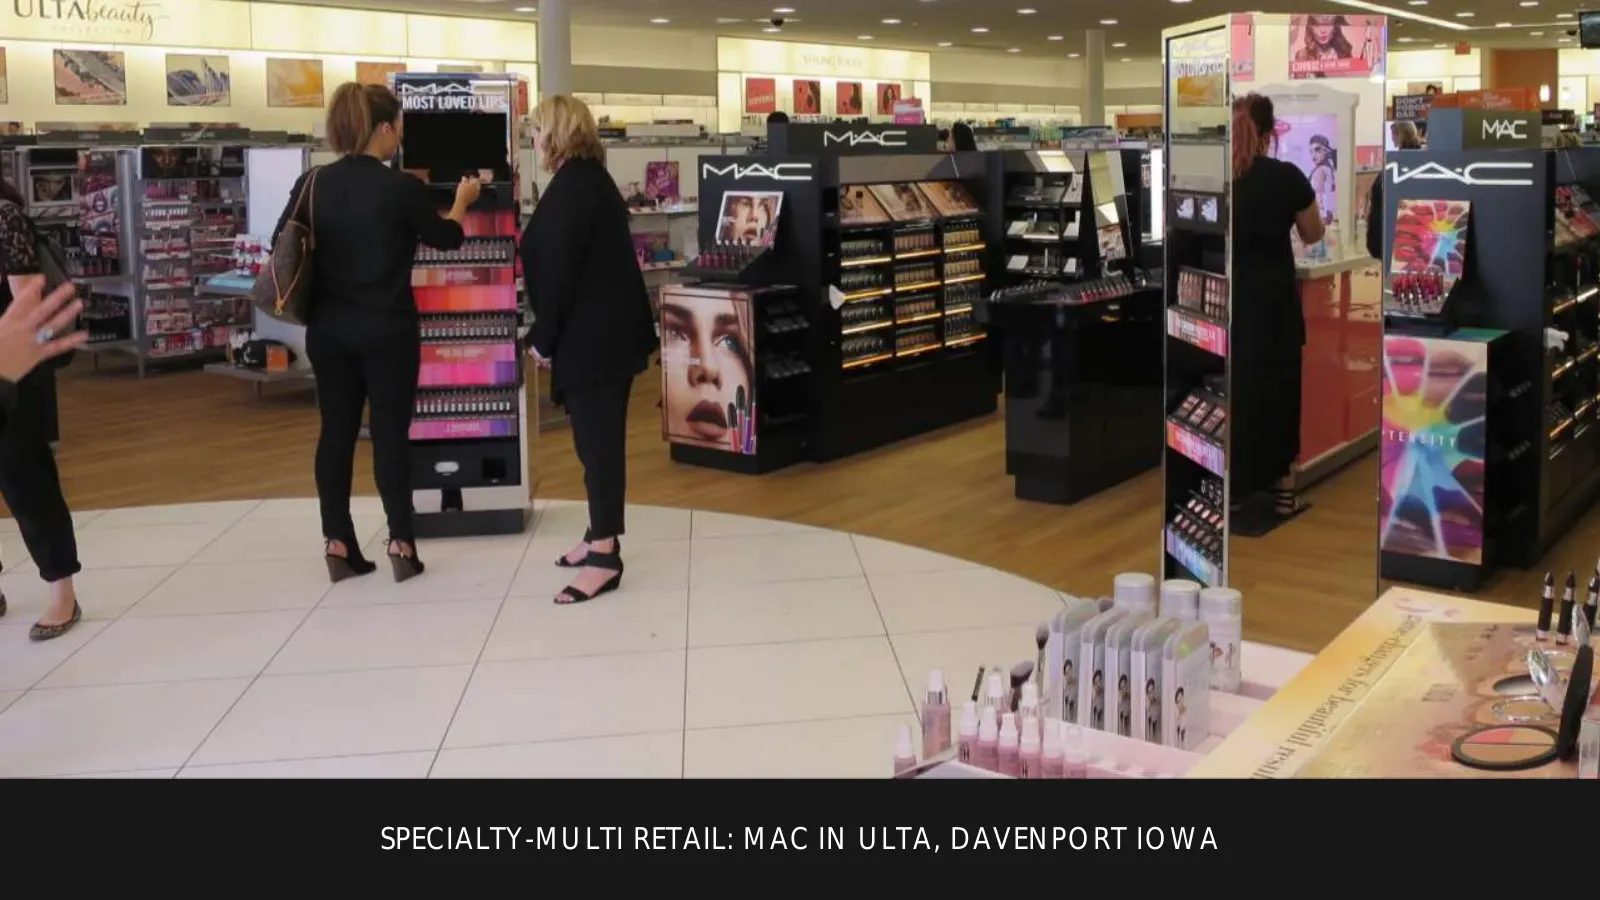
SPECIALTY-MULTI RETAIL: MAC IN ULTA, DAVENPORT IOWA
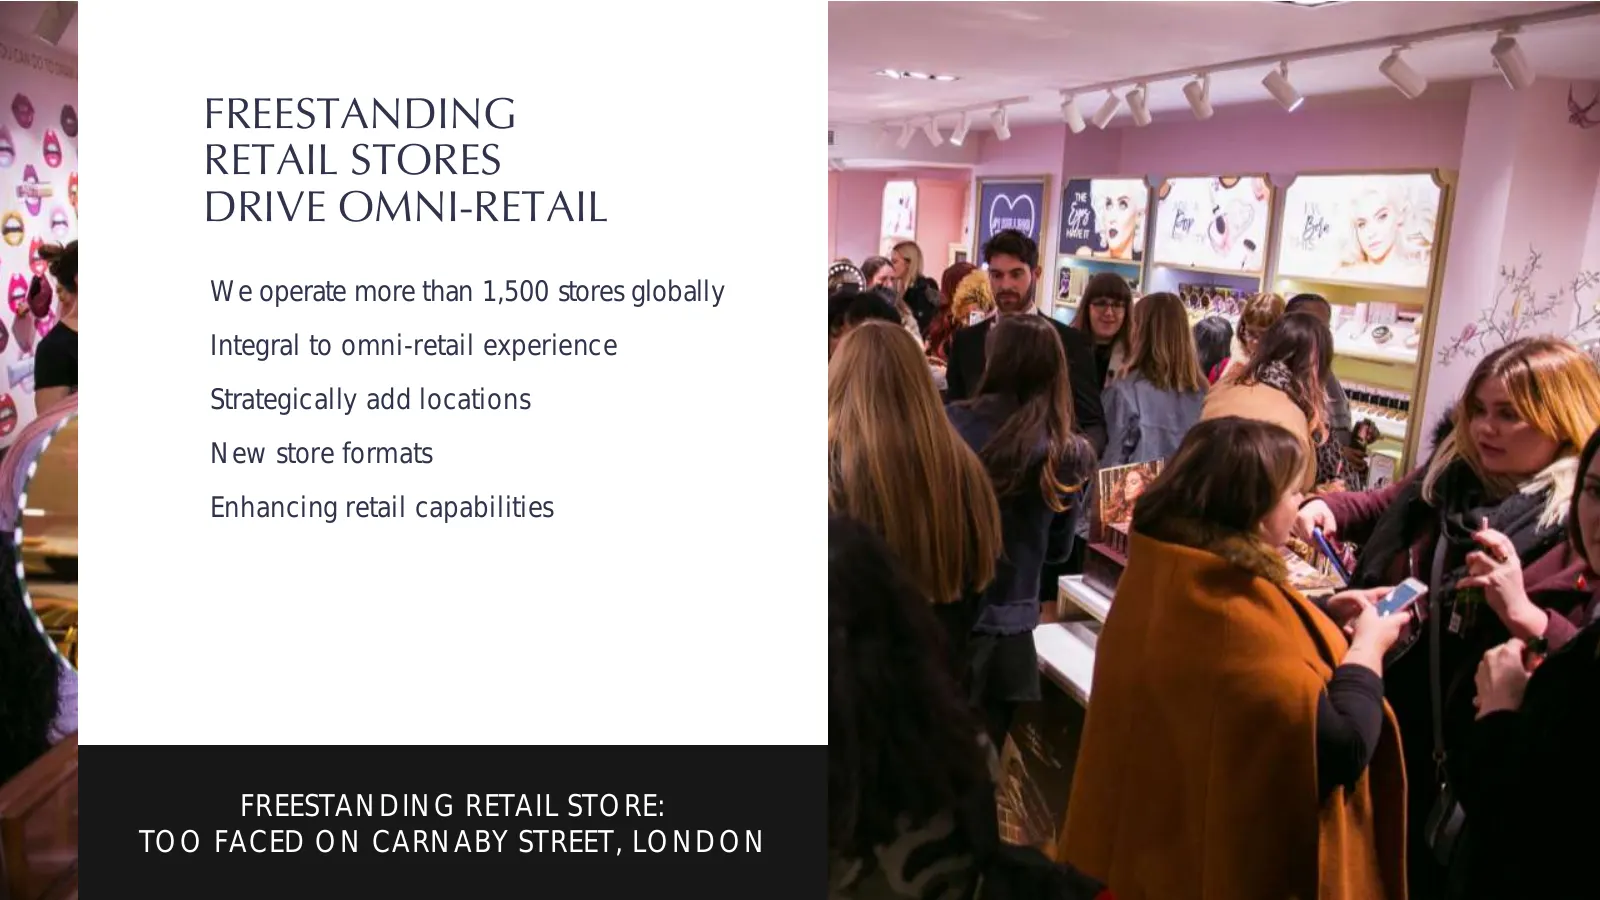
Slide 51: Freestanding Retail Stores Drive Omni-Retail
FREESTANDING RETAIL STORES DRIVE OMNI-RETAIL We operate more than 1,500 stores globally Integral to omni-retail experience Strategically add locations New store formats Enhancing retail capabilities FREESTANDING RETAIL STORE: TOO FACED ON CARNABY STREET, LONDON
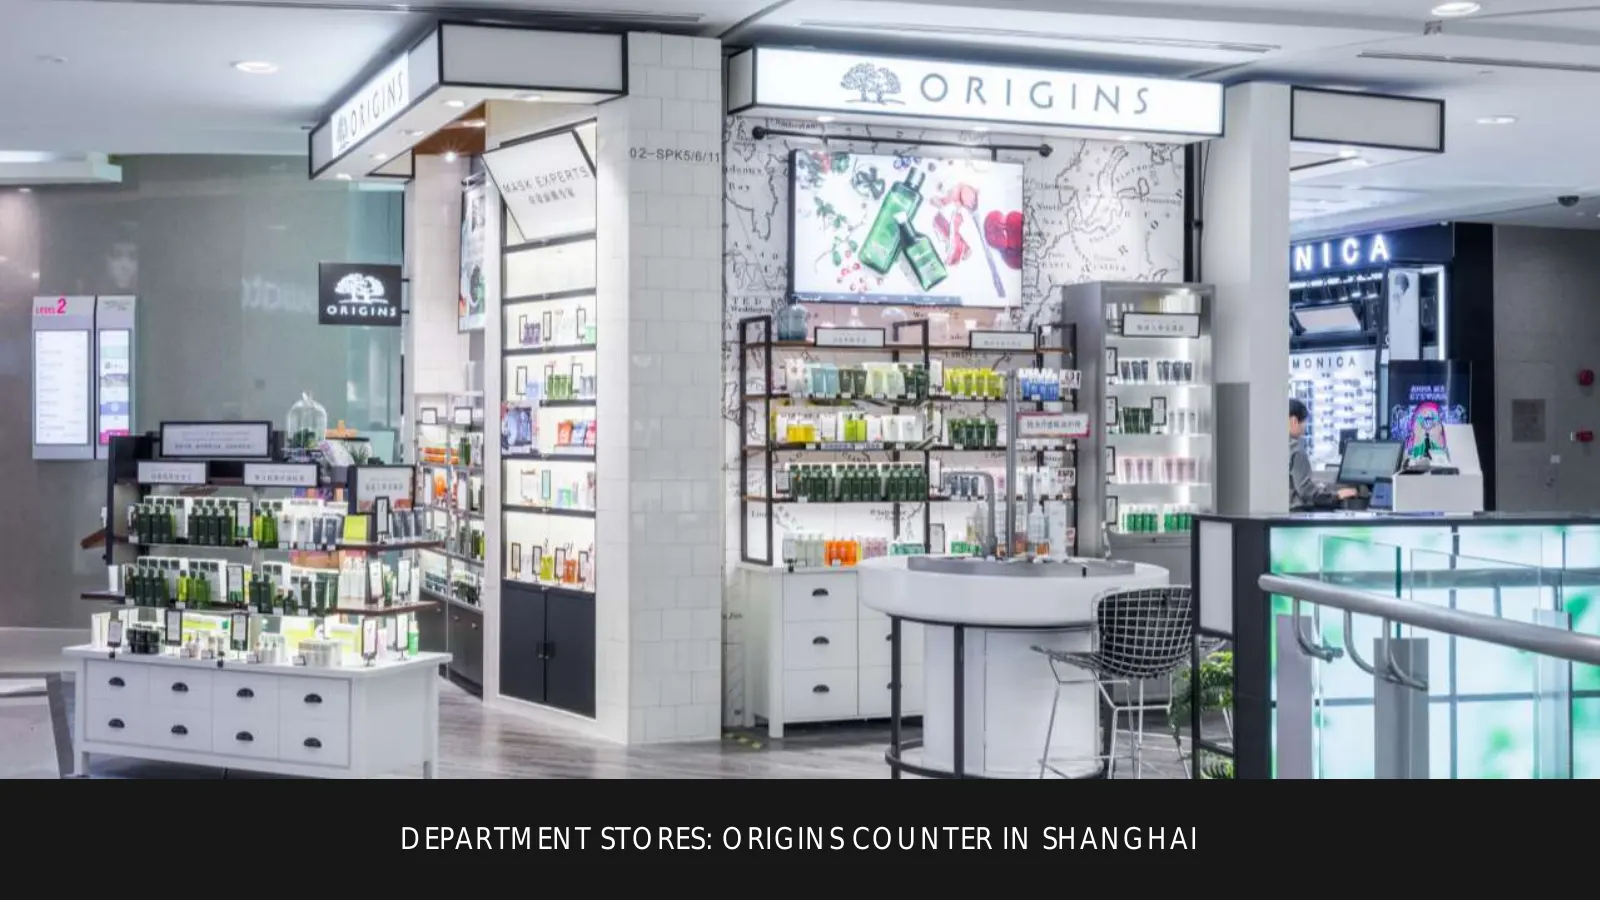
Slide 52: Department Stores: Origins Counter in Shanghai
DEPARTMENT STORES: ORIGINS COUNTER IN SHANGHAI
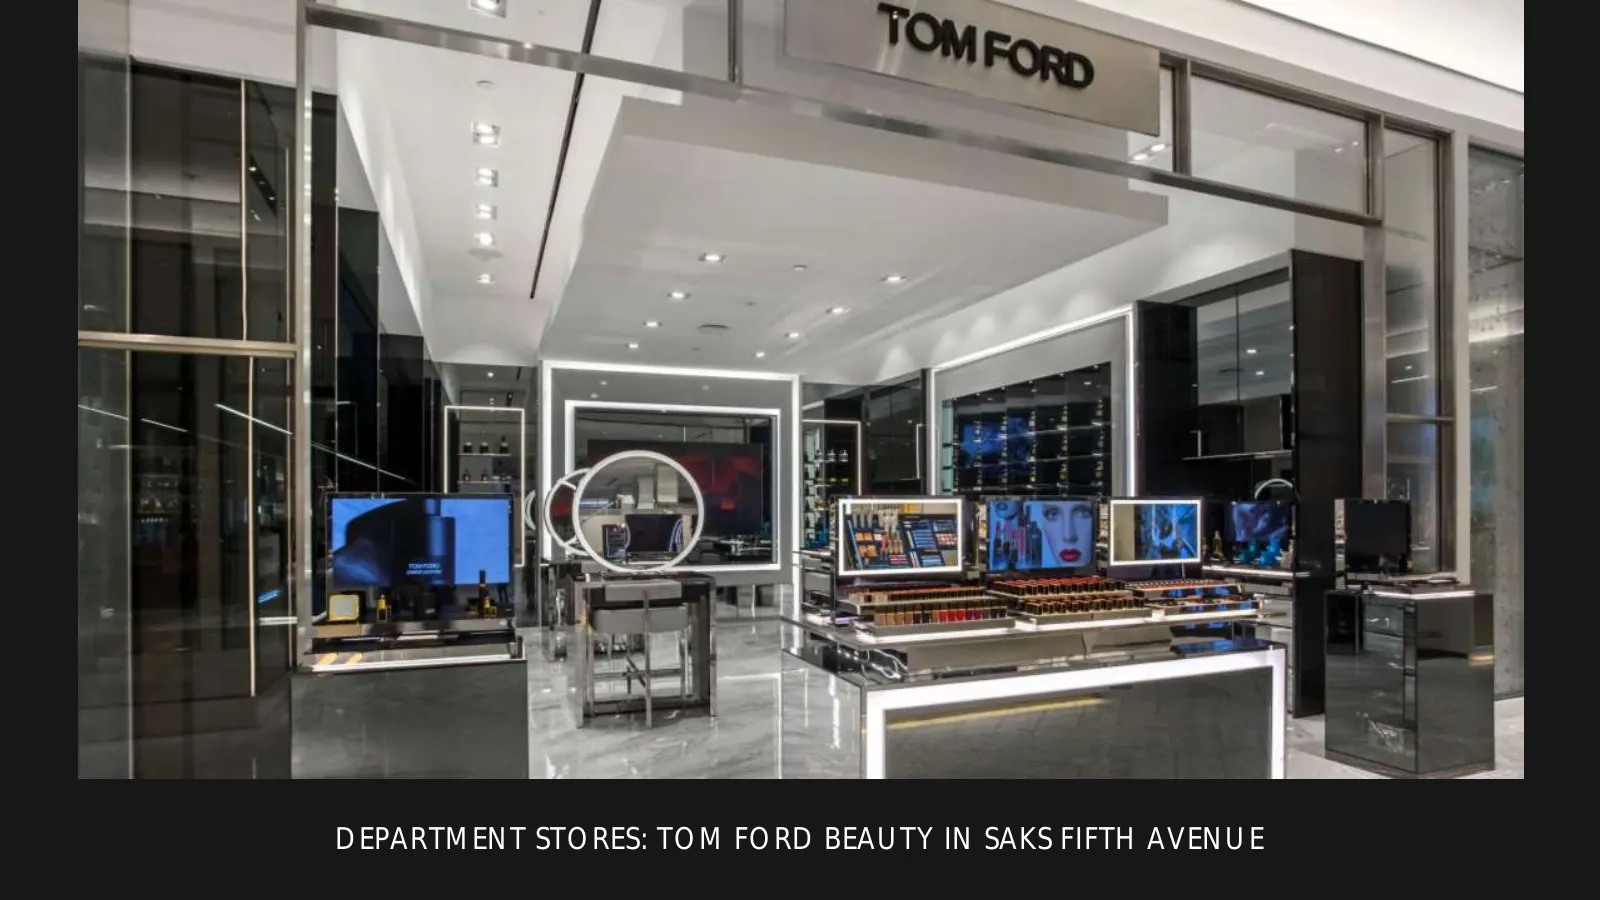
Slide 53: Department Stores: Tom Ford Beauty in Saks Fifth Avenue
DEPARTMENT STORES: TOM FORD BEAUTY IN SAKS FIFTH AVENUE
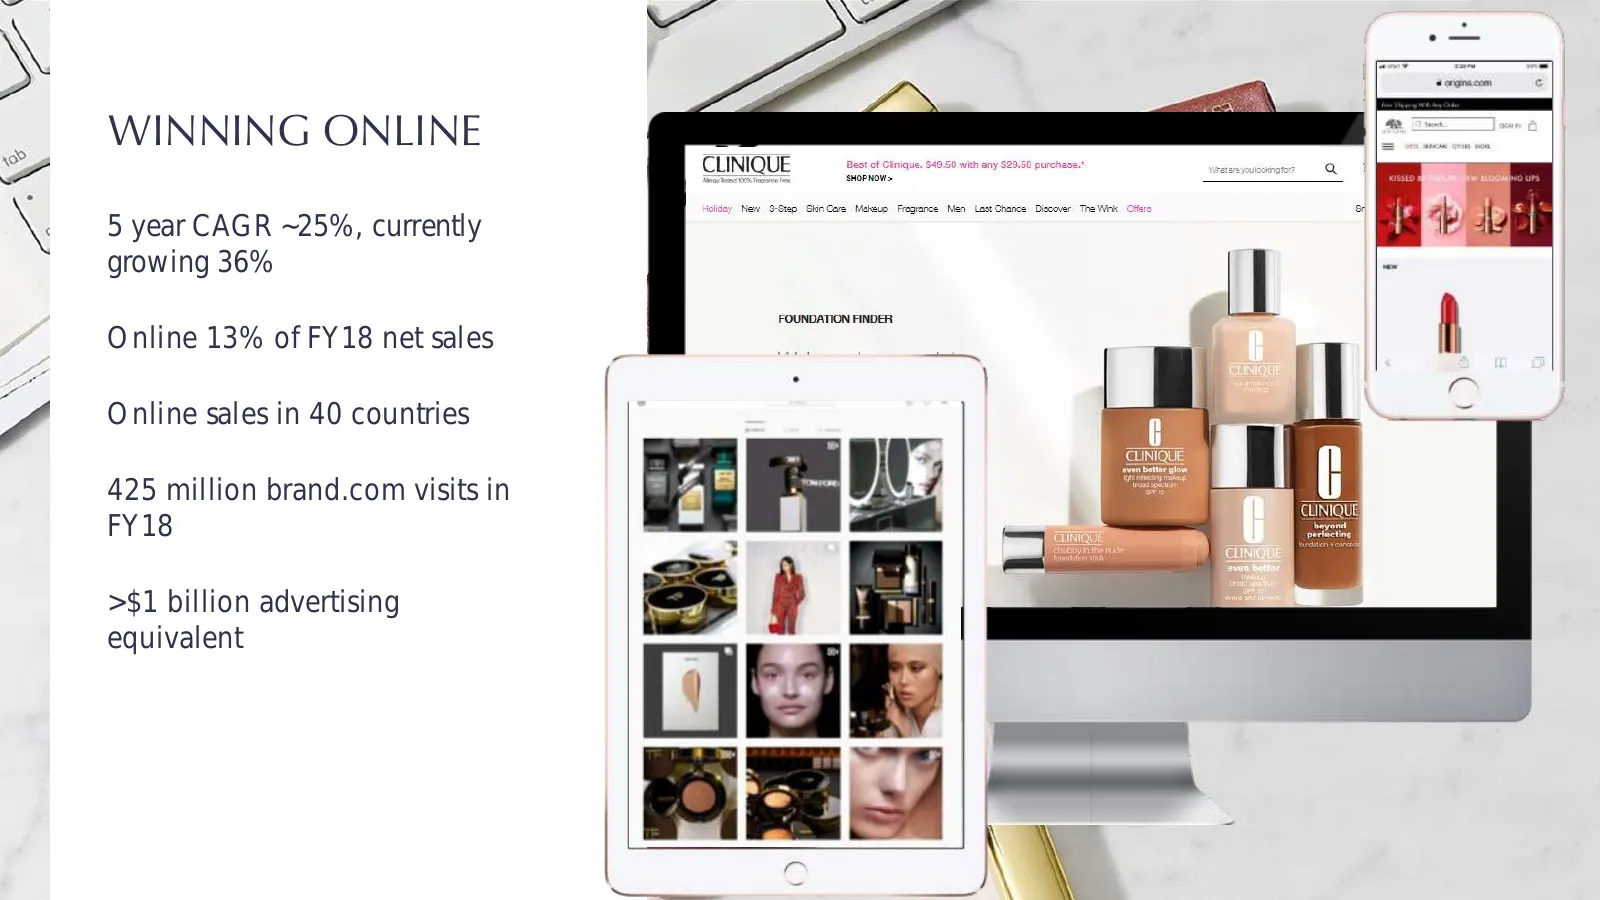
Slide 54: Winning Online
WINNING ONLINE 5 year CAGR ~25%, currently growing 36% Online 13% of FY18 net sales Online sales in 40 countries 425 million brand.com visits in FY18 >$1 billion advertising equivalent
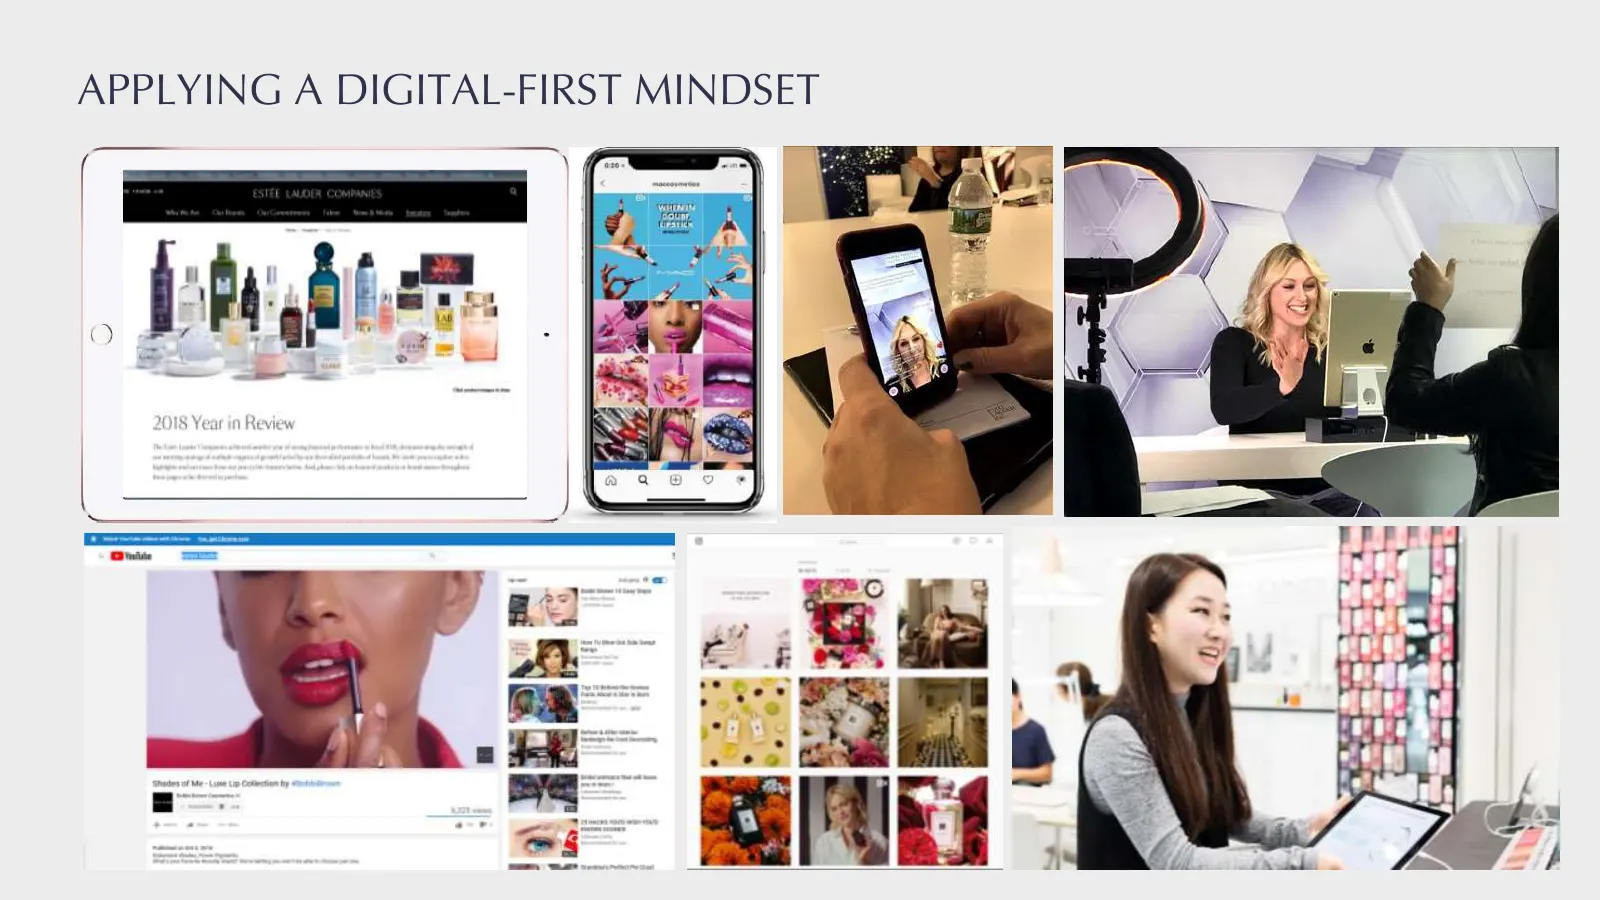
Slide 55: Applying a Digital-First Mindset
APPLYING A DIGITAL-FIRST MINDSET

Slide 56: Creating Our Sustainable Future
CREATING OUR SUSTAINABLE FUTURE
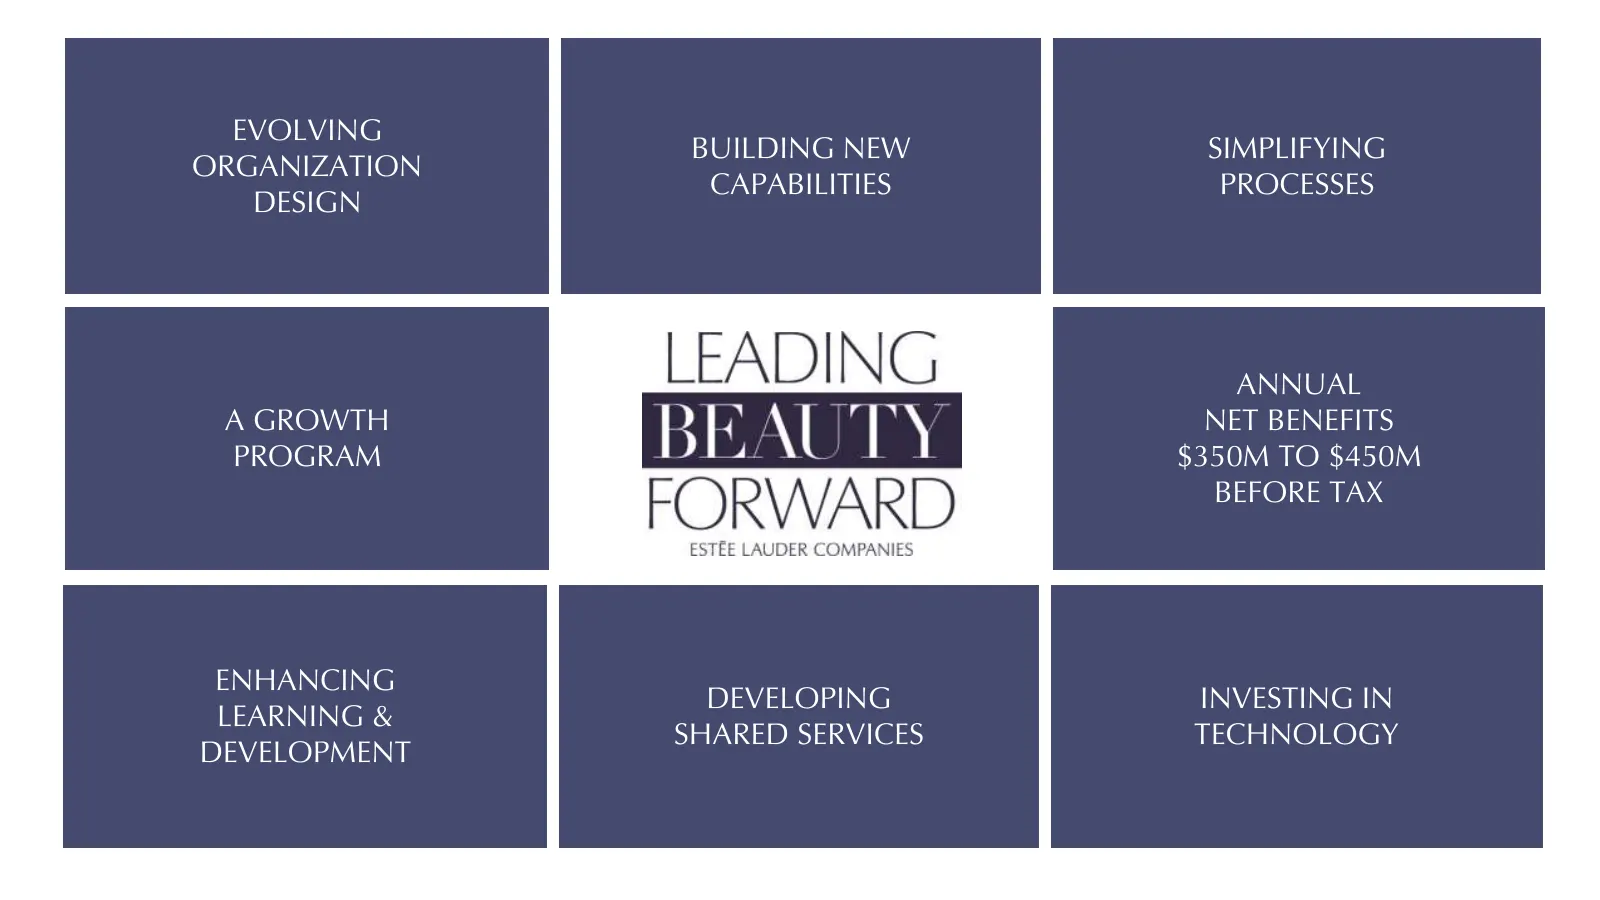
Slide 57: Evolving Organization Design
EVOLVING BUILDING NEW SIMPLIFYING ORGANIZATION CAPABILITIES PROCESSES DESIGN ANNUAL A GROWTH NET BENEFITS PROGRAM $350M TO $450M BEFORE TAX ENHANCING DEVELOPING INVESTING IN LEARNING & SHARED SERVICES TECHNOLOGY DEVELOPMENT
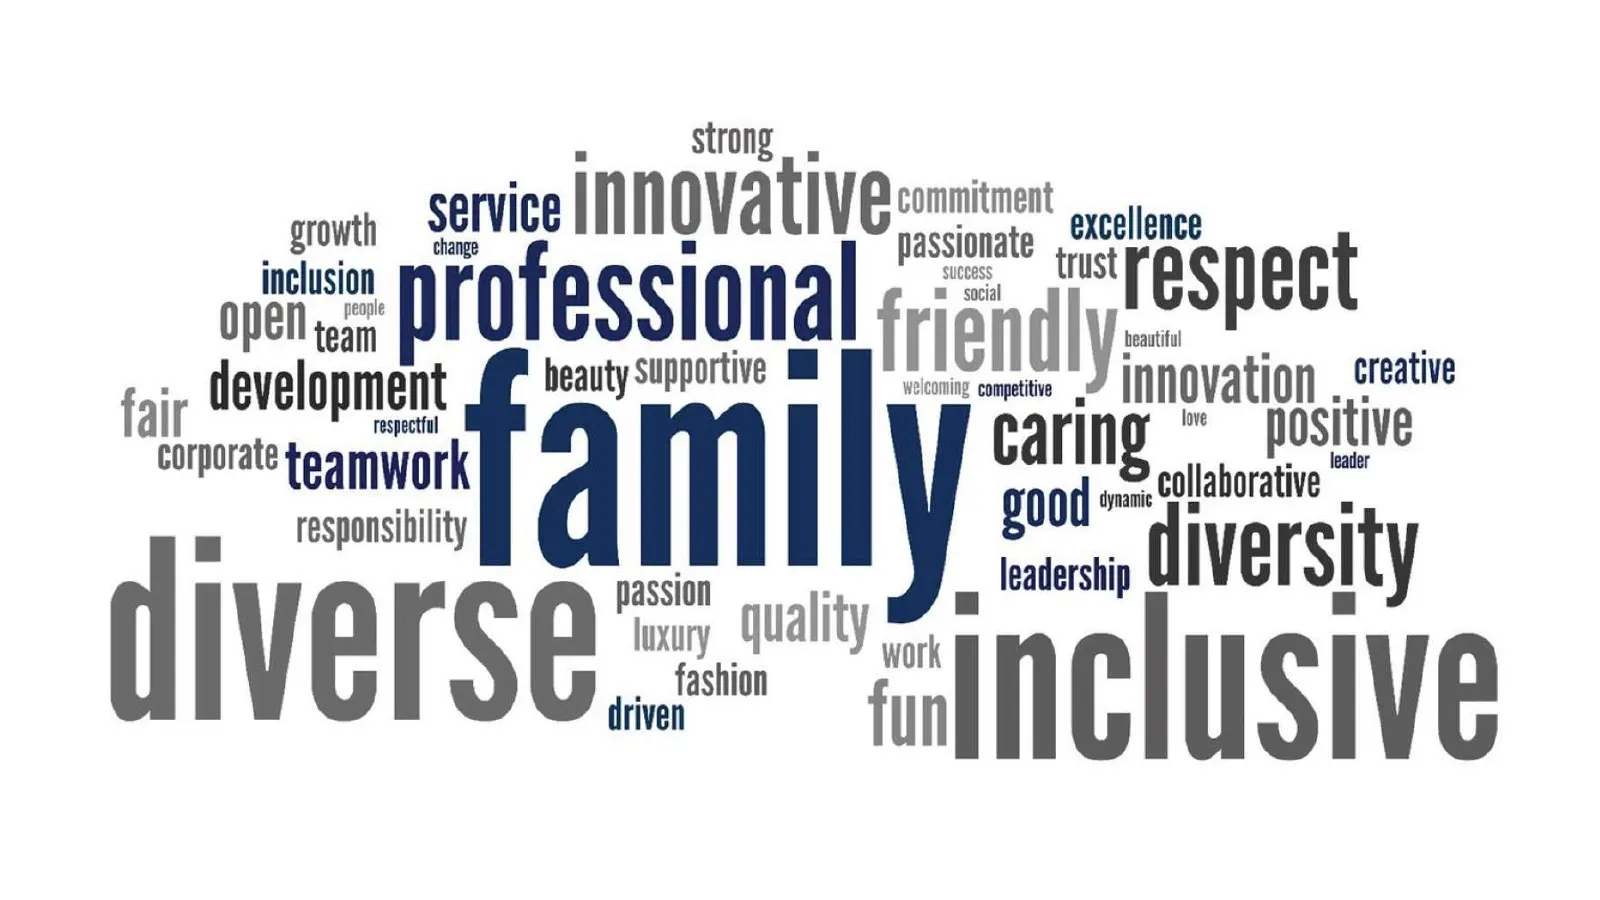
Slide 58: Our values and culture
strong growth rai | i il ovative commitment excellence passionate trust oes PrOfessional j;:nqiy Pee" beauty supportive tc innovation . creative fair pad caring “ positive collaborative = y corporate teamwork q tl ood * responsibilit a: aaa diversity if ive rse @™ quality © el ACIUSIVE

Slide 59: Introducing LinkedIn Learning
“unspiren BY ©: — EE ey Pine Bg : —o TAL) Us : —% pee eae Ly € uaa VIYINE OU'RE Gt extra ? a ‘AL 2017 we INTRODUCING LINKEDIN LEARNING (ORT ACCESS TO LEAINIDNO ON DEMAND TODAY
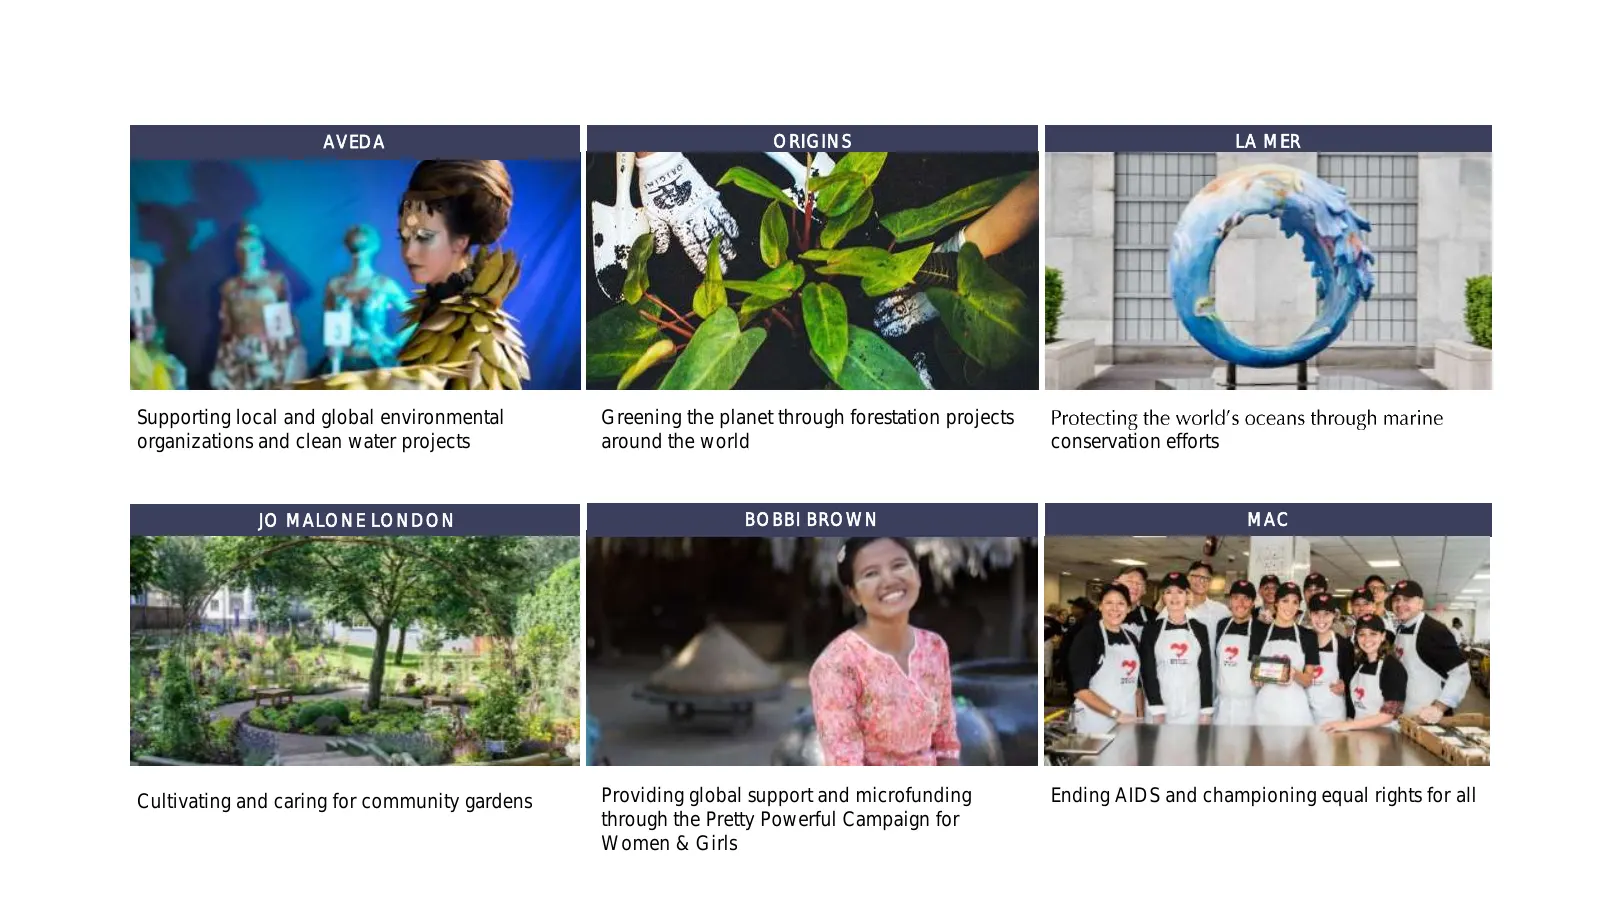
Slide 60: Brand community and environmental commitments
AVEDA ORIGINS LA MER Aveda Aveda Aveda Supporting local and global environmental Greening the planet through forestation projects organizations and clean water projects around the world conservation efforts JO MALONE LONDON BOBBI BROWN MAC Aveda Aveda Aveda Cultivating and caring for community garde

Slide 61: The Estée Lauder Companies
=, ’ ’ ESTEE. oLAU COMPAR ut ot

Slide 62: Appendix
APPENDIX
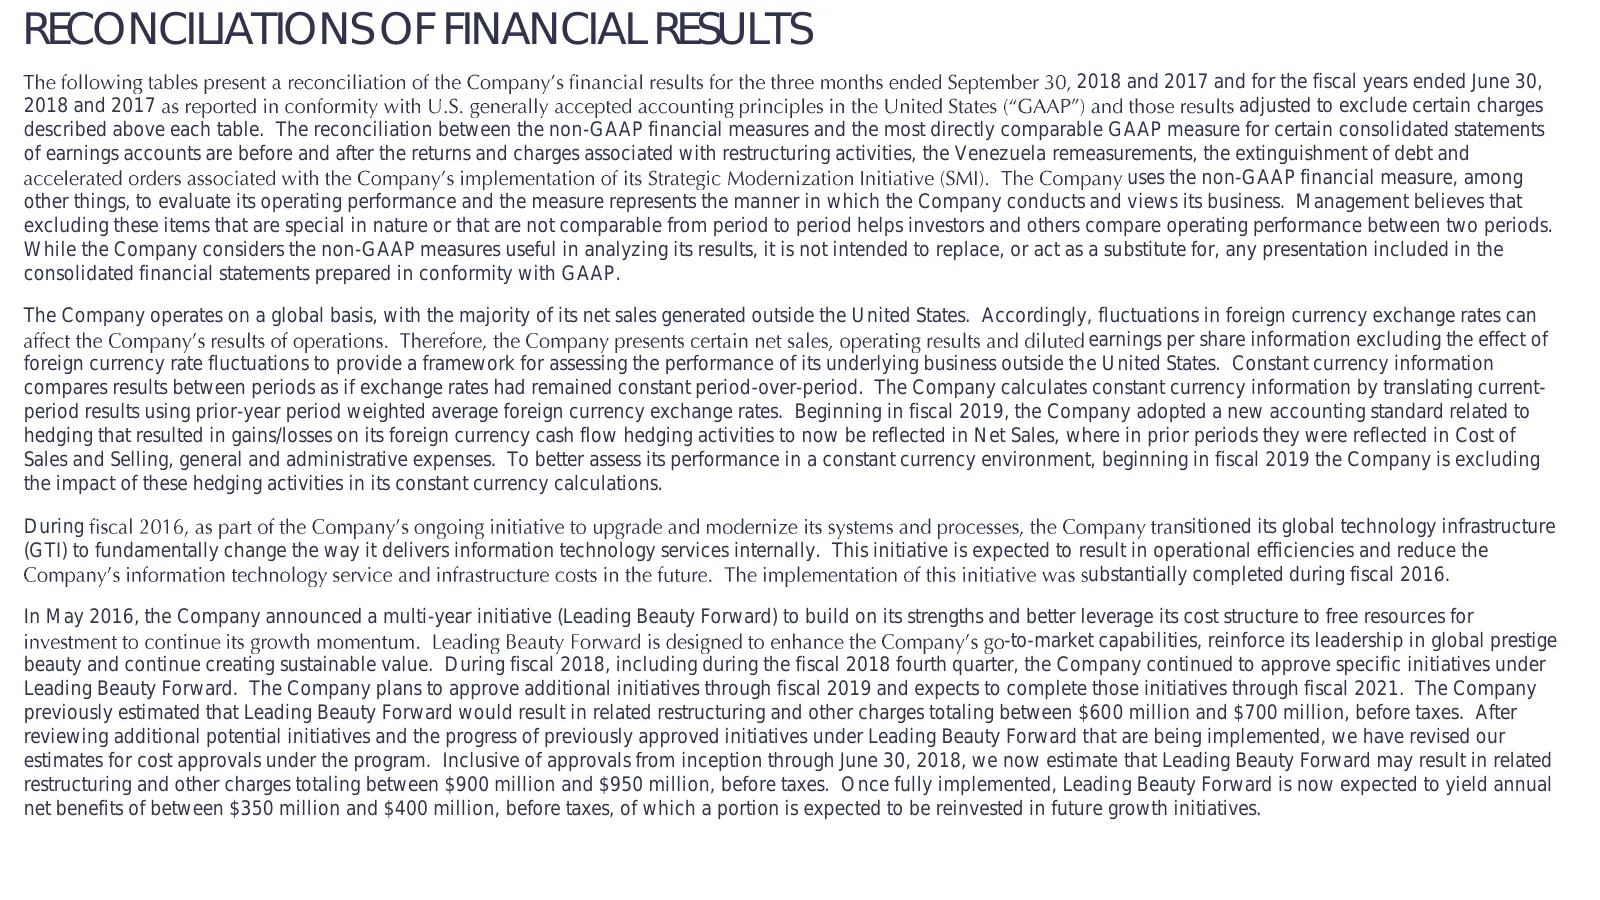
Slide 63: Reconciliations of Financial Results
RECONCILIATIONS OF FINANCIAL RESULTS 2018 and 2017 and for the fiscal years ended June 30, 2018 and 2017 adjusted to exclude certain charges described above each table. The reconciliation between the non-GAAP financial measures and the most directly comparable GAAP measure for certain consolidated s
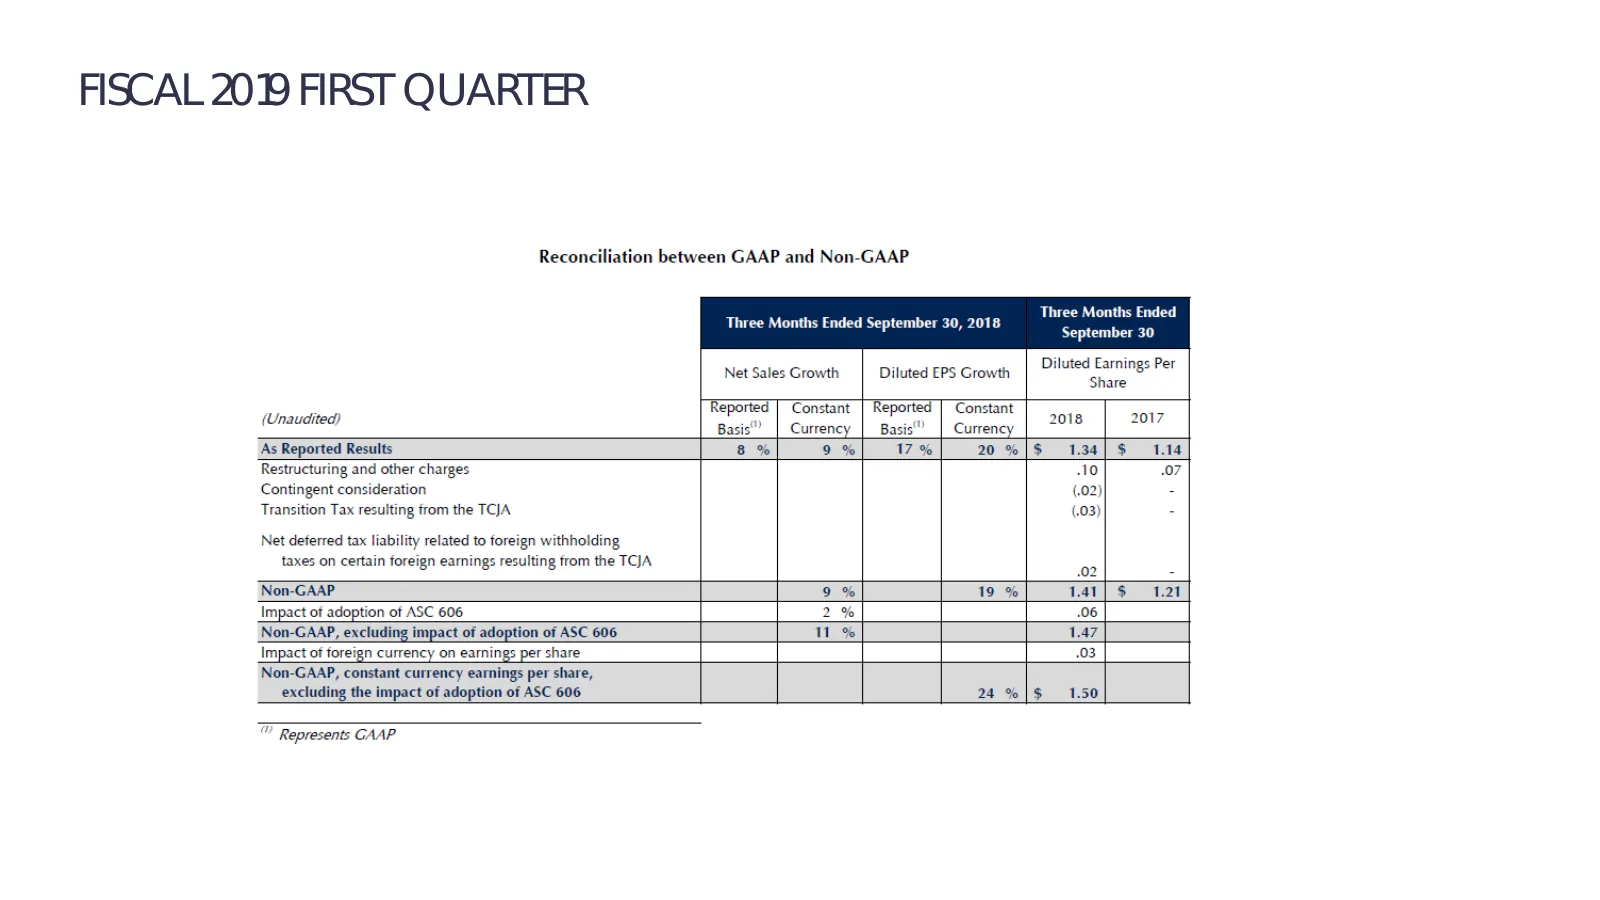
Slide 64: Fiscal 2019 First Quarter
FISCAL 20 FIRST QUARTER Reconciliation between GAAP and Non-GAAP Net Sales Growth | Diluted EPS Growth | Diluted Earnings Per Share (Unaudited) Constant | Reported | Constant [0,5 2017 Currency |_Basis”_|_ Currency ‘As Reported Results 3% oe) wel 2 %/s 134|$ 104 Restructuring and other charges “10 0
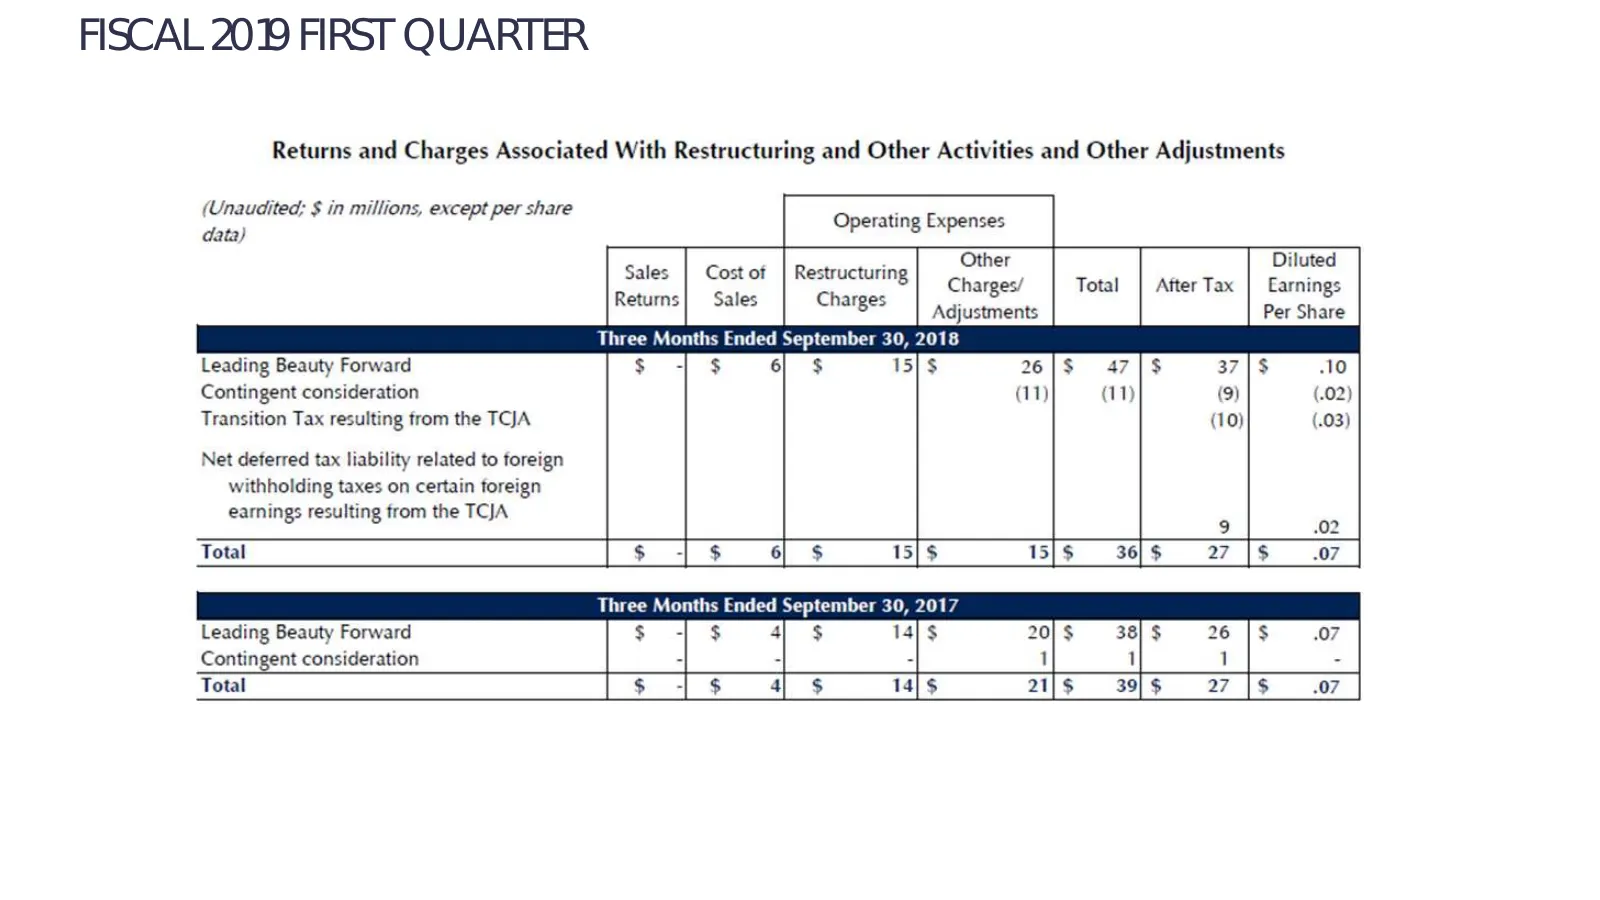
Slide 65: Fiscal 2019 First Quarter
FISCAL 20 FIRST QUARTER Returns and Charges Associated With Restructuring and Other Activities and Other Adjustments (Unaudited; $ in millions, except per share Operating Expenses data) A Other Diluted wae = aay ae Charges/ Total | After Tax | Earnings Adjustments Per Share Three Months Ended Septem
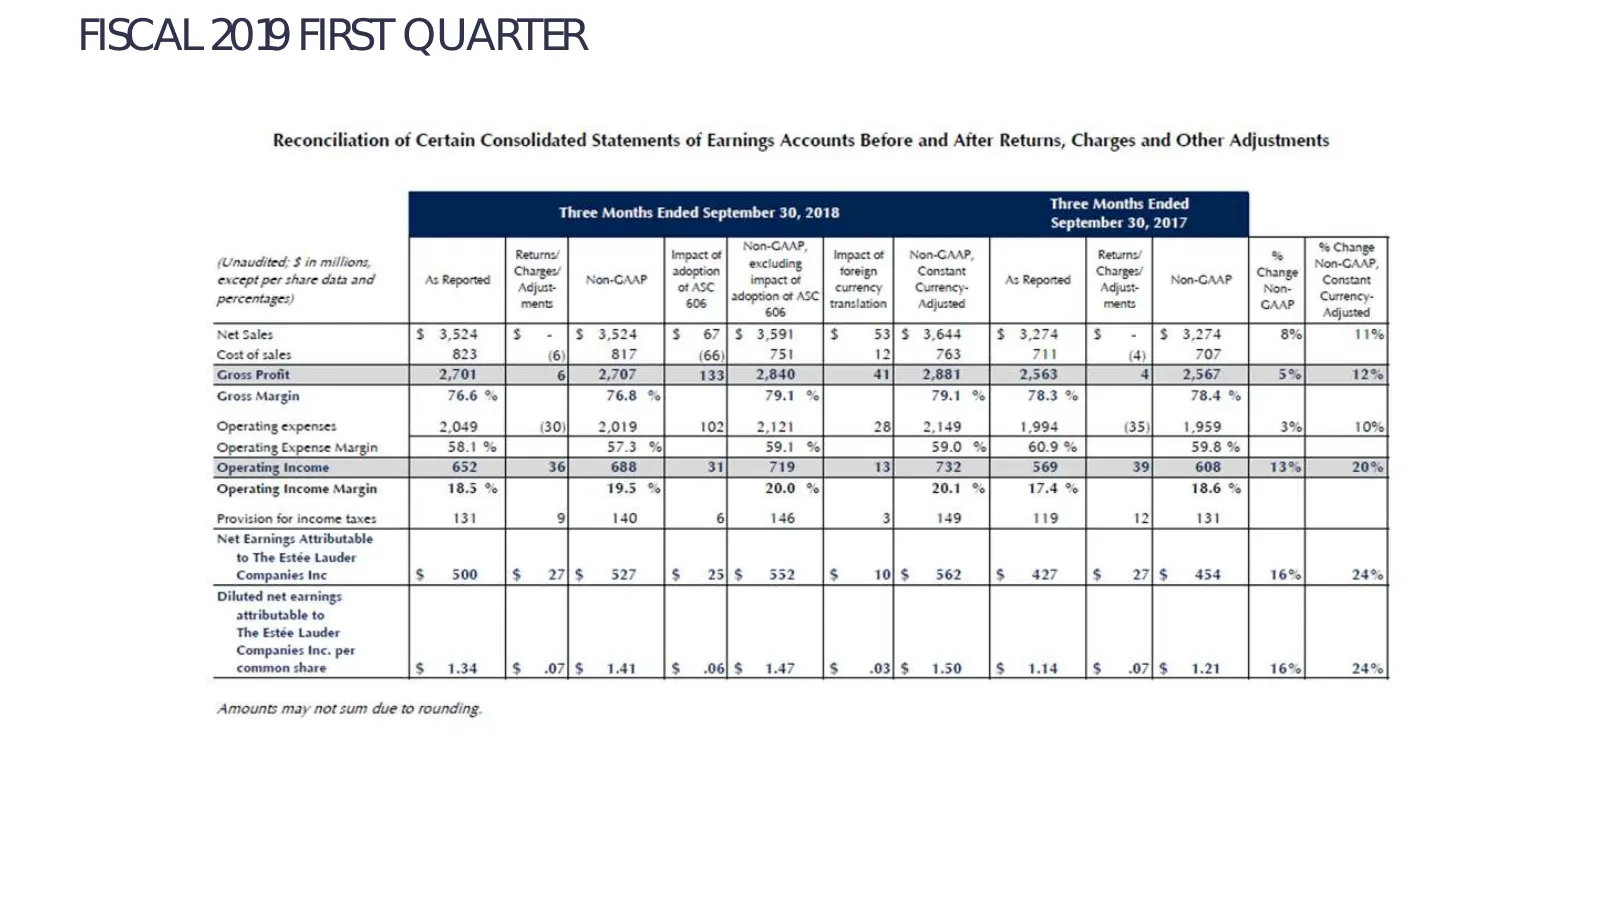
Slide 66: Fiscal 2019 First Quarter
FISCAL 20 FIRST QUARTER jation of Certain Consolidated Statements of Earnings Accounts Before and After Returns, Charges and Other Adjustments (Unauied:$ in milion eee! cnge | Nomen, except per share data and As Reported pred Non-GAAP Aes o— * urrency- percentages) ments oar | Game Net Sales $ 3524
Slide 67: Fiscal 2019 Second Quarter and Full Year Guidance
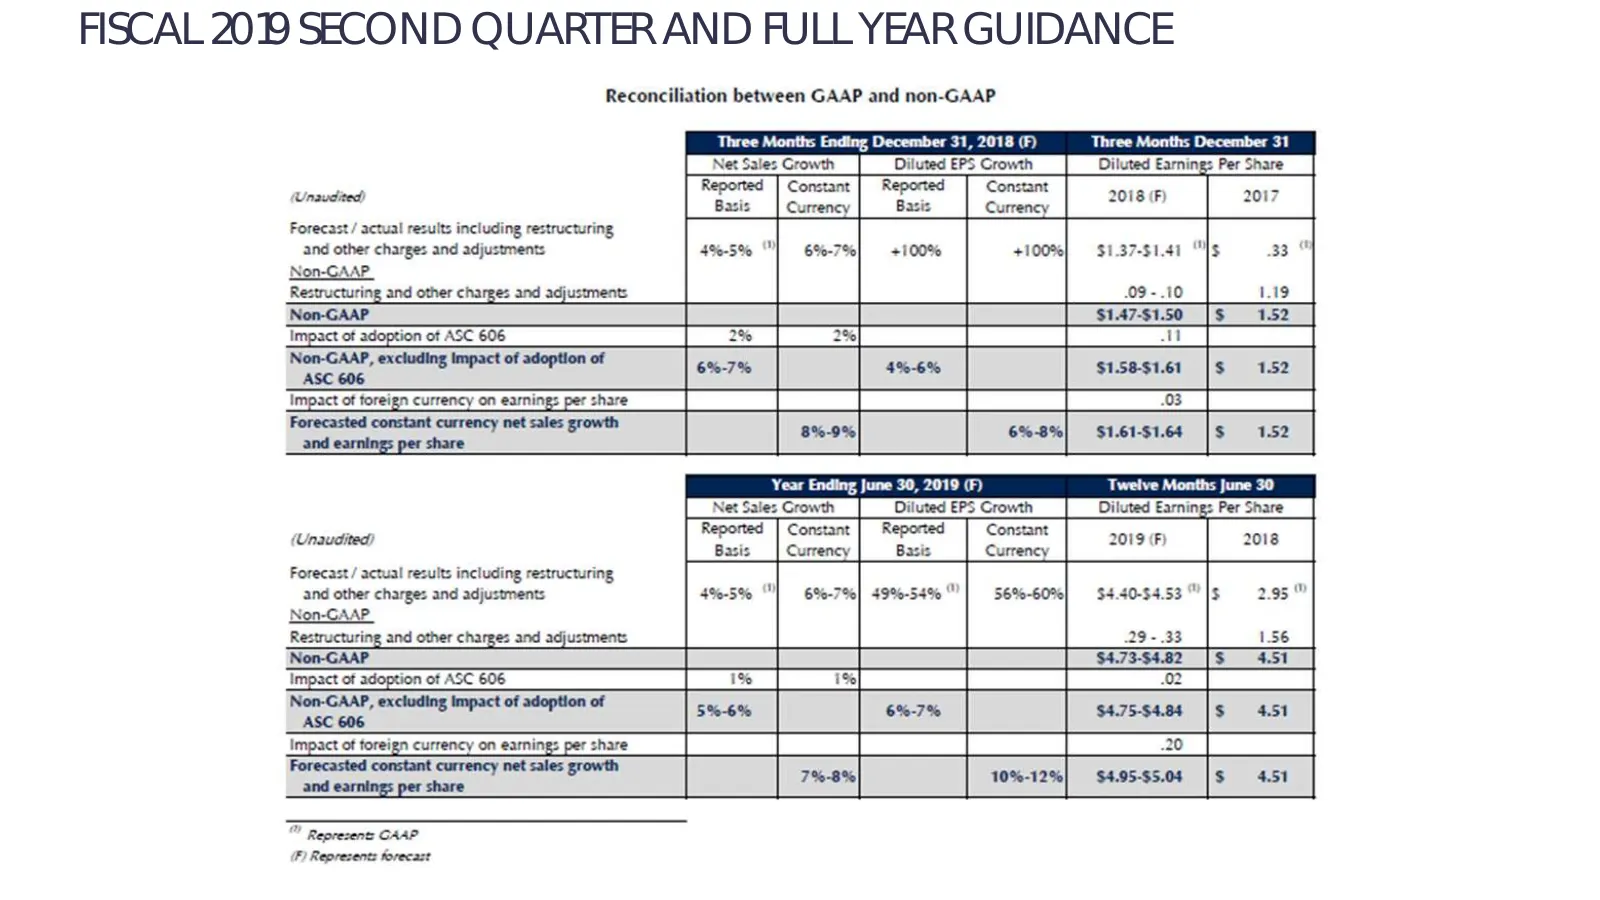
FISCAL 2019 SECOND QUARTER AND FULL YEAR GUIDANCE
Slide 68: Fiscal 2018
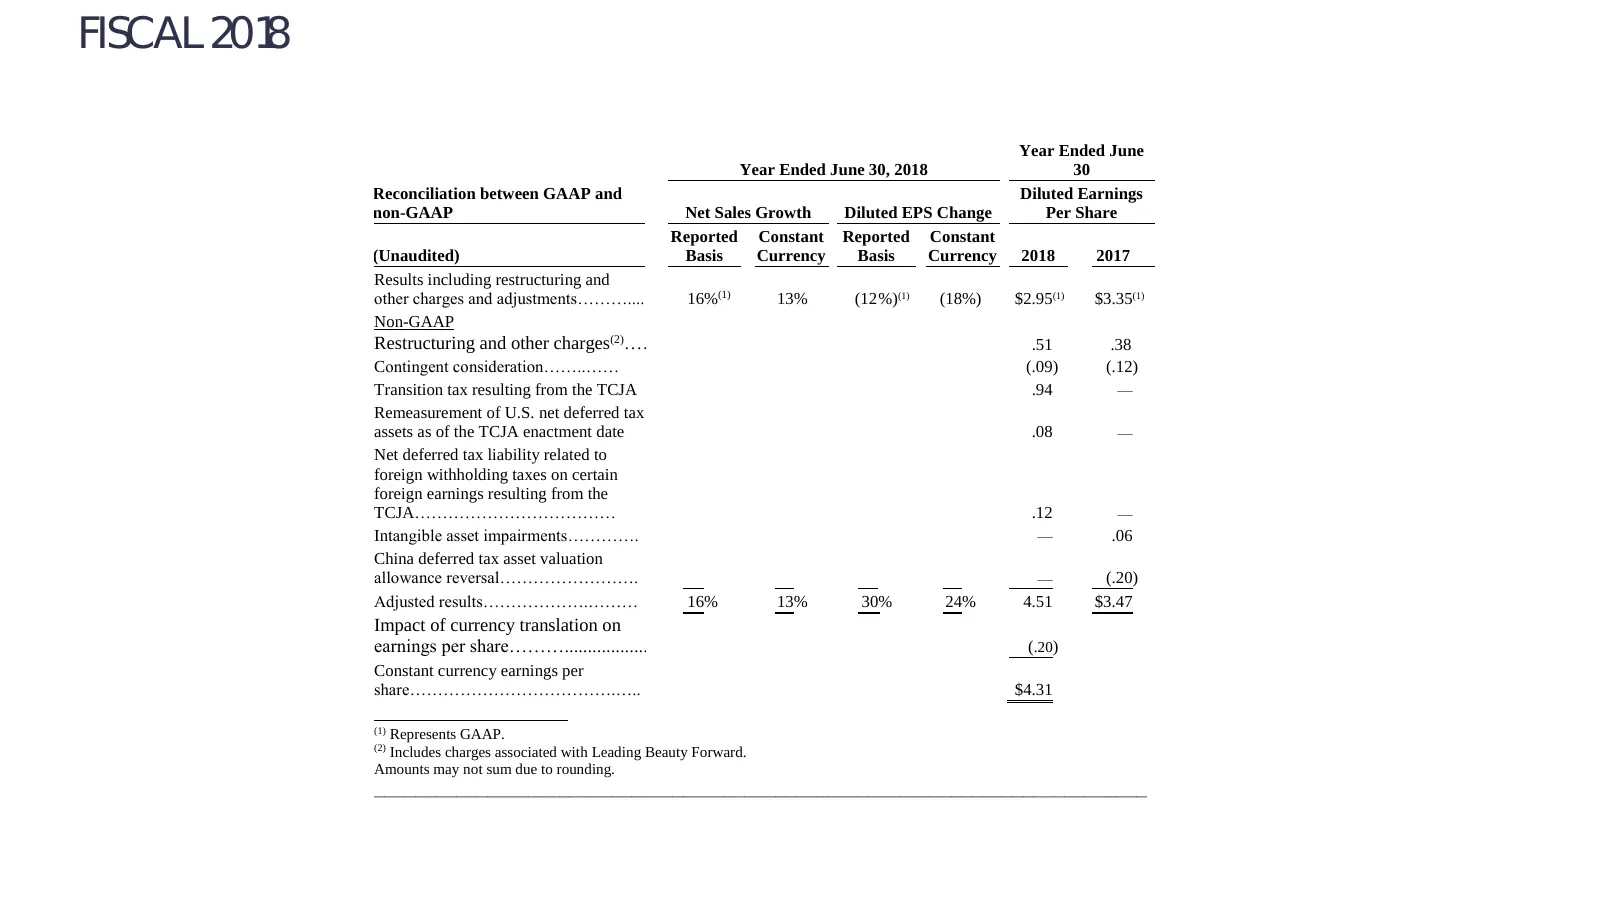
FISCAL 2018 Year Ended June Year Ended June 30, 2018 30 Reconciliation between GAAP and Diluted Earnings non-GAAP Net Sales Growth Diluted EPS Change Per Share Reported Constant Reported Constant (Unaudited) Basis Currency Basis Currency 2018 2017 Results including restructuring and other charges an
Slide 69: Fiscal 2018
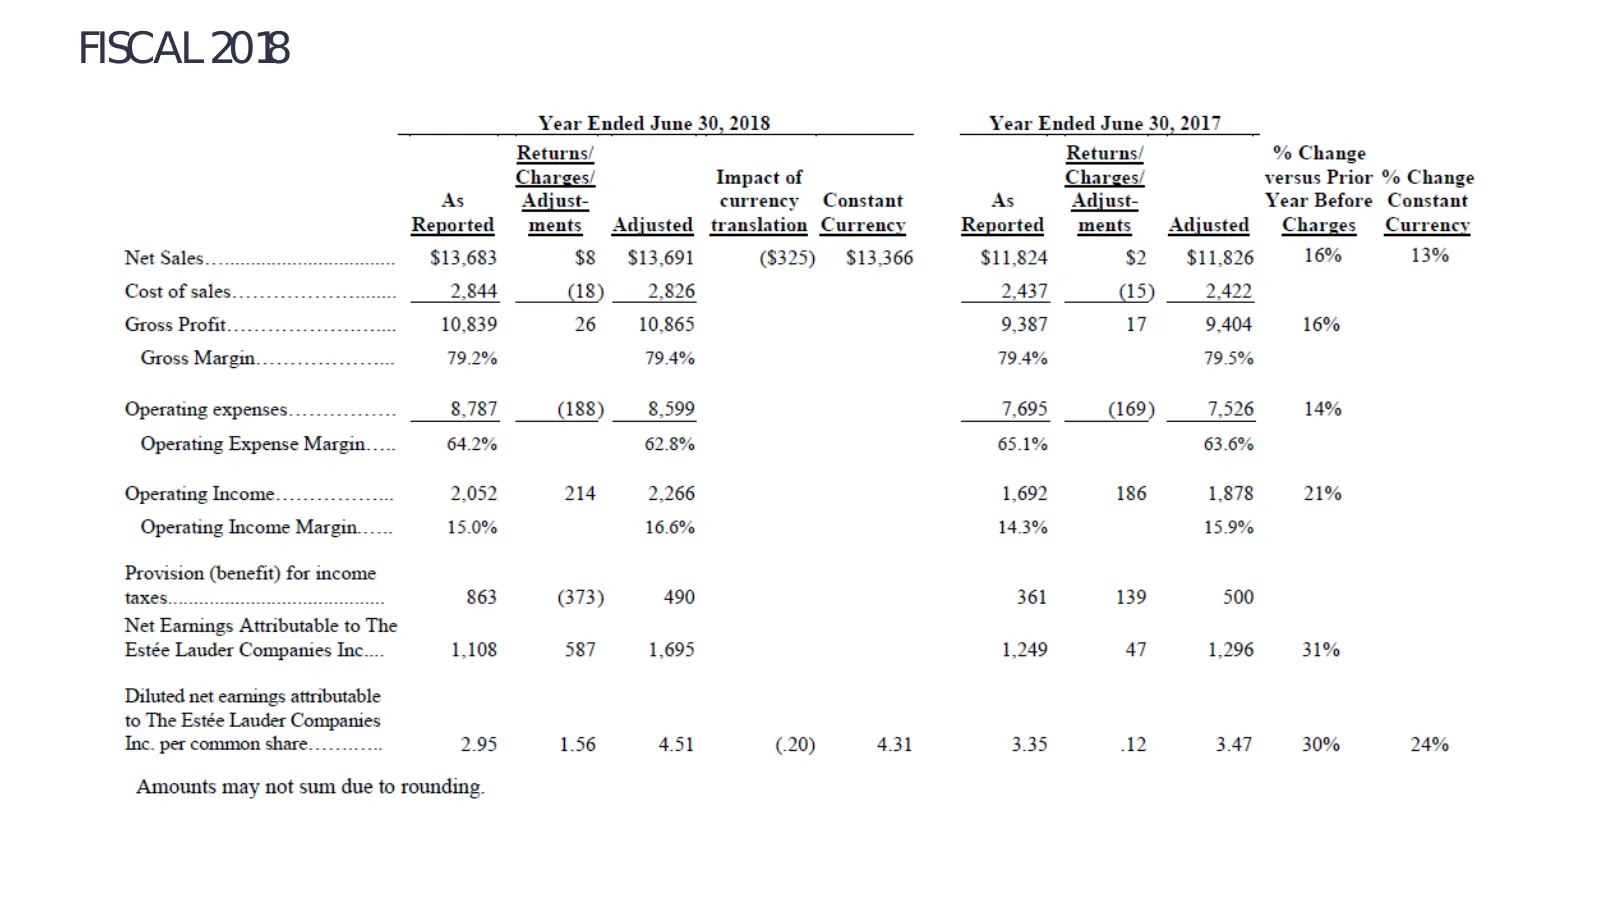
FISCAL 2038 Year Ended June 30, 2018 Year Ended June 30, 2017 Returns/ Returns/ % Change Charges/ Impact of Charges/ versus Prior % Change As Adjust- currency Constant As Adjust- Year Before Constant Reported ments Adjusted translation Currency Reported ments Adjusted Charges Currency Net Sales... $
Slide 70: Fiscal 2018
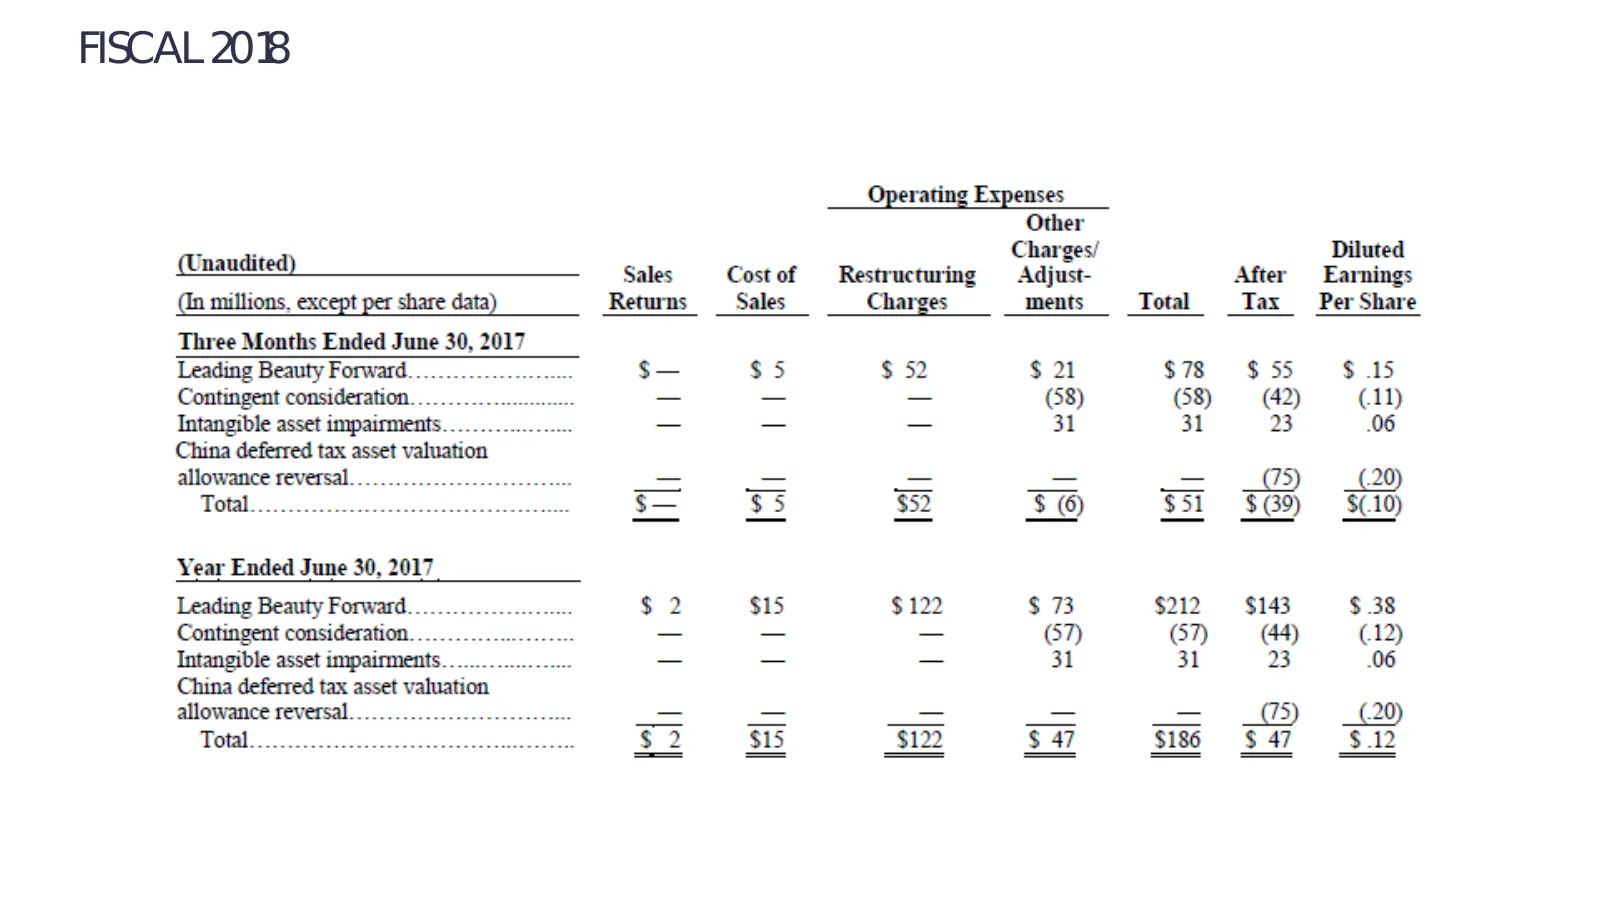
FISCAL 2038 ___ Operating Expenses __ Other . Charges! Diluted (Unaudited) Sales Costof Restructuring Adjust- After Earnings (in millions, except per share data) Returns Sales Charges ments Total Tax PerShare Three Months Ended June 30, 2017 $— $5 $ 52 $21 $78 $55 $15 _ _— _ (38) (58) (42) (11) _ _
Slide 71: Fiscal 2018
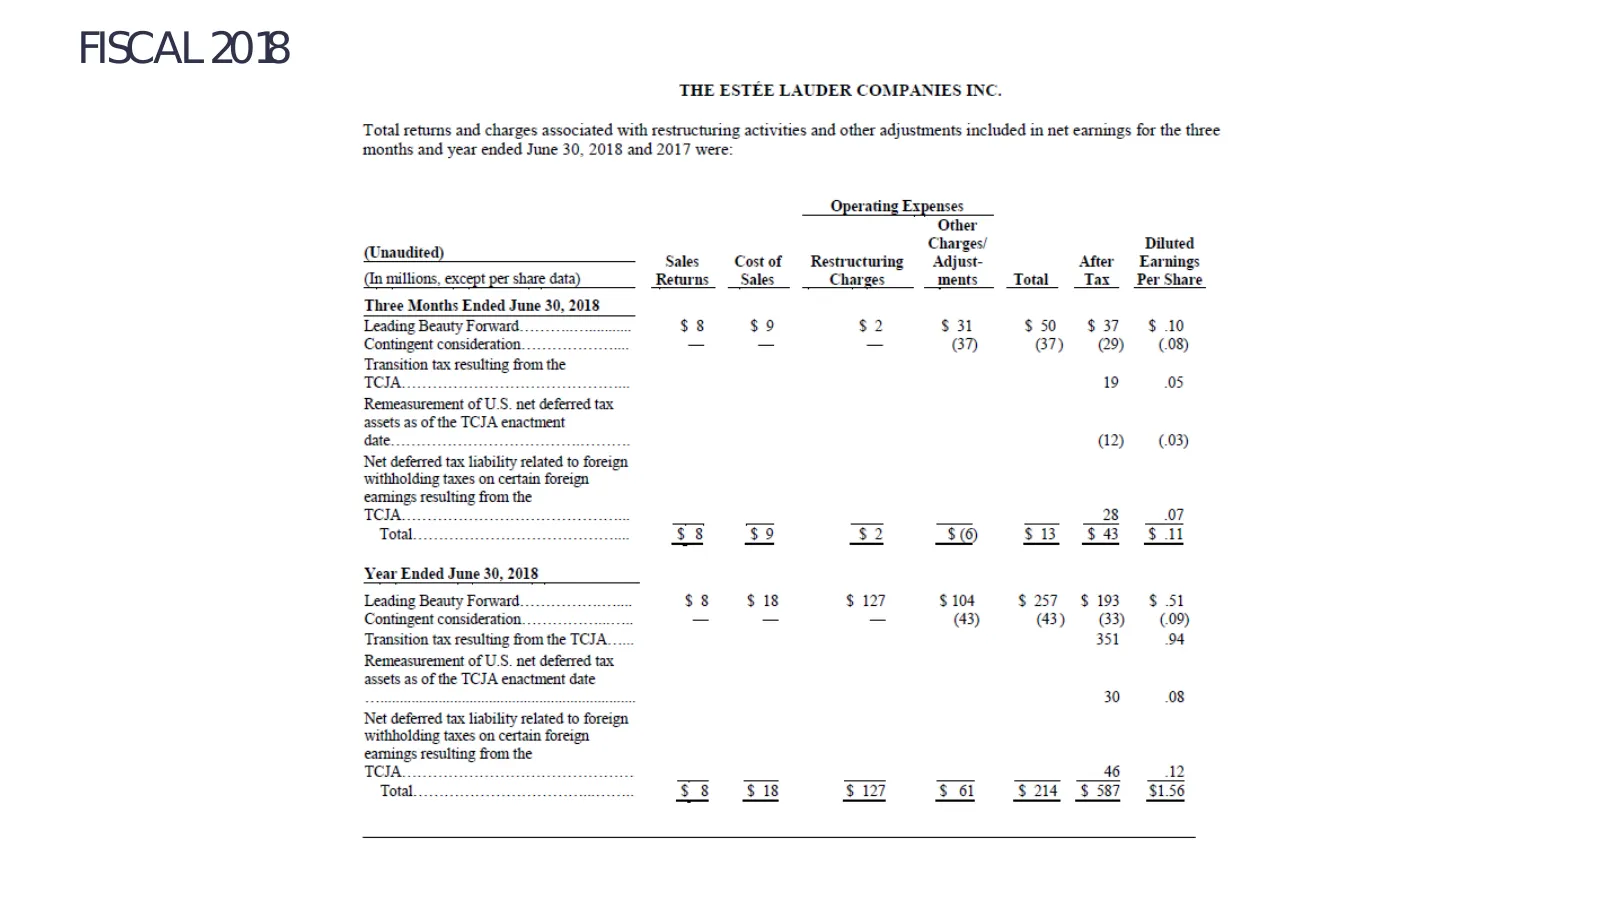
FISCAL 2038 THE ESTEE LAUDER COMPANIES INC. Total retums and charges associated with restructuring activities and other adjustments included in net earnings for the three months and year ended June 30, 2018 and 2017 were: Diluted After Earnings Total _Tax_ Per Share $ 50 $37 $ 10 G7) @9)— (08) co 19
Source: company website
More decks from Estee Lauder Companies, Inc. (the)
 The Estée Lauder Companies — Investor Day (2026)24 slides · Nov 6, 2026
 The Estée Lauder Companies — Corporate Update (2026)8 slides · Nov 6, 2026
 The Estée Lauder Companies — Corporate Update (2026)7 slides · Nov 6, 2026
 The Estée Lauder Companies — Corporate Update (2026)6 slides · Nov 6, 2026
 The Estée Lauder Companies — Corporate Update (2026)6 slides · Nov 6, 2026
 The Estée Lauder Companies — Investor Day (2026)6 slides · Nov 6, 2026