INX — Q4 2008 Earnings Presentation
28 slides from INX's earnings presentation, Mar 5, 2009
Slide 1: Investor Call: Financial Results - 4th Quarter and Year Ended December 31, 2008
March 5, 2009 Investor Call Financial Results - 4th Quarter and Year Ended December 31, 2008 Agenda: 1. Brian Fontana: Present results for the quarter and year and discussion of certain financial trends, balance sheet and liquidity 2. Mark Hilz: Brief update on the evolution of our vision, our curre
Slide 2: GAAP Reconciliation and Forward-Looking Statements
GAAP Reconciliation and 2 Forward-Looking Statements GAAP Reconciliation During this presentation references to financial measures of INX will include references to non -GAAP financial measures. INX provides a reconciliation between GAAP and non-GAAP financial information within this presentation an
Slide 3: 2008 Accomplishments
2008 Accomplishments 3 Record revenue of $259.2 million, an increase of 24.6%, with 15.5% organic growth excluding the impact of acquisitions in economic recession conditions Services revenue growth of 50%, with service revenue mix increasing to 18% from 13% Managed services revenue growth of 44% Da
Slide 4: 4th Quarter & 2008 Full Year Financial Results & Balance Sheet & Liquidity
4th Quarter & 2008 Full Year Financial Results & Balance Sheet & Liquidity Brian Fontana Vice President & CFO
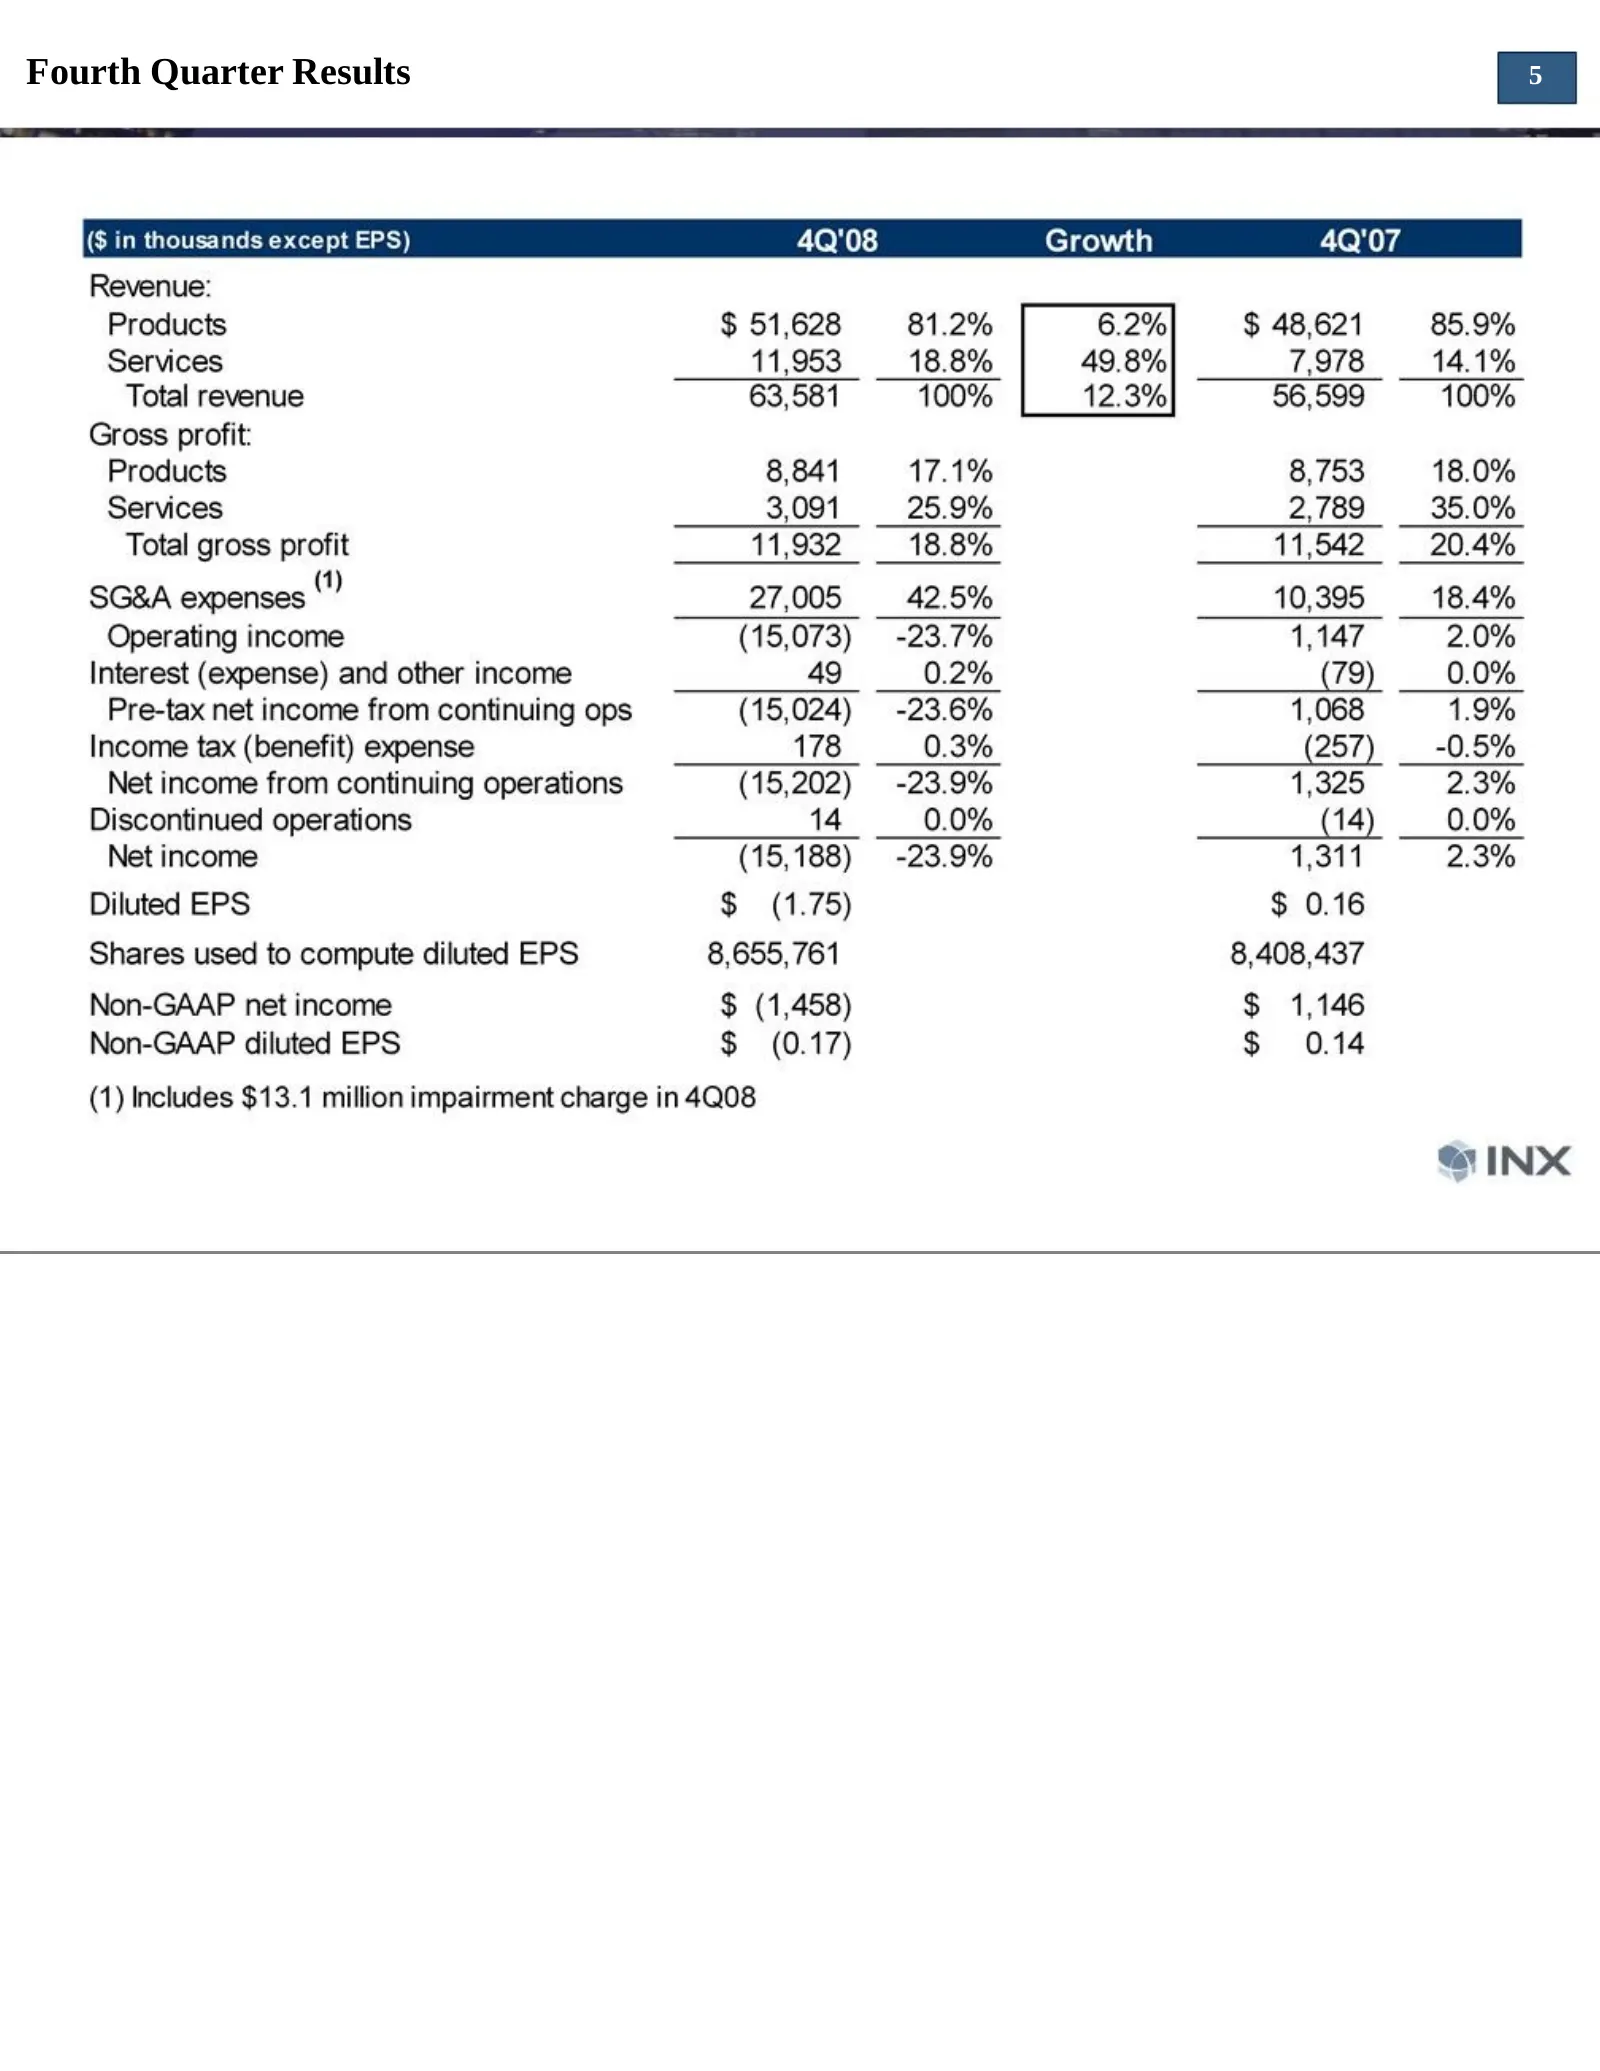
Slide 5: Fourth Quarter Results
Fourth Quarter Results ($ in thousands except EPS) 4Q'08 Growth 4Q'07 Revenue: Products $ 51,628 81.2% 6.2% $ 48,621 85.9% Services 11,953 18.8% 49.8% 7,978 14.1% Total revenue 63,581 100% 12.3% 56,599 100% Gross profit: Products 8,841 17.1% 8,753 18.0% Services 3,091 25.9% 2,789 35.0% Total gross p
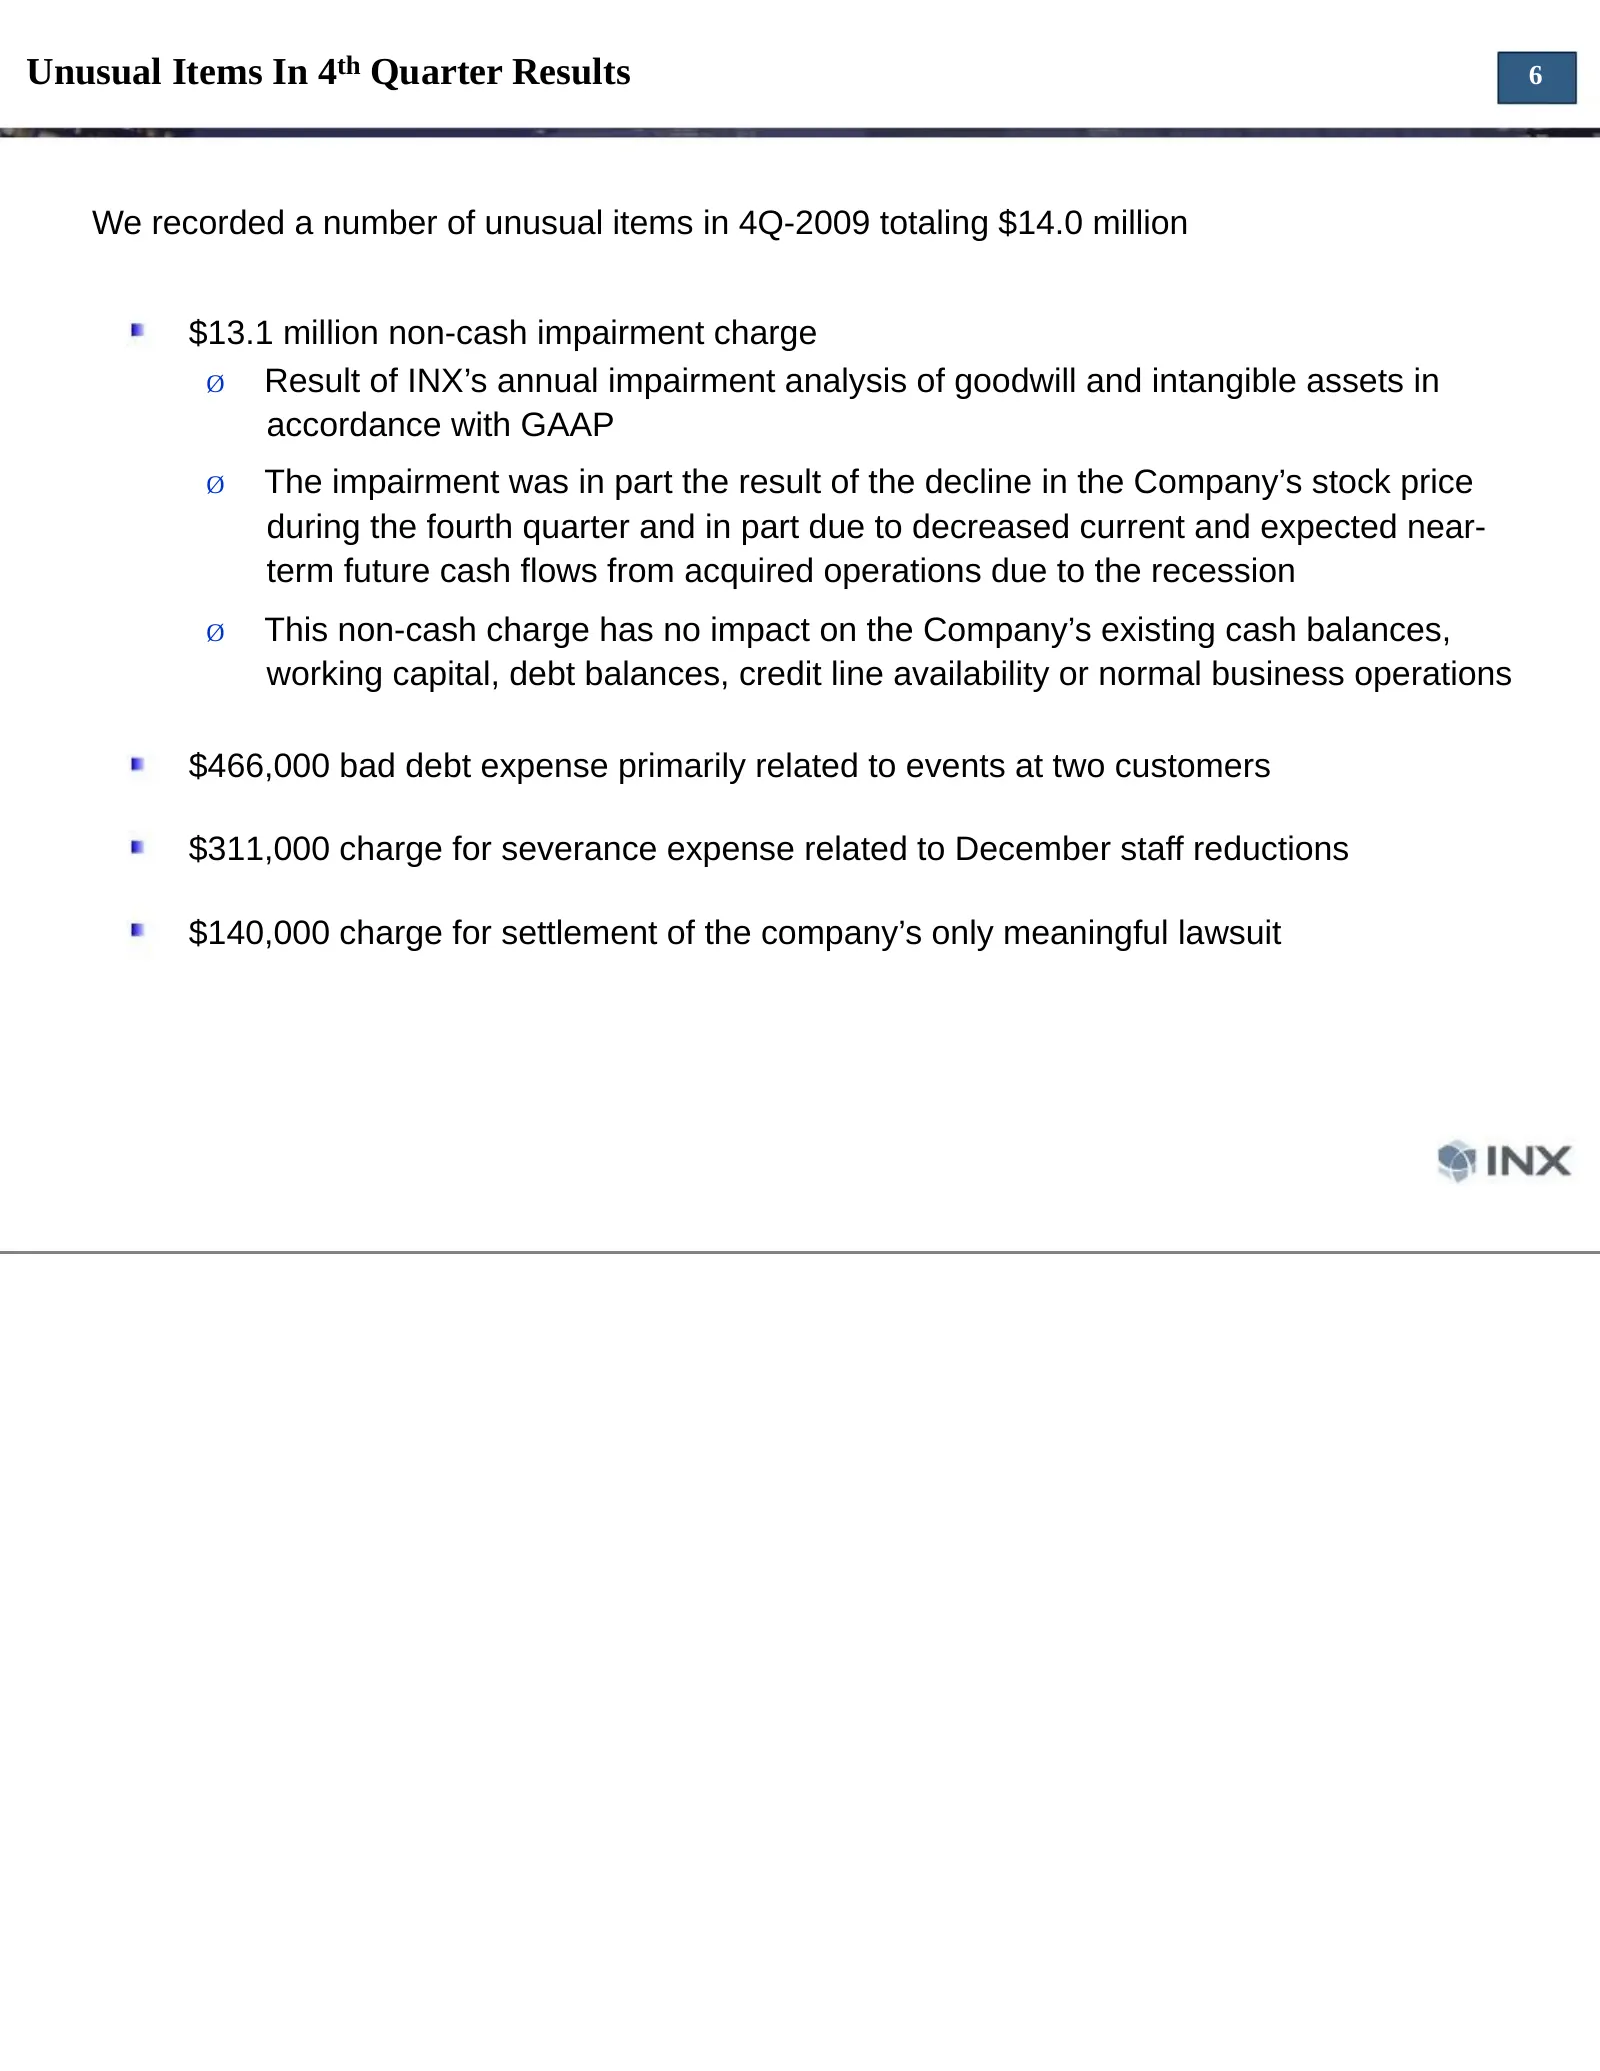
Slide 6: Unusual Items In 4th Quarter Results
Unusual Items In 4th Quarter Results 6 We recorded a number of unusual items in 4Q-2009 totaling $14.0 million $13.1 million non-cash impairment charge Ø Result of INX’s annual impairment analysis of goodwill and intangible assets in accordance with GAAP Ø The impairment was in part the result of th
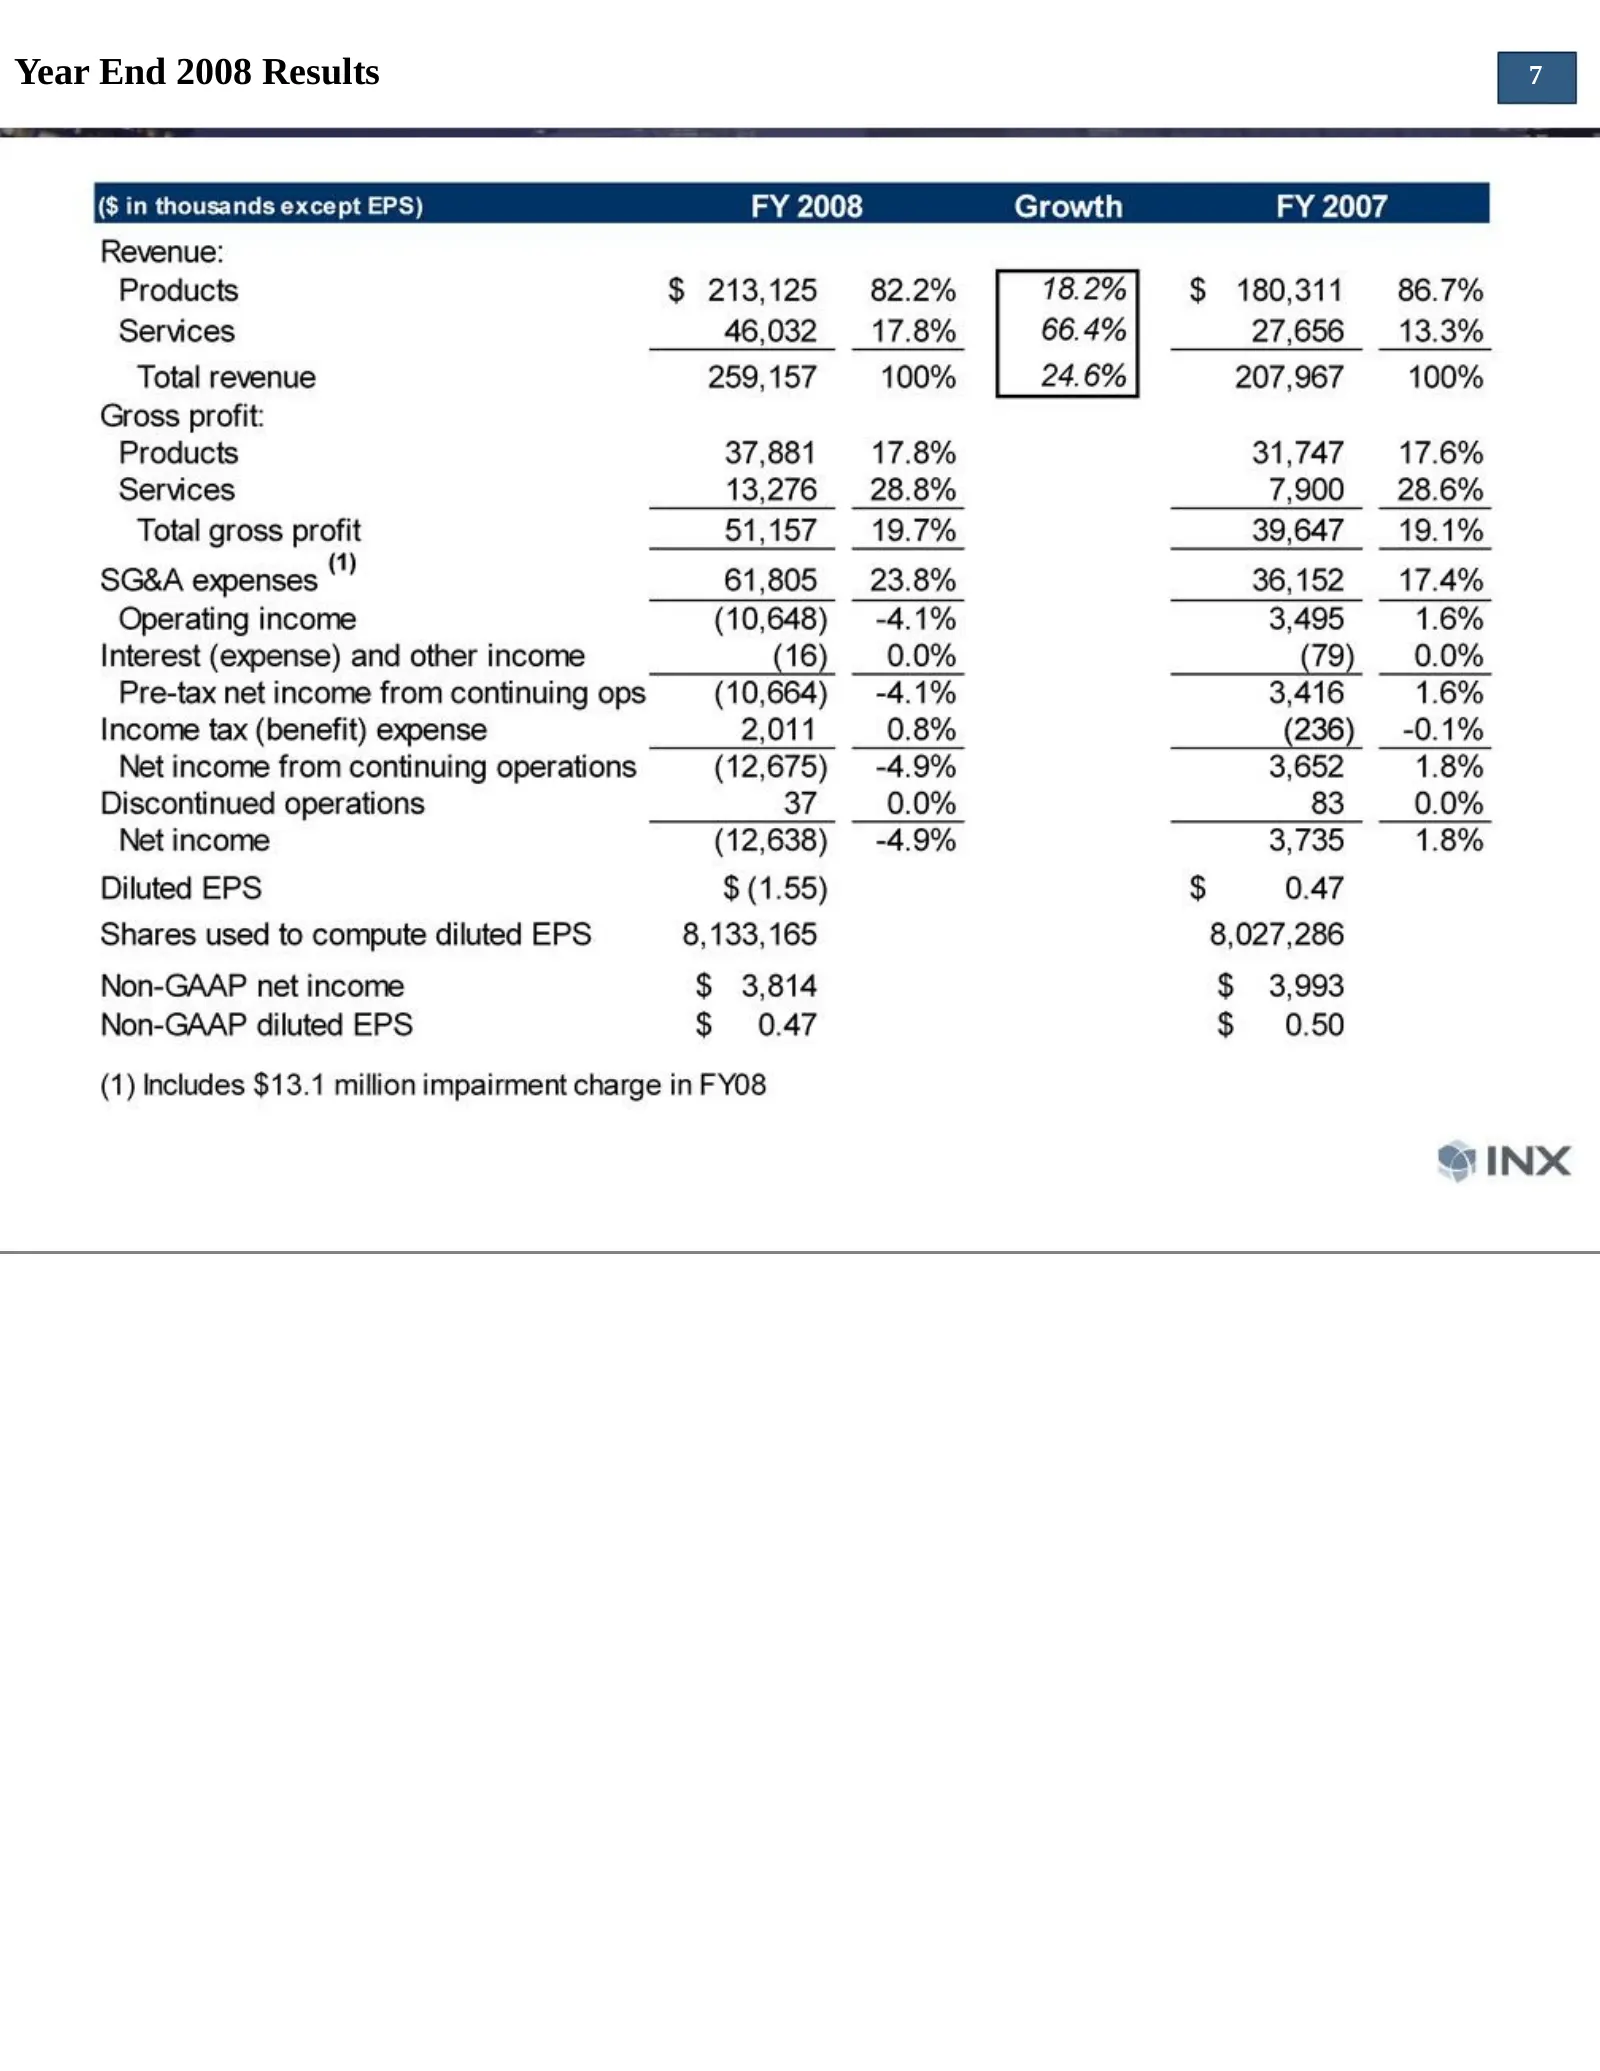
Slide 7: Year End 2008 Results
Year End 2008 Results ($ in thousands except EPS) Revenue: Products Services Total revenue Gross profit: Products Services Total gross profit SG&A expenses m Operating income Interest (expense) and other income Pre-tax net income from continuing ops Income tax (benefit) expense Net income from conti
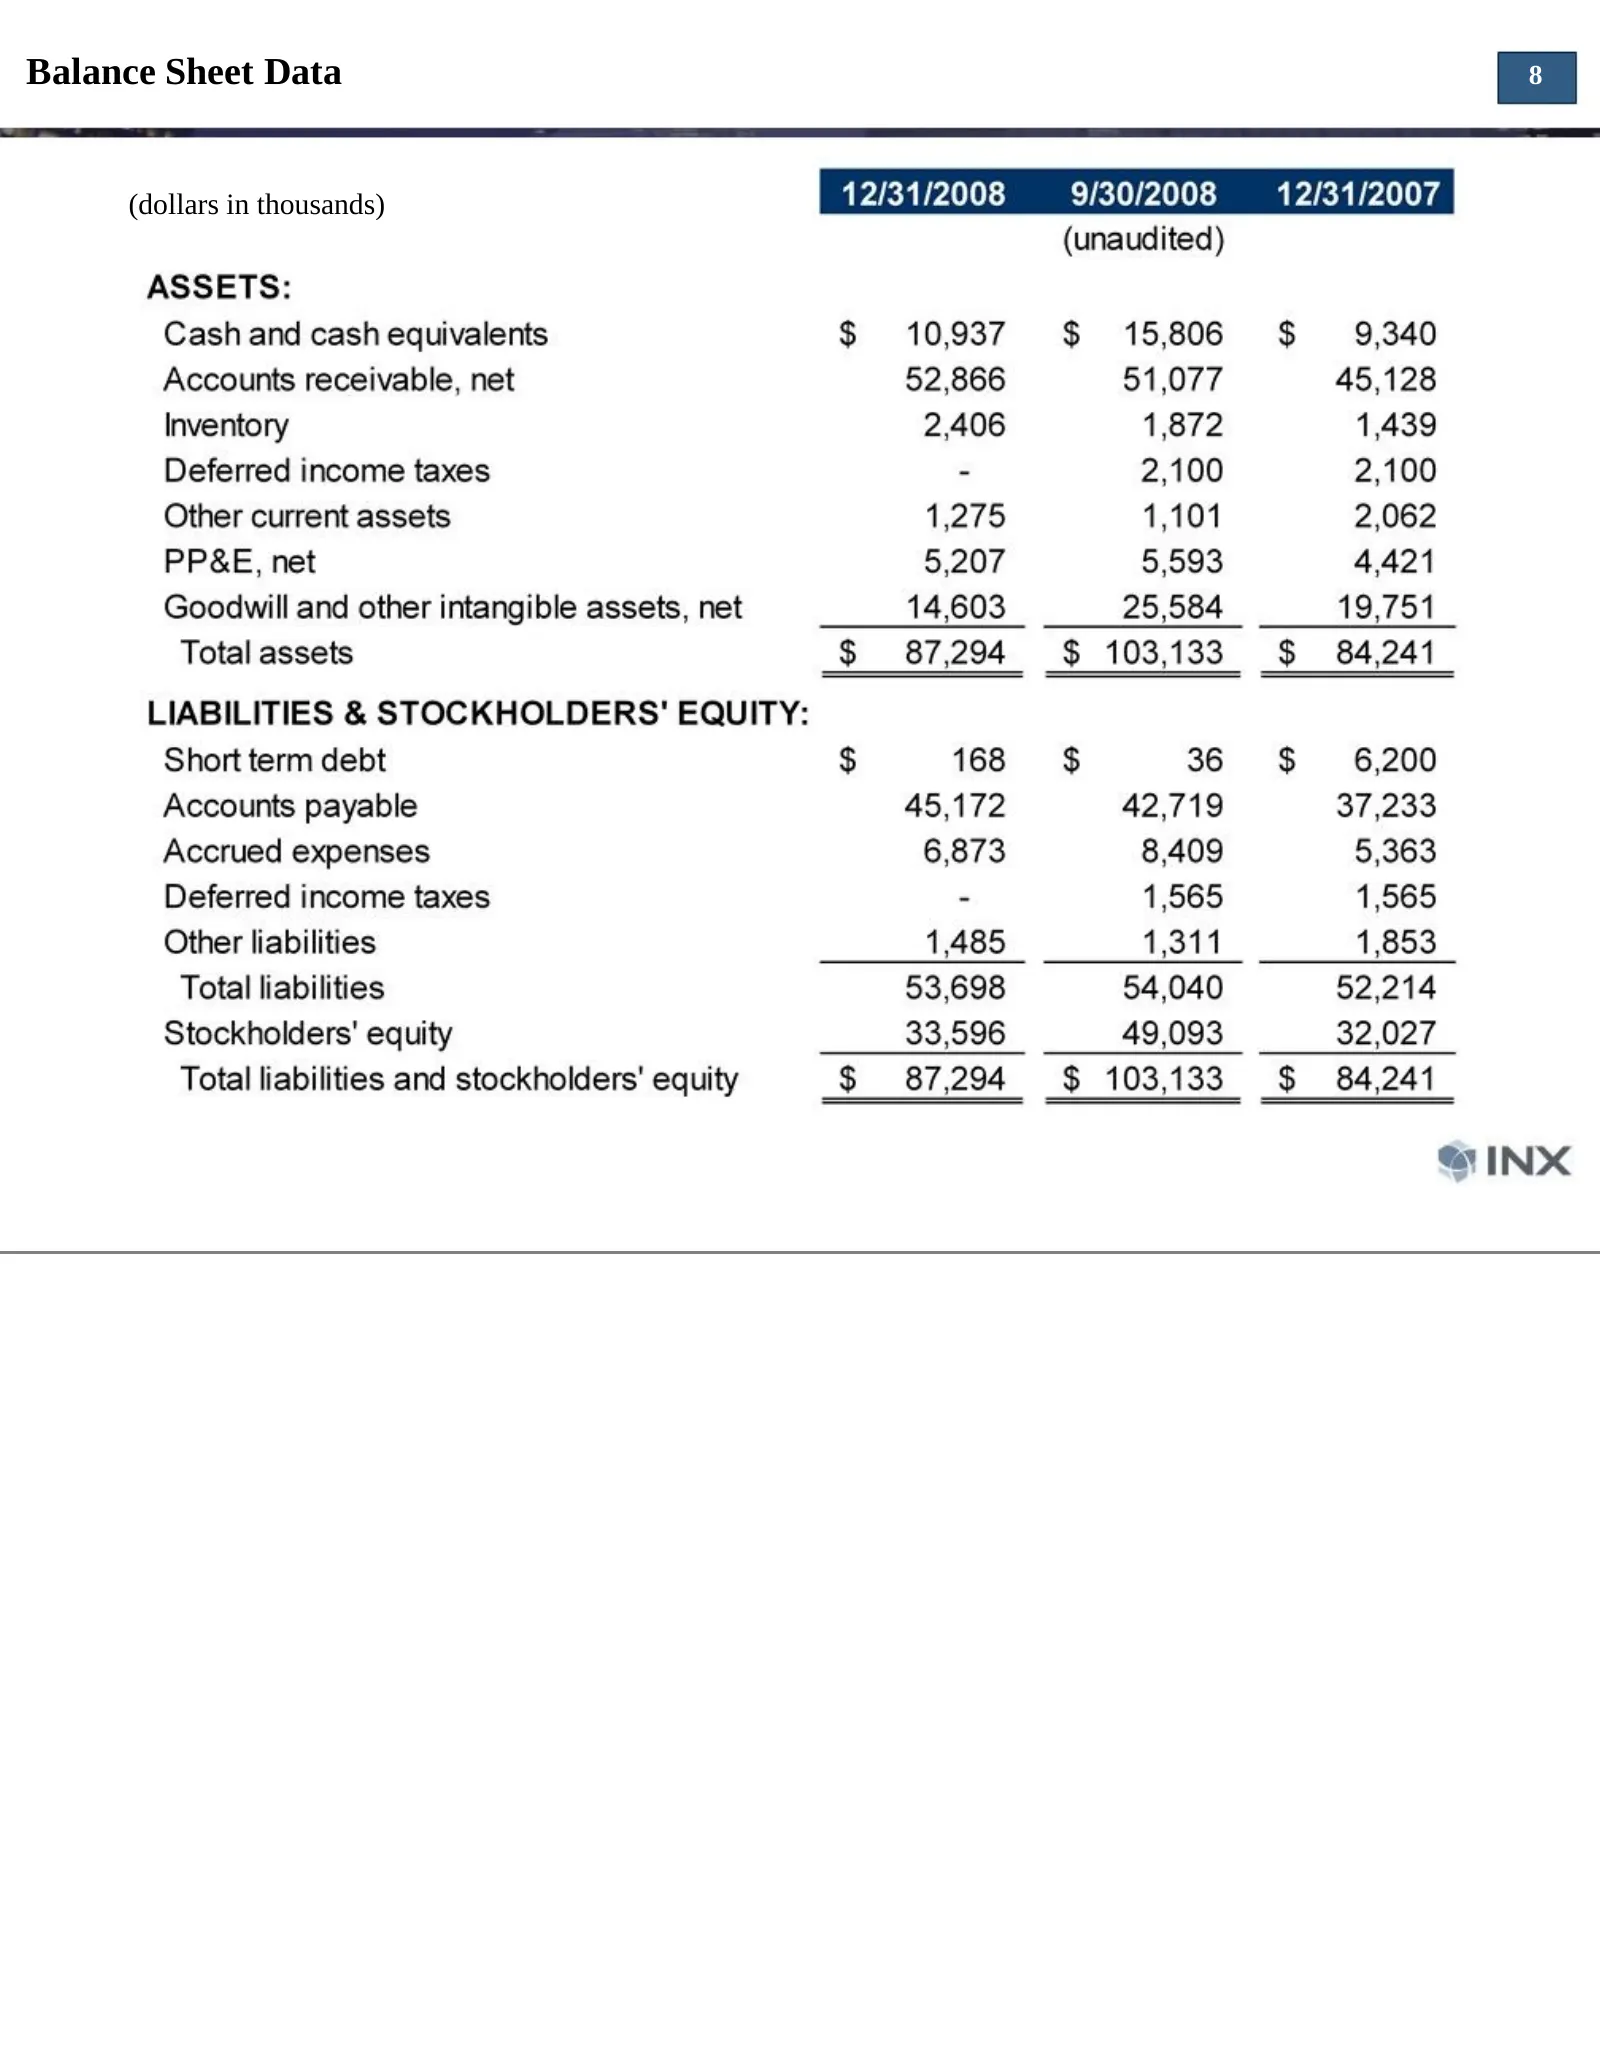
Slide 8: Balance Sheet Data
Balance Sheet Data 8 (dollars in thousands)
Slide 9: Credit Availability and Liquidity
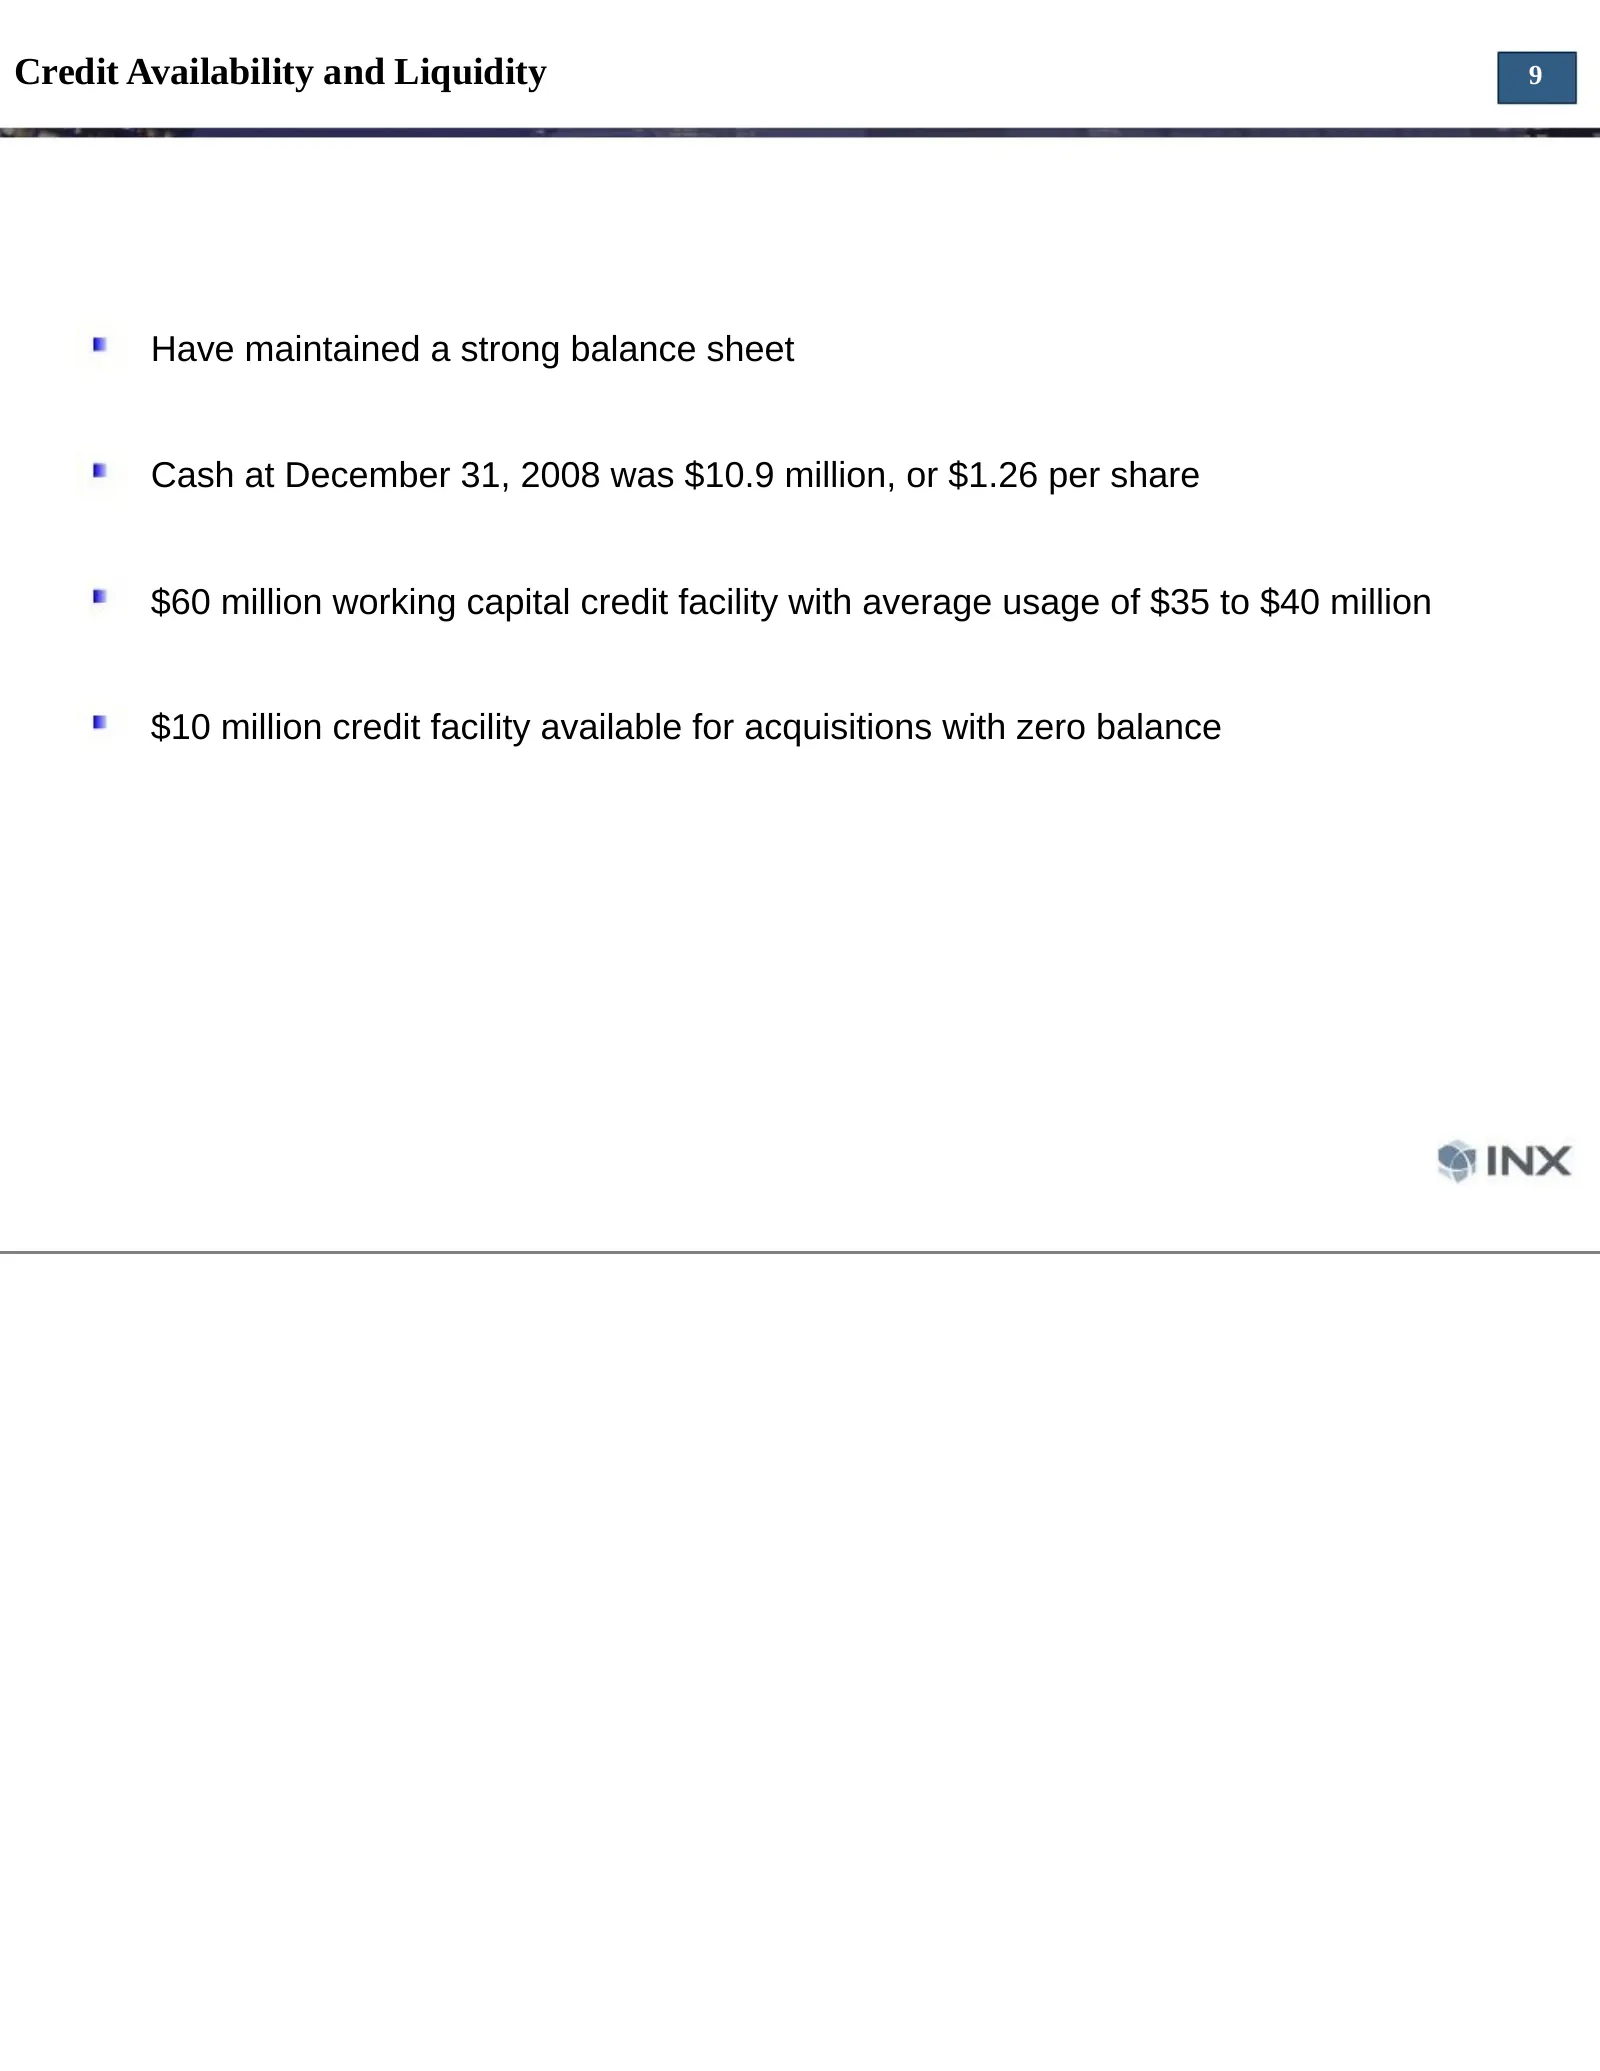
Credit Availability and Liquidity 9 Have maintained a strong balance sheet Cash at December 31, 2008 was $10.9 million, or $1.26 per share $60 million working capital credit facility with average usage of $35 to $40 million $10 million credit facility available for acquisitions with zero balance
Slide 10: Accounts Receivable Quality
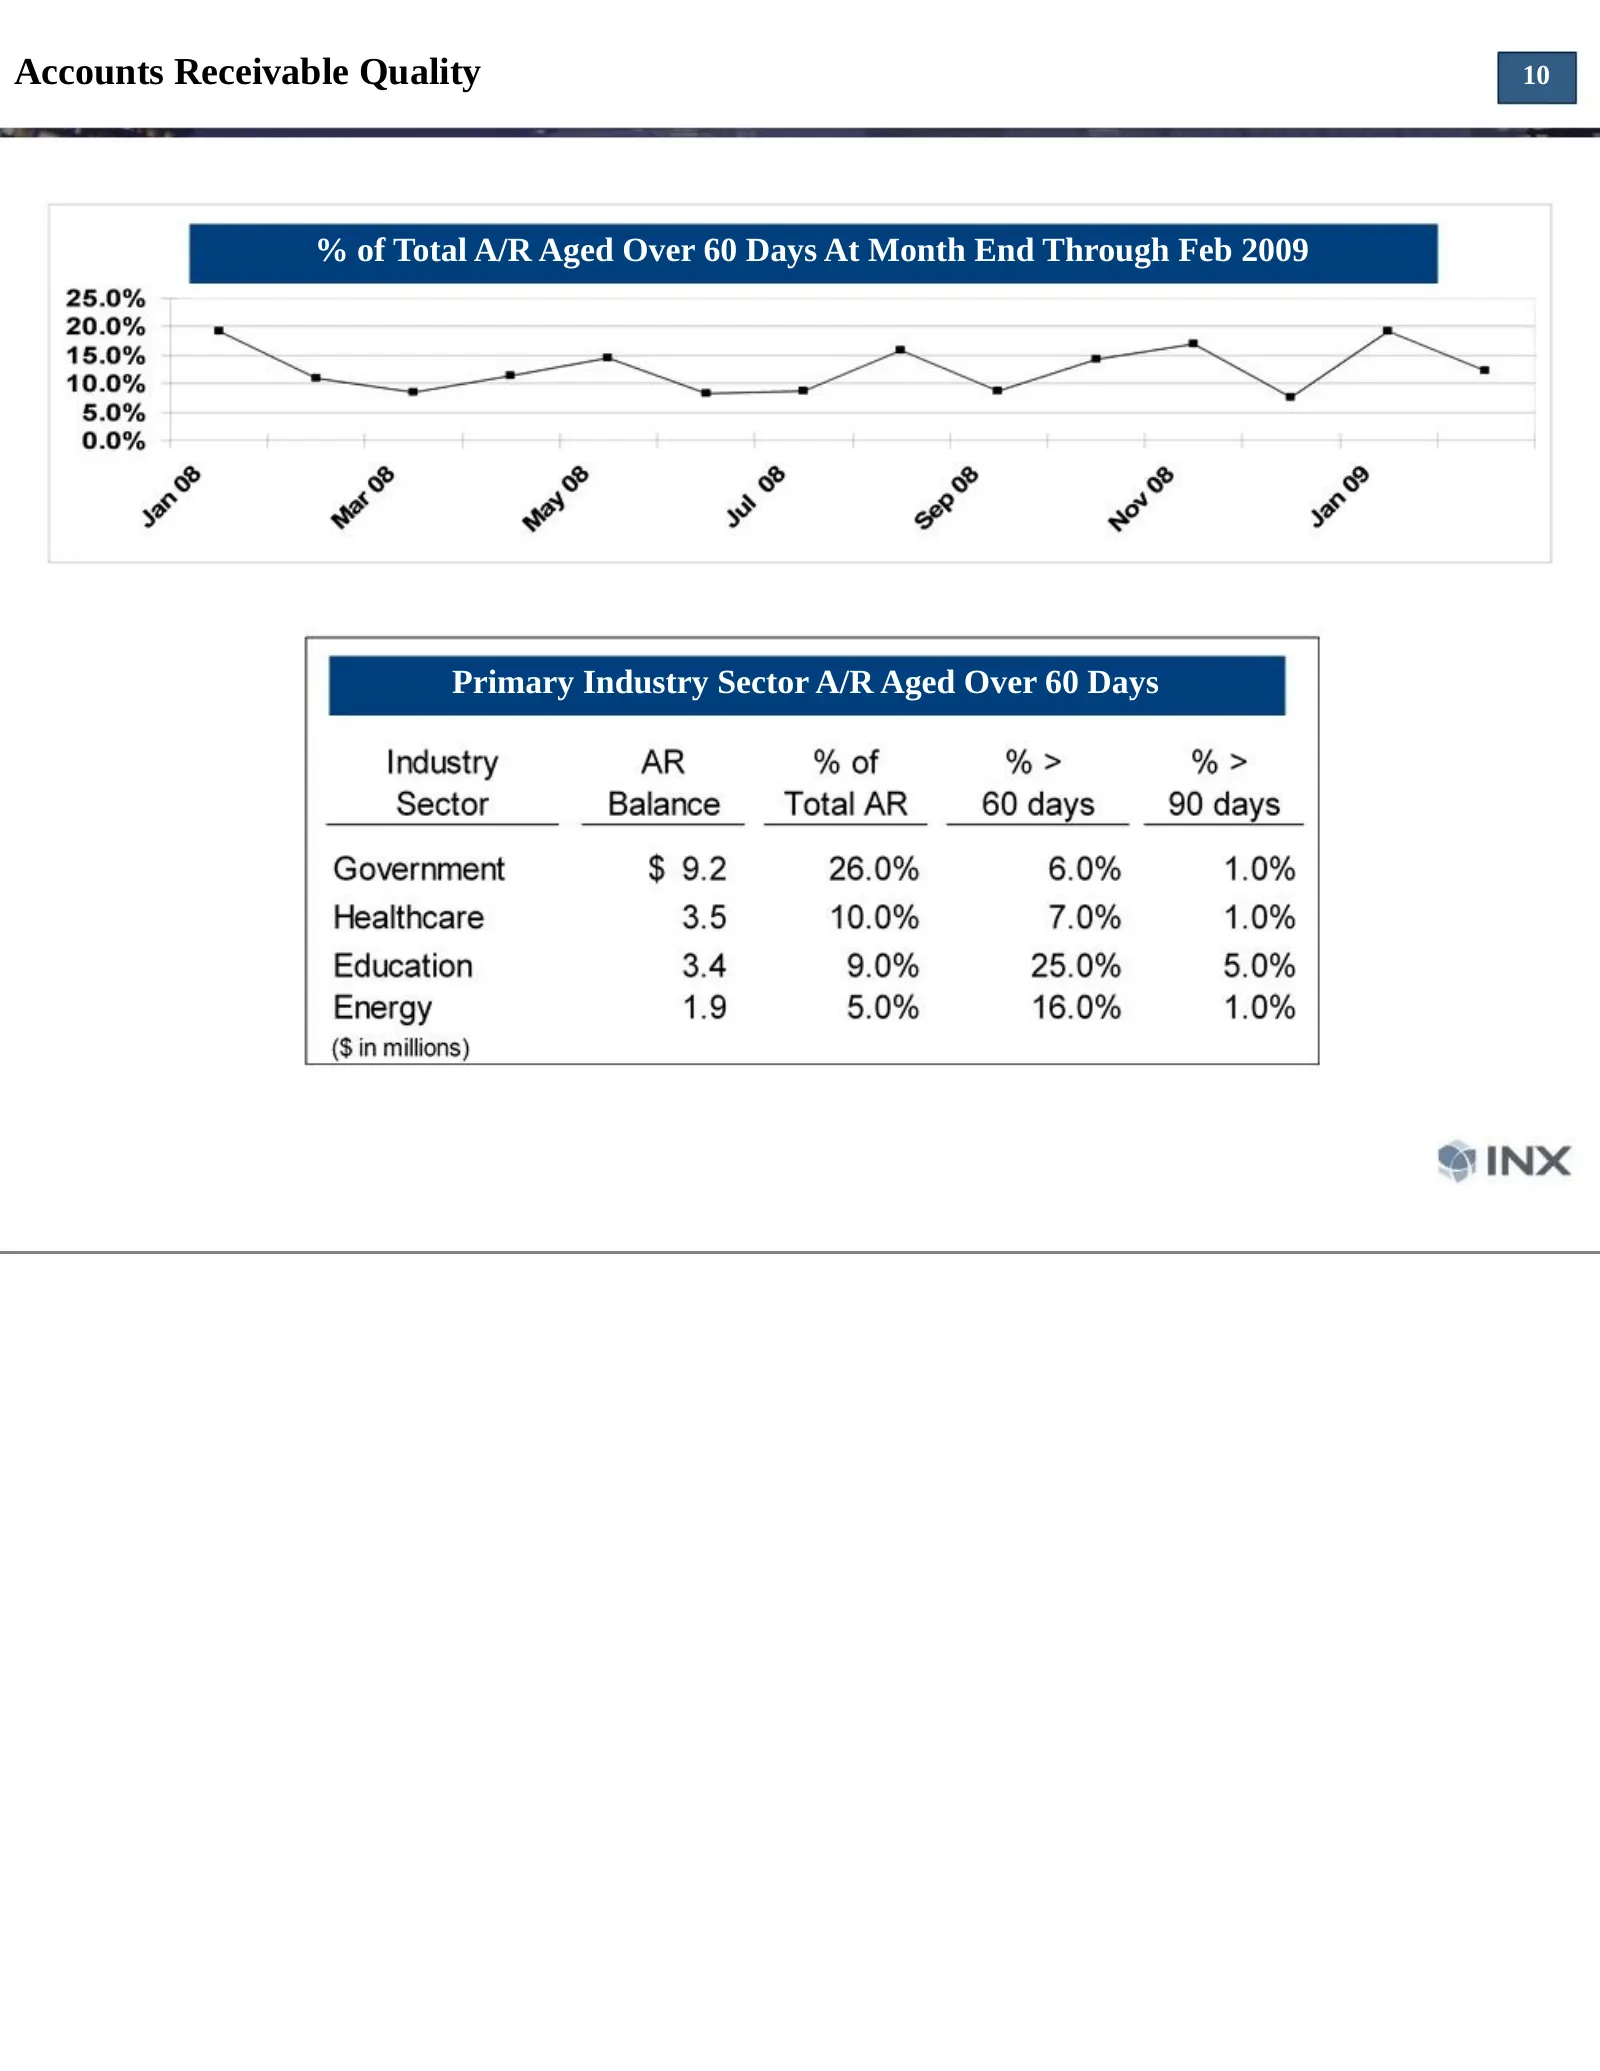
Accounts Receivable Quality 10 % of Total A/R Aged Over 60 Days At Month End Through Feb 2009 Primary Industry Sector A/R Aged Over 60 Days
Slide 11: Update On INX's Business
Update On INX’s Business Mark Hilz President & COO
Slide 12: Update On How INX's Vision Has Been Evolving
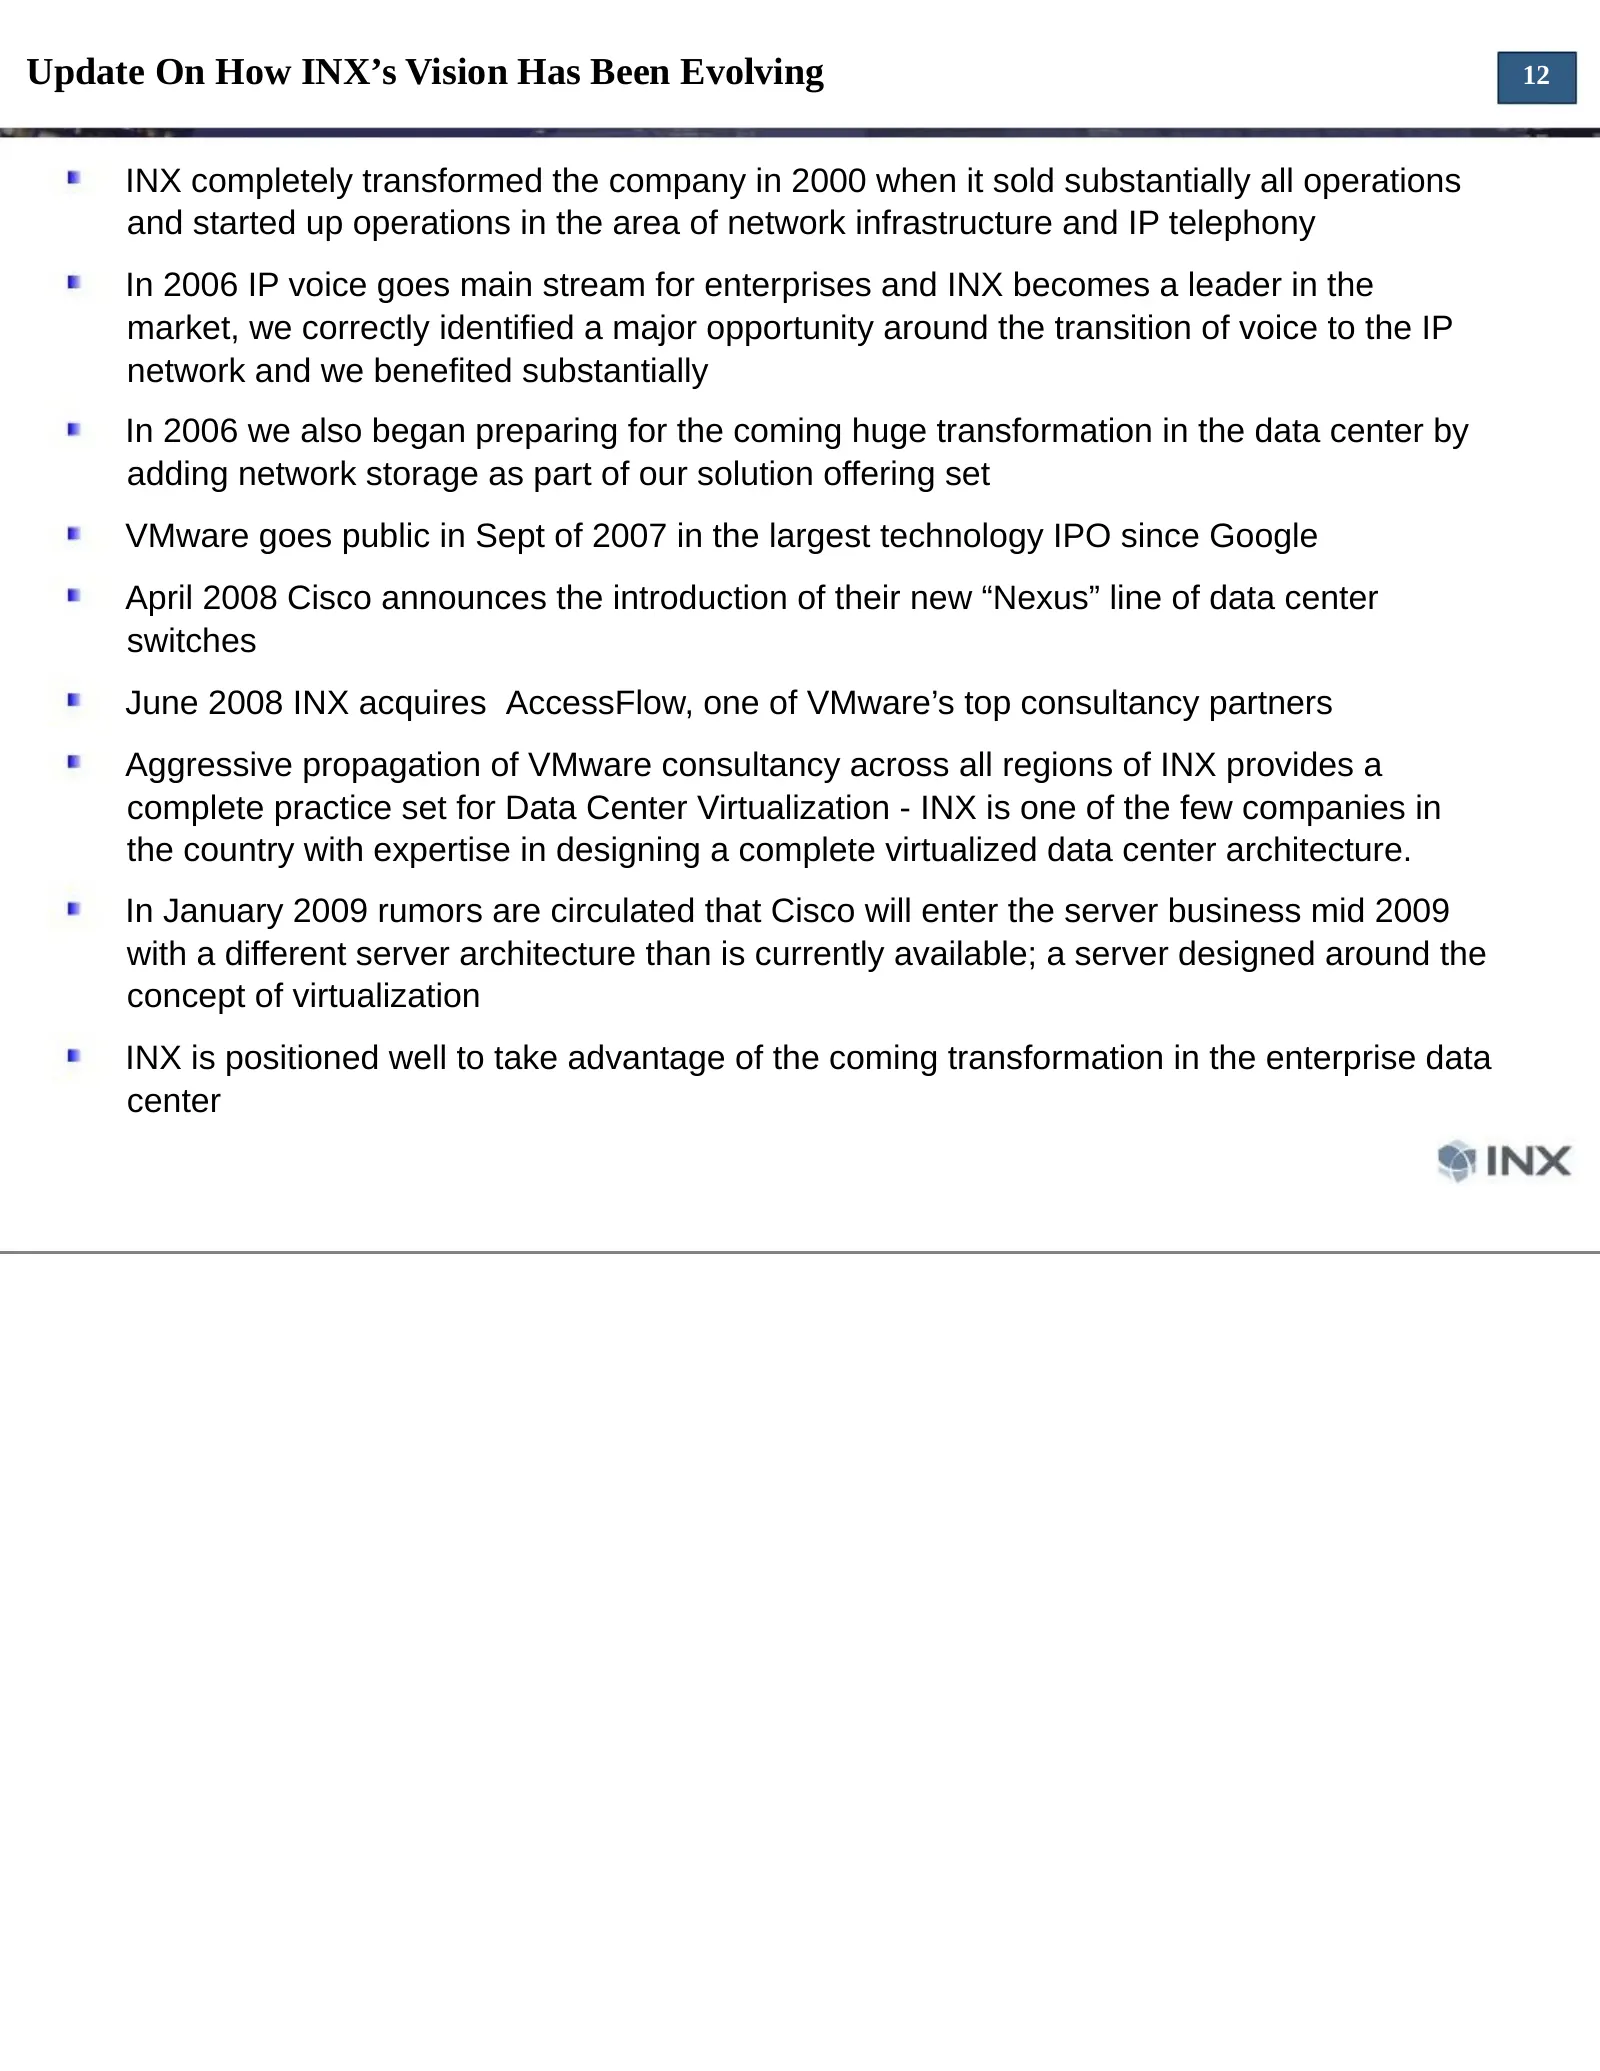
Update On How INX’s Vision Has Been Evolving 12 INX completely transformed the company in 2000 when it sold substantially all operations and started up operations in the area of network infrastructure and IP telephony In 2006 IP voice goes main stream for enterprises and INX becomes a leader in the
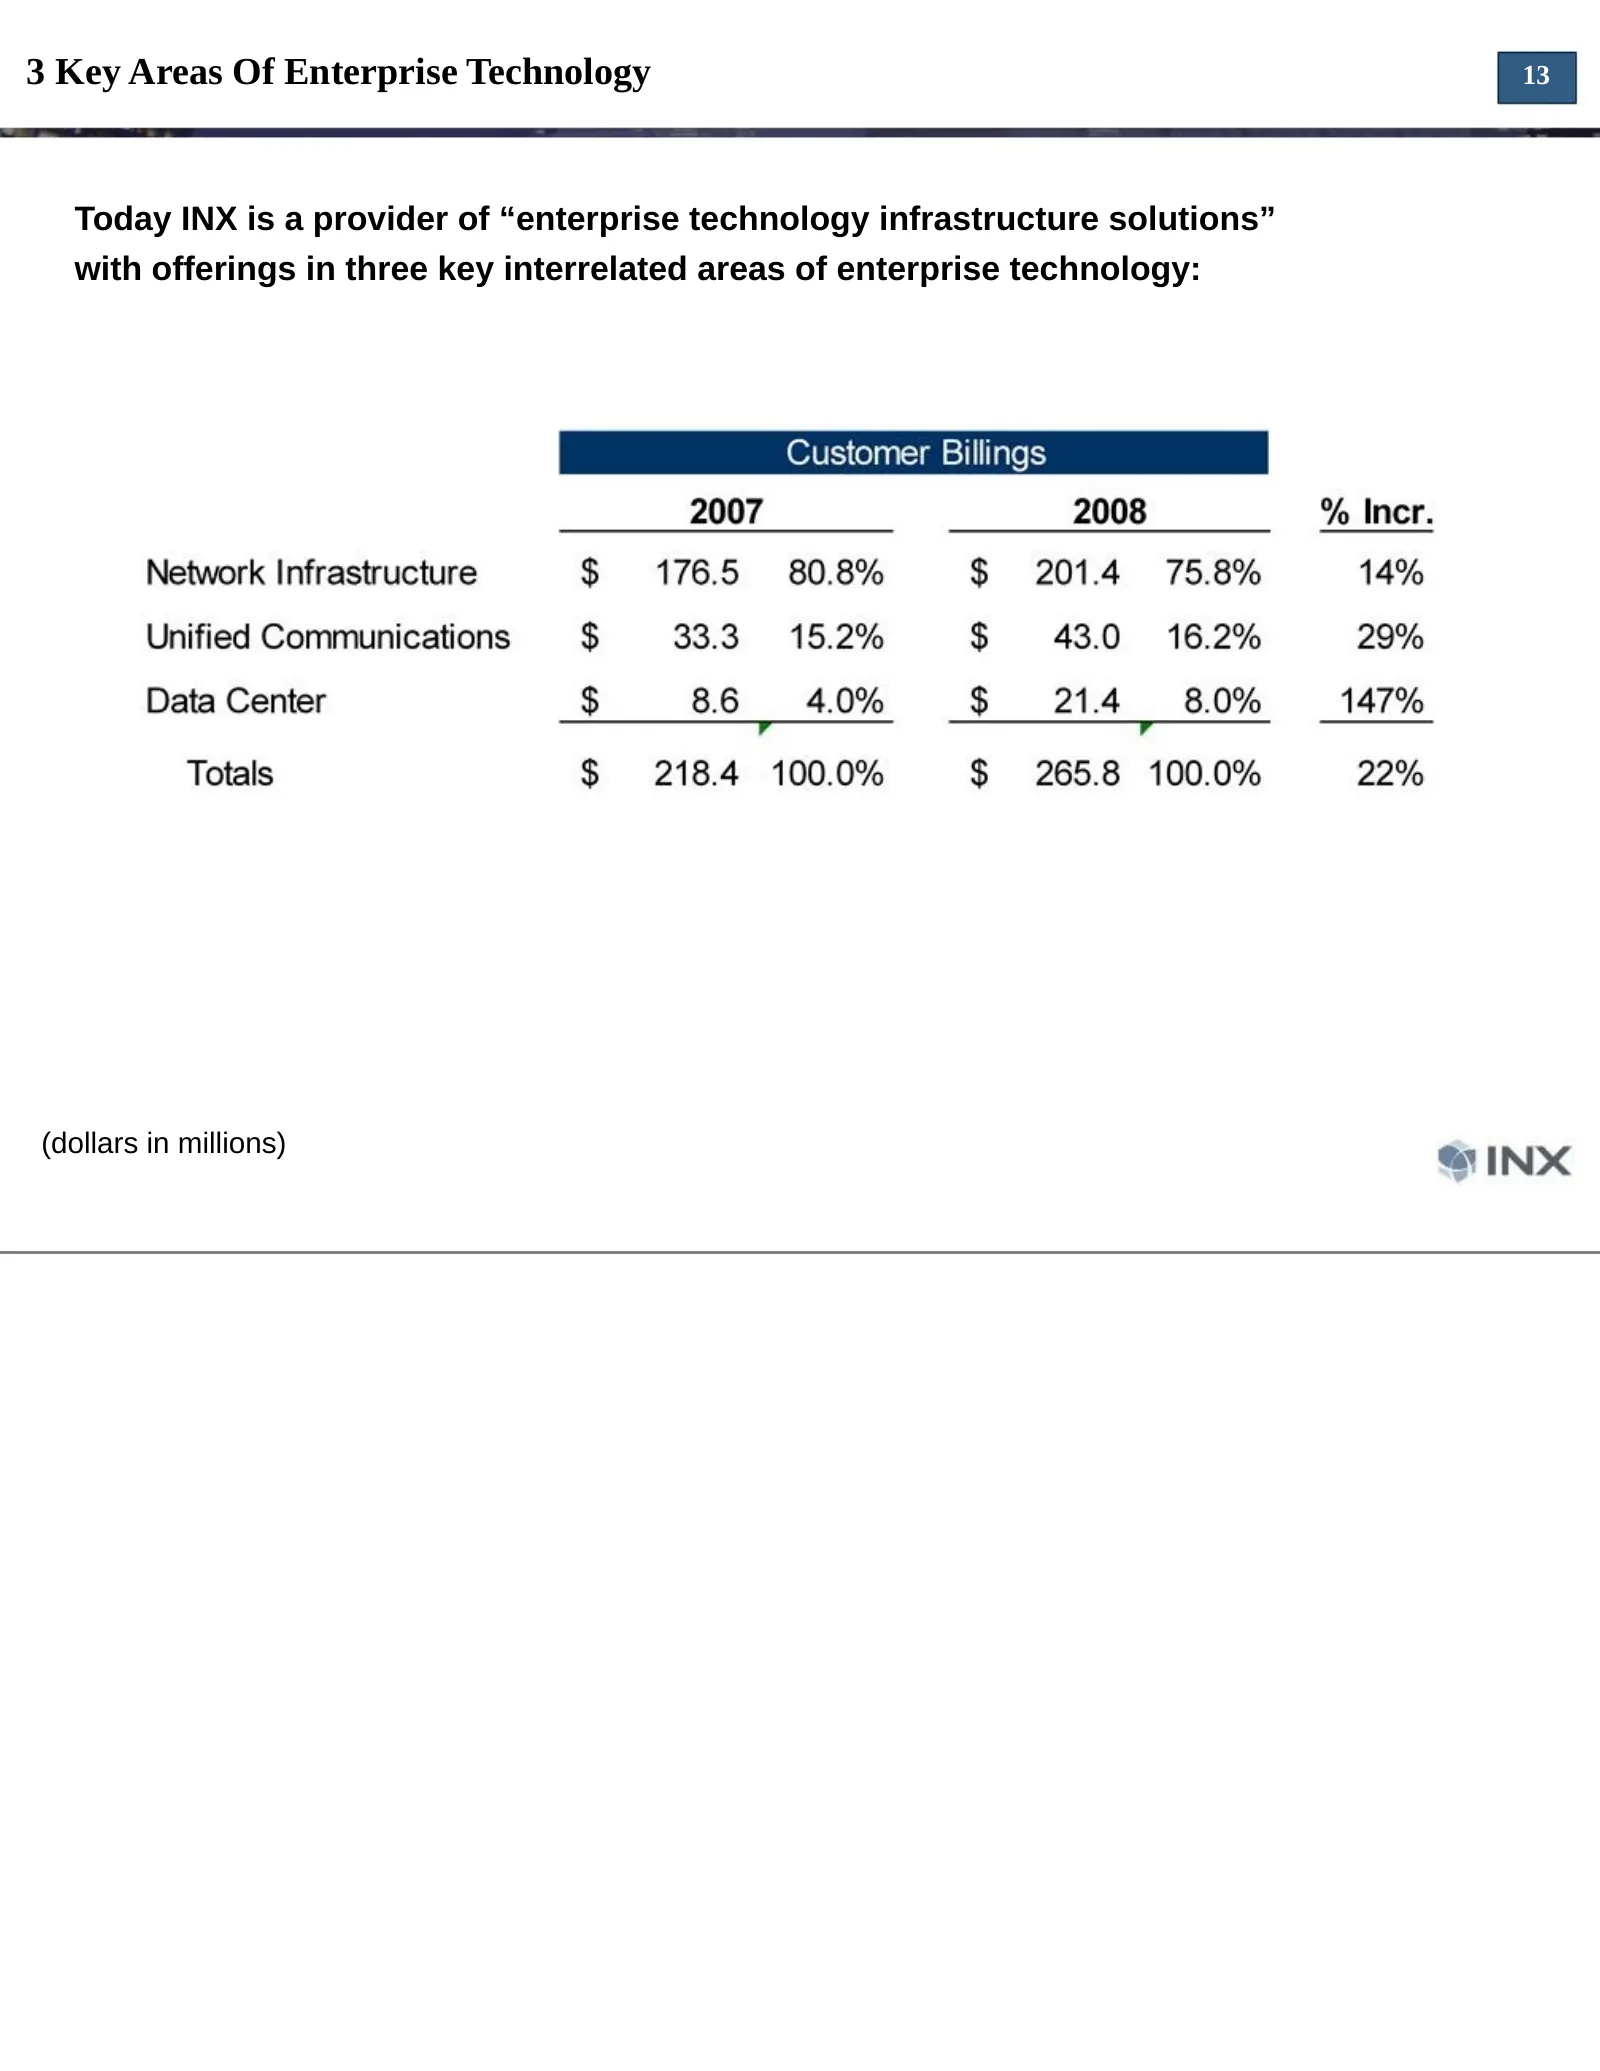
Slide 13: 3 Key Areas Of Enterprise Technology
3 Key Areas Of Enterprise Technology 13 Today INX is a provider of “enterprise technology infrastructure solutions” with offerings in three key interrelated areas of enterprise technology: (dollars in millions)
Slide 14: INX Differentiation Strategies
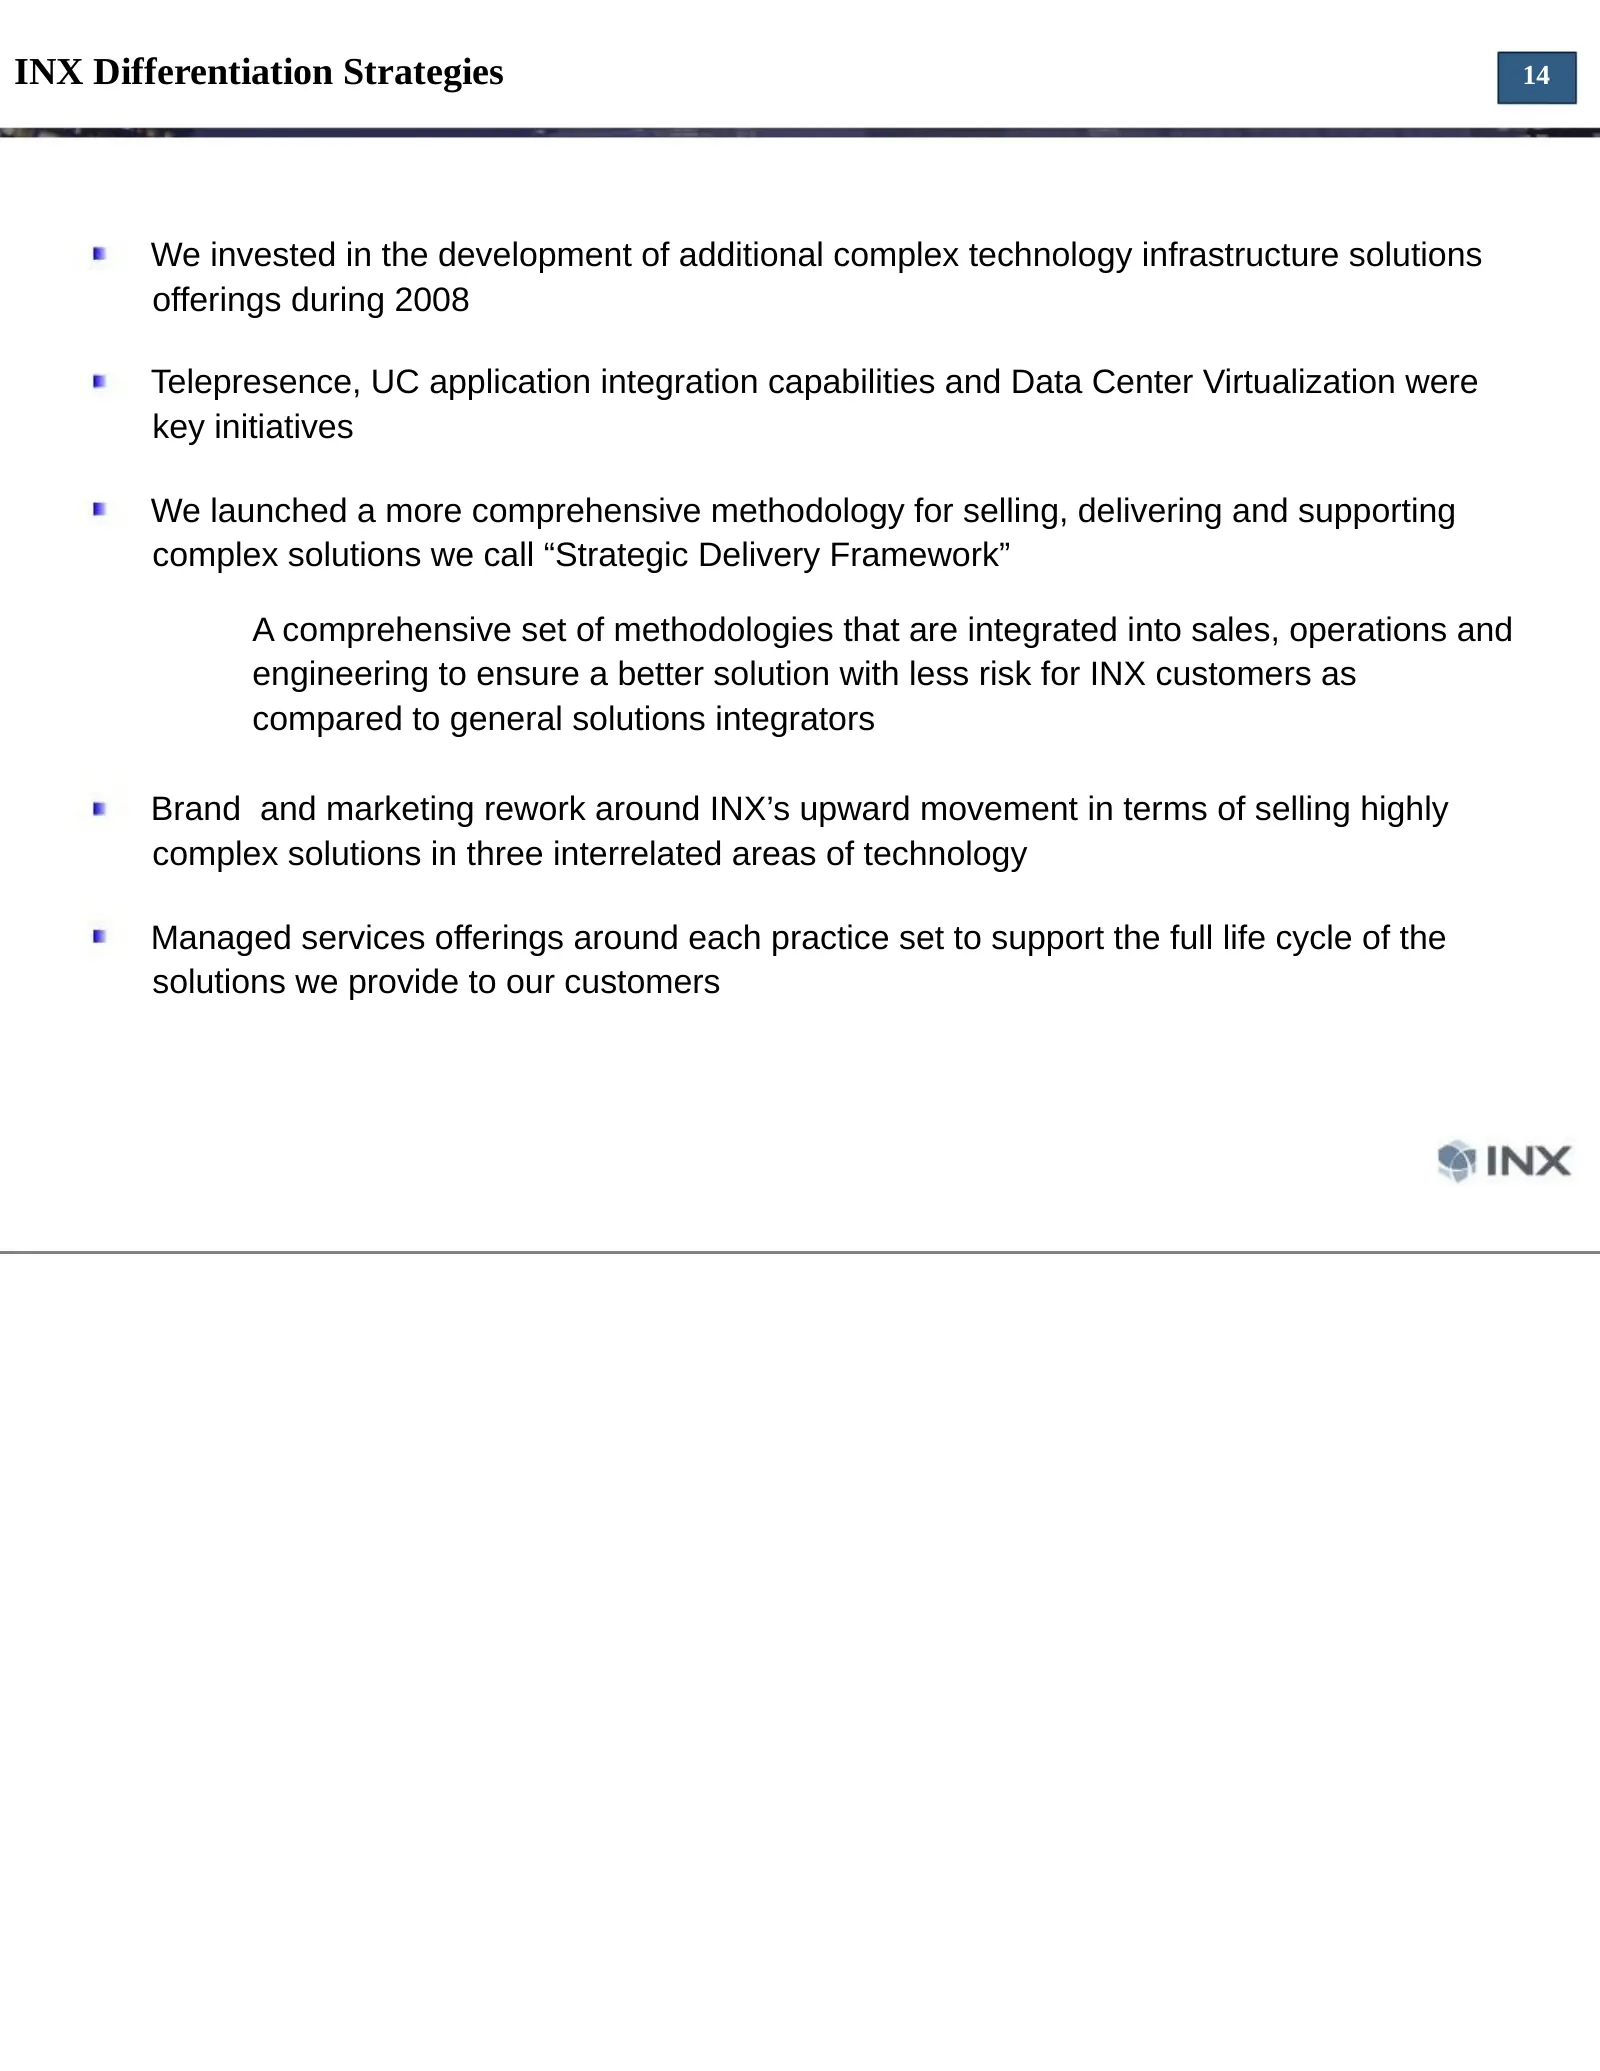
INX Differentiation Strategies 14 We invested in the development of additional complex technology infrastructure solutions offerings during 2008 Telepresence, UC application integration capabilities and Data Center Virtualization were key initiatives We launched a more comprehensive methodology for
Slide 15: INX Sales & Marketing Strategies In A Tough Economic Environment
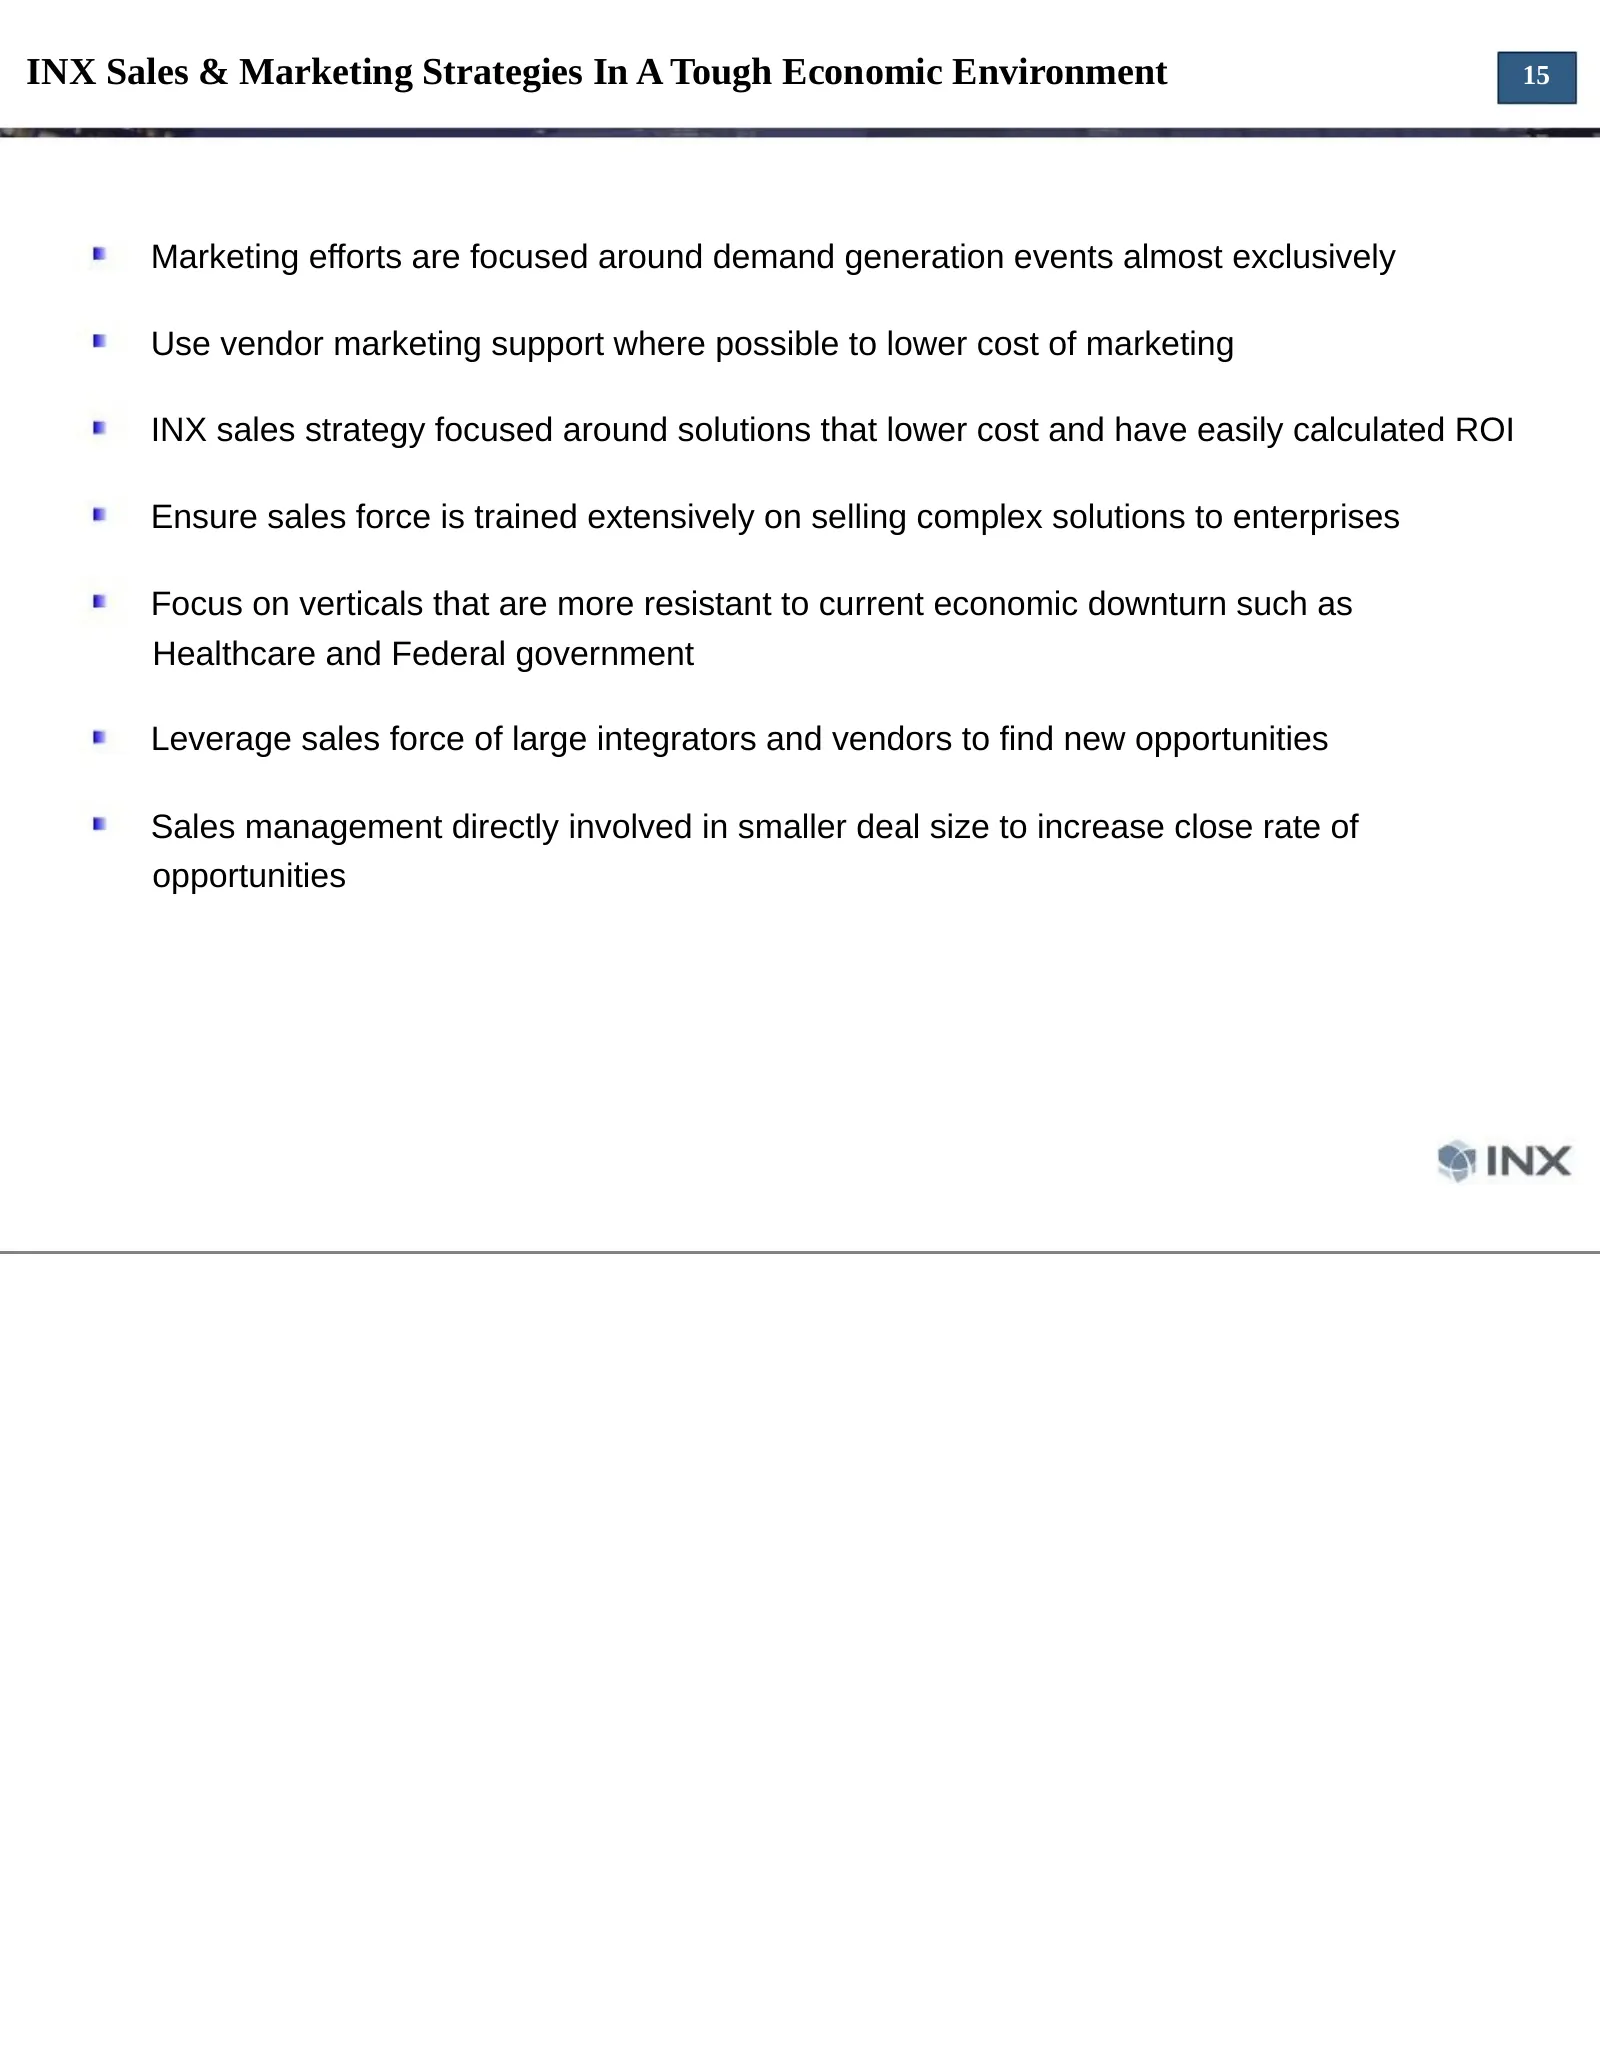
INX Sales & Marketing Strategies In A Tough Economic Environment 15 Marketing efforts are focused around demand generation events almost exclusively Use vendor marketing support where possible to lower cost of marketing INX sales strategy focused around solutions that lower cost and have easily calc
Slide 16: Why We Are Optimistic About INX's Long-Term Prospects In Spite Of The Recession
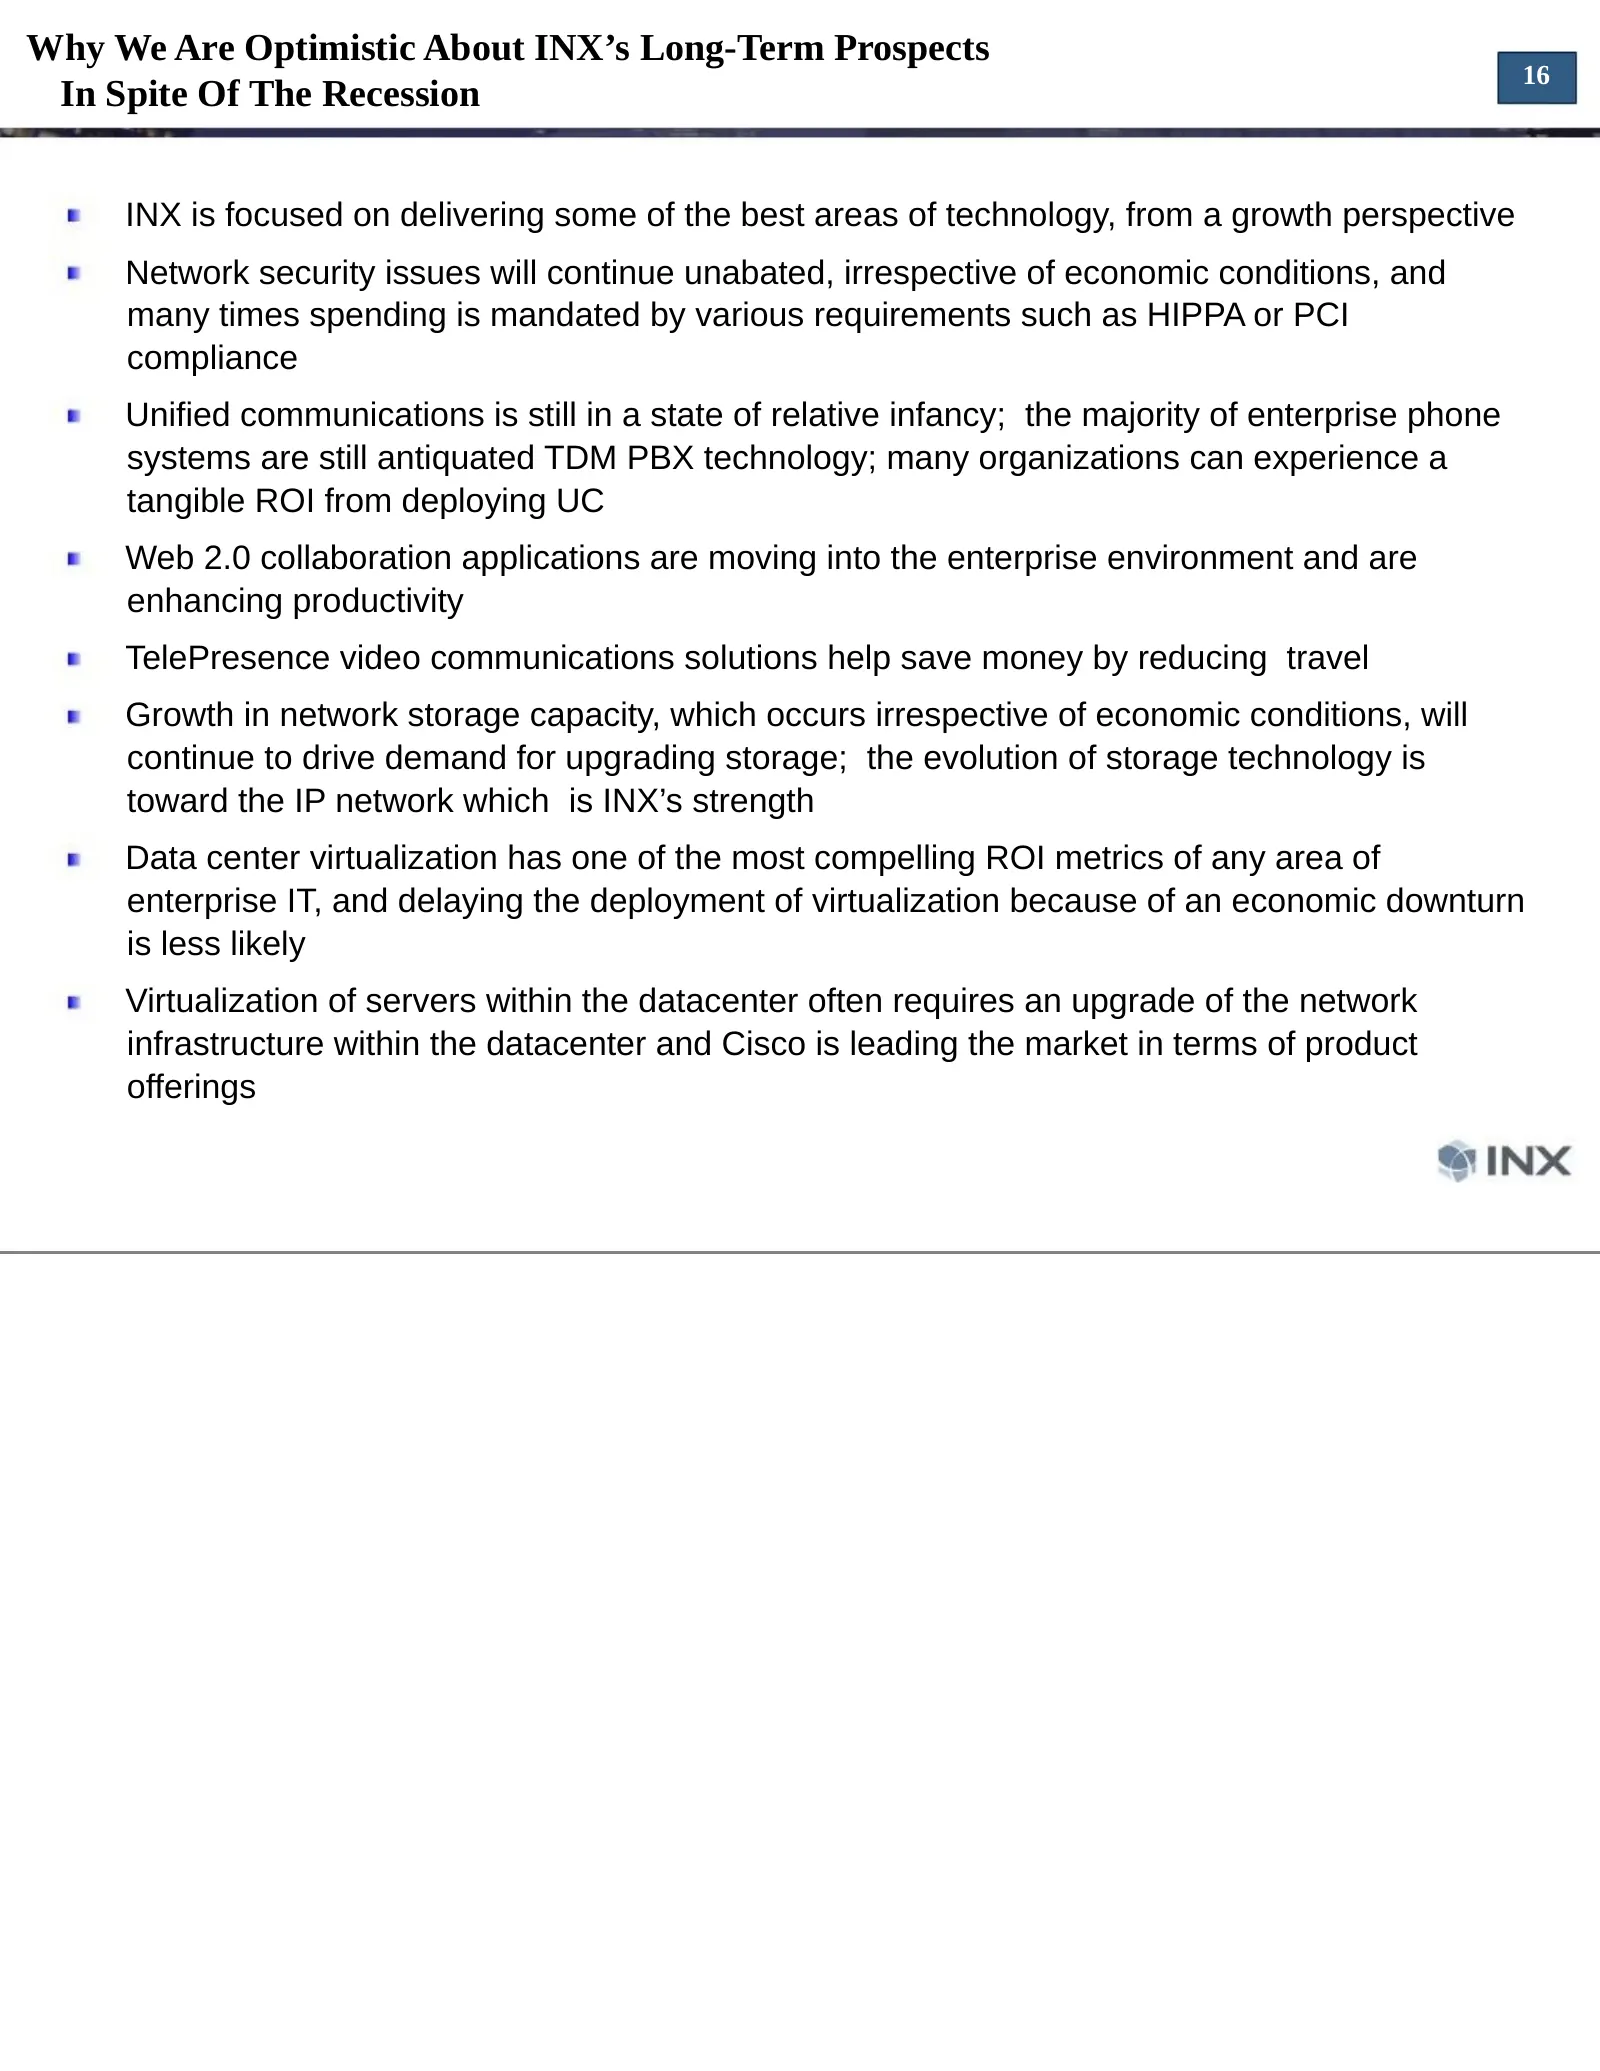
Why We Are Optimistic About INX’s Long-Term Prospects 16 In Spite Of The Recession INX is focused on delivering some of the best areas of technology, from a growth perspective Network security issues will continue unabated, irrespective of economic conditions, and many times spending is mandated by
Slide 17: Moving Forward
Moving Forward Jim Long Chairman & CEO
Slide 18: Market Conditions - Some Benchmarks
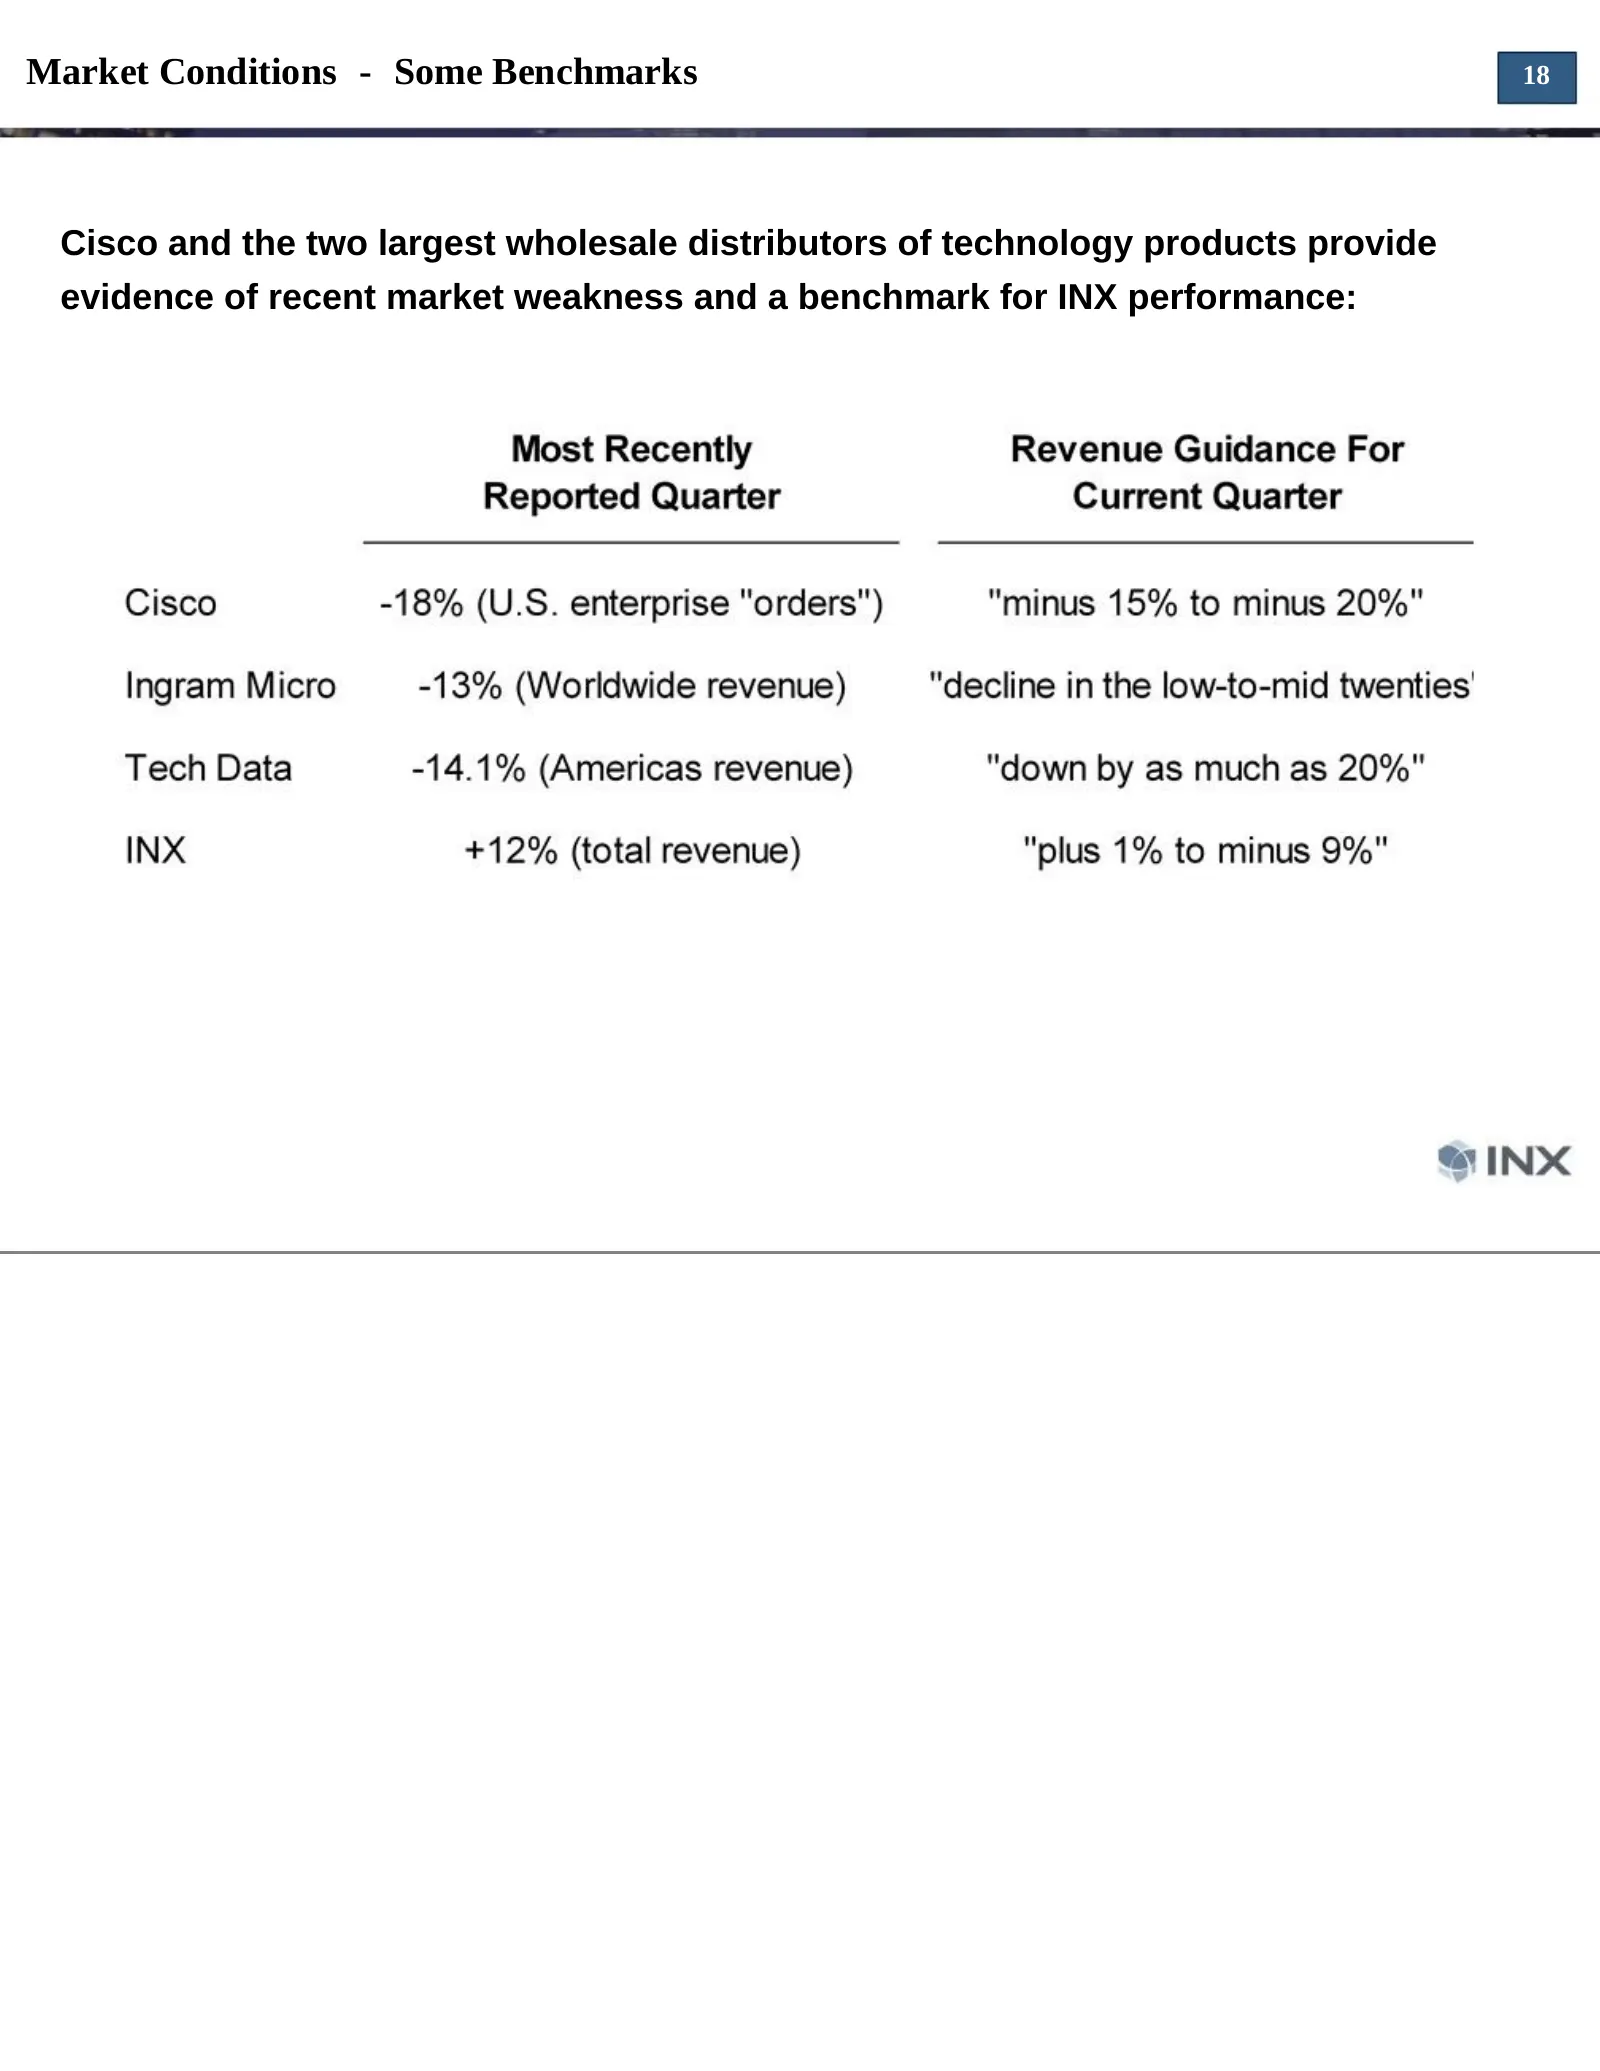
Market Conditions - Some Benchmarks 18 Cisco and the two largest wholesale distributors of technology products provide evidence of recent market weakness and a benchmark for INX performance:
Slide 19: How We Are Addressing The Current Economic Recession
How We Are Addressing The Current Economic Recession 19 We are operating the company with an expectation that customer demand will remain soft for at least the first half of 2009, and more likely through 2009 or even longer Faced with an inability to forecast when economic activity and customer dema
Slide 20: The Total Market And INX's Position Within It
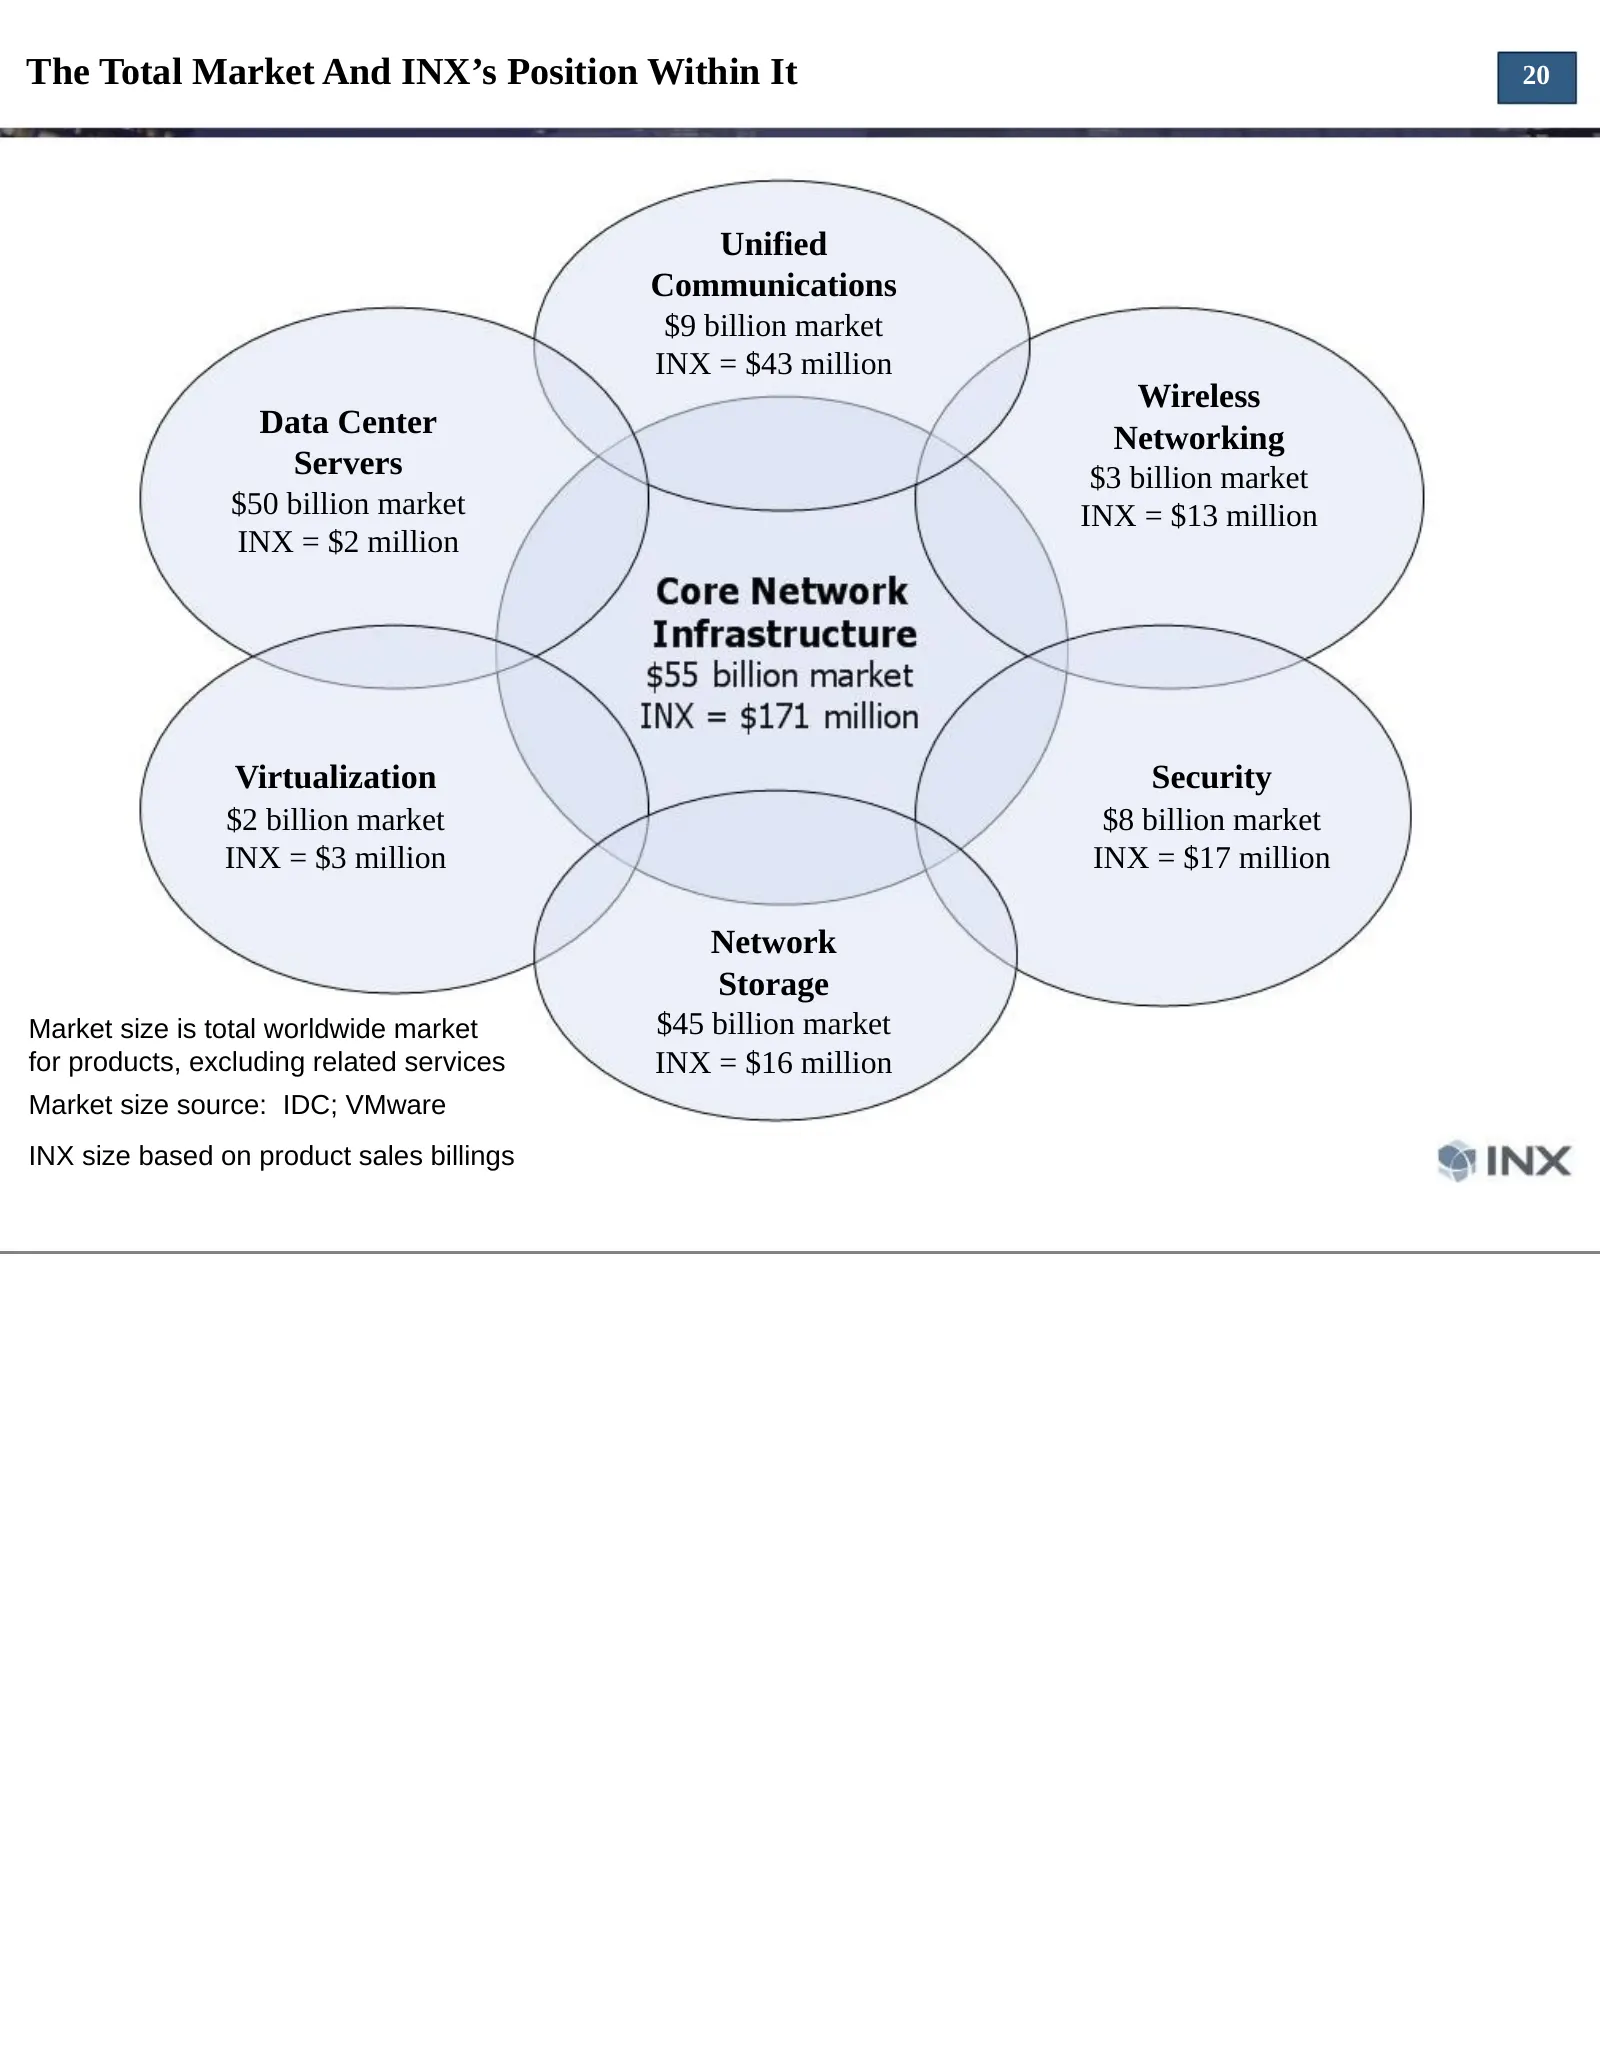
The Total Market And INX’s Position Within It 20 Unified Communications $9 billion market INX = $43 million Wireless Data Center Networking Servers $3 billion market $50 billion market INX = $13 million INX = $2 million Virtualization Security $2 billion market $8 billion market INX = $3 million INX
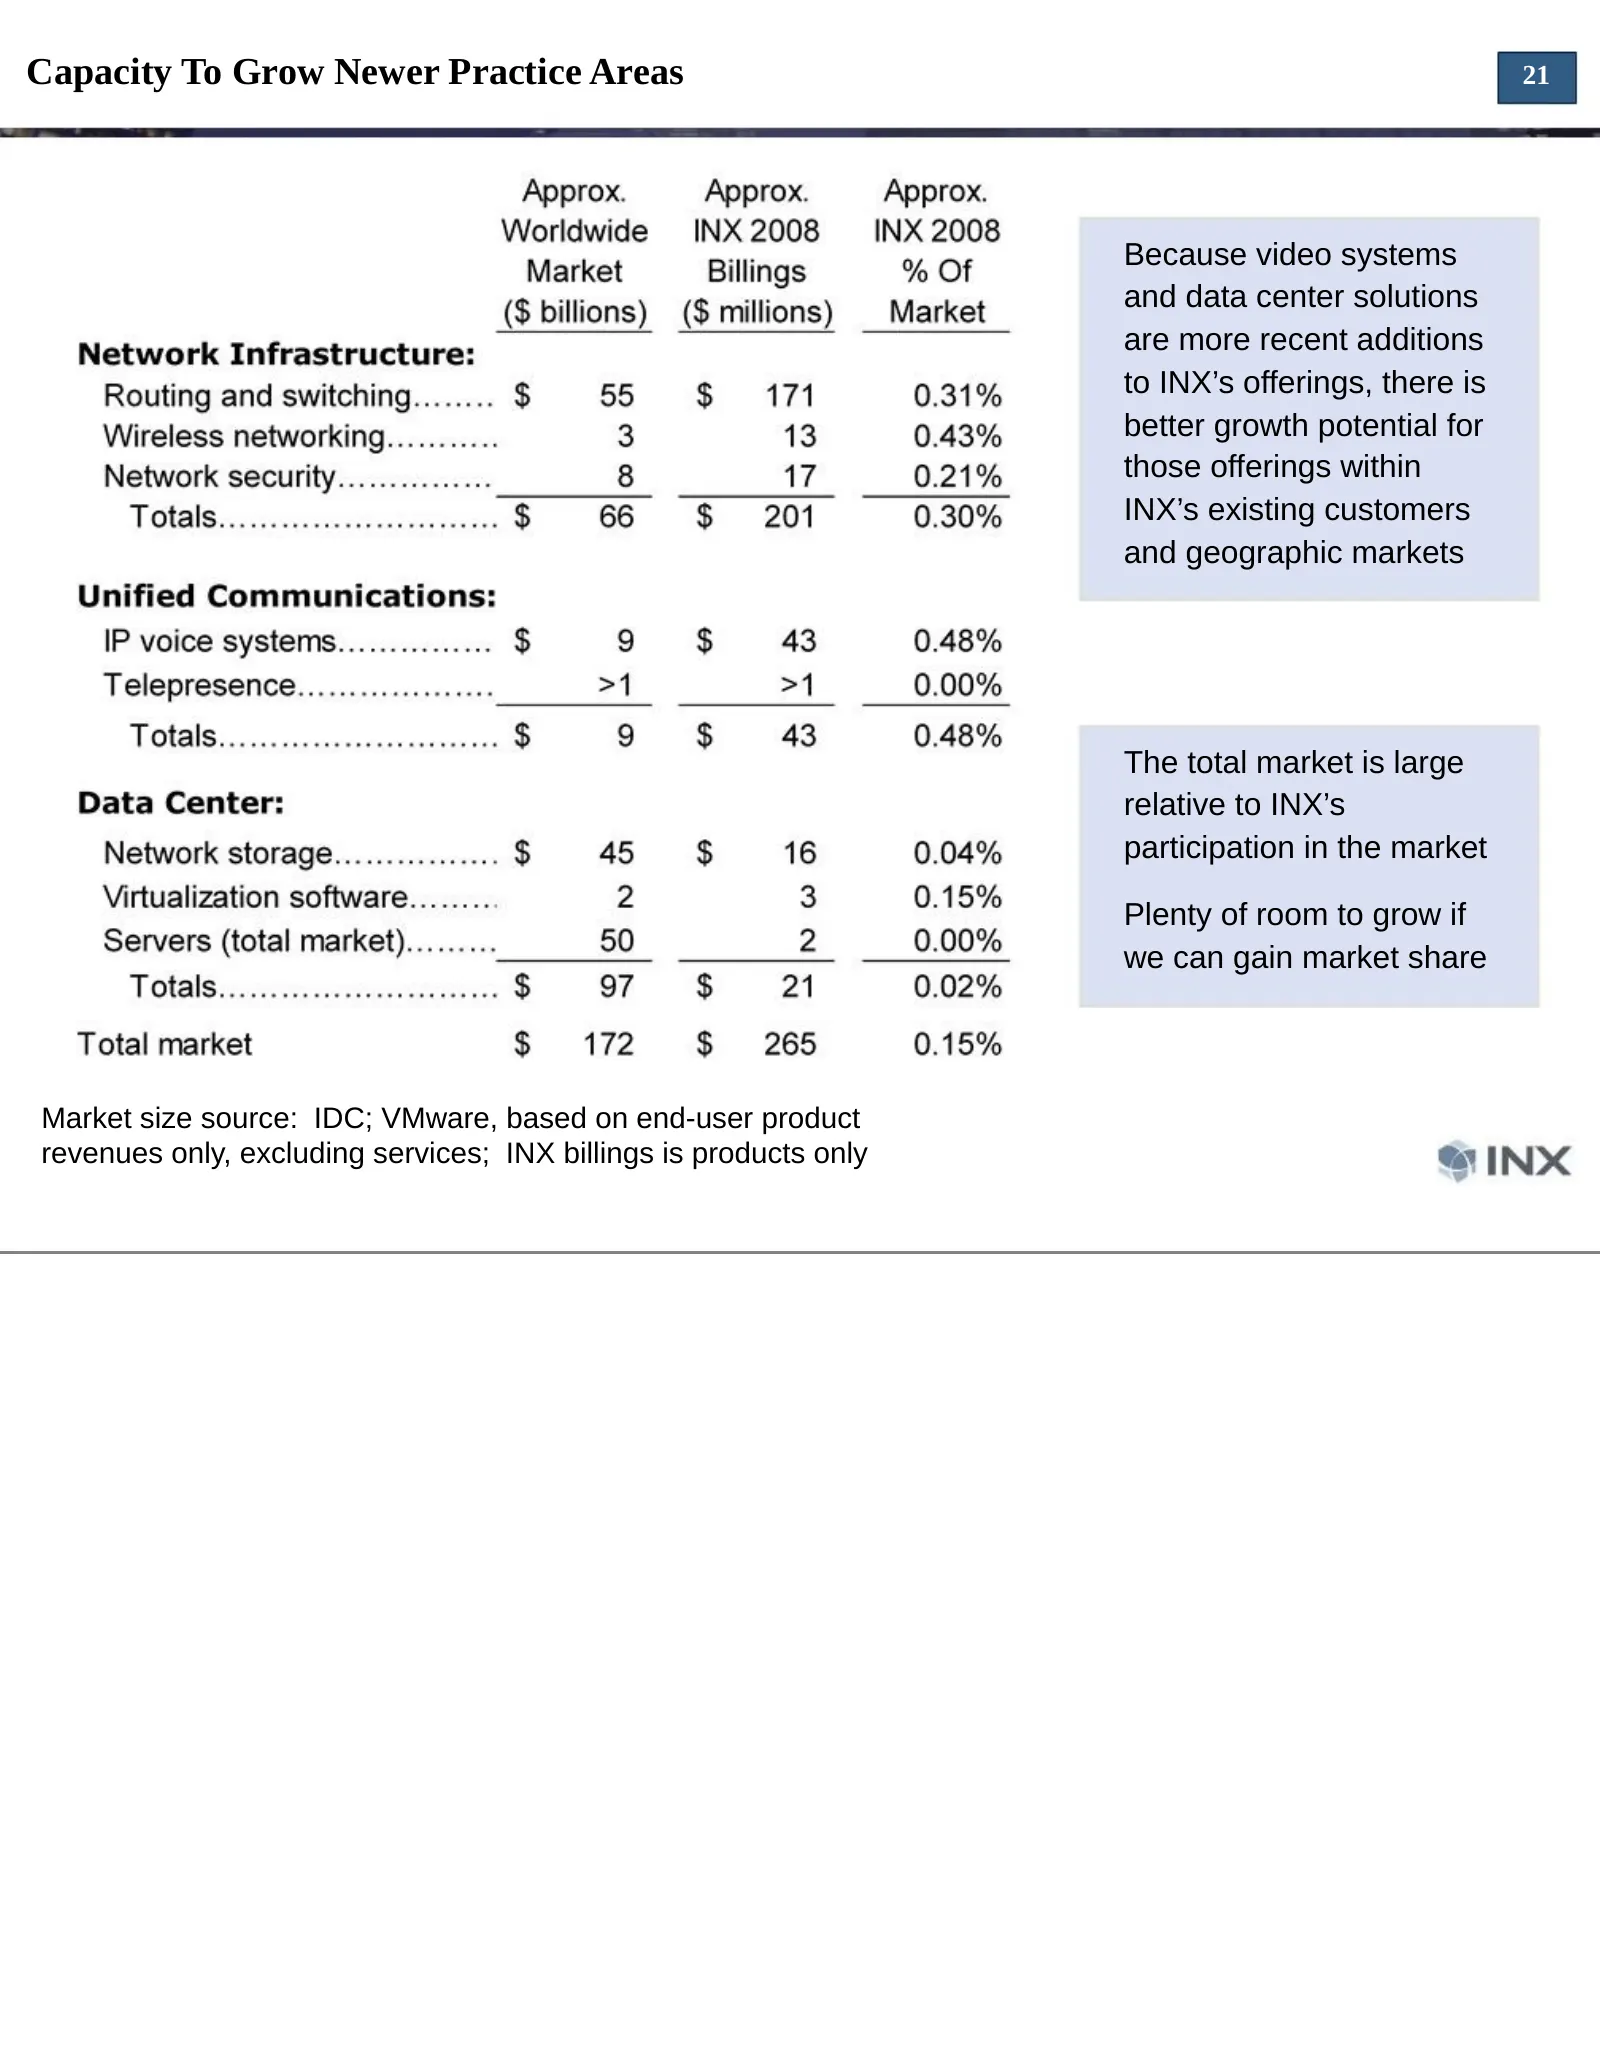
Slide 21: Capacity To Grow Newer Practice Areas
Capacity To Grow Newer Practice Areas 21 Because video systems and data center solutions are more recent additions to INX’s offerings, there is better growth potential for those offerings within INX’s existing customers and geographic markets The total market is large relative to INX’s participation
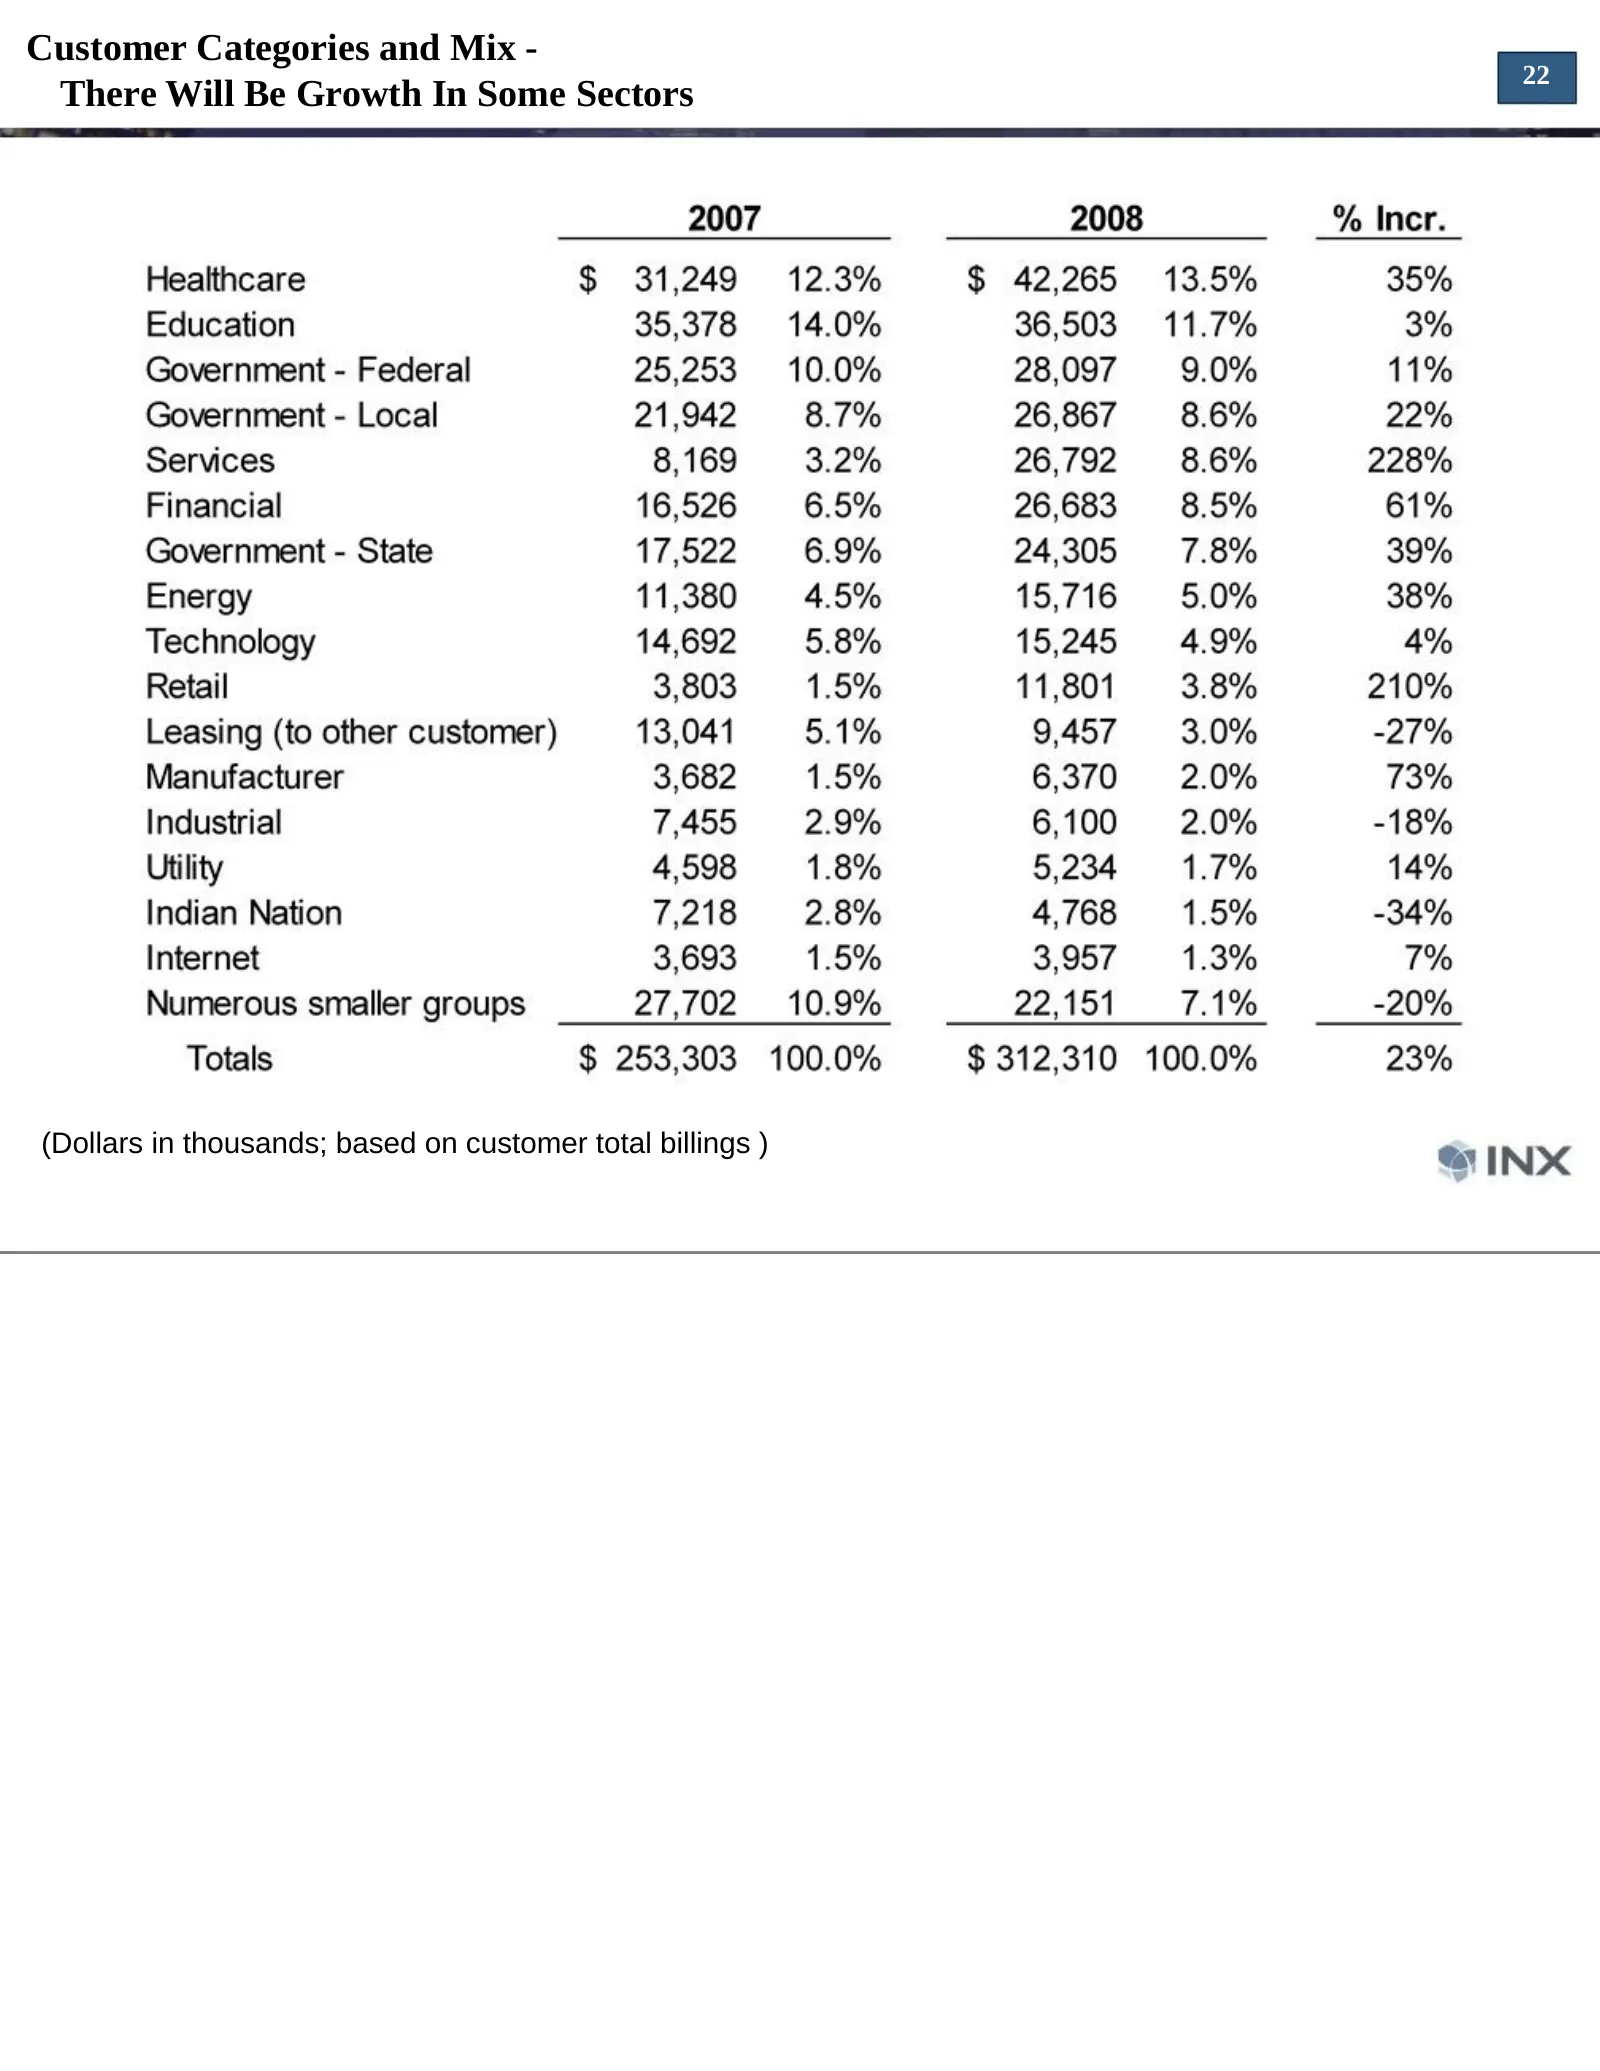
Slide 22: Customer Categories and Mix - There Will Be Growth In Some Sectors
Customer Categories and Mix - 22 There Will Be Growth In Some Sectors (Dollars in thousands; based on customer total billings )
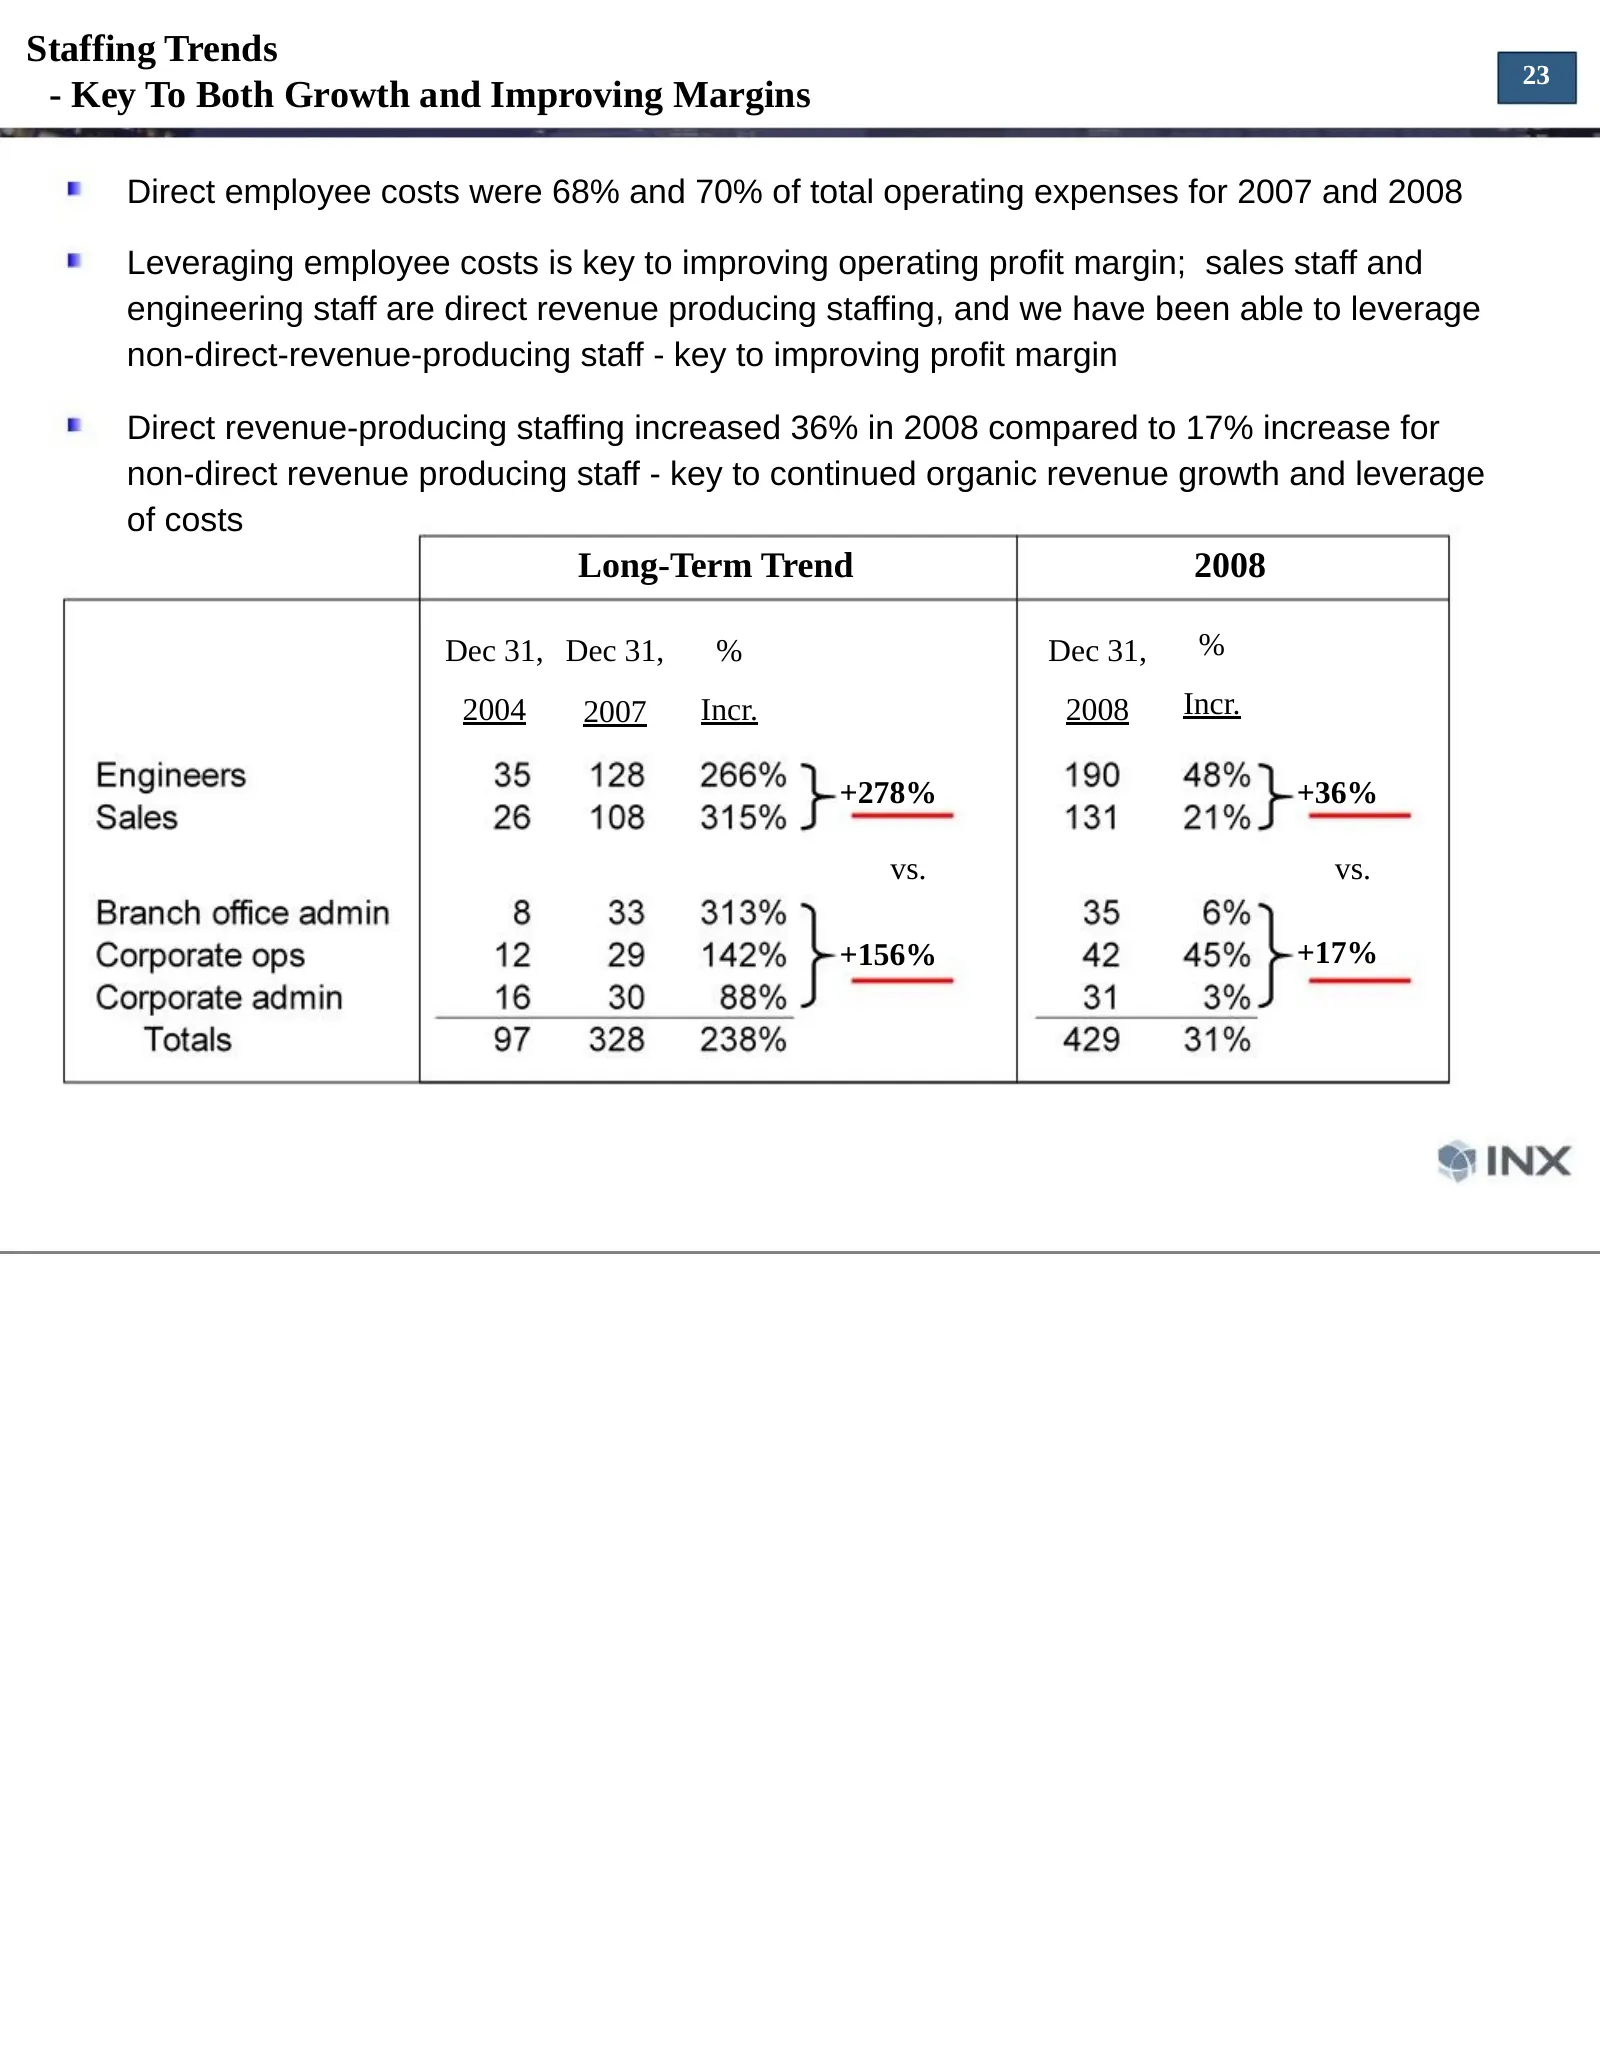
Slide 23: Staffing Trends - Key To Both Growth and Improving Margins
Staffing Trends 23 - Key To Both Growth and Improving Margins Direct employee costs were 68% and 70% of total operating expenses for 2007 and 2008 Leveraging employee costs is key to improving operating profit margin; sales staff and engineering staff are direct revenue producing staffing, and we ha
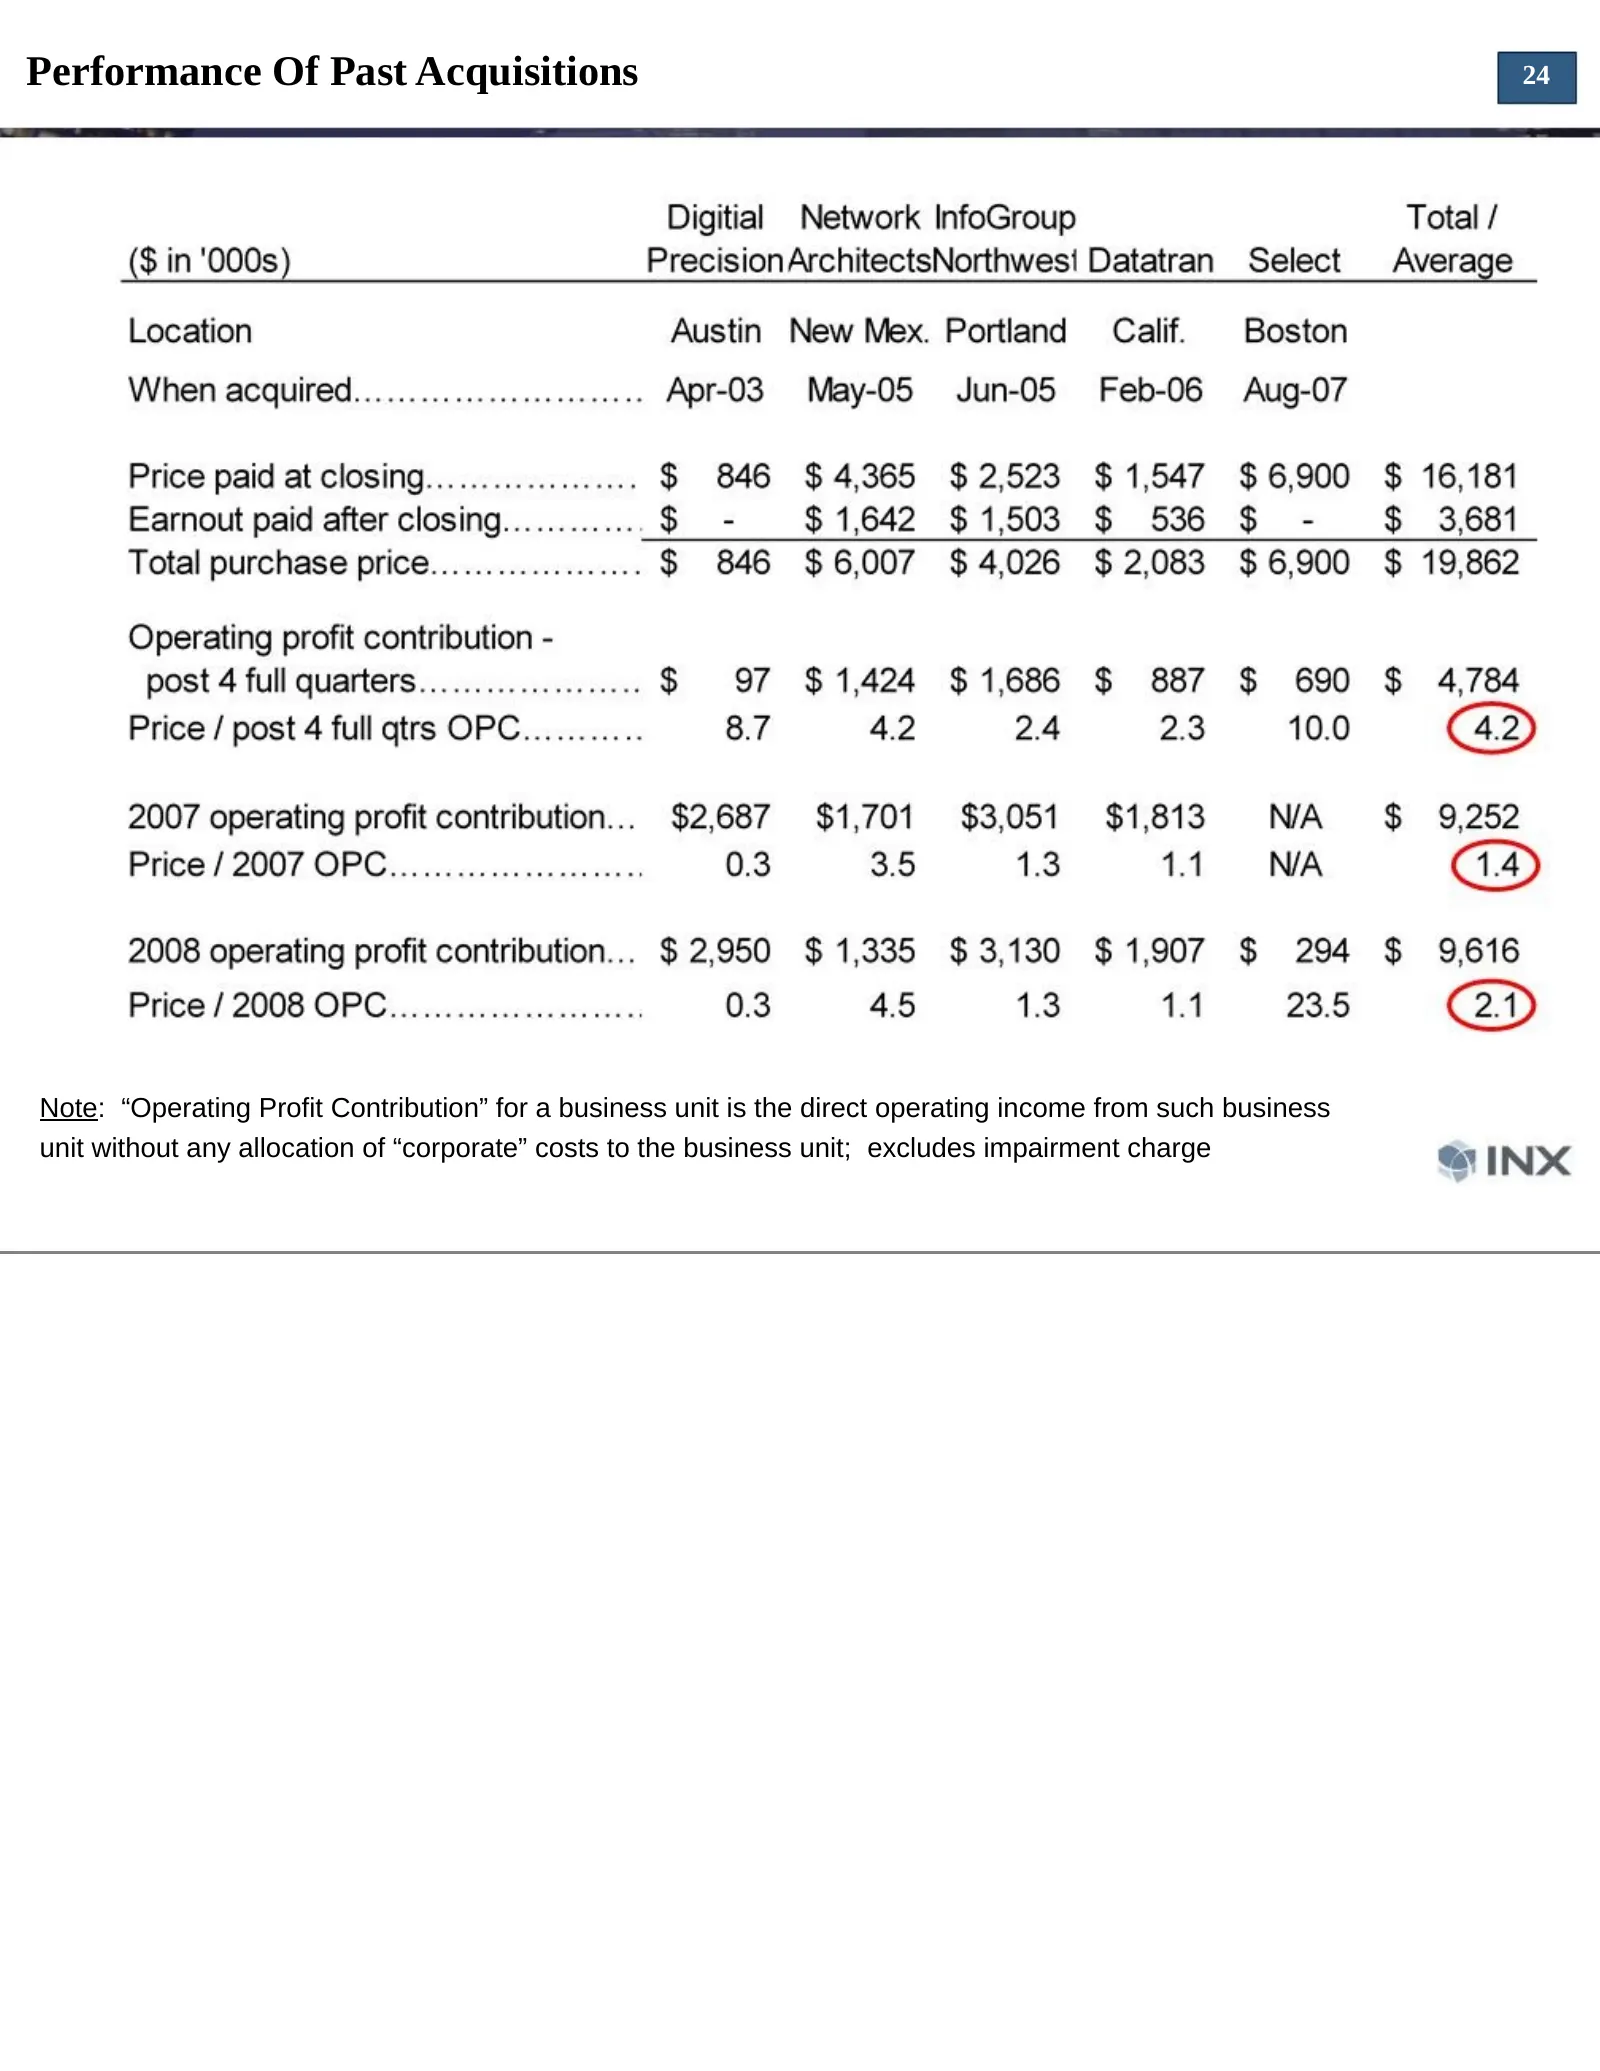
Slide 24: Performance Of Past Acquisitions
Performance Of Past Acquisitions 24 Note: “Operating Profit Contribution” for a business unit is the direct operating income from such business unit without any allocation of “corporate” costs to the business unit; excludes impairment charge
Slide 25: Outlook - Soft Customer Demand Due To Economic Recession
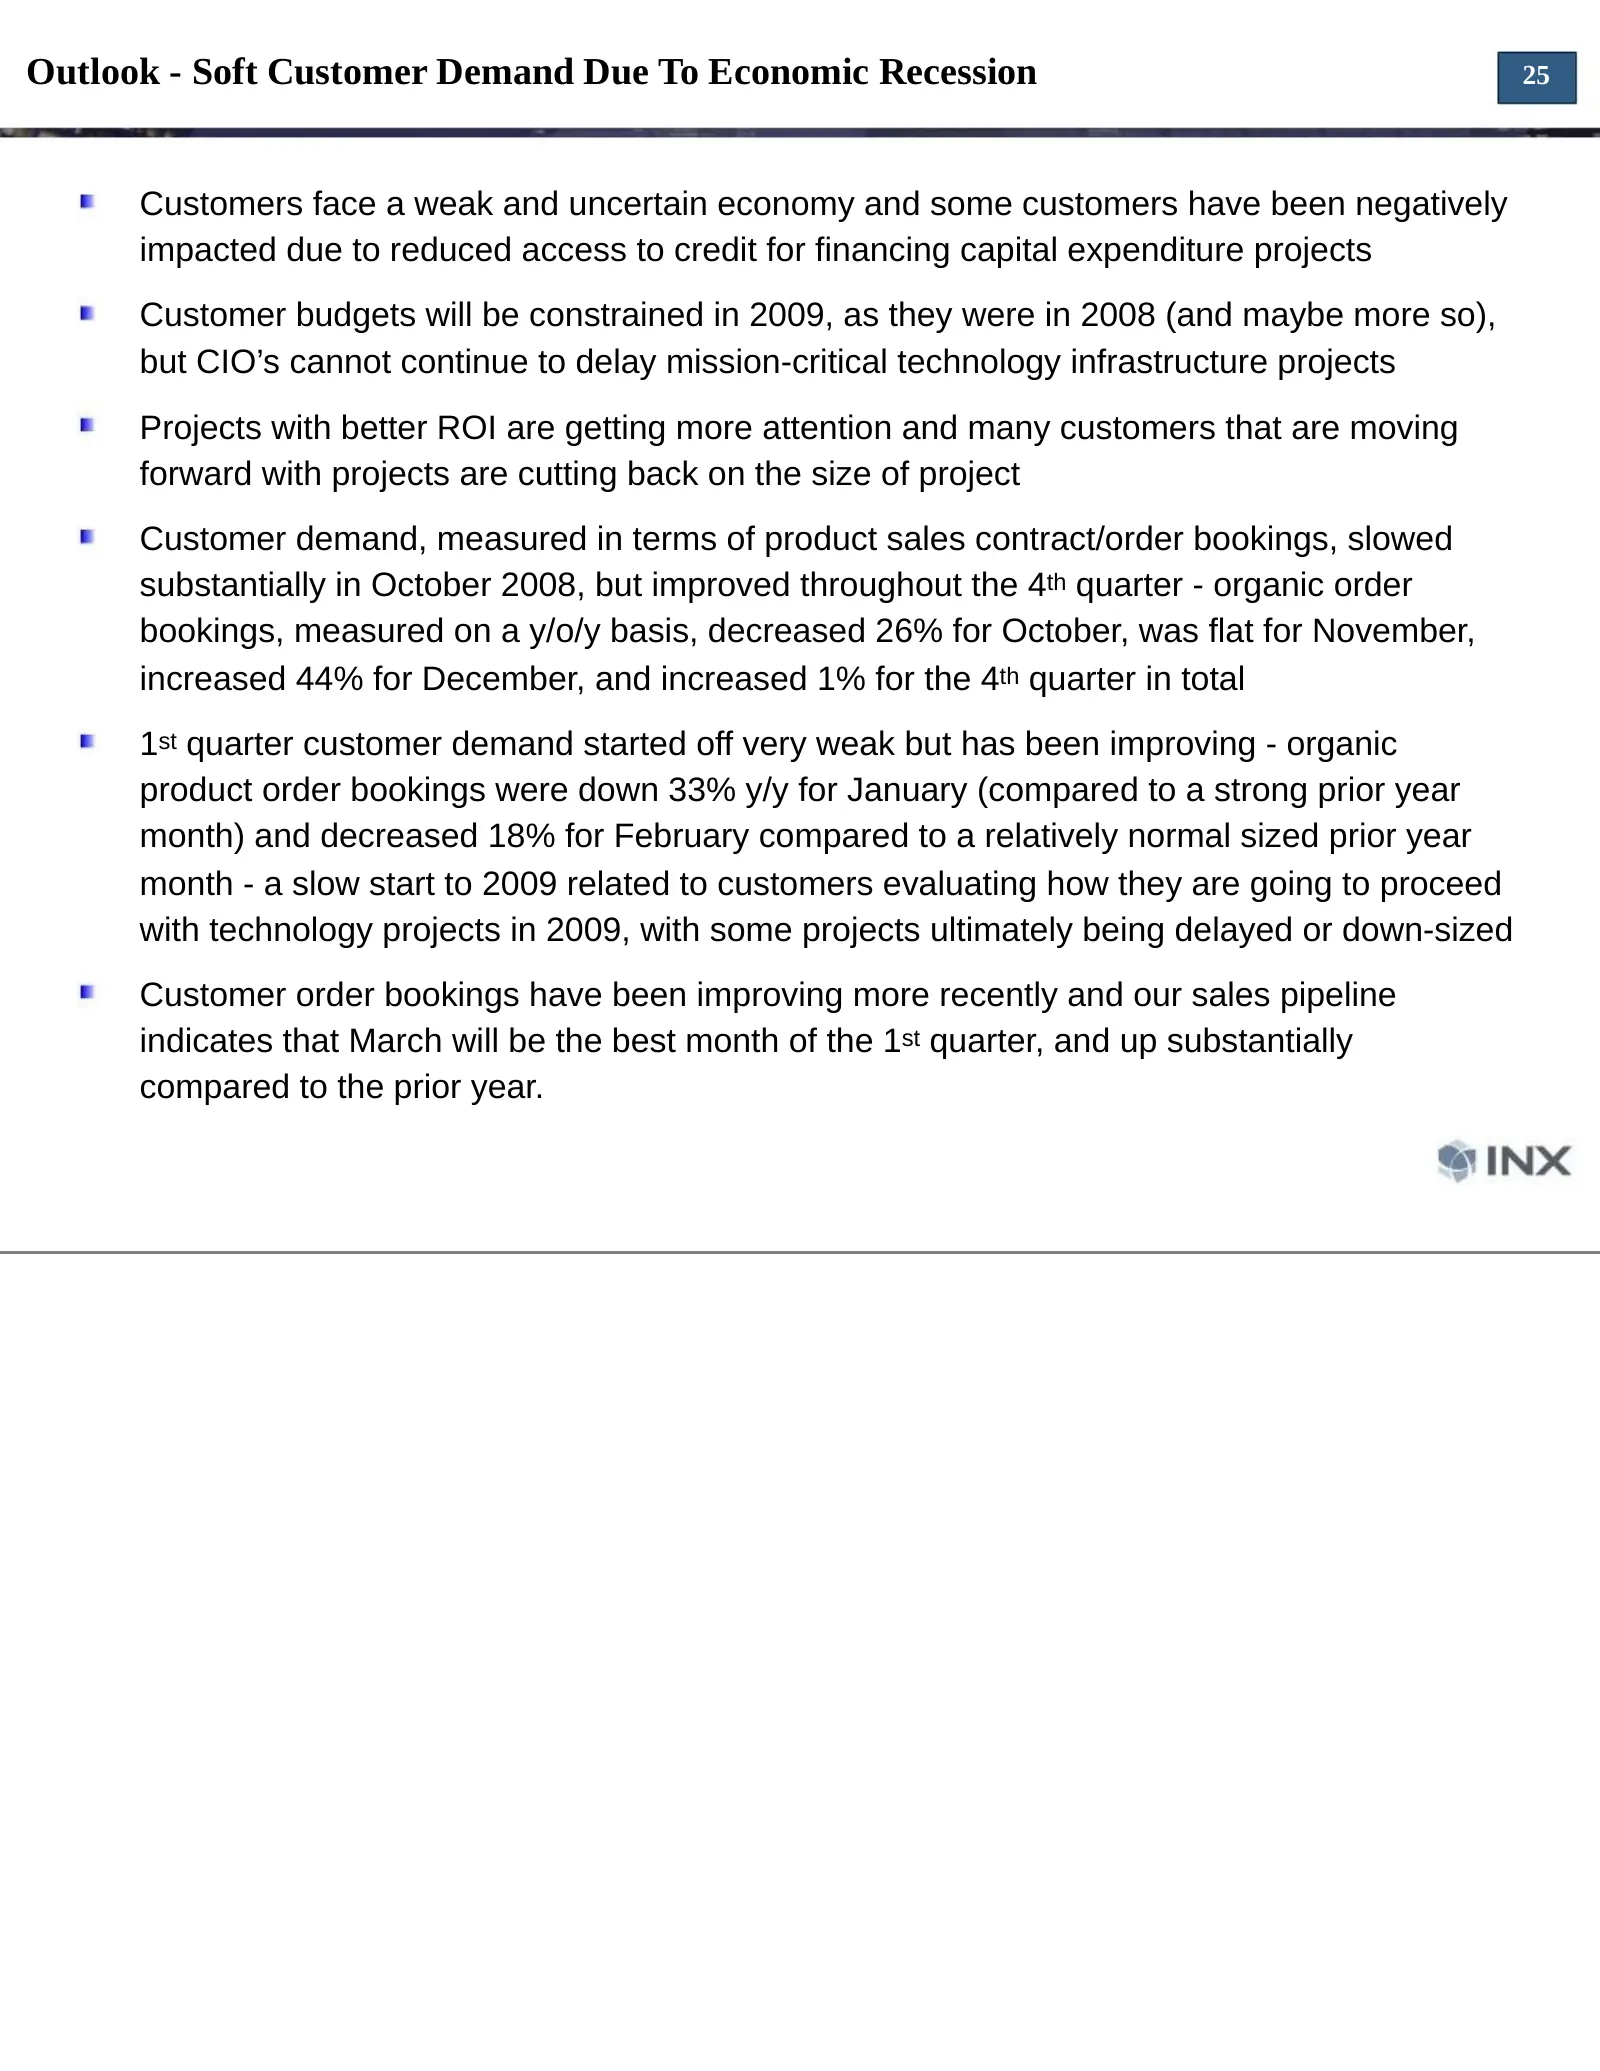
Outlook - Soft Customer Demand Due To Economic Recession 25 Customers face a weak and uncertain economy and some customers have been negatively impacted due to reduced access to credit for financing capital expenditure projects Customer budgets will be constrained in 2009, as they were in 2008 (and
Slide 26: Financial Outlook For 1Q-2009
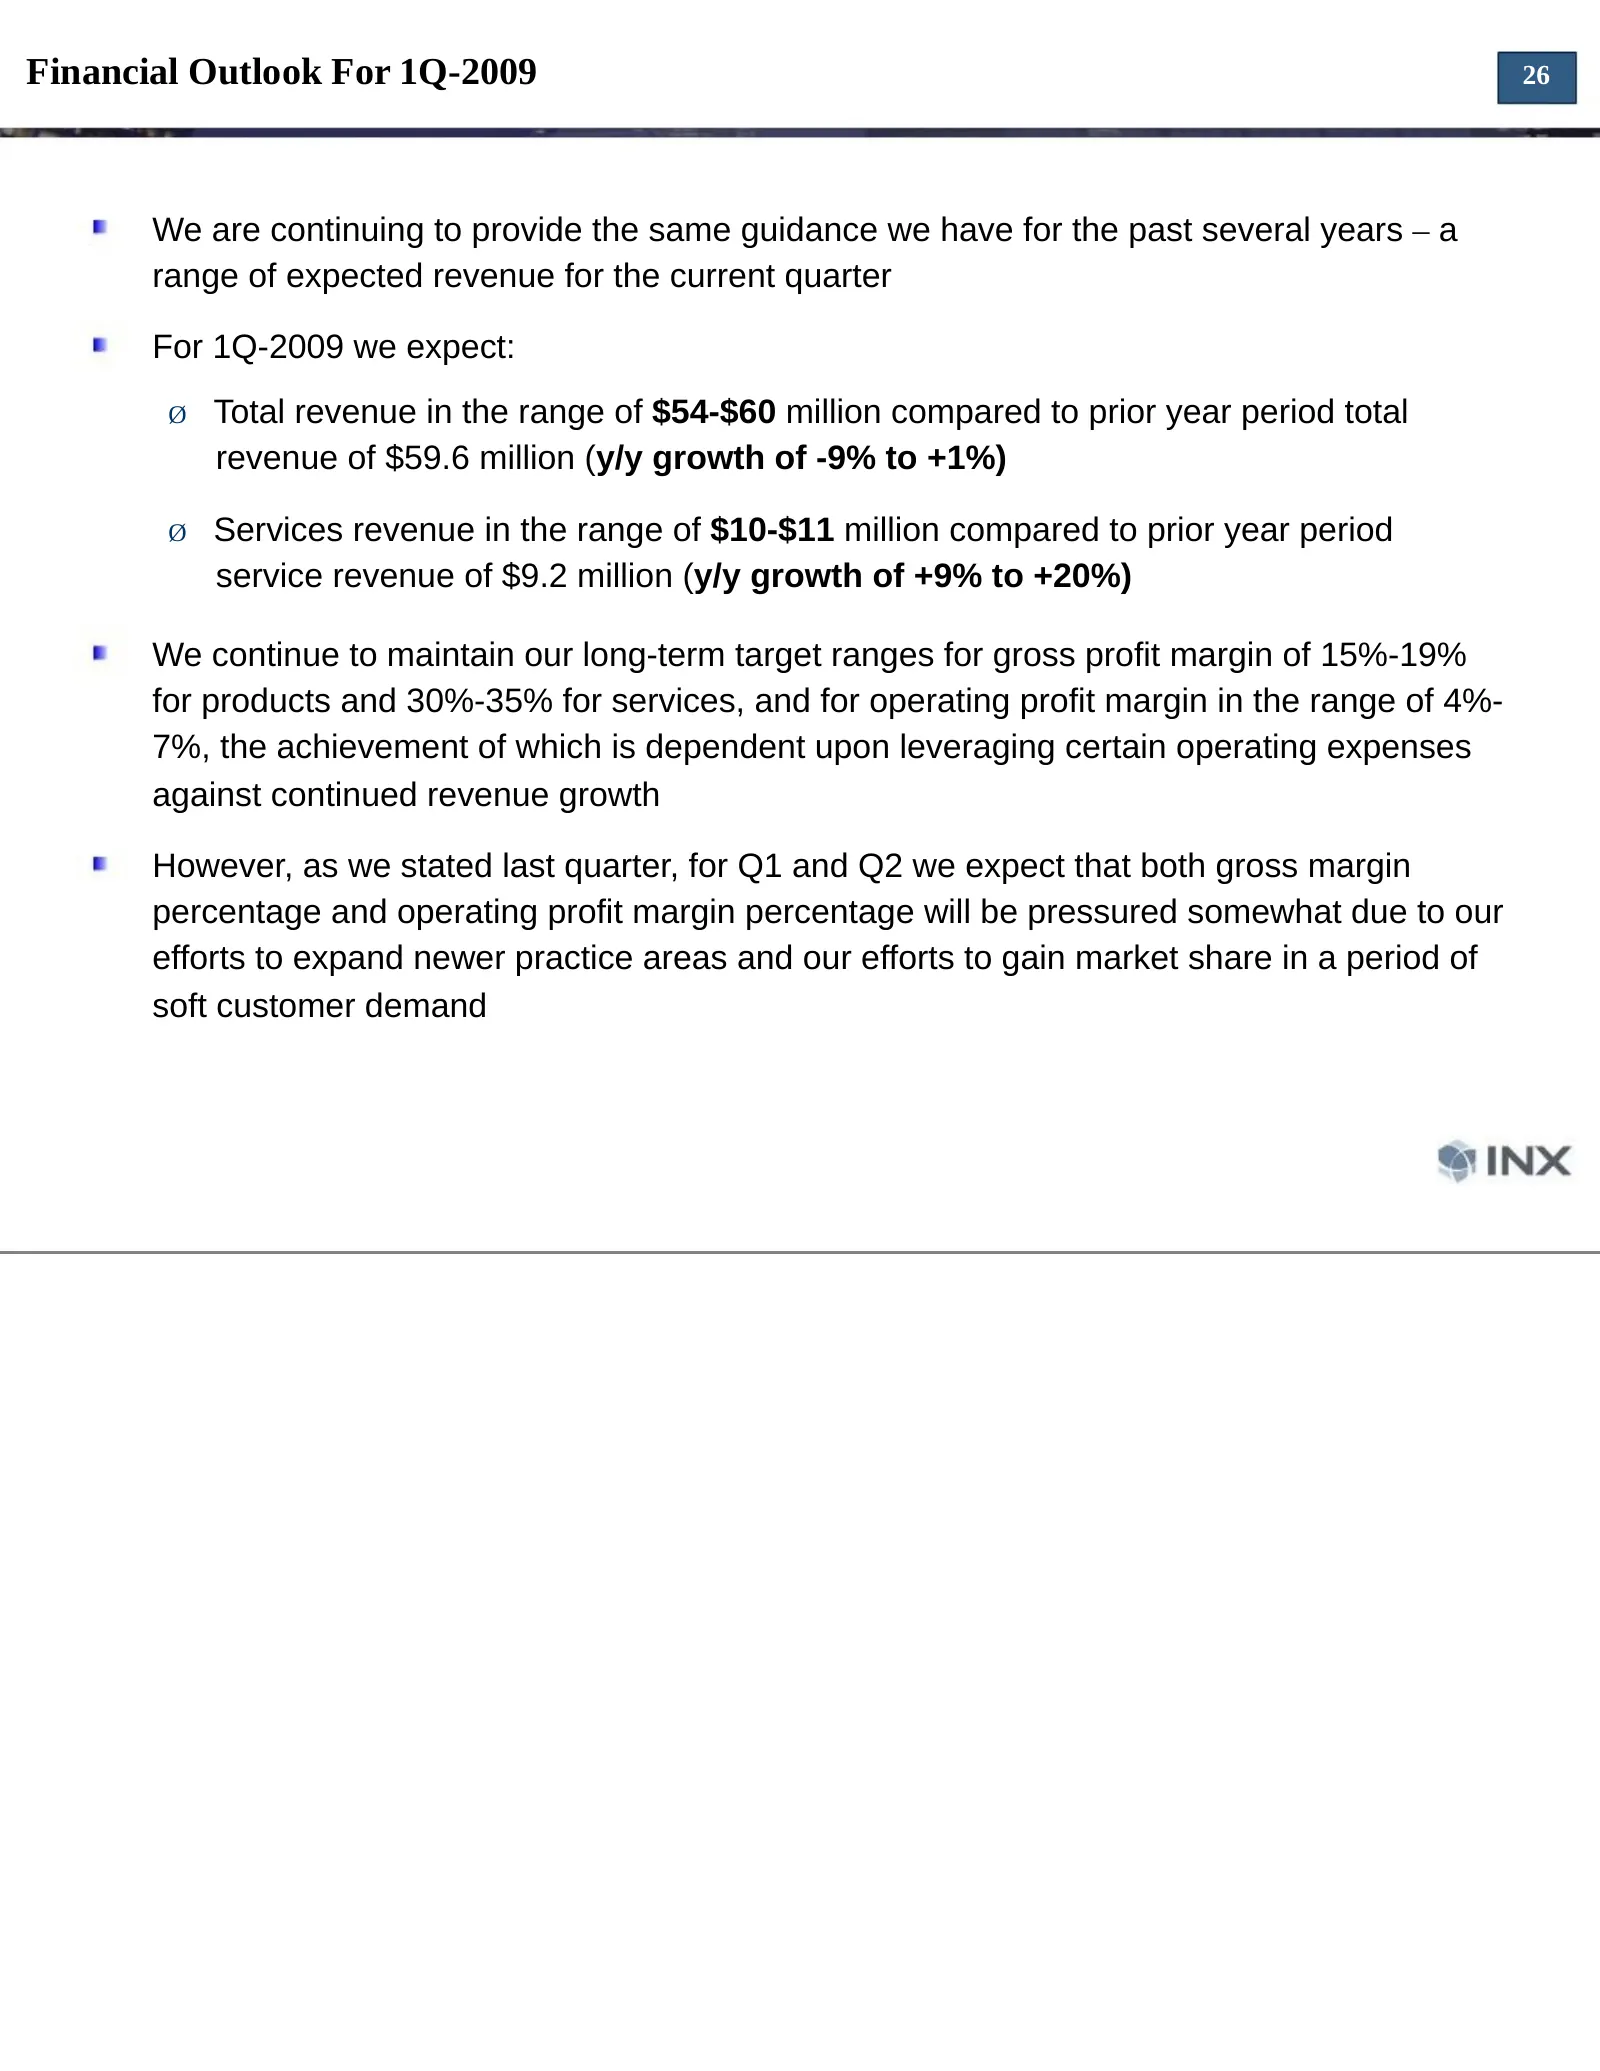
Financial Outlook For 1Q-2009 26 We are continuing to provide the same guidance we have for the past several years – a range of expected revenue for the current quarter For 1Q-2009 we expect: Ø Total revenue in the range of $54-$60 million compared to prior year period total revenue of $59.6 million
Slide 27: Summary / Highlights
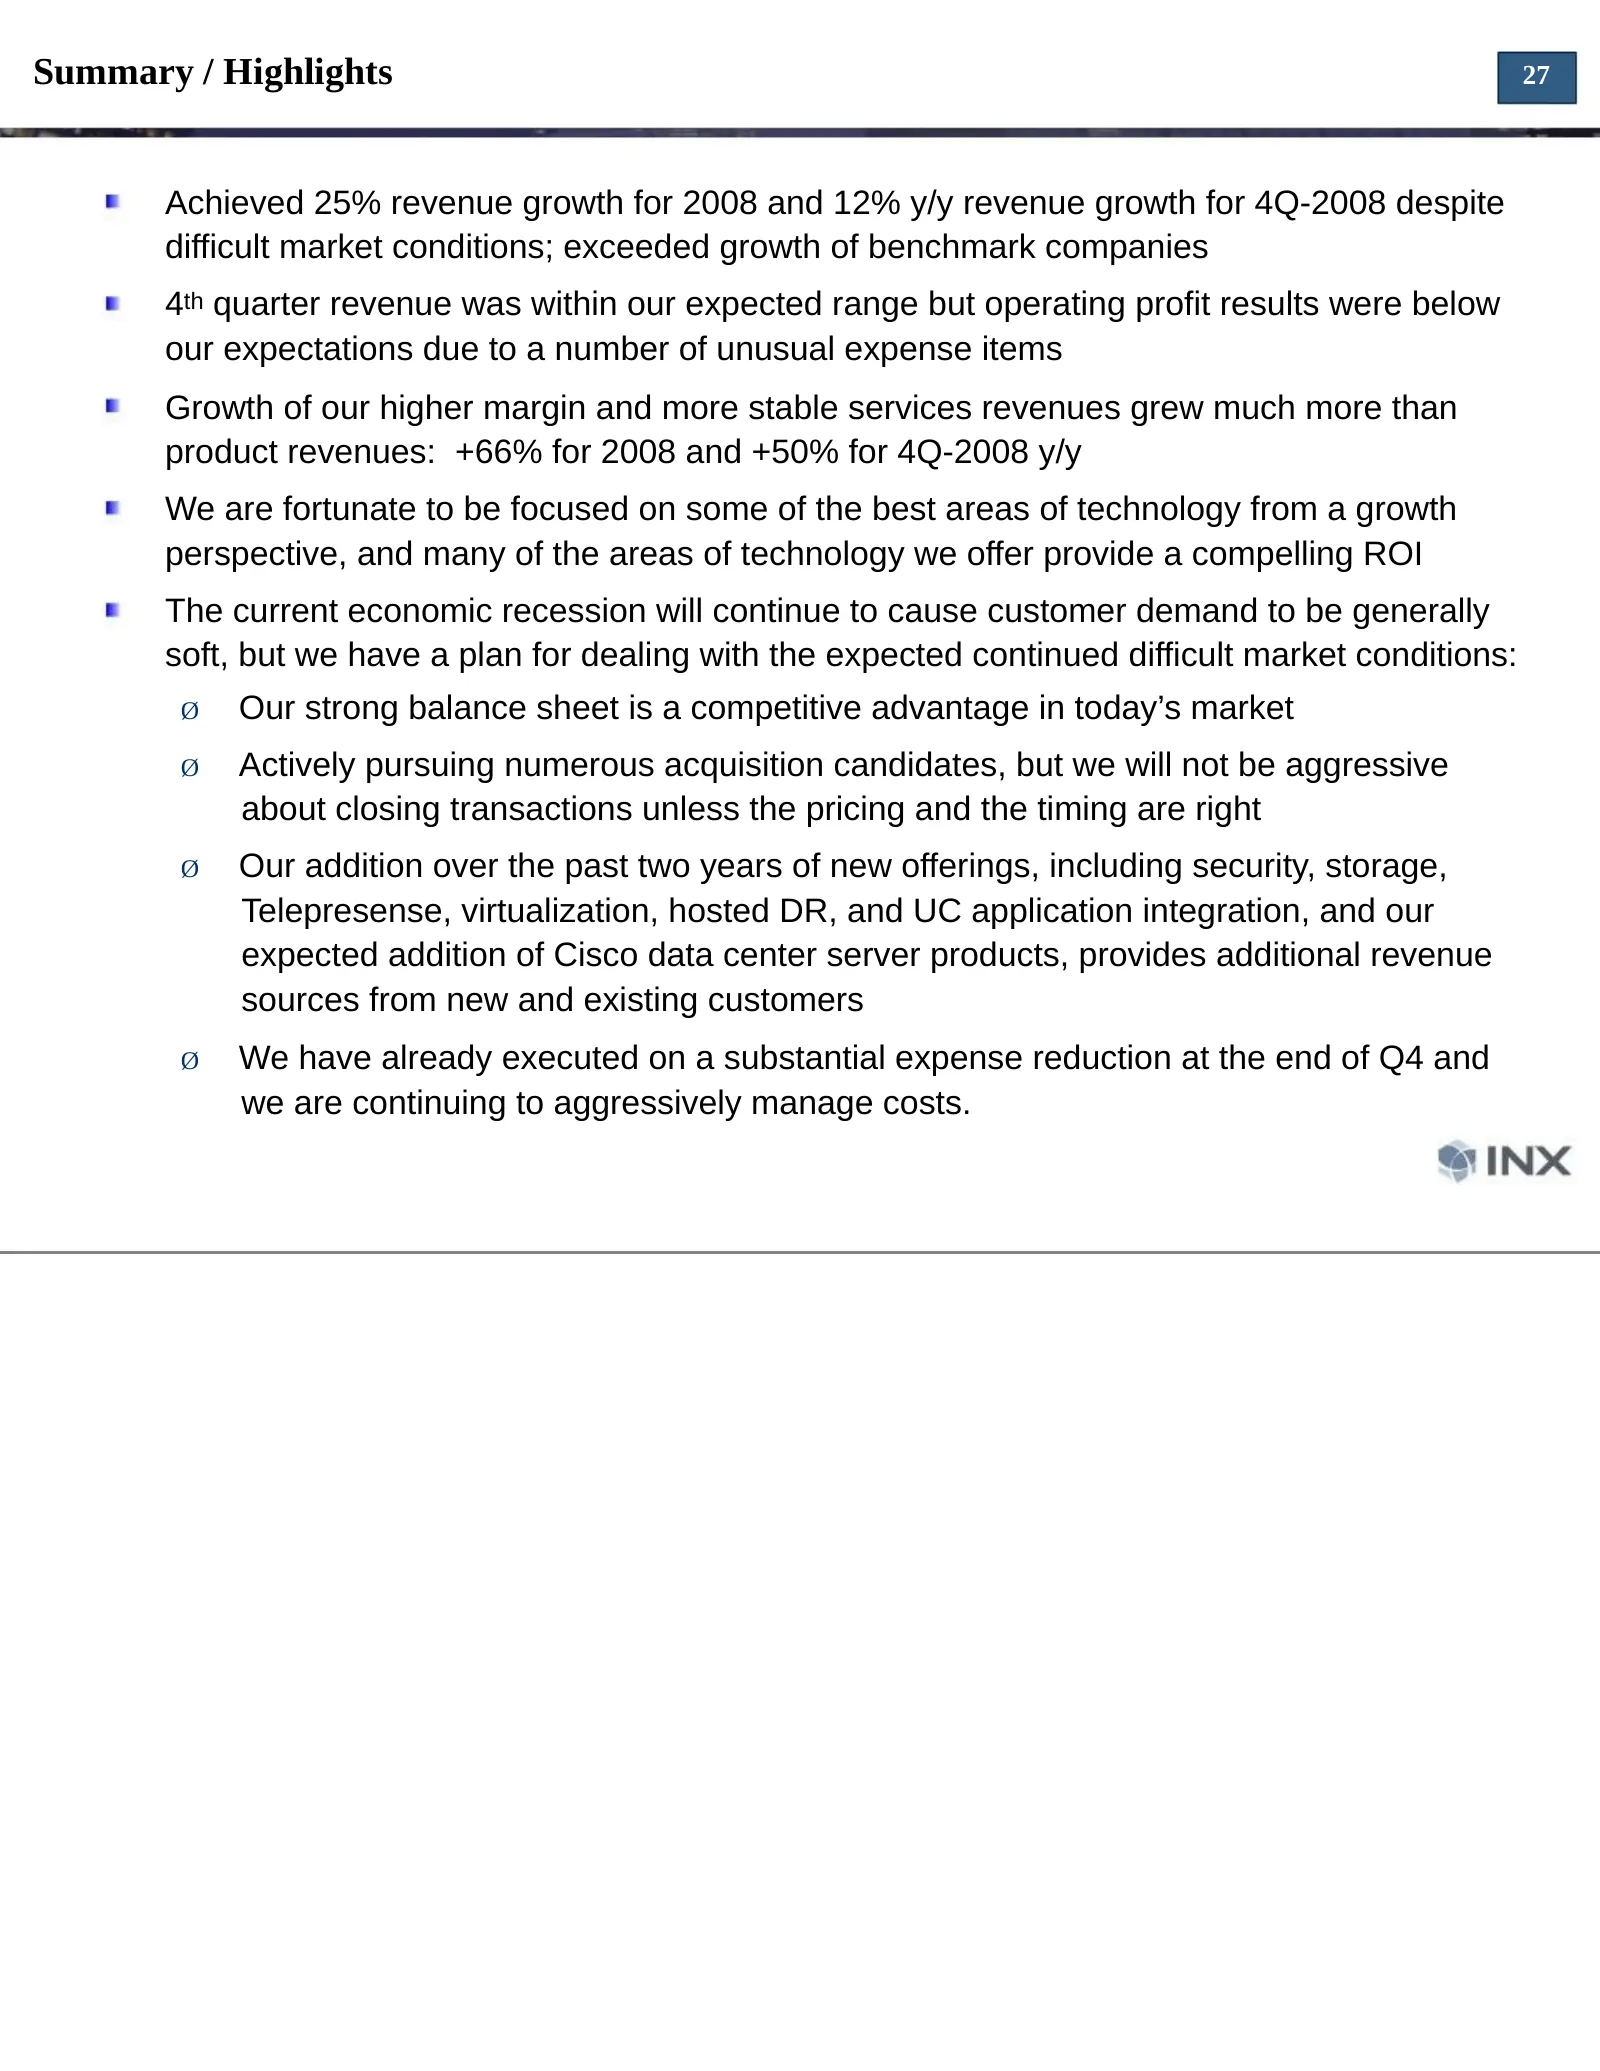
Summary / Highlights 27 Achieved 25% revenue growth for 2008 and 12% y/y revenue growth for 4Q-2008 despite difficult market conditions; exceeded growth of benchmark companies 4th quarter revenue was within our expected range but operating profit results were below our expectations due to a number o

Slide 28
Source: SEC EDGAR · 8-K filed Mar 5, 2009
More decks from INX Inc
 Merger or Acquisition (November 2011)10 slides · Nov 1, 2011
 Rodman & Renshaw Global Investment Conference 201120 slides · Sep 13, 2011
 Shareholder Meeting (July 2011)15 slides · Jul 19, 2011
 Q1 2011 Earnings Presentation15 slides · Jul 13, 2011
 FY2010 Earnings Presentation28 slides · Jun 6, 2011
 Corporate Update (November 2010)24 slides · Nov 10, 2010