JCDecaux SE · EURONEXT:DEC
JCDecaux — FY2013 Earnings Presentation
49 slides from JCDecaux's earnings presentation, Mar 6, 2014
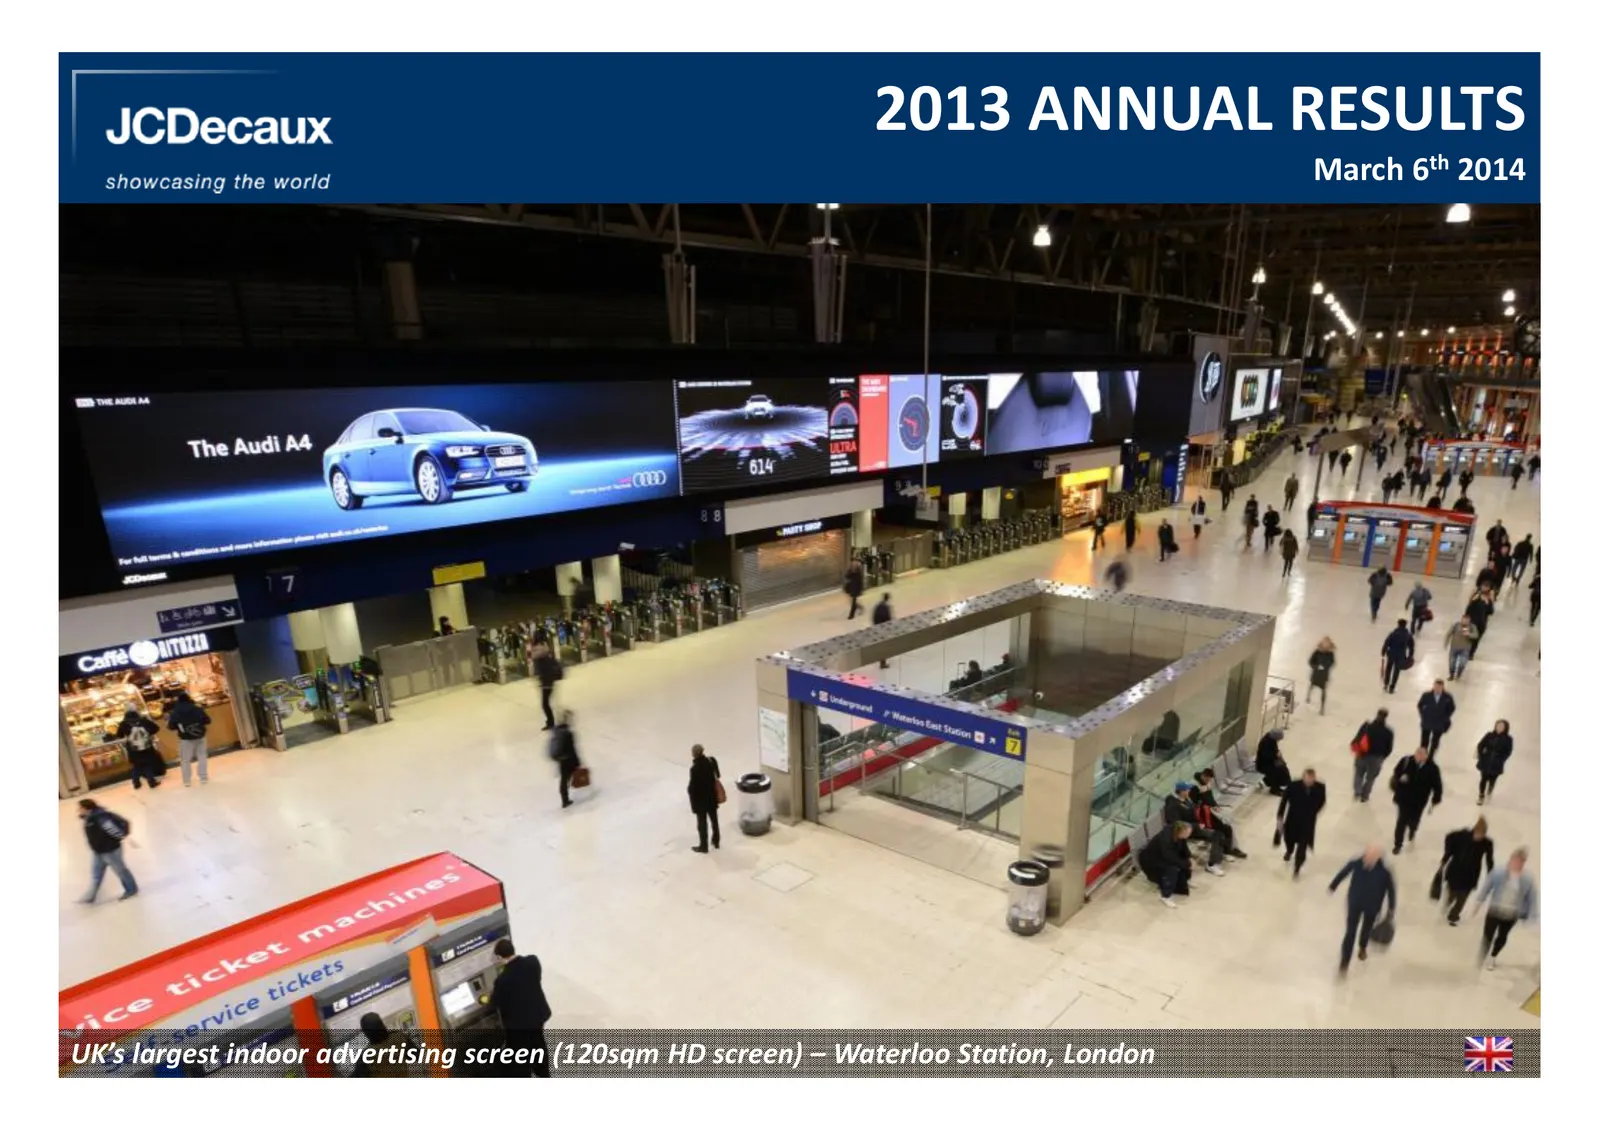
Slide 1: 2013 Annual Results
2013 ANNUAL RESULTS March 6th 2014 UK’s largest indoor advertising screen (120sqm HD screen) – Waterloo Station, London

Slide 2: Business Overview
BUSINESS OVERVIEW 2
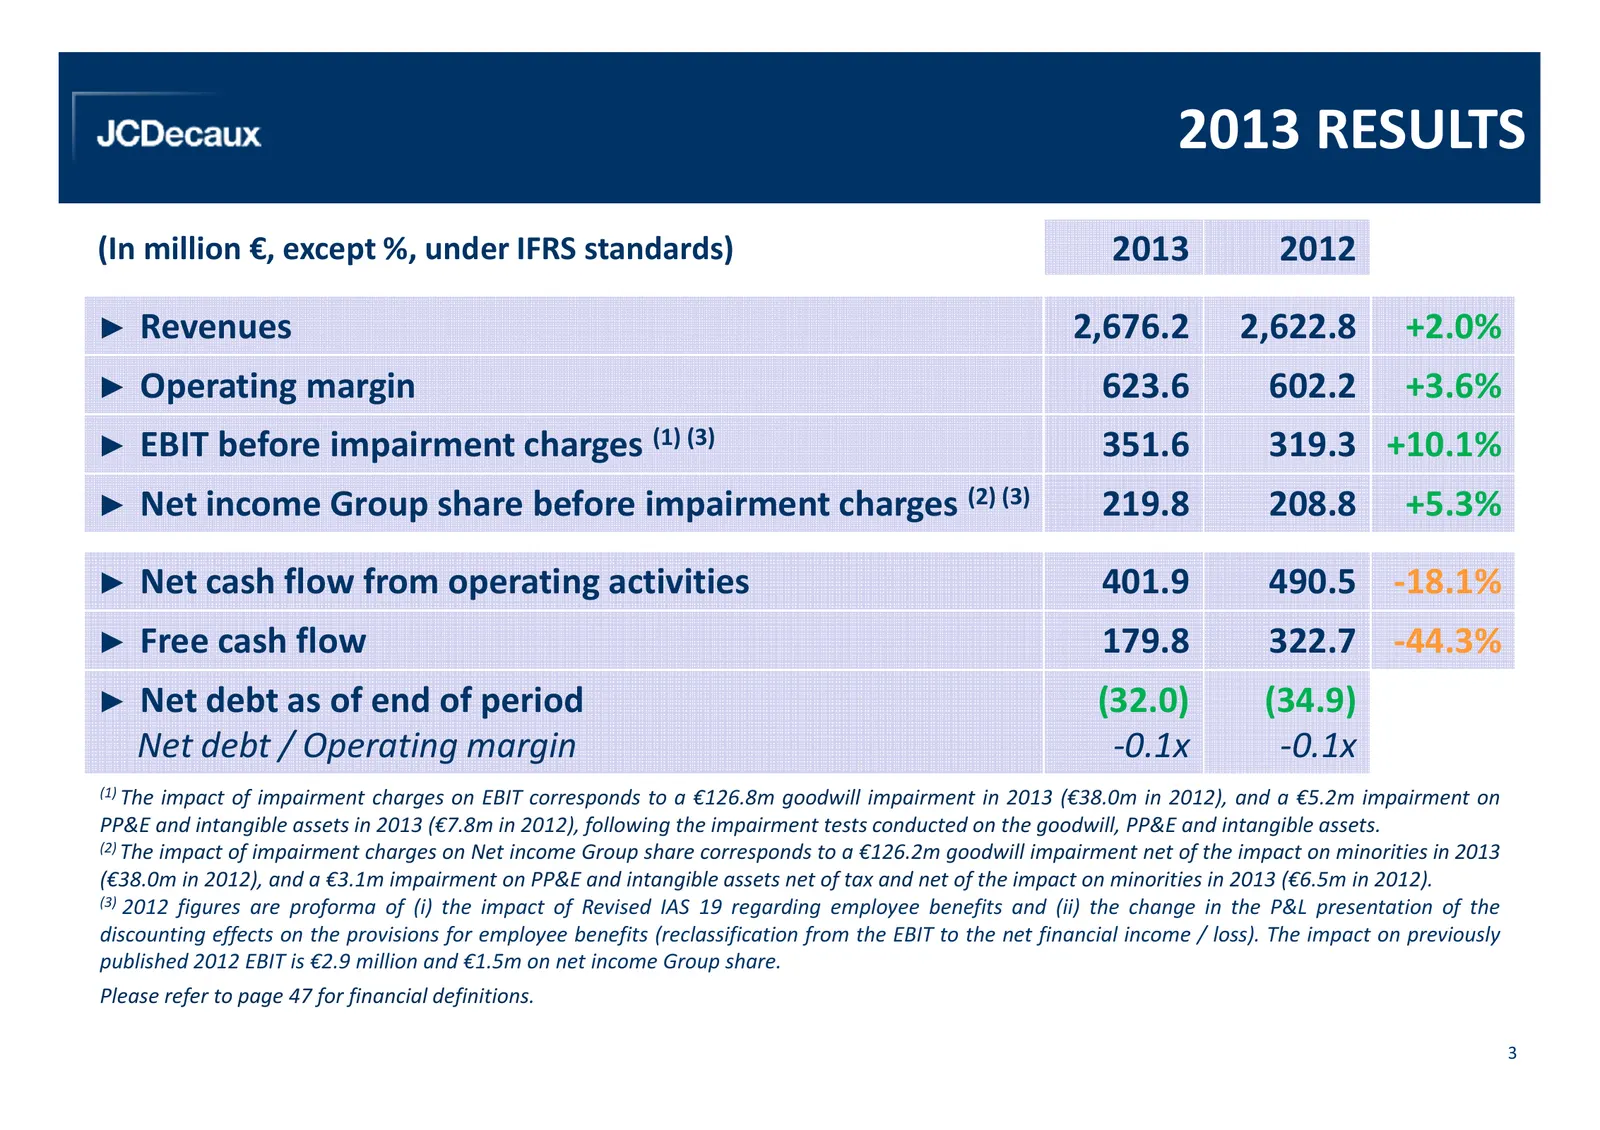
Slide 3: 2013 Results
2013 RESULTS (In million €, except %, under IFRS standards) 2013 2012 ► Revenues 2,676.2 2,622.8 +2.0% ► Operating margin 623.6 602.2 +3.6% ► EBIT before impairment charges (1) (3) 351.6 319.3 +10.1% ► Net income Group share before impairment charges (2) (3) 219.8 208.8 +5.3% ► Net cash flow from op
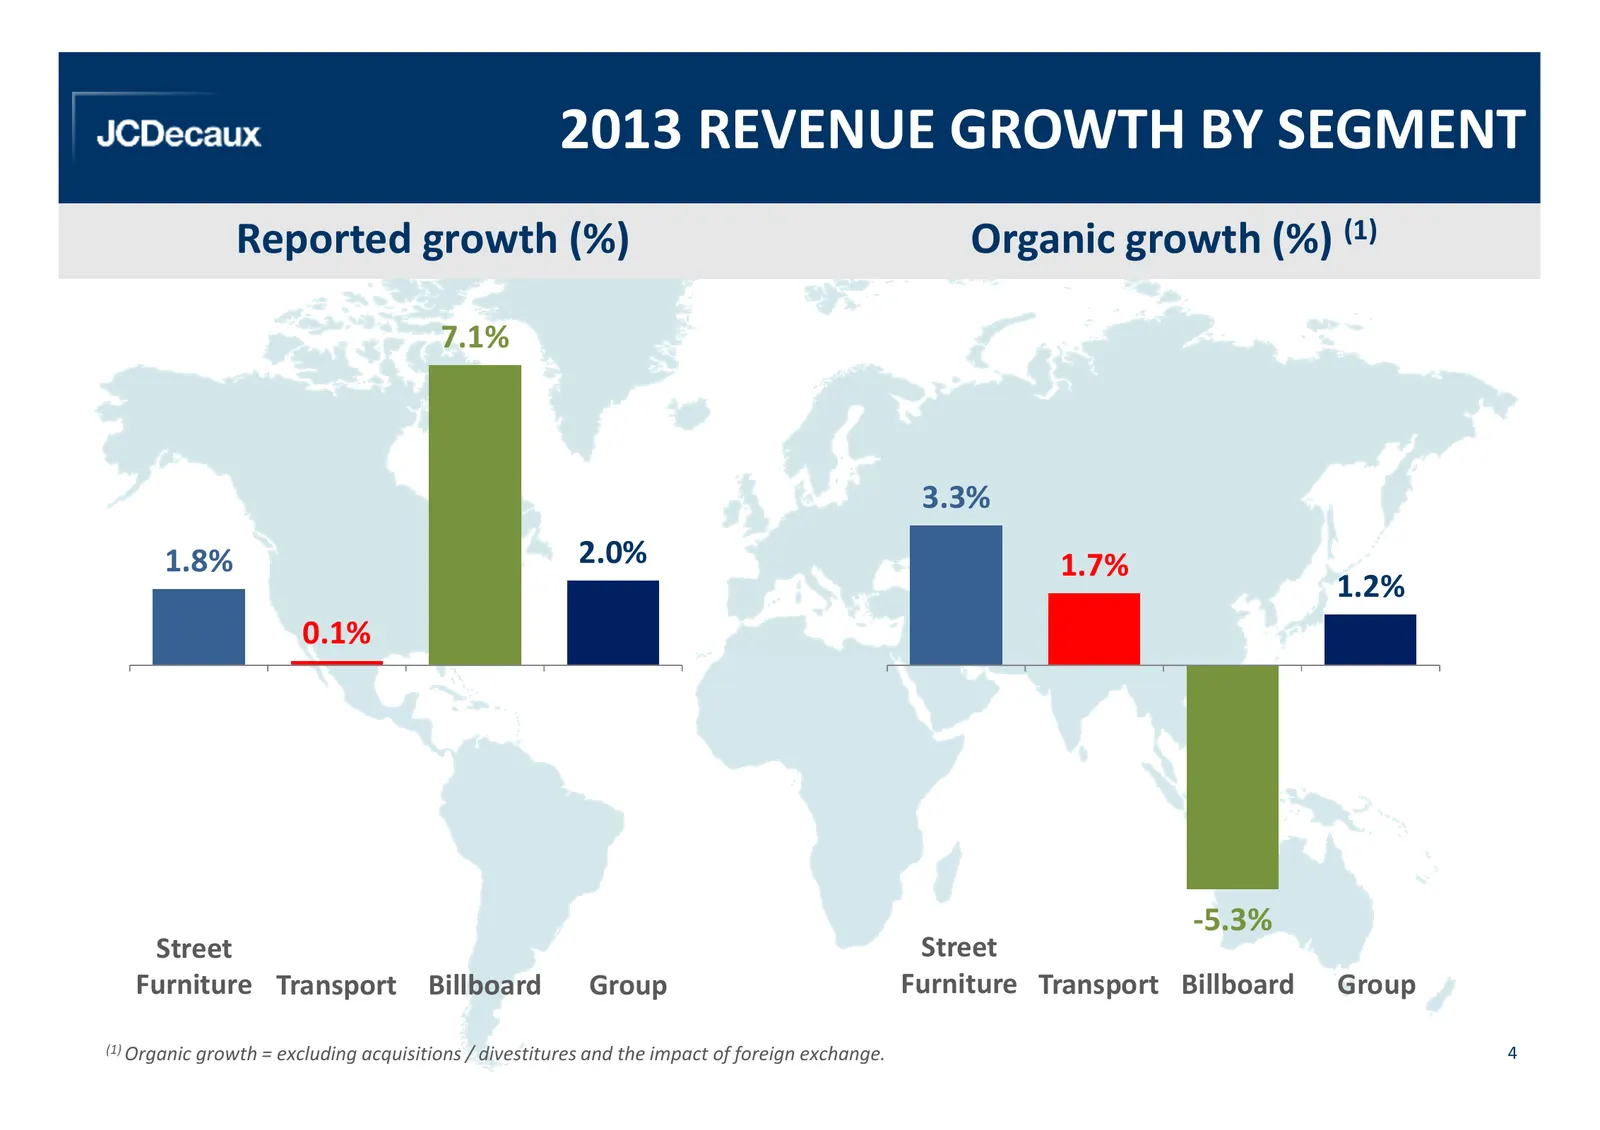
Slide 4: 2013 Revenue Growth by Segment
2013 REVENUE GROWTH BY SEGMENT Reported growth (%) Organic growth (%) (1) 7.1% 3.3% 1.8% 2.0% 1.7% 1.2% 0.1% -5.3% Street Street Furniture Transport Billboard Group Furniture Transport Billboard Group (1) Organic growth = excluding acquisitions / divestitures and the impact of foreign exchange. 4
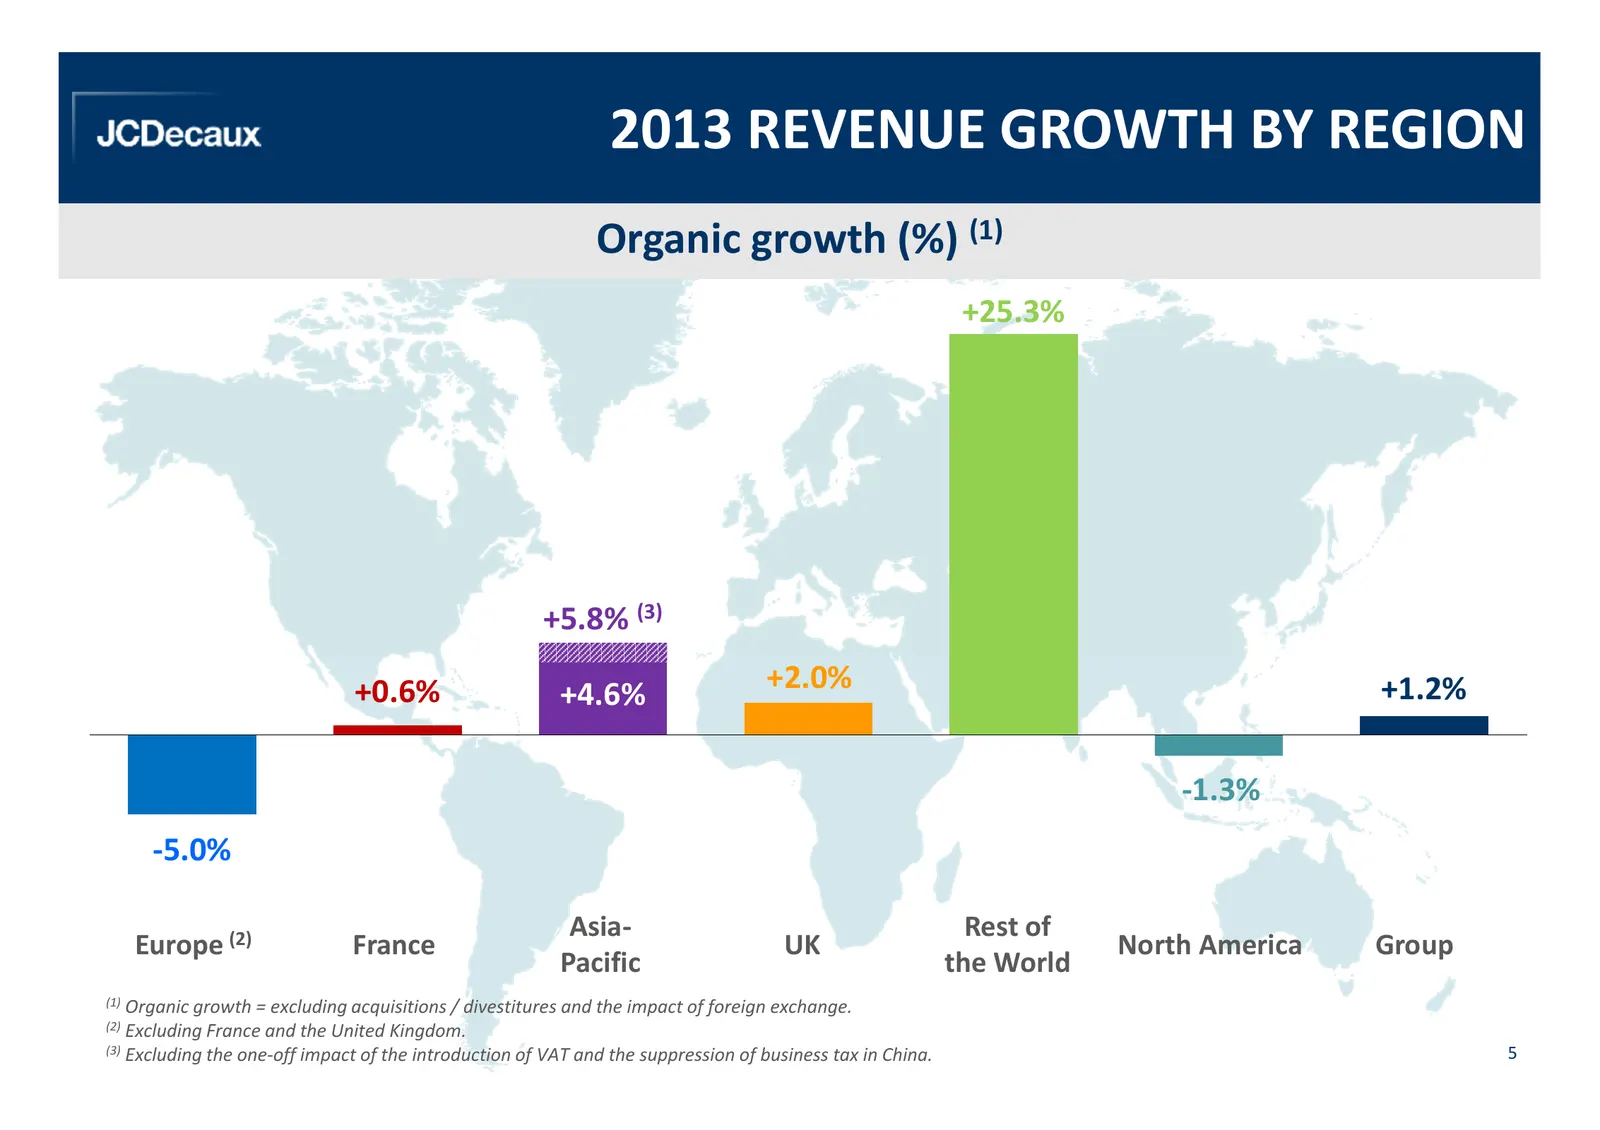
Slide 5: 2013 Revenue Growth by Region
2013 REVENUE GROWTH BY REGION Organic growth (%) (1) +25.3% +5.8% (3) +0.6% +4.6% +2.0% +1.2% -1.3% -5.0% Asia- Rest of Europe (2) France UK North America Group Pacific the World (1) Organic growth = excluding acquisitions / divestitures and the impact of foreign exchange. (2) Excluding France and t
Slide 6: 2013 Revenue Breakdown
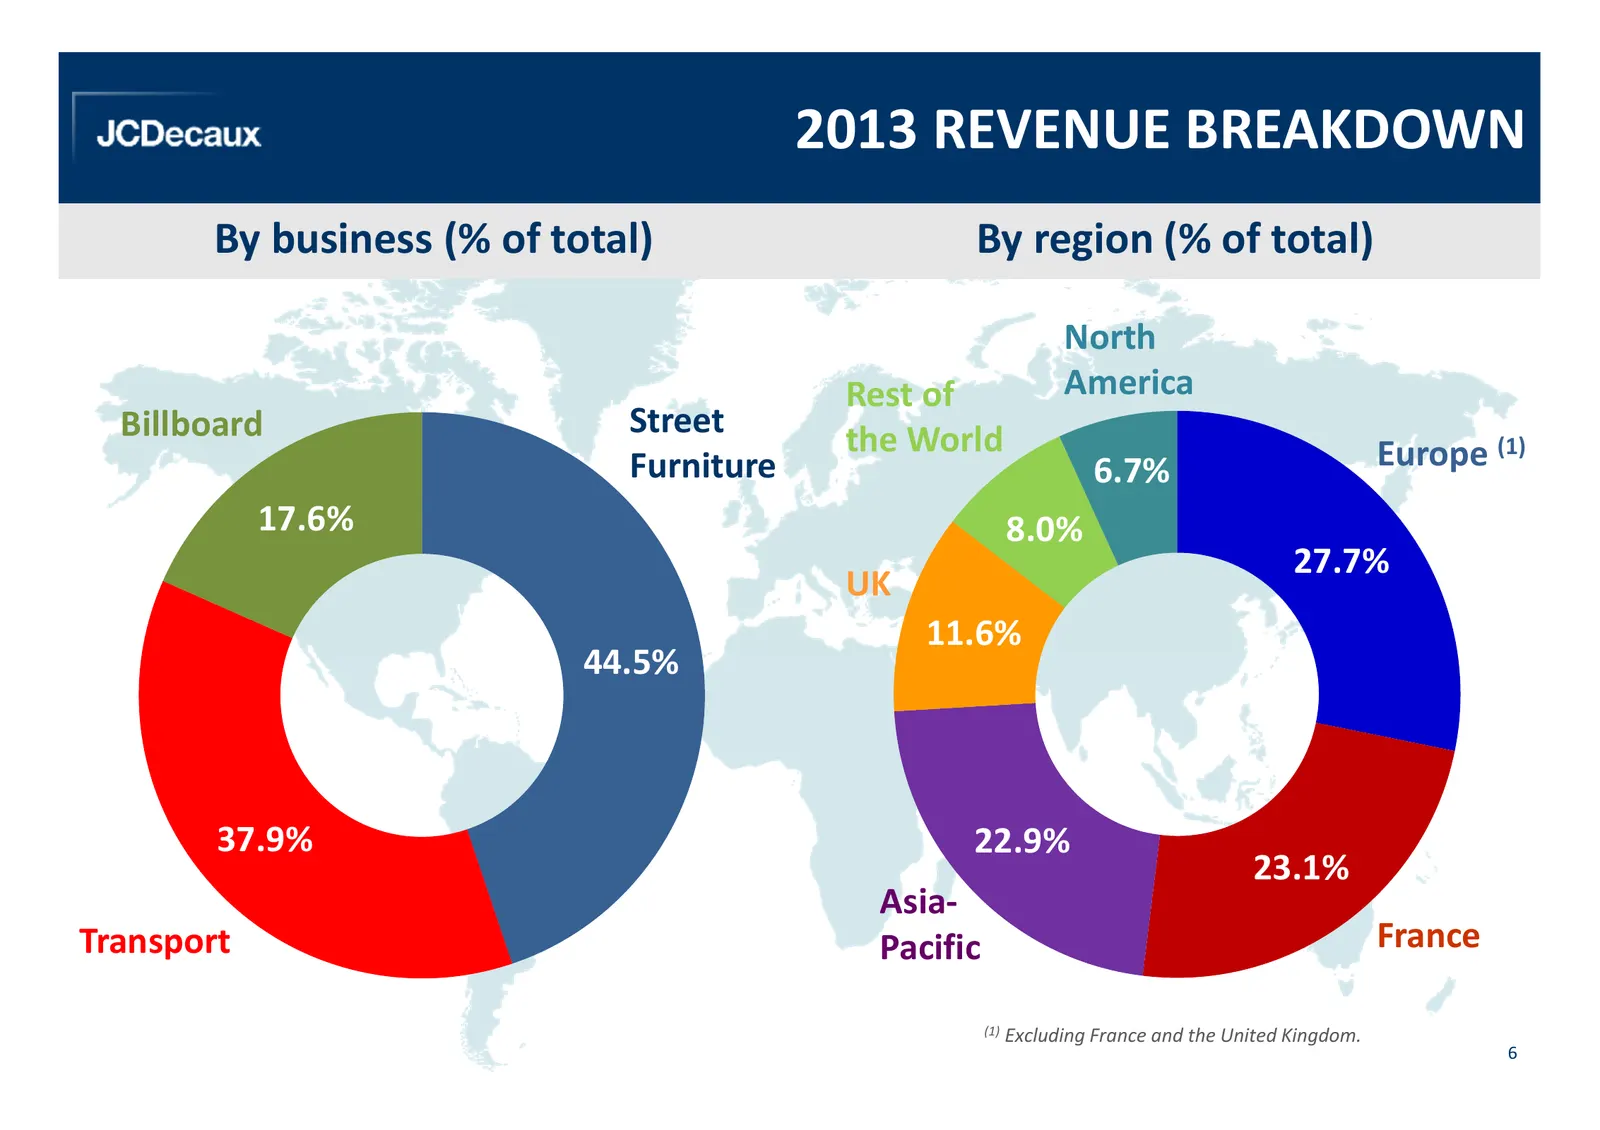
2013 REVENUE BREAKDOWN By business (% of total) By region (% of total) North Rest of America Billboard Street the World Europe (1) Furniture 6.7% 17.6% 8.0% 27.7% UK 11.6% 44.5% 37.9% 22.9% 23.1% Asia- Transport Pacific France (1) Excluding France and the United Kingdom. 6
Slide 7: Fast-Growing Countries Now Over 30% of Group Revenues
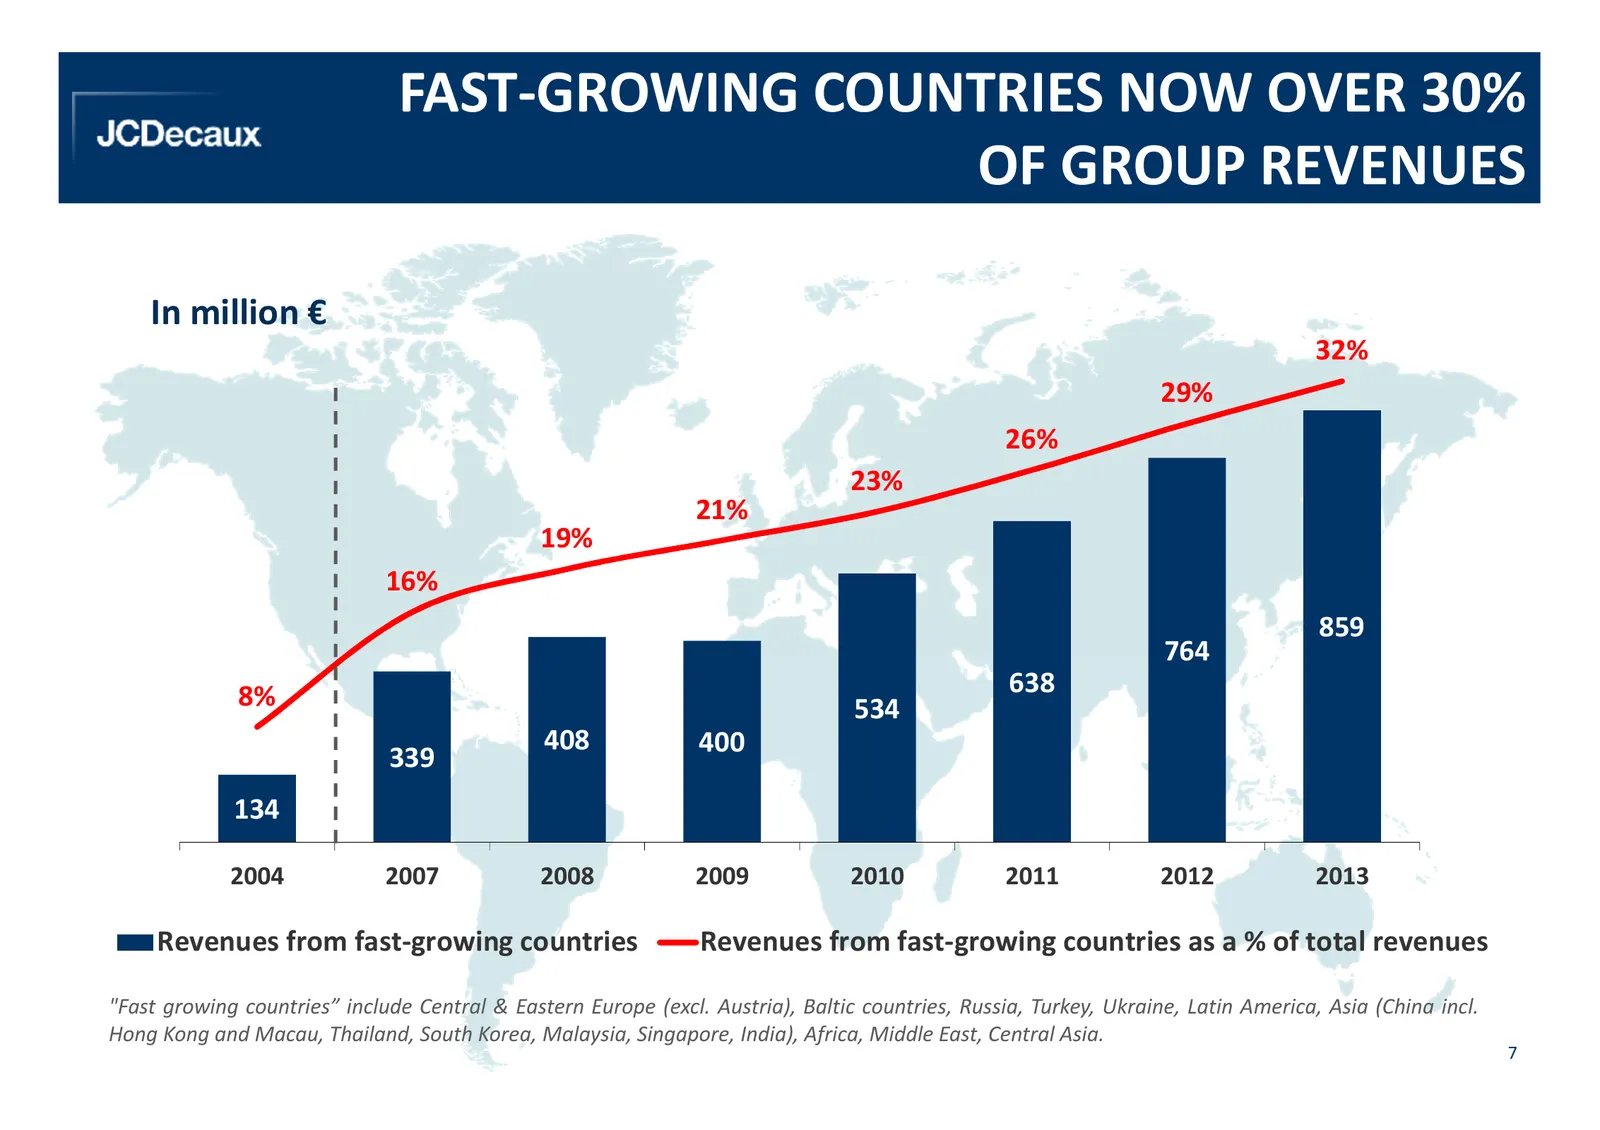
FAST-GROWING COUNTRIES NOW OVER 30% OF GROUP REVENUES In million € 32% 29% 26% 23% 21% 19% 16% 859 764 8% 638 534 408 400 339 134 2004 2007 2008 2009 2010 2011 2012 2013 Revenues from fast-growing countries Revenues from fast-growing countries as a % of total revenues "Fast growing countries” includ
Slide 8: France: JCDecaux Continues to Outperform the Media Market
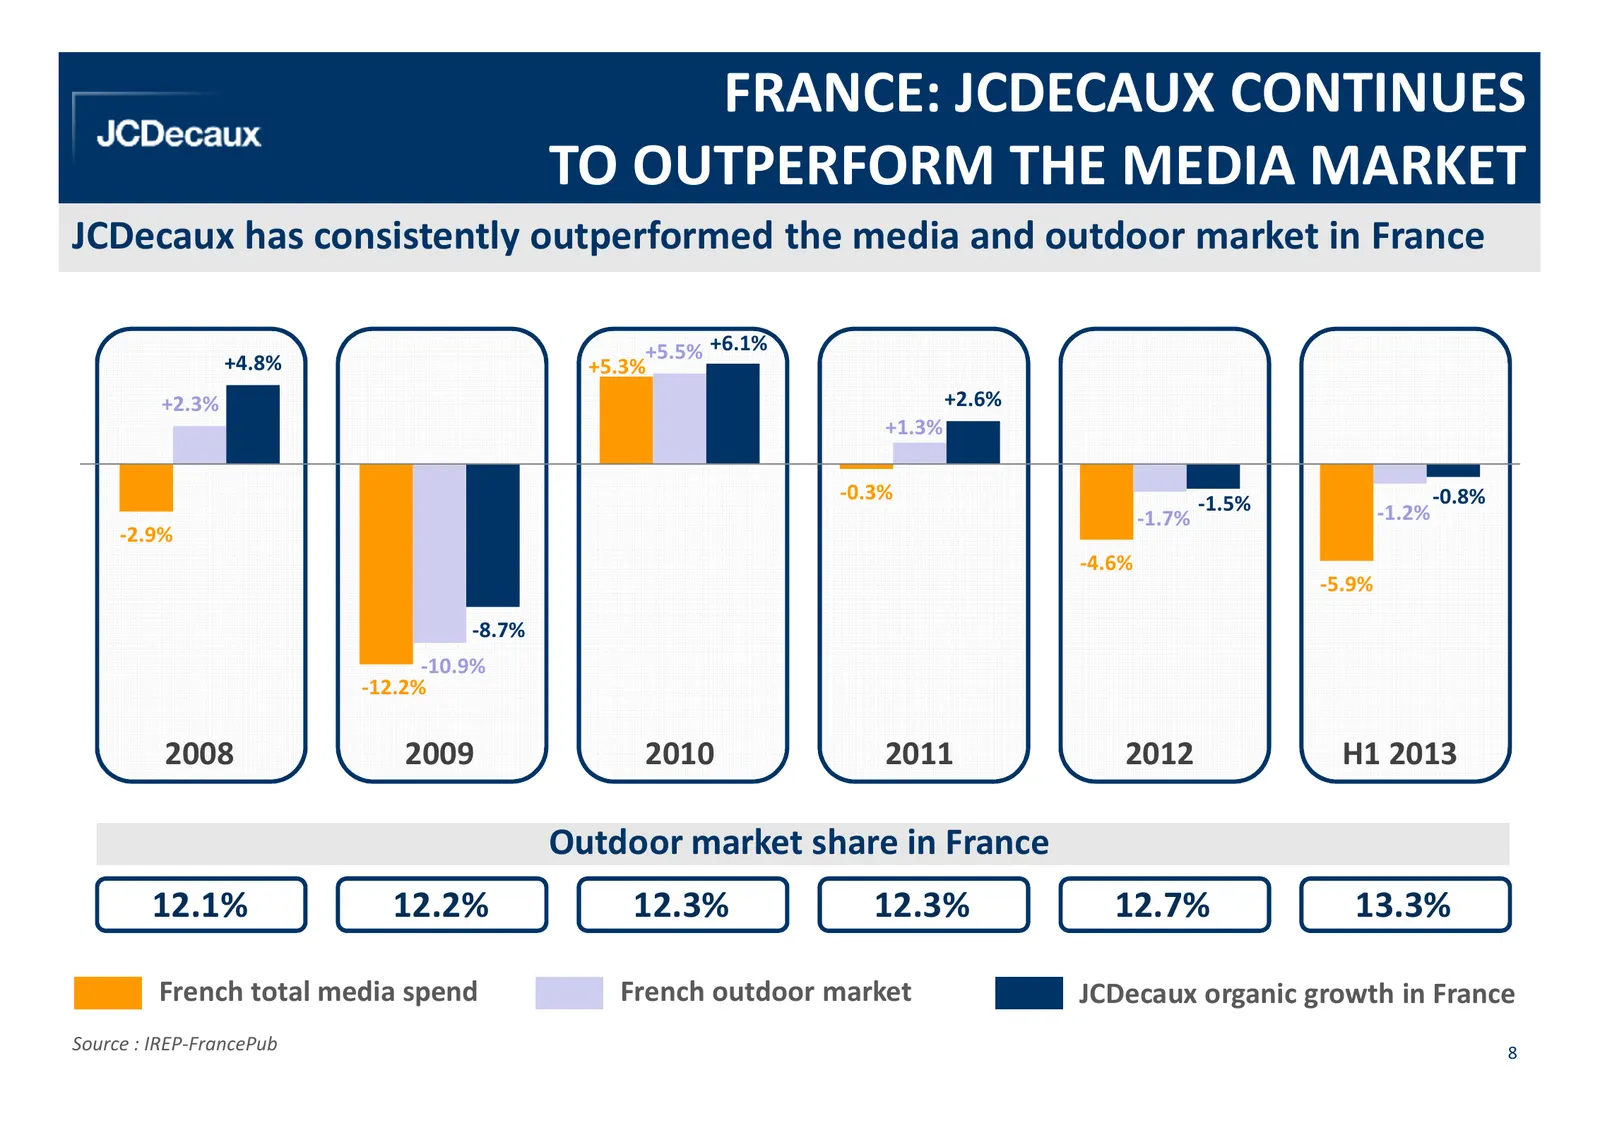
FRANCE: JCDECAUX CONTINUES TO OUTPERFORM THE MEDIA MARKET JCDecaux has consistently outperformed the media and outdoor market in France +5.5% +6.1% +4.8% +5.3% +2.3% +2.6% +1.3% -0.3% -0.8% -1.5% -1.2% -1.7% -2.9% -4.6% -5.9% -8.7% -10.9% -12.2% 2008 2009 2010 2011 2012 H1 2013 Outdoor market share
Slide 9: UK: Resilience of Outdoor, Market Share Gains for JCDecaux
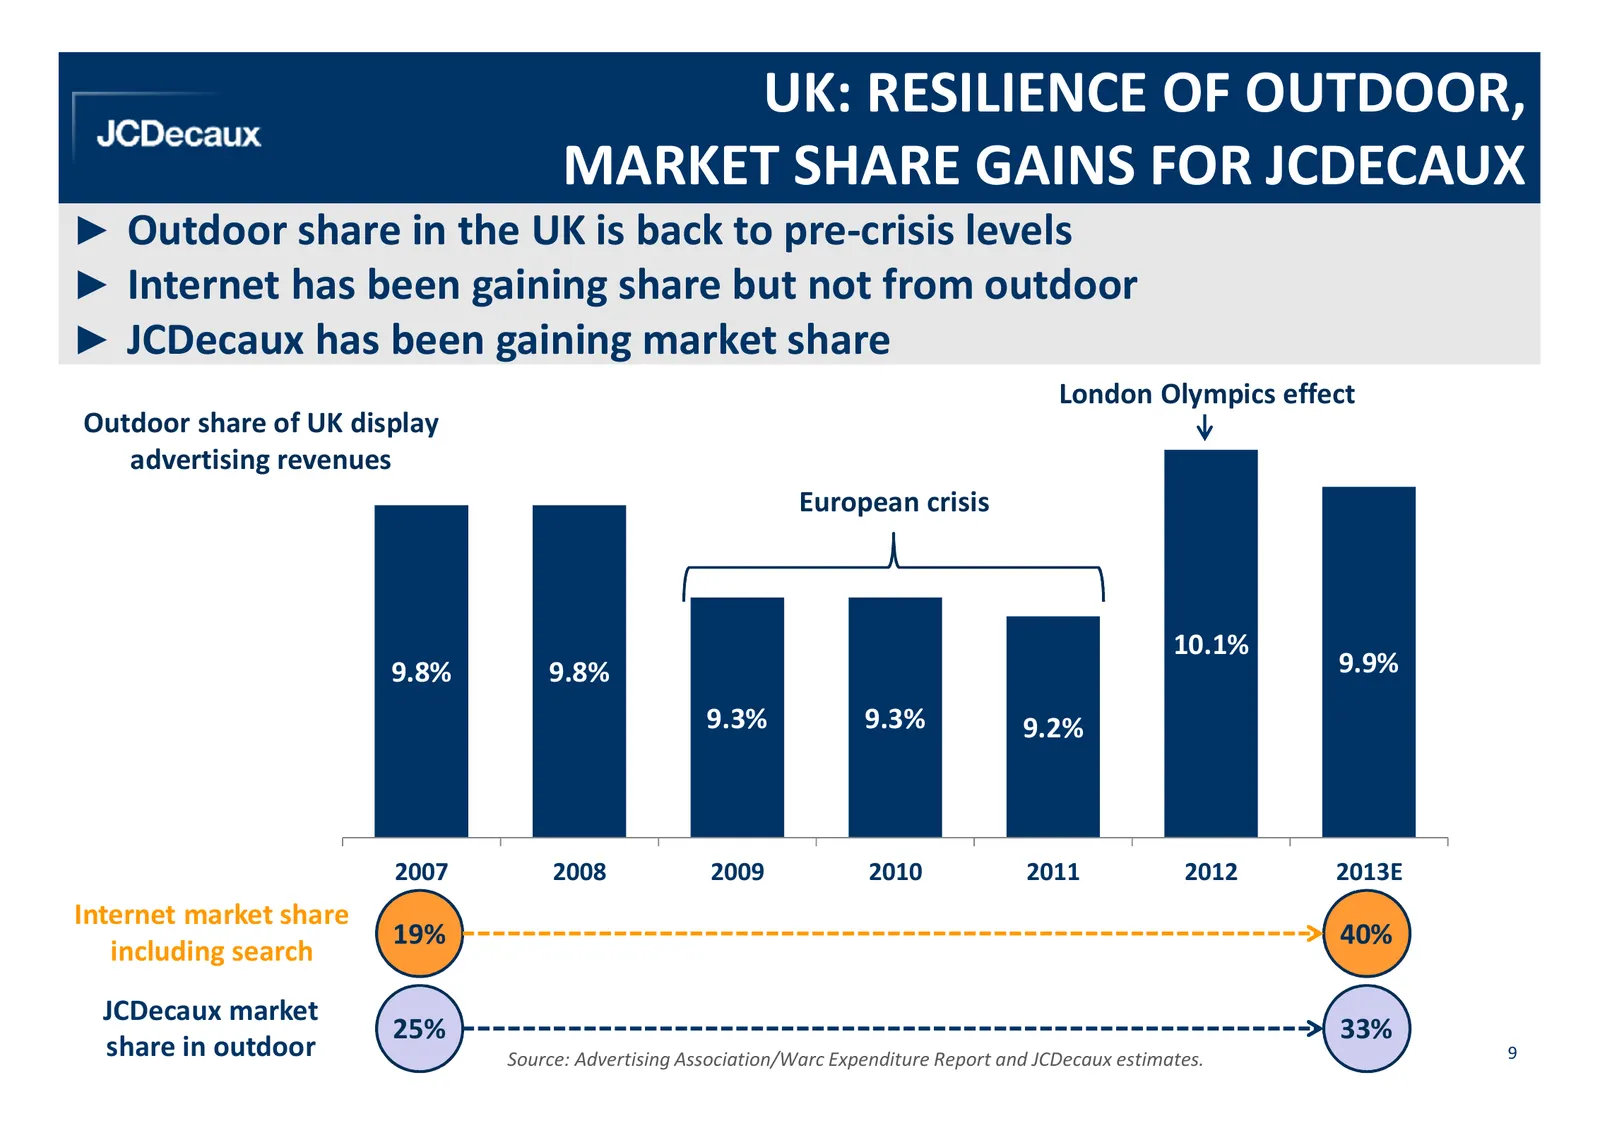
UK: RESILIENCE OF OUTDOOR, MARKET SHARE GAINS FOR JCDECAUX ► Outdoor share in the UK is back to pre-crisis levels ► Internet has been gaining share but not from outdoor ► JCDecaux has been gaining market share London Olympics effect Outdoor share of UK display advertising revenues European crisis 10
Slide 10: 2013 Top Client Categories
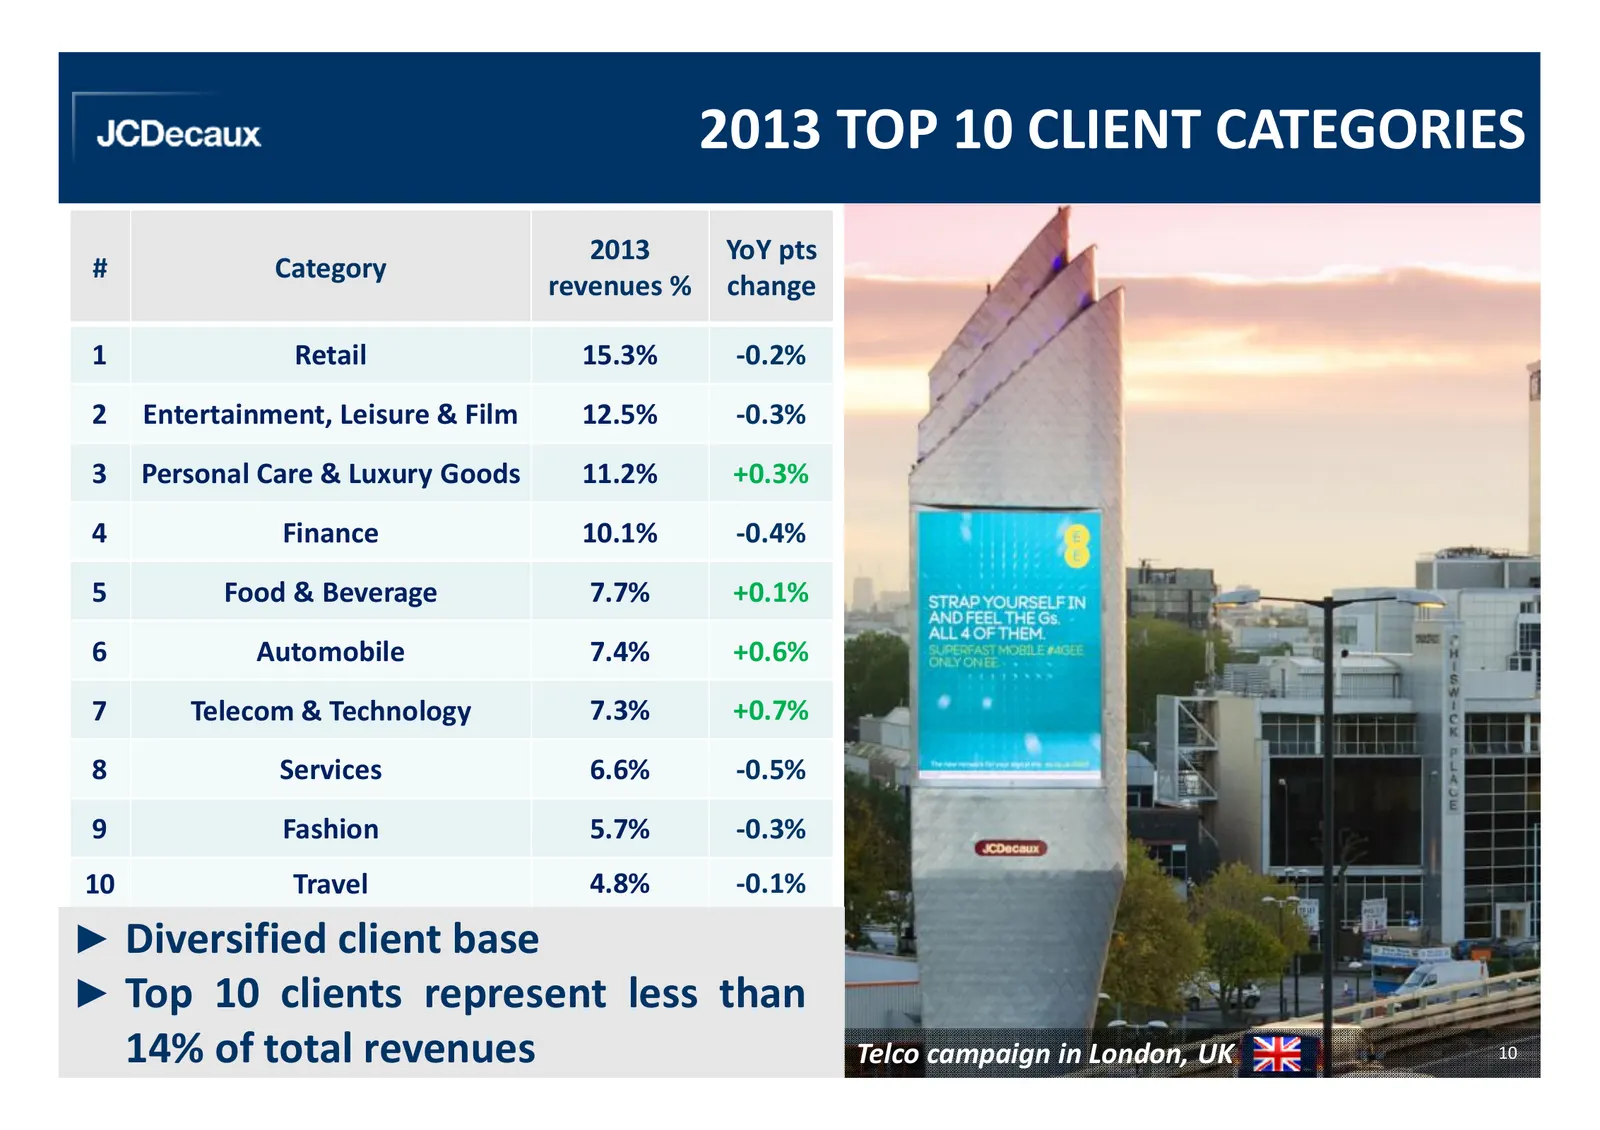
2013 TOP 10 CLIENT CATEGORIES 2013 YoY pts # Category revenues % change 1 Retail 15.3% -0.2% 2 Entertainment, Leisure & Film 12.5% -0.3% 3 Personal Care & Luxury Goods 11.2% +0.3% 4 Finance 10.1% -0.4% 5 Food & Beverage 7.7% +0.1% 6 Automobile 7.4% +0.6% 7 Telecom & Technology 7.3% +0.7% 8 Services
Slide 11: Strong Growth from Digital
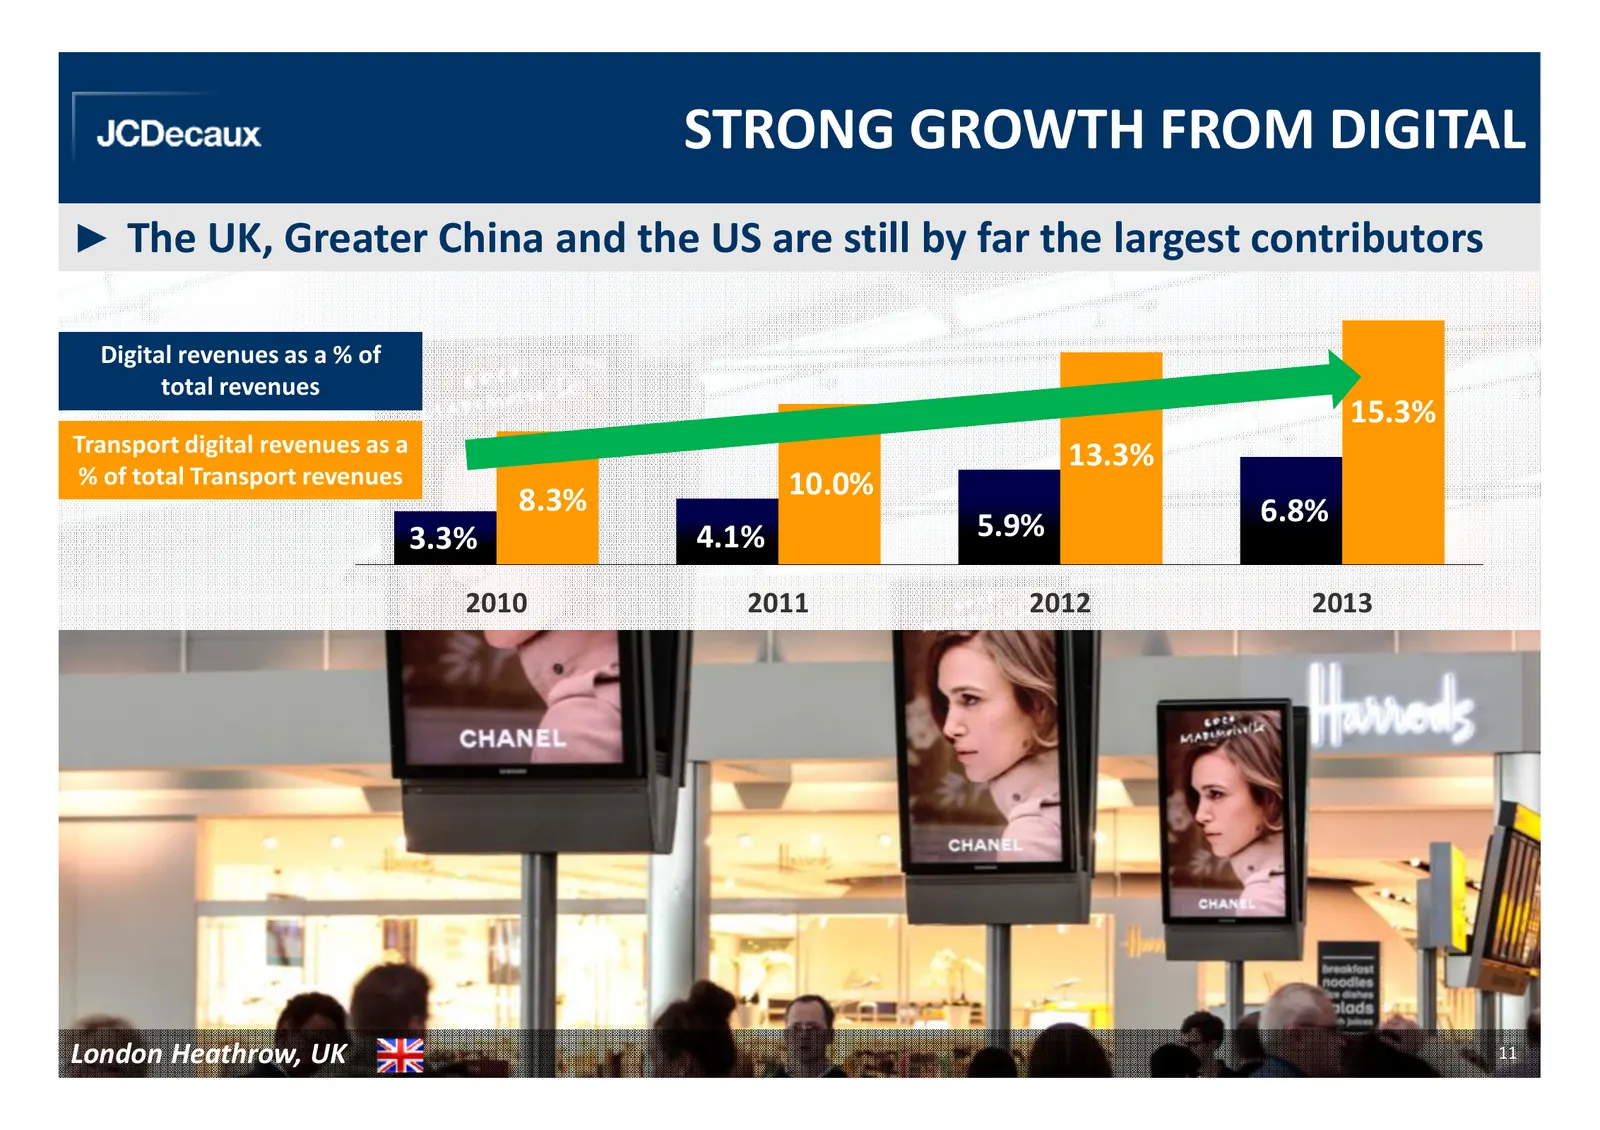
STRONG GROWTH FROM DIGITAL ► The UK, Greater China and the US are still by far the largest contributors Digital revenues as a % of total revenues 15.3% Transport digital revenues as a 13.3% % of total Transport revenues 10.0% 8.3% 6.8% 3.3% 4.1% 5.9% 2010 2011 2012 2013 London Heathrow, UK 11
Slide 12: Business Highlights
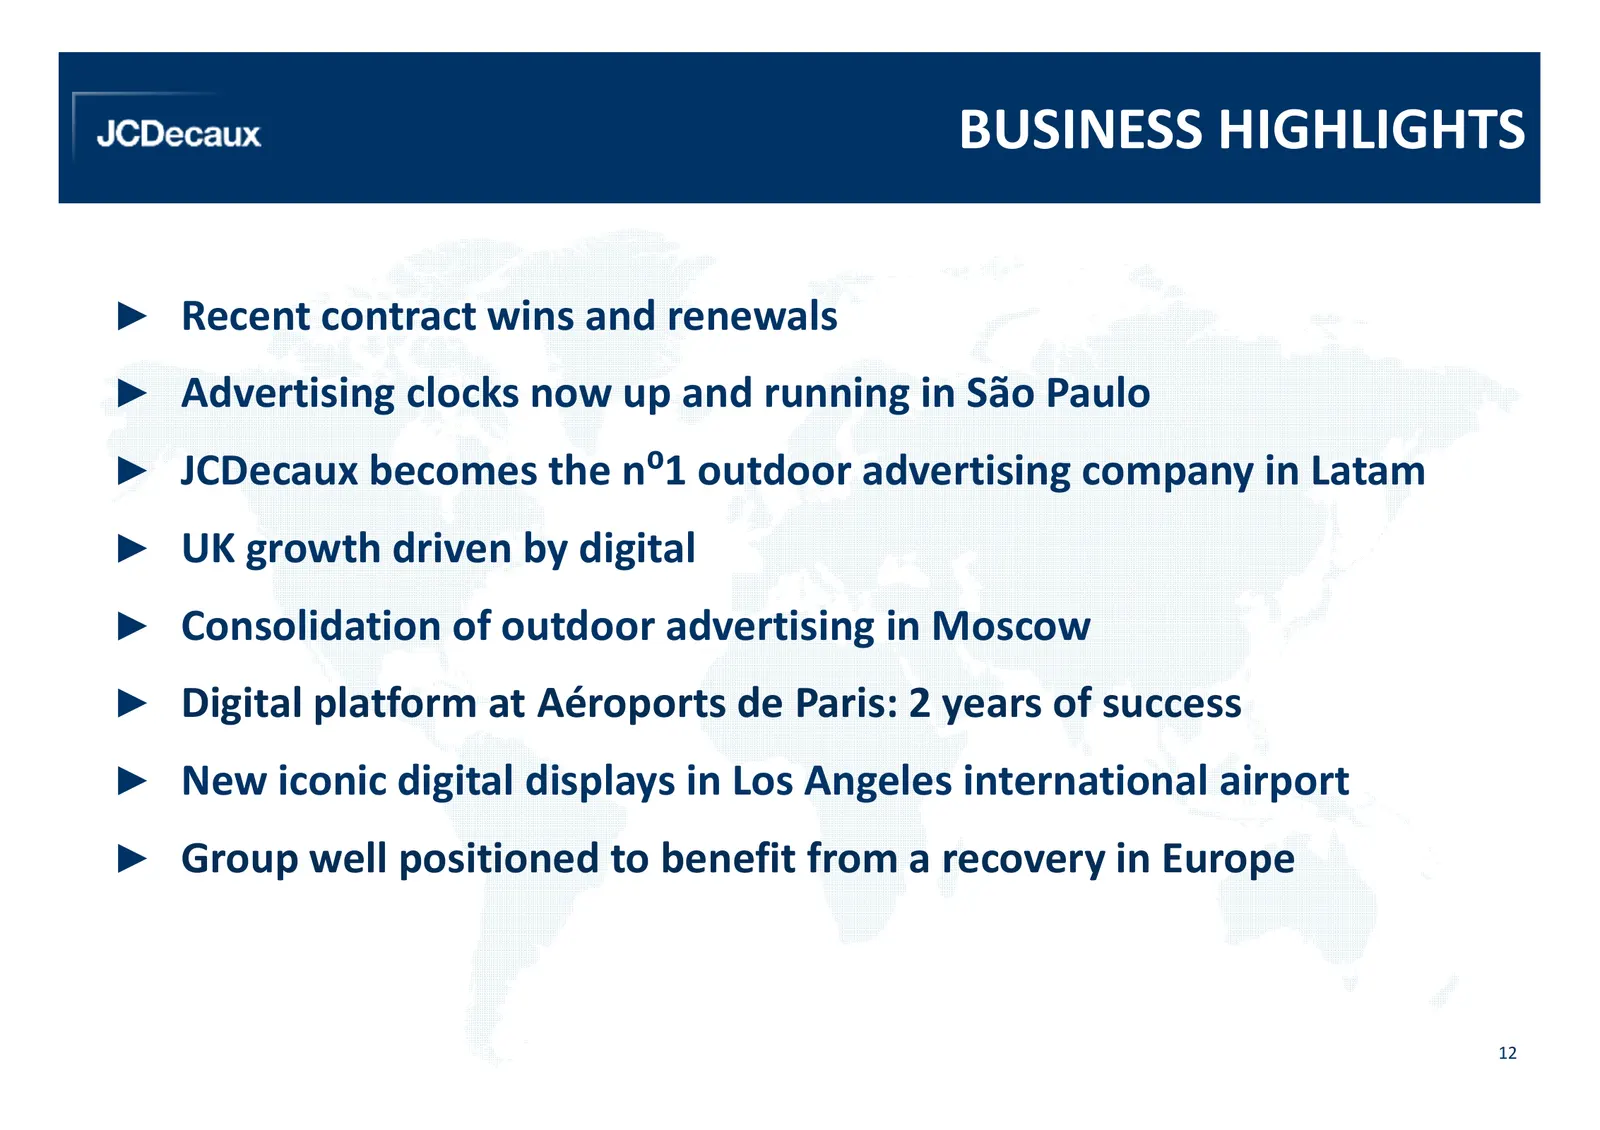
BUSINESS HIGHLIGHTS ► Recent contract wins and renewals ► Advertising clocks now up and running in São Paulo ► JCDecaux becomes the n⁰1 outdoor advertising company in Latam ► UK growth driven by digital ► Consolidation of outdoor advertising in Moscow ► Digital platform at Aéroports de Paris: 2 year
Slide 13: Recent Contract Wins and Renewals
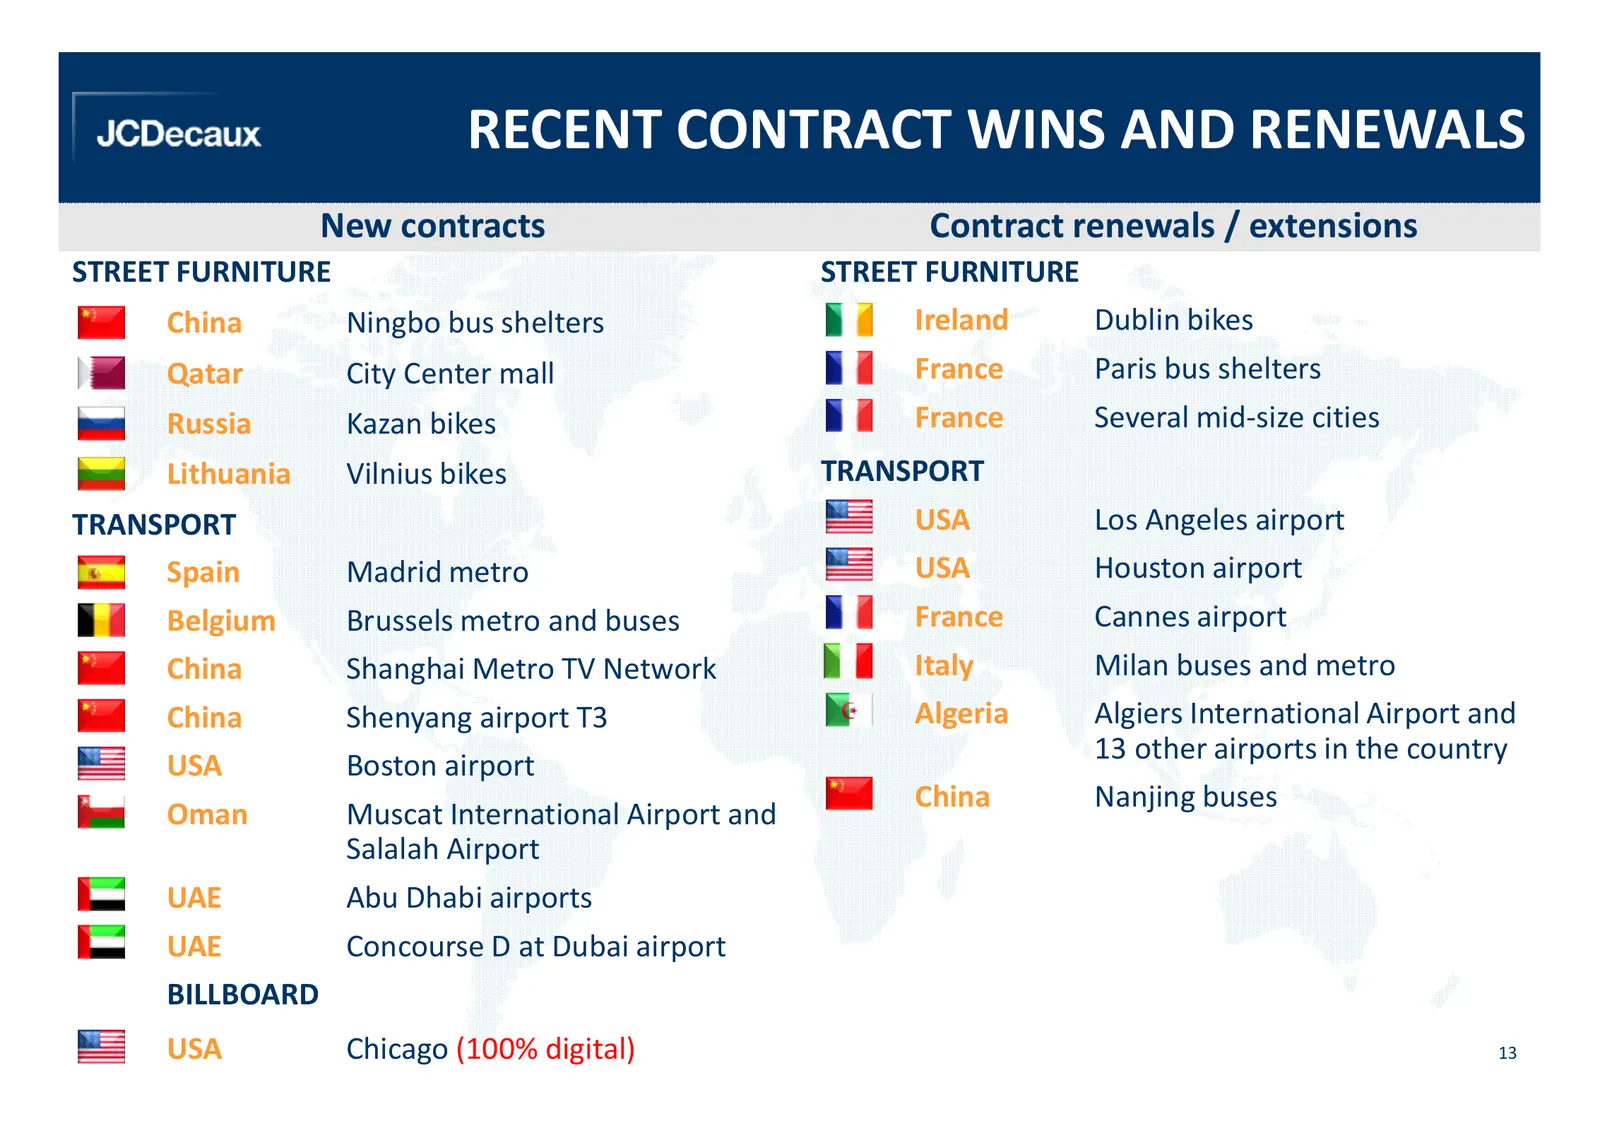
RECENT CONTRACT WINS AND RENEWALS New contracts Contract renewals / extensions STREET FURNITURE STREET FURNITURE China Ningbo bus shelters Ireland Dublin bikes Qatar City Center mall France Paris bus shelters Russia Kazan bikes France Several mid-size cities Lithuania Vilnius bikes TRANSPORT TRANSPO
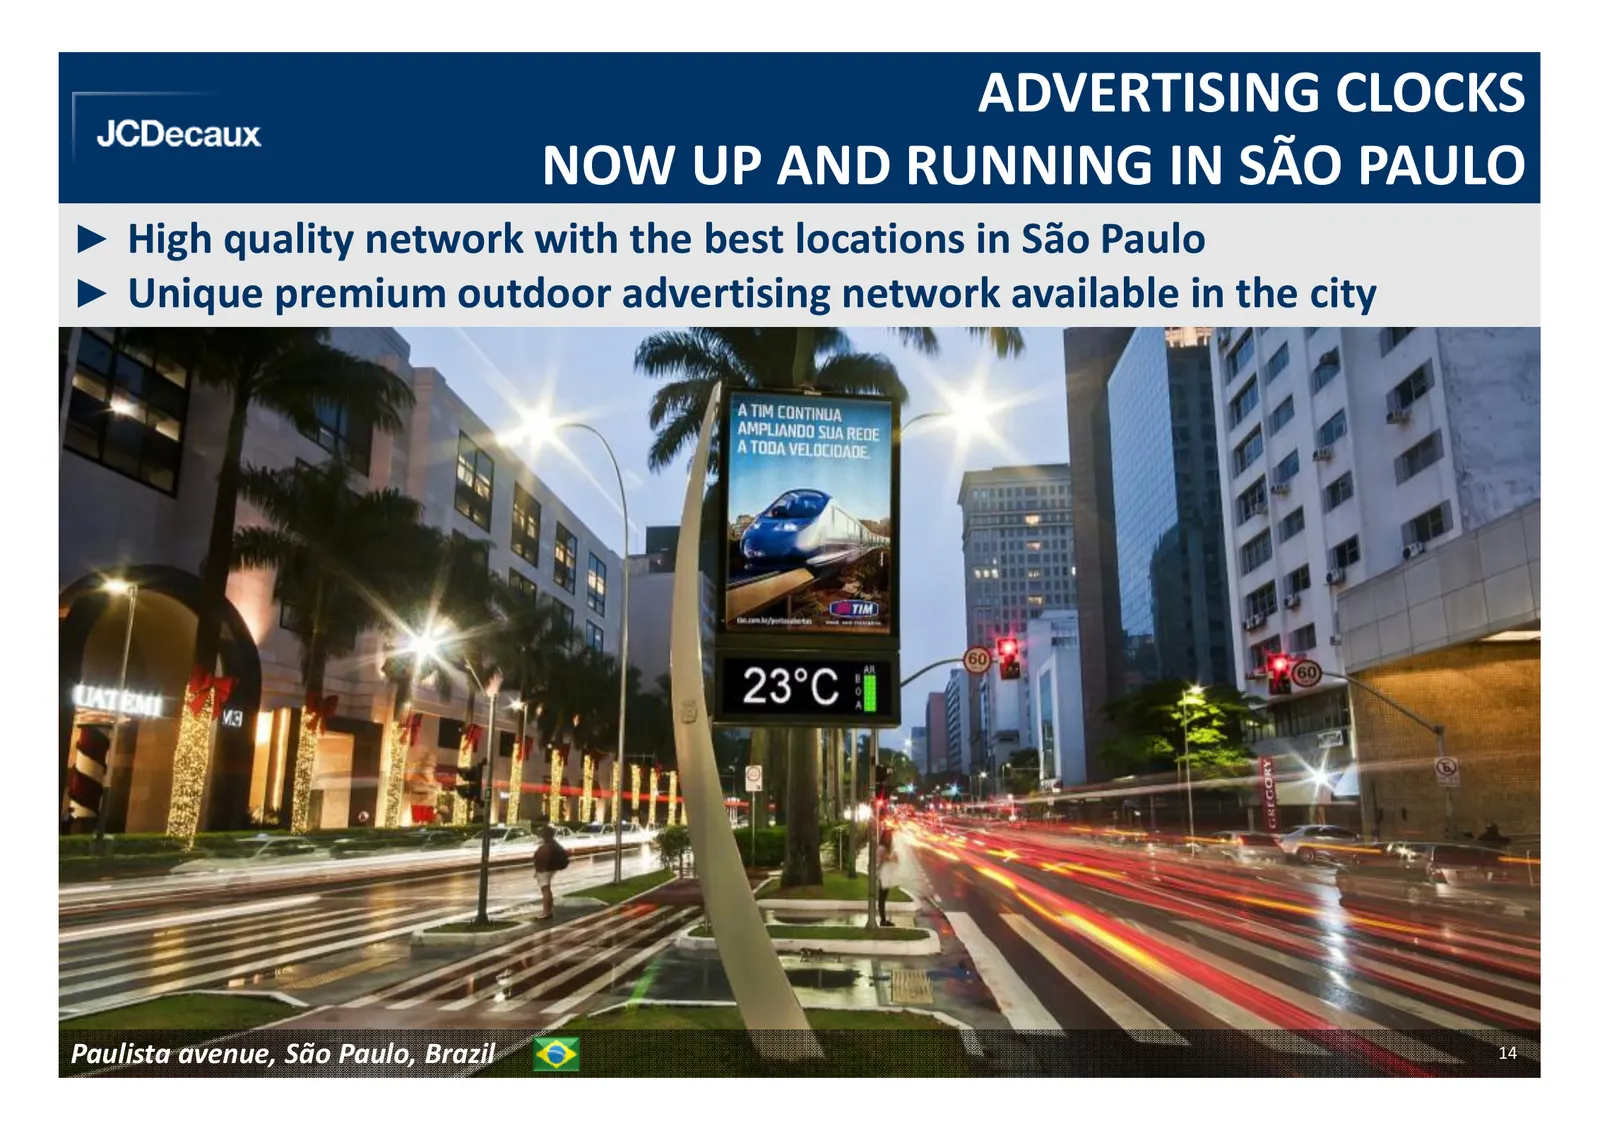
Slide 14: Advertising Clocks Now Up and Running in São Paulo
ADVERTISING CLOCKS NOW UP AND RUNNING IN SÃO PAULO ► High quality network with the best locations in São Paulo ► Unique premium outdoor advertising network available in the city Paulista avenue, São Paulo, Brazil 14
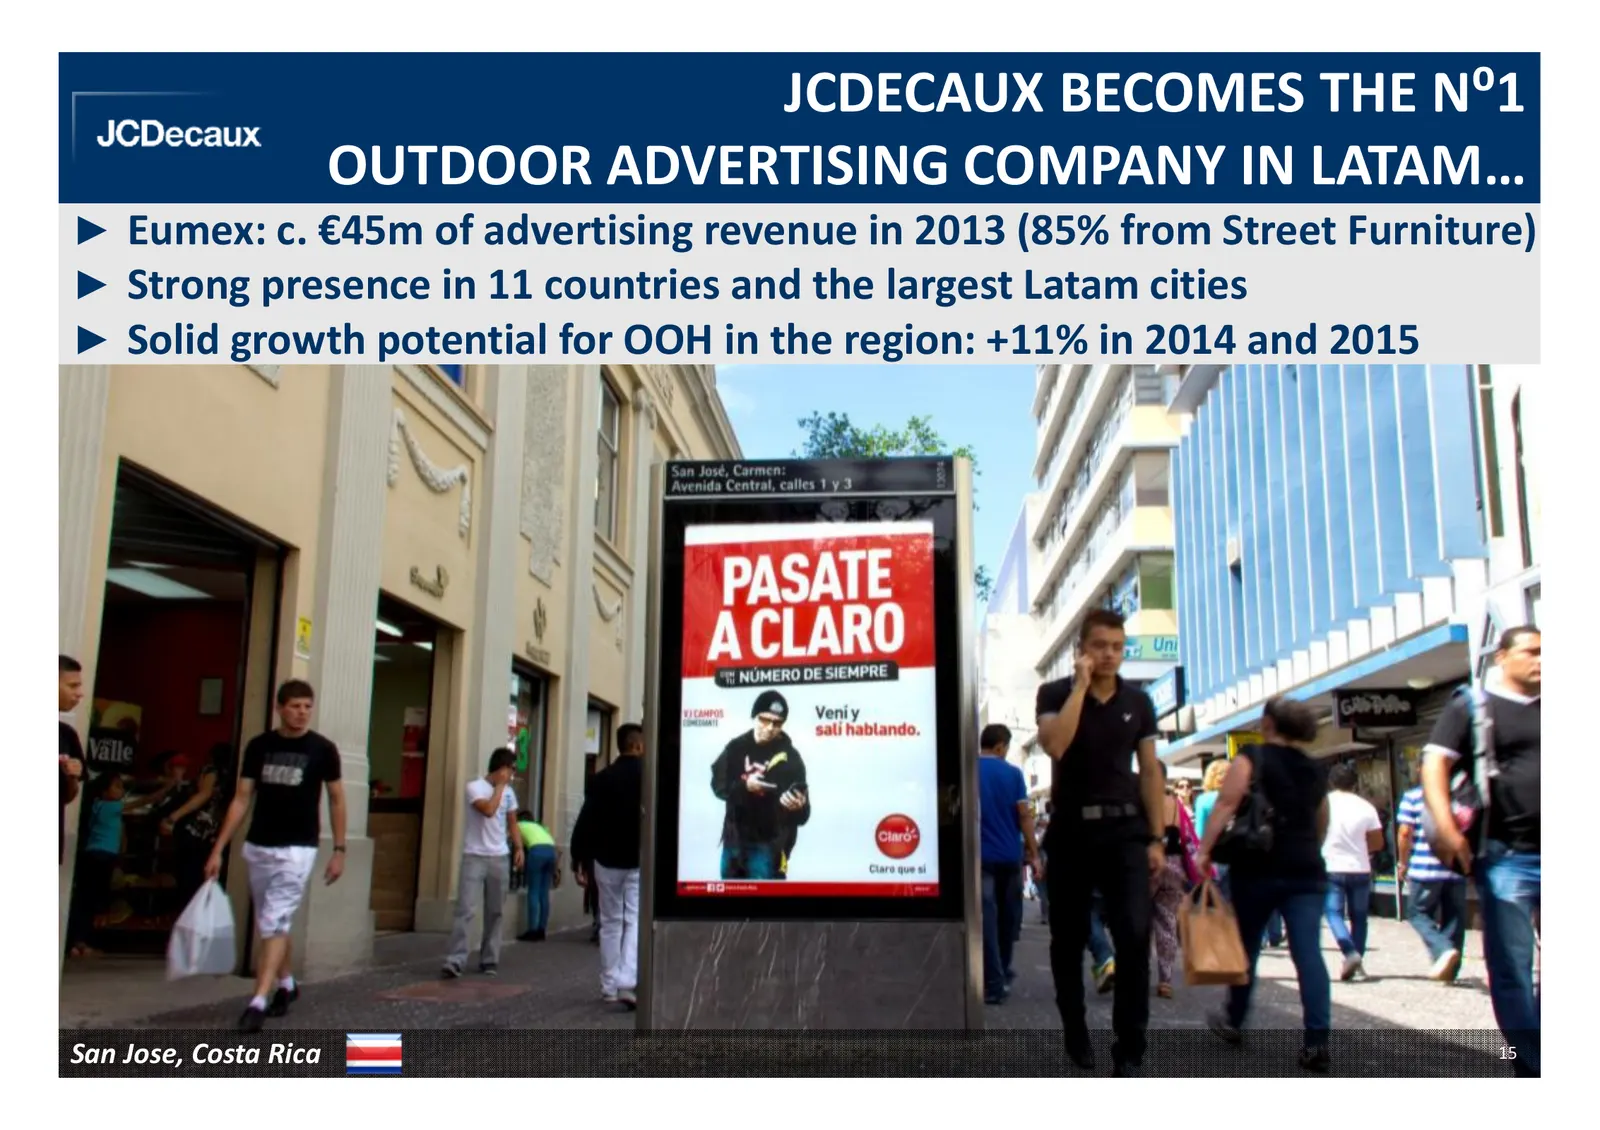
Slide 15: JCDecaux Becomes the N°1 Outdoor Advertising Company in Latam
JCDECAUX BECOMES THE N⁰1 OUTDOOR ADVERTISING COMPANY IN LATAM… ► Eumex: c. €45m of advertising revenue in 2013 (85% from Street Furniture) ► Strong presence in 11 countries and the largest Latam cities ► Solid growth potential for OOH in the region: +11% in 2014 and 2015 San Jose, Costa Rica 15
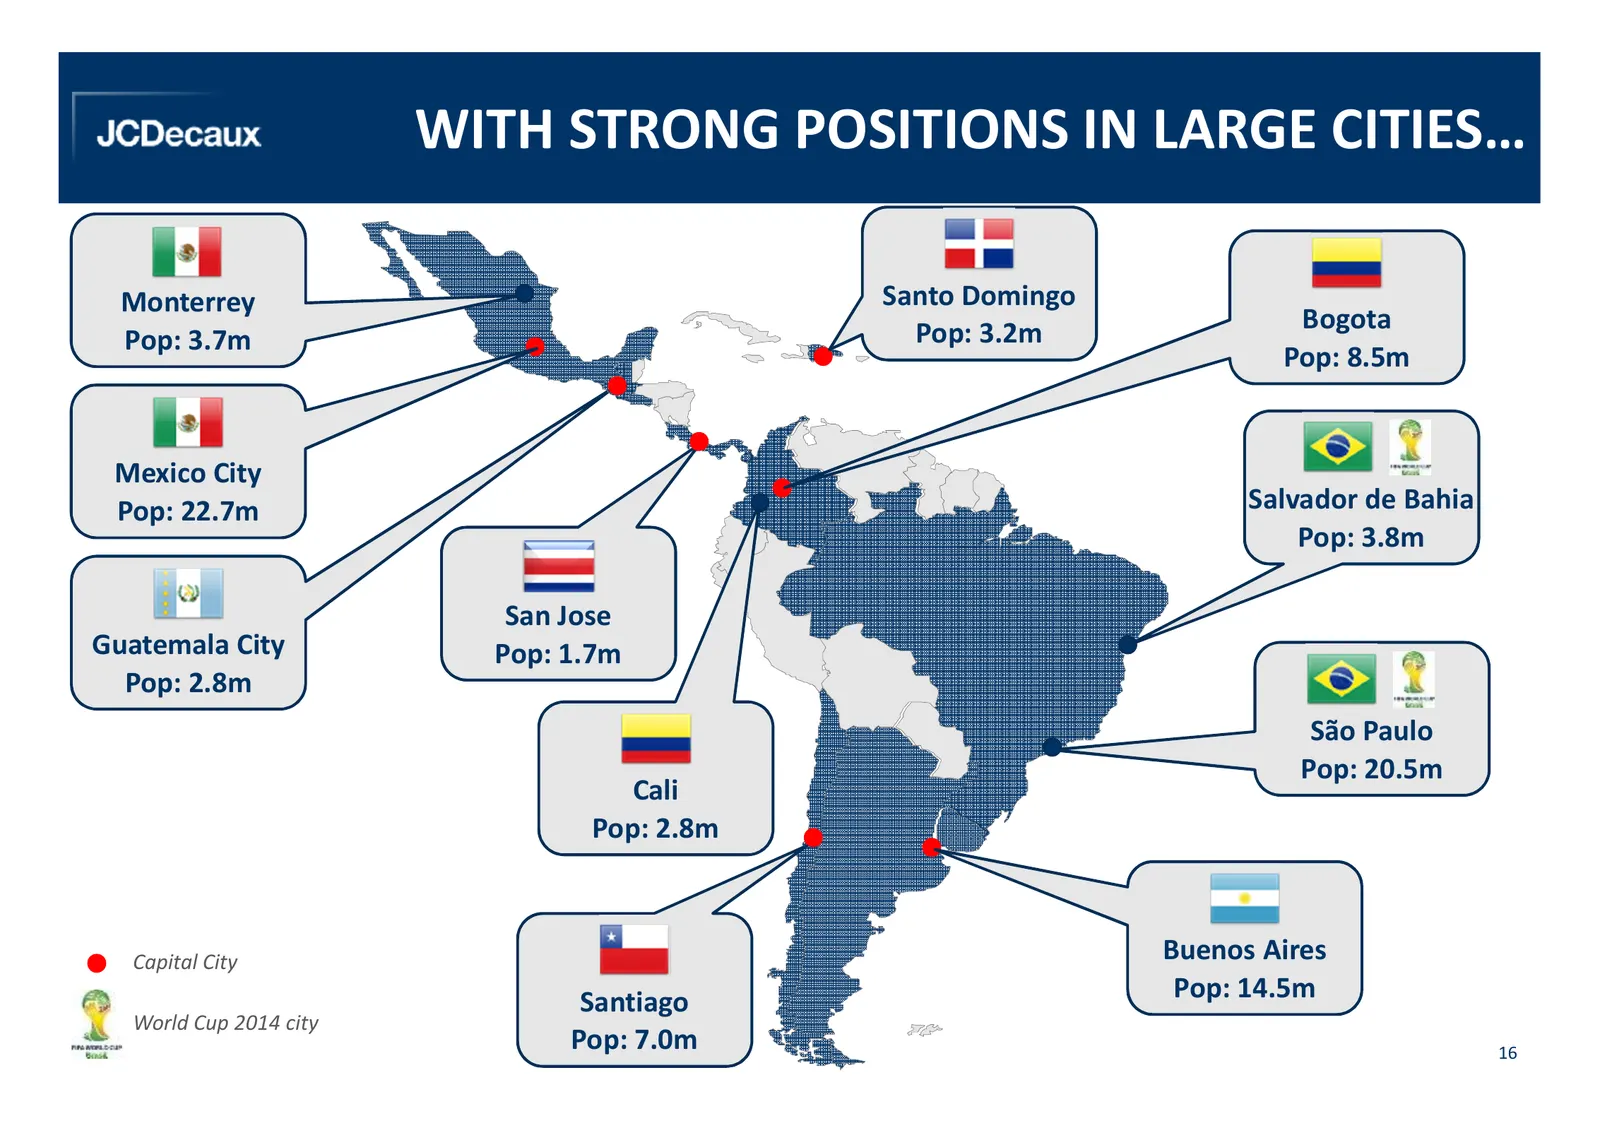
Slide 16: With Strong Positions in Large Cities
WITH STRONG POSITIONS IN LARGE CITIES… Monterrey Santo Domingo Pop: 3.2m Bogota Pop: 3.7m Pop: 8.5m Mexico City Pop: 22.7m Salvador de Bahia Pop: 3.8m San Jose Guatemala City Pop: 1.7m Pop: 2.8m São Paulo Pop: 20.5m Cali Pop: 2.8m Capital City Buenos Aires Santiago Pop: 14.5m World Cup 2014 city Pop
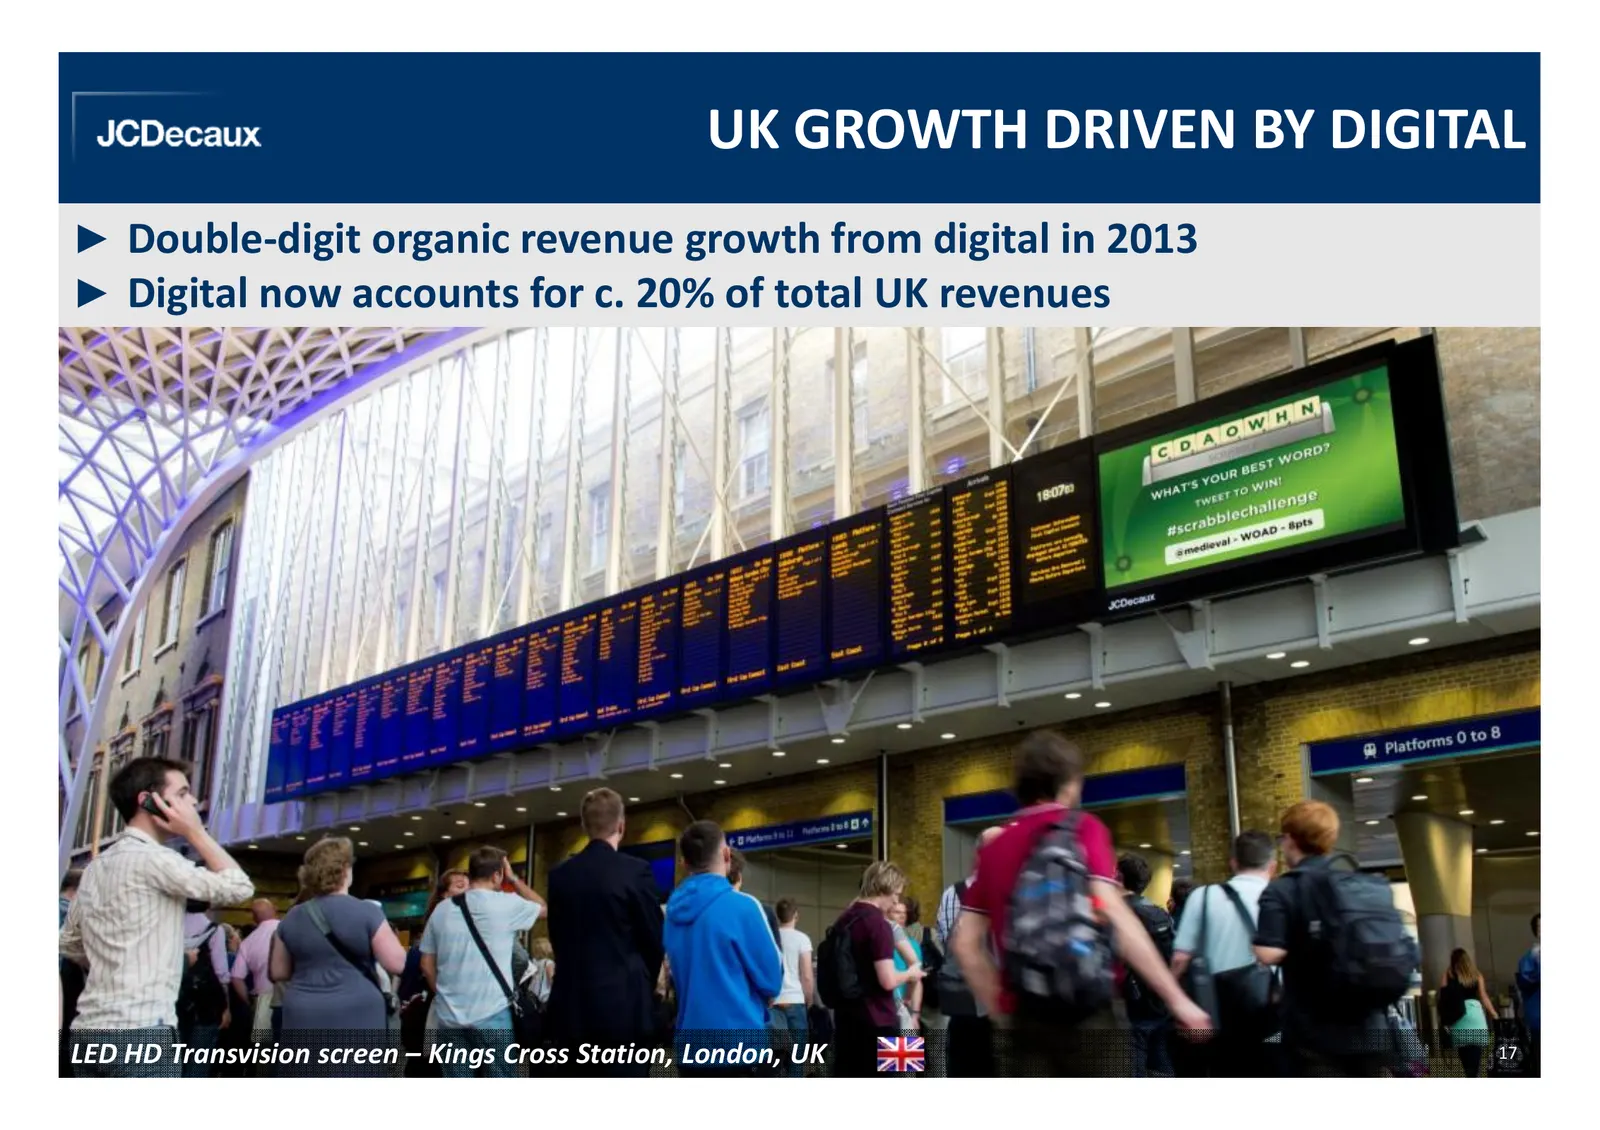
Slide 17: UK Growth Driven by Digital
UK GROWTH DRIVEN BY DIGITAL ► Double-digit organic revenue growth from digital in 2013 ► Digital now accounts for c. 20% of total UK revenues LED HD Transvision screen – Kings Cross Station, London, UK 17
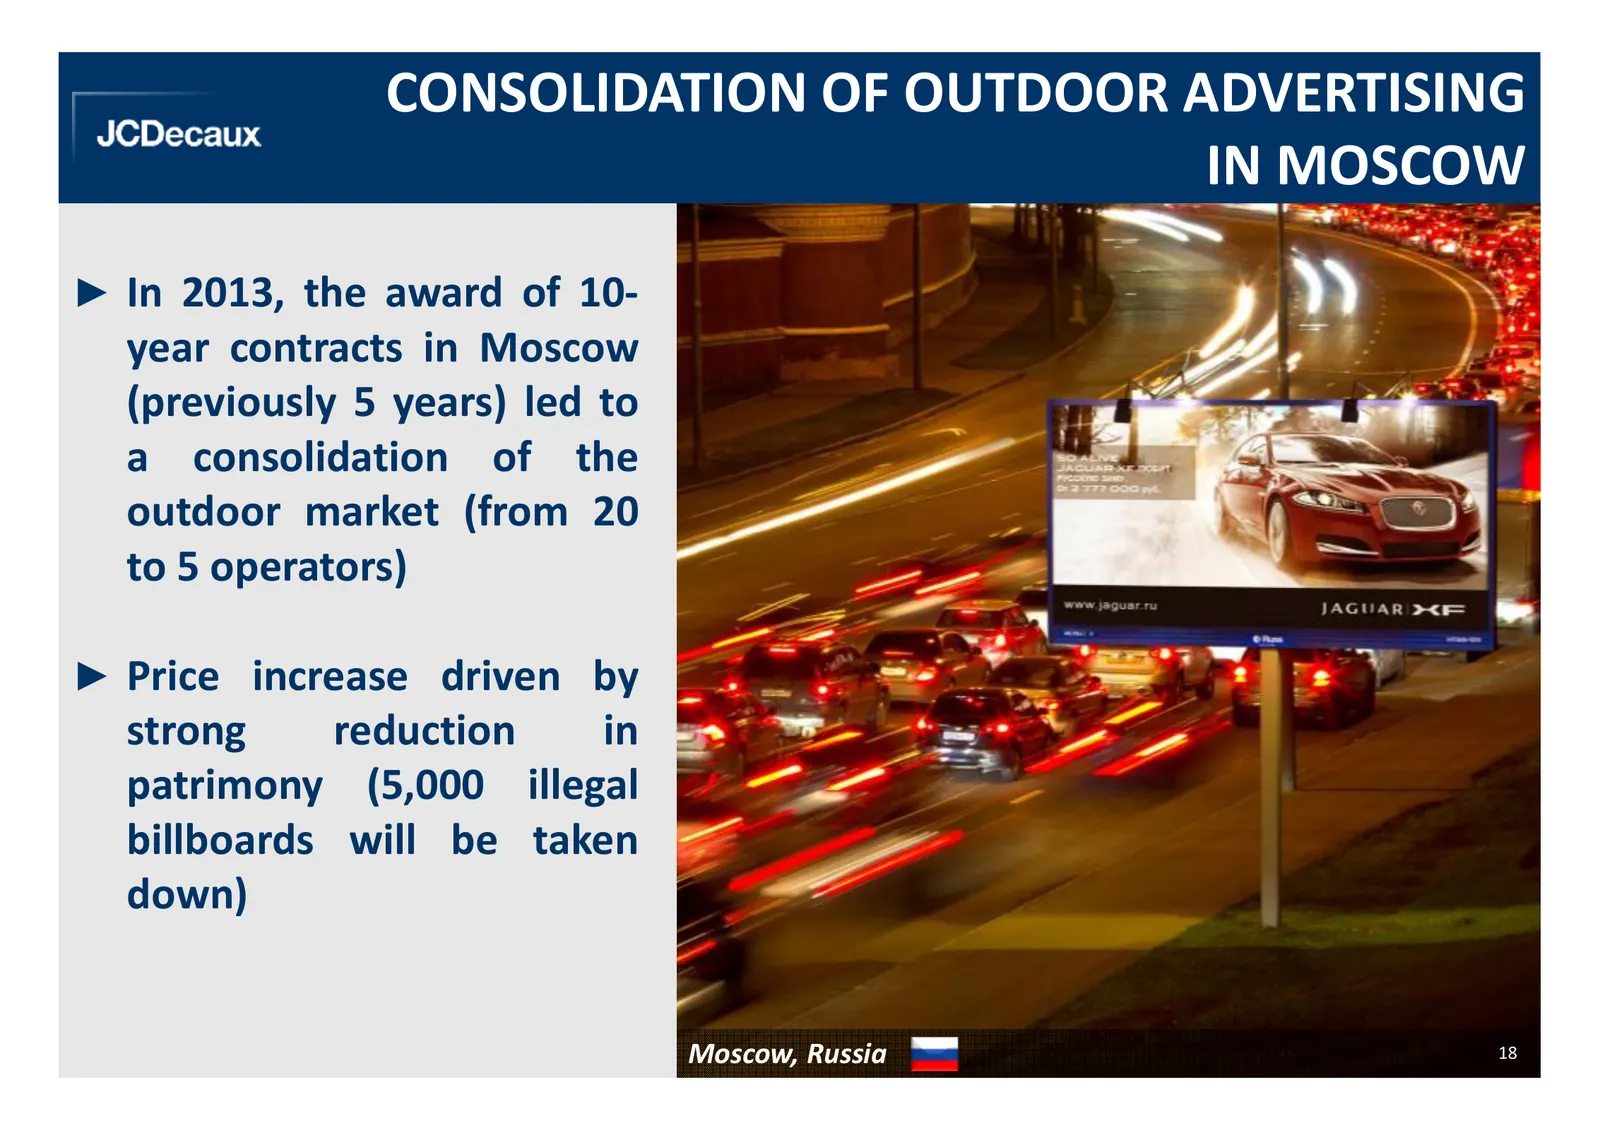
Slide 18: Consolidation of Outdoor Advertising in Moscow
CONSOLIDATION OF OUTDOOR ADVERTISING IN MOSCOW ► In 2013, the award of 10- year contracts in Moscow (previously 5 years) led to a consolidation of the outdoor market (from 20 to 5 operators) ► Price increase driven by strong reduction in patrimony (5,000 illegal billboards will be taken down) Moscow
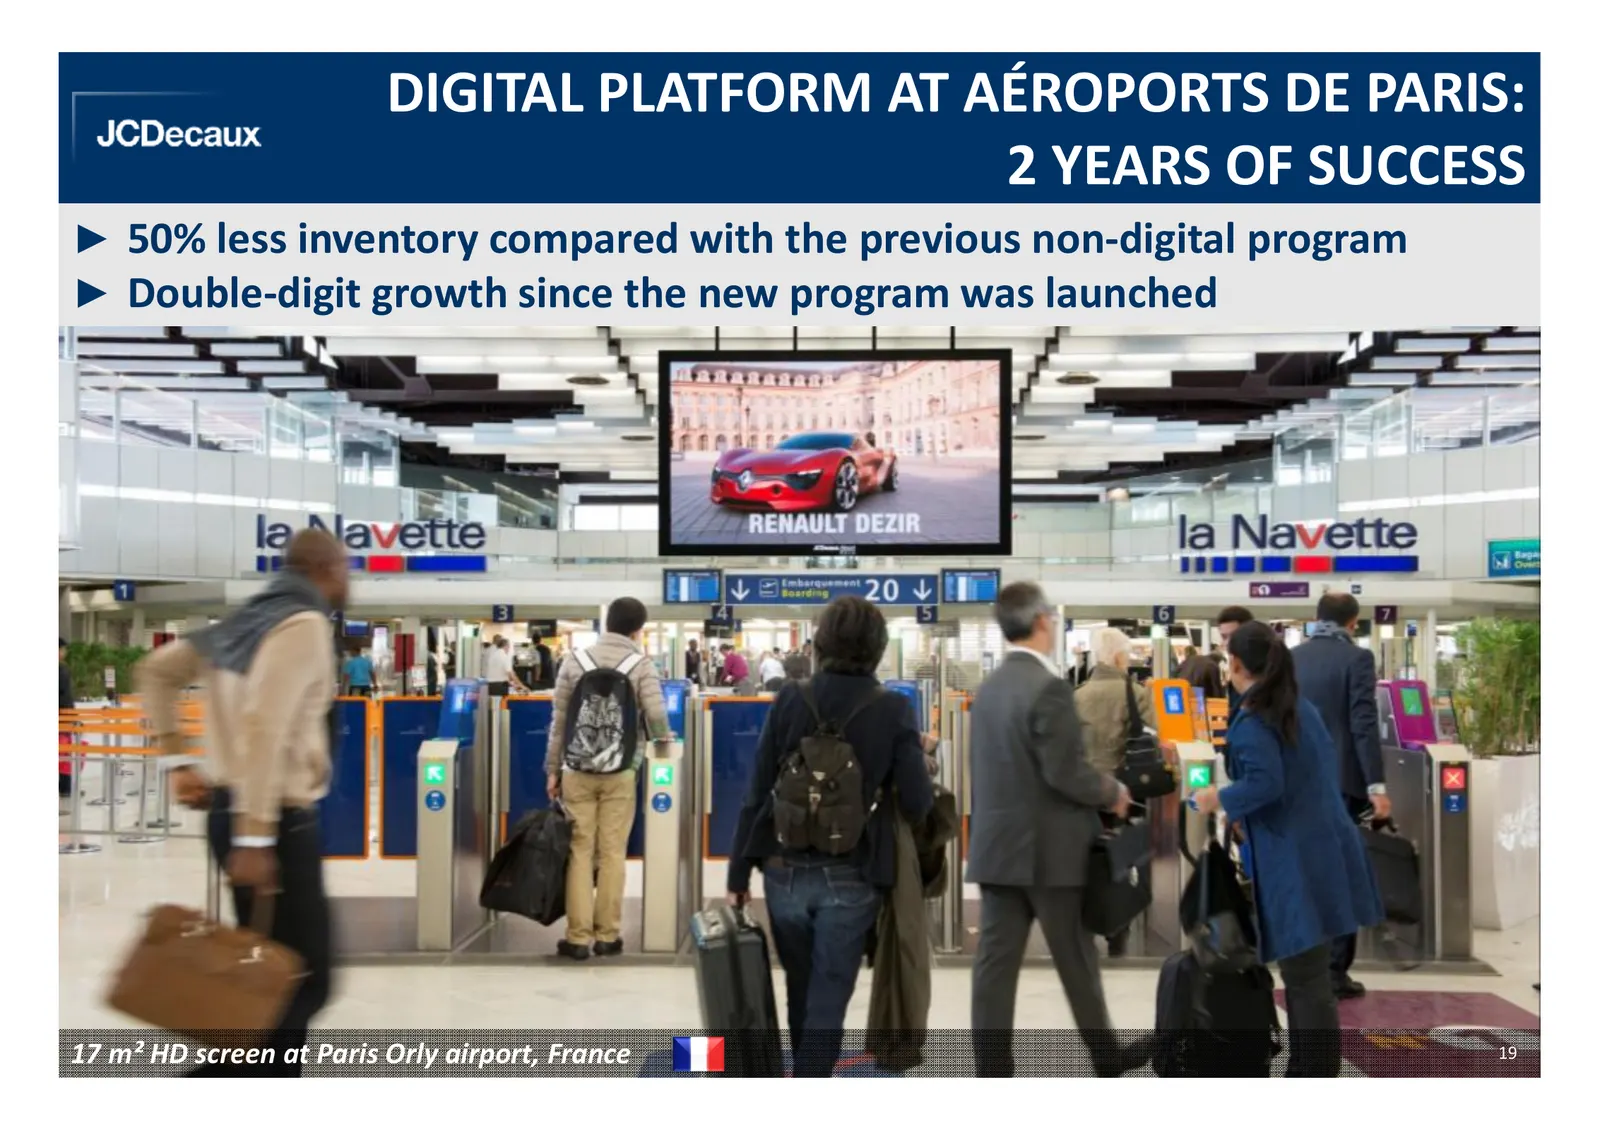
Slide 19: Digital Platform at Aéroports de Paris: 2 Years of Success
DIGITAL PLATFORM AT AÉROPORTS DE PARIS: 2 YEARS OF SUCCESS ► 50% less inventory compared with the previous non-digital program ► Double-digit growth since the new program was launched 17 m² HD screen at Paris Orly airport, France 19
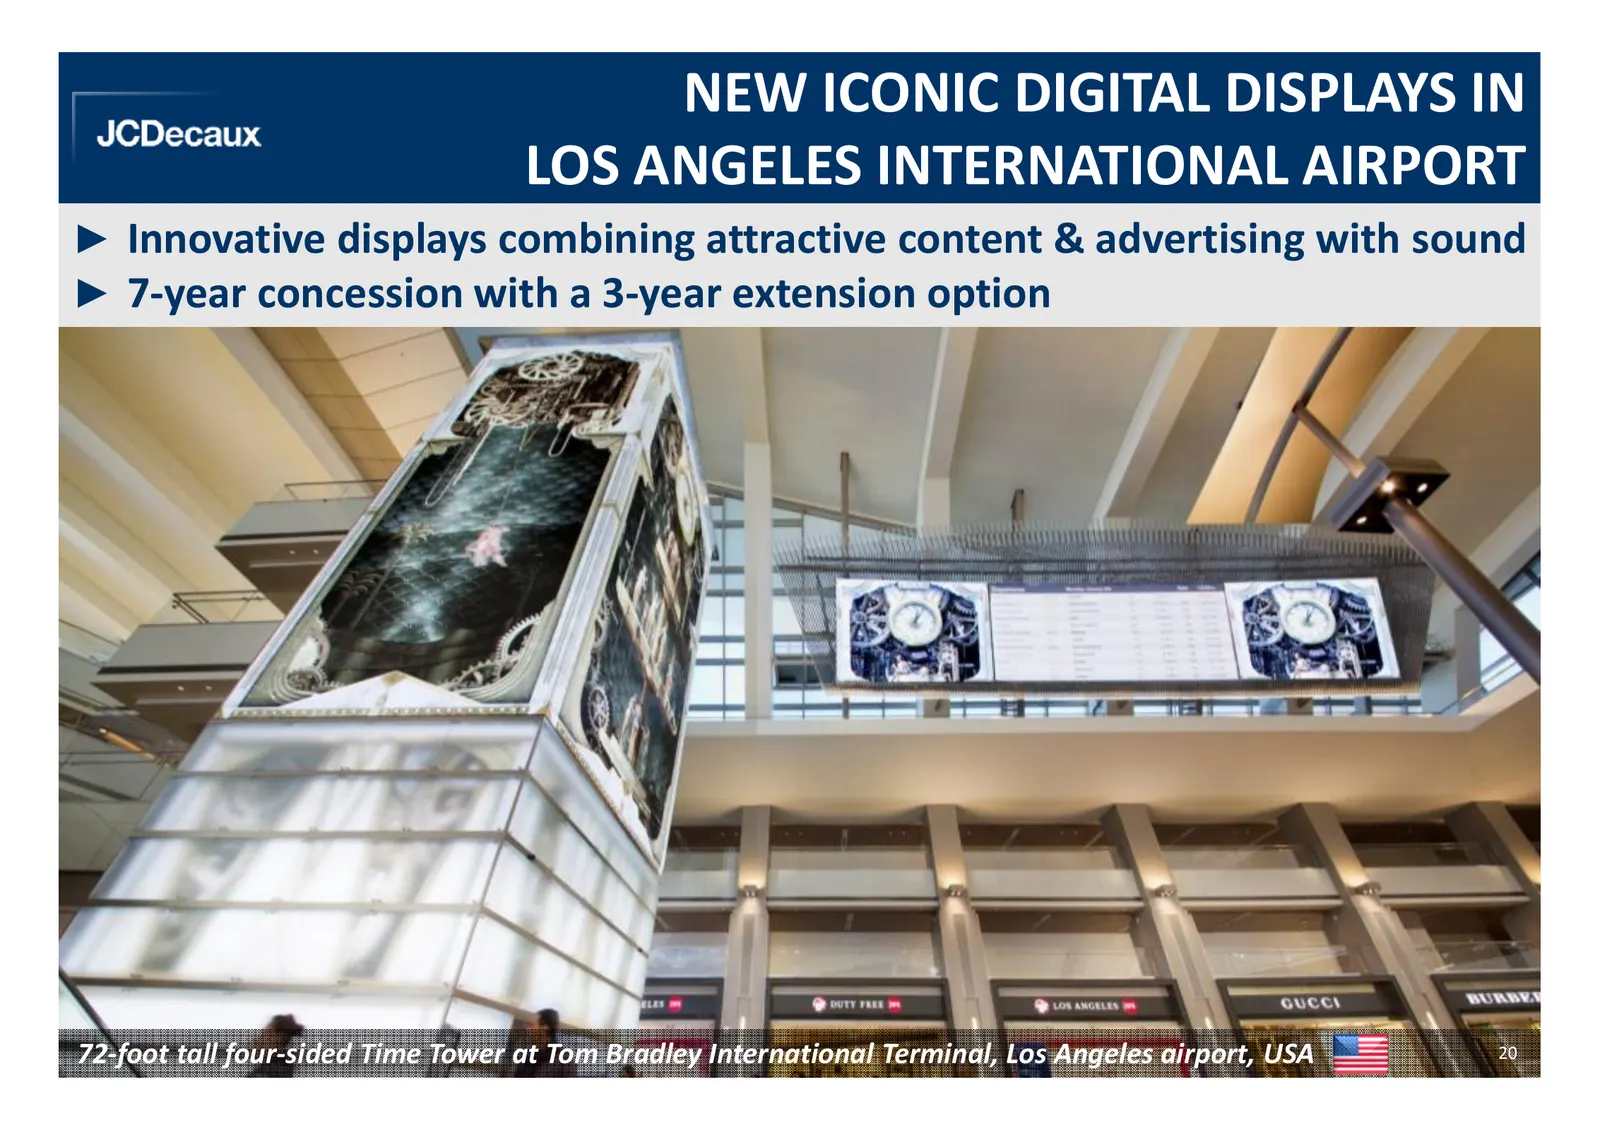
Slide 20: New Iconic Digital Displays in Los Angeles International Airport
NEW ICONIC DIGITAL DISPLAYS IN LOS ANGELES INTERNATIONAL AIRPORT ► Innovative displays combining attractive content & advertising with sound ► 7-year concession with a 3-year extension option 72-foot tall four-sided Time Tower at Tom Bradley International Terminal, Los Angeles airport, USA 20
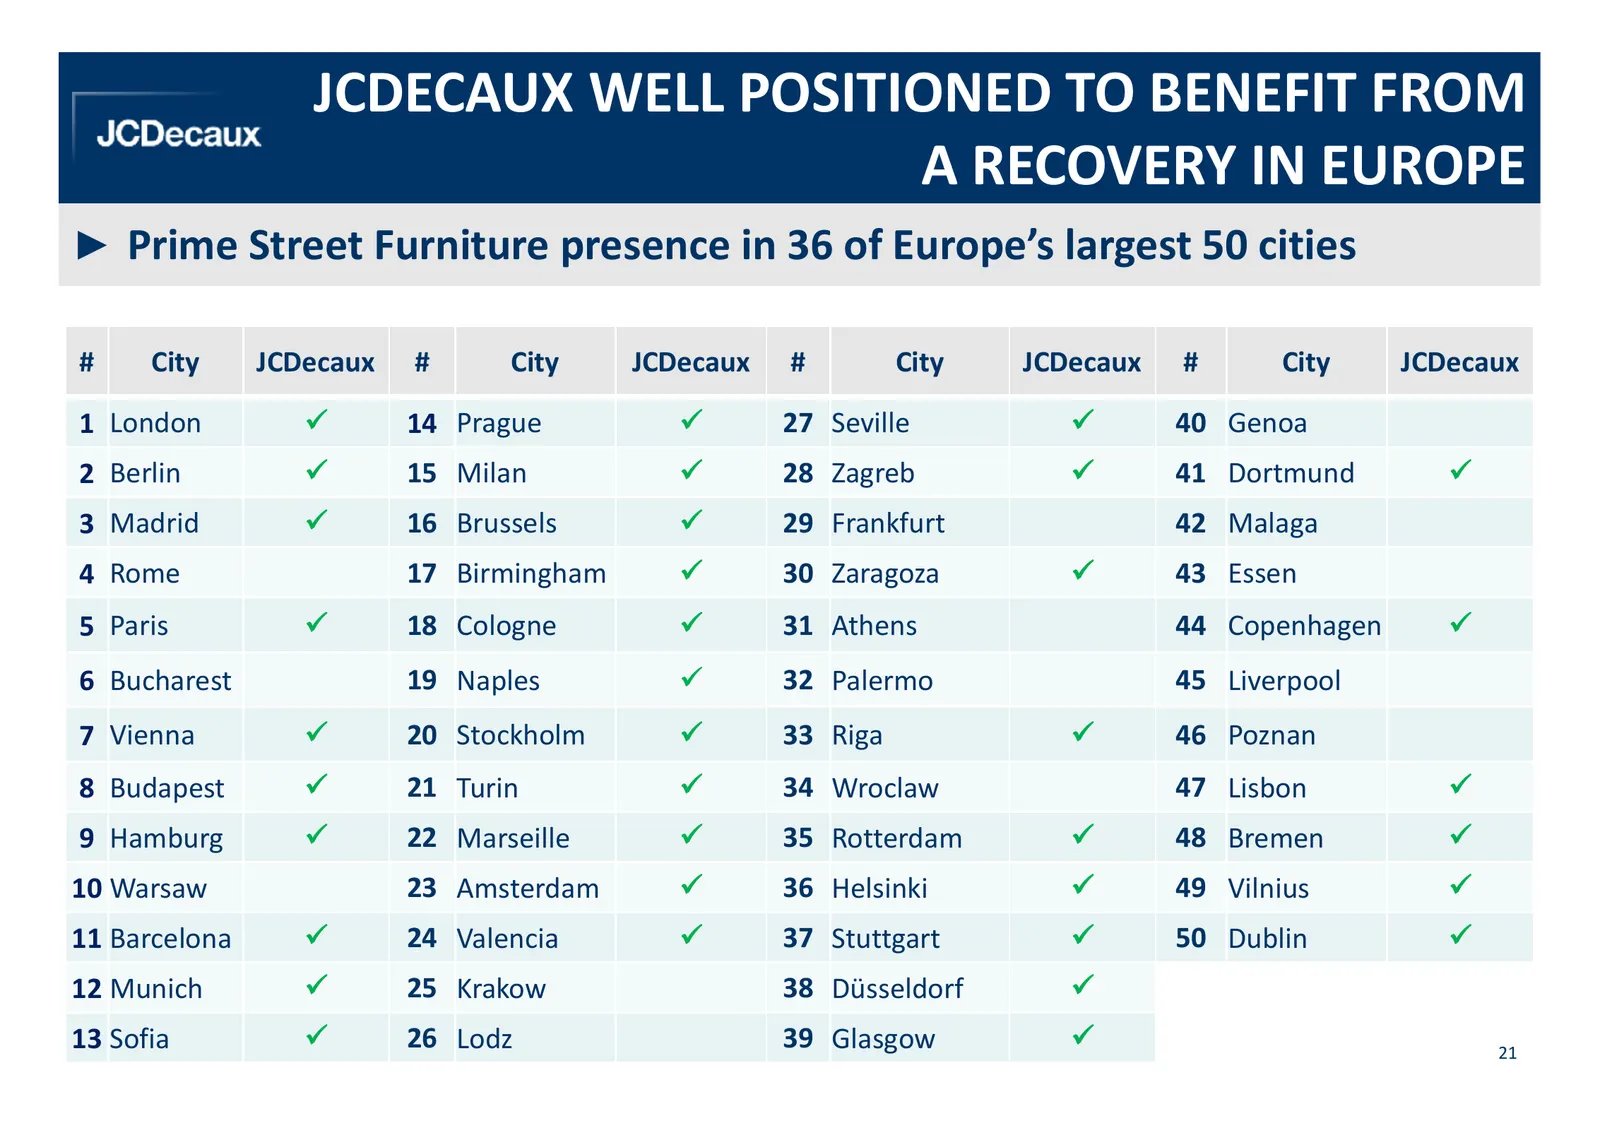
Slide 21: JCDecaux Well Positioned to Benefit from a Recovery in Europe
JCDECAUX WELL POSITIONED TO BENEFIT FROM A RECOVERY IN EUROPE ► Prime Street Furniture presence in 36 of Europe’s largest 50 cities # City JCDecaux # City JCDecaux # City JCDecaux # City JCDecaux 1 London 14 Prague 27 Seville 40 Genoa 2 Berlin 15 Milan 28 Zagreb 41 Dortmund 3 Madrid 16 Brussels 29 F
Slide 22: Financial Highlights
FINANCIAL HIGHLIGHTS 22
Slide 23: 2013 Results
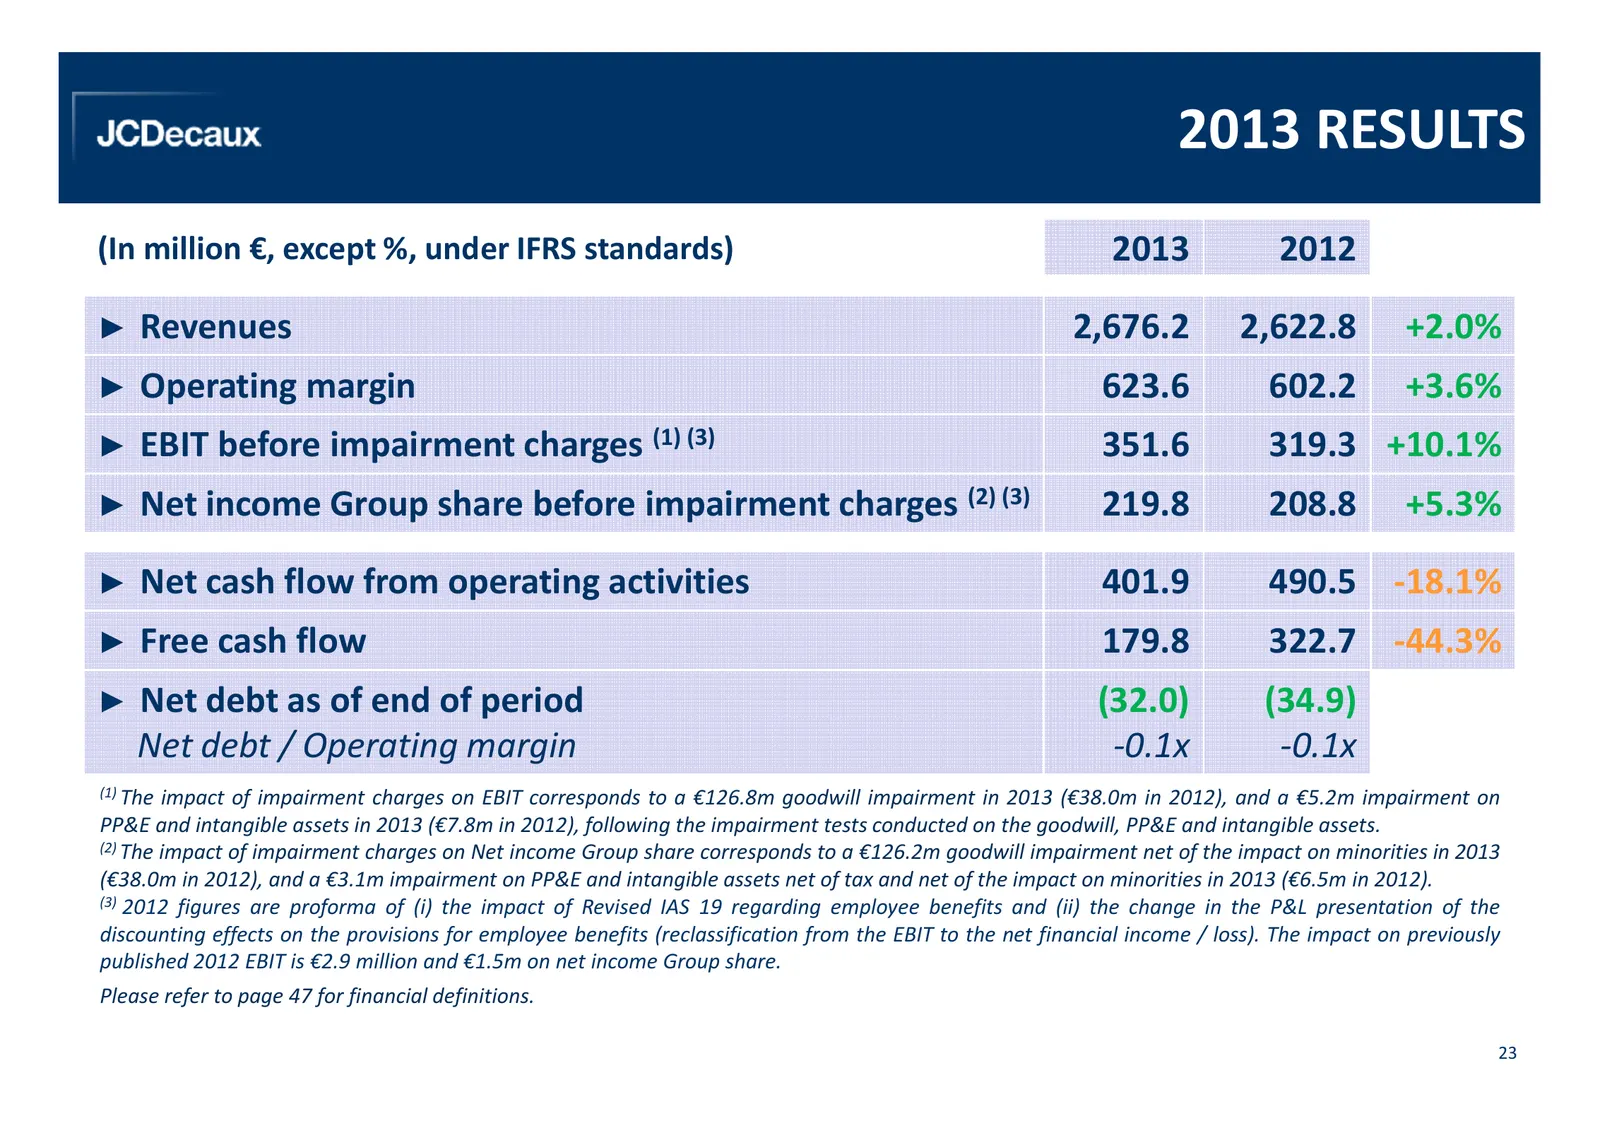
2013 RESULTS (In million €, except %, under IFRS standards) 2013 2012 ► Revenues 2,676.2 2,622.8 +2.0% ► Operating margin 623.6 602.2 +3.6% ► EBIT before impairment charges (1) (3) 351.6 319.3 +10.1% ► Net income Group share before impairment charges (2) (3) 219.8 208.8 +5.3% ► Net cash flow from op
Slide 24: Analysis of Operating Margin
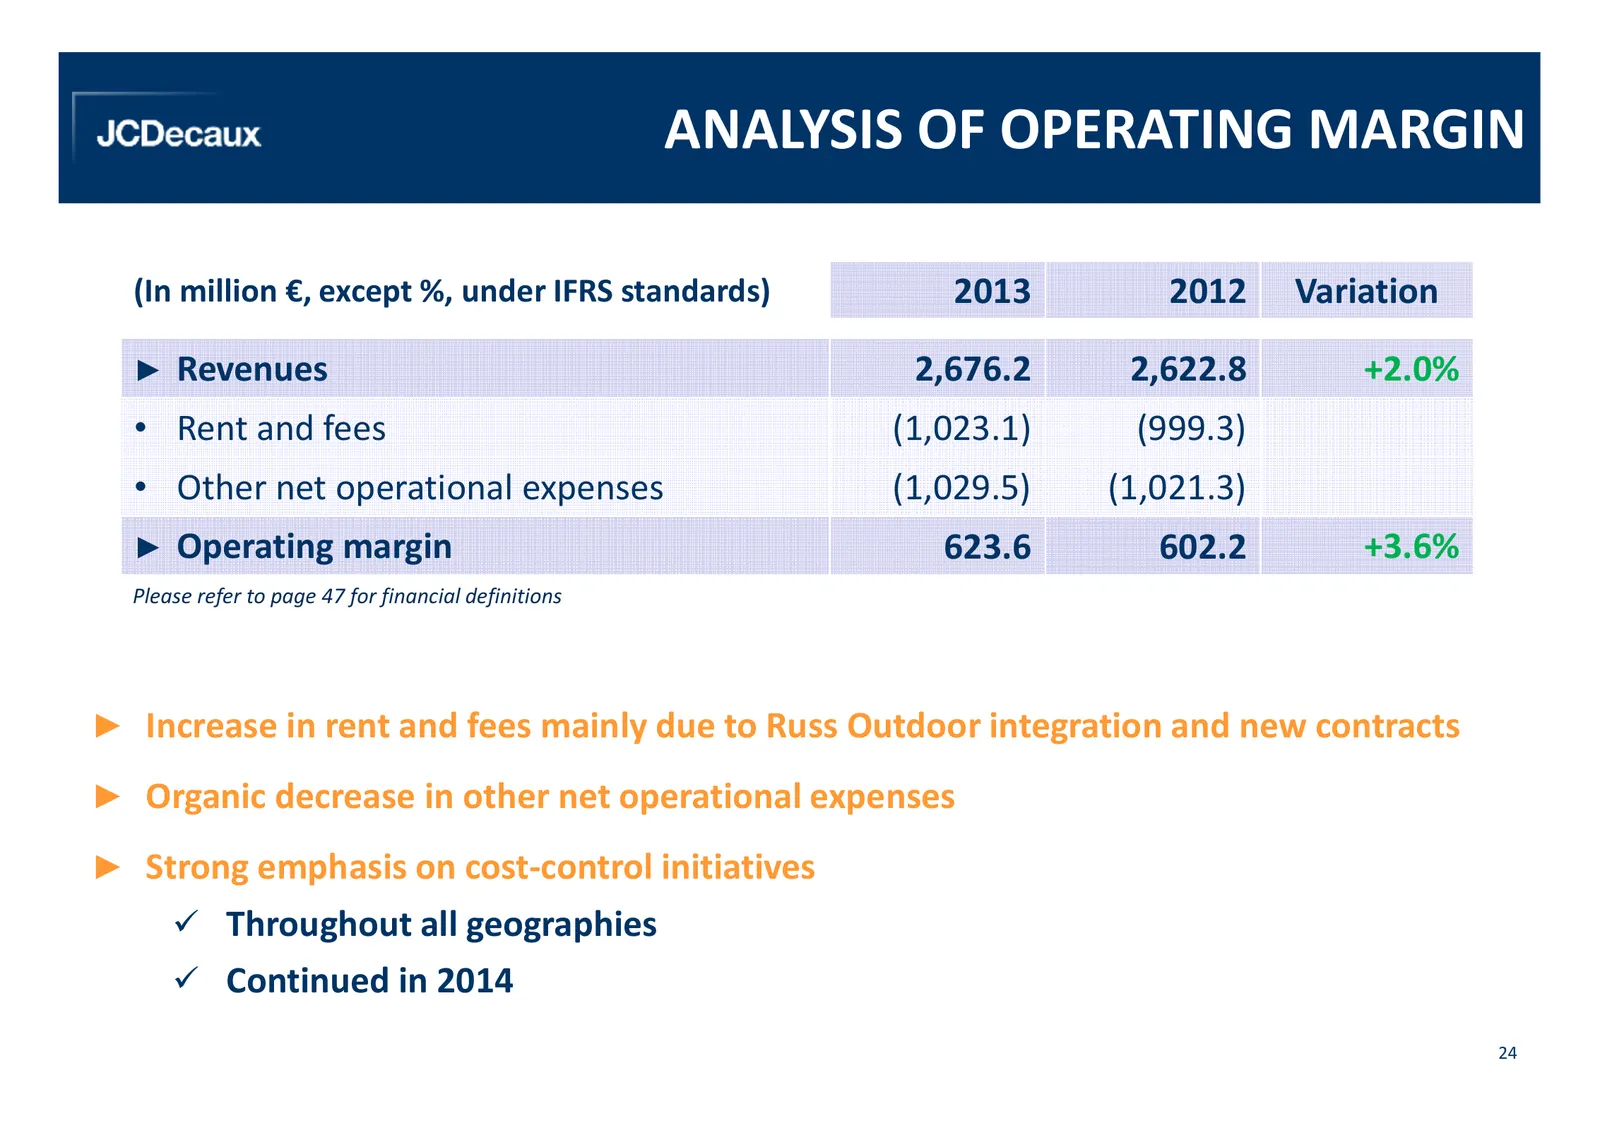
ANALYSIS OF OPERATING MARGIN (In million €, except %, under IFRS standards) 2013 2012 Variation ► Revenues 2,676.2 2,622.8 +2.0% • Rent and fees (1,023.1) (999.3) • Other net operational expenses (1,029.5) (1,021.3) ► Operating margin 623.6 602.2 +3.6% Please refer to page 47 for financial definitio
Slide 25: Operating Margin to EBIT
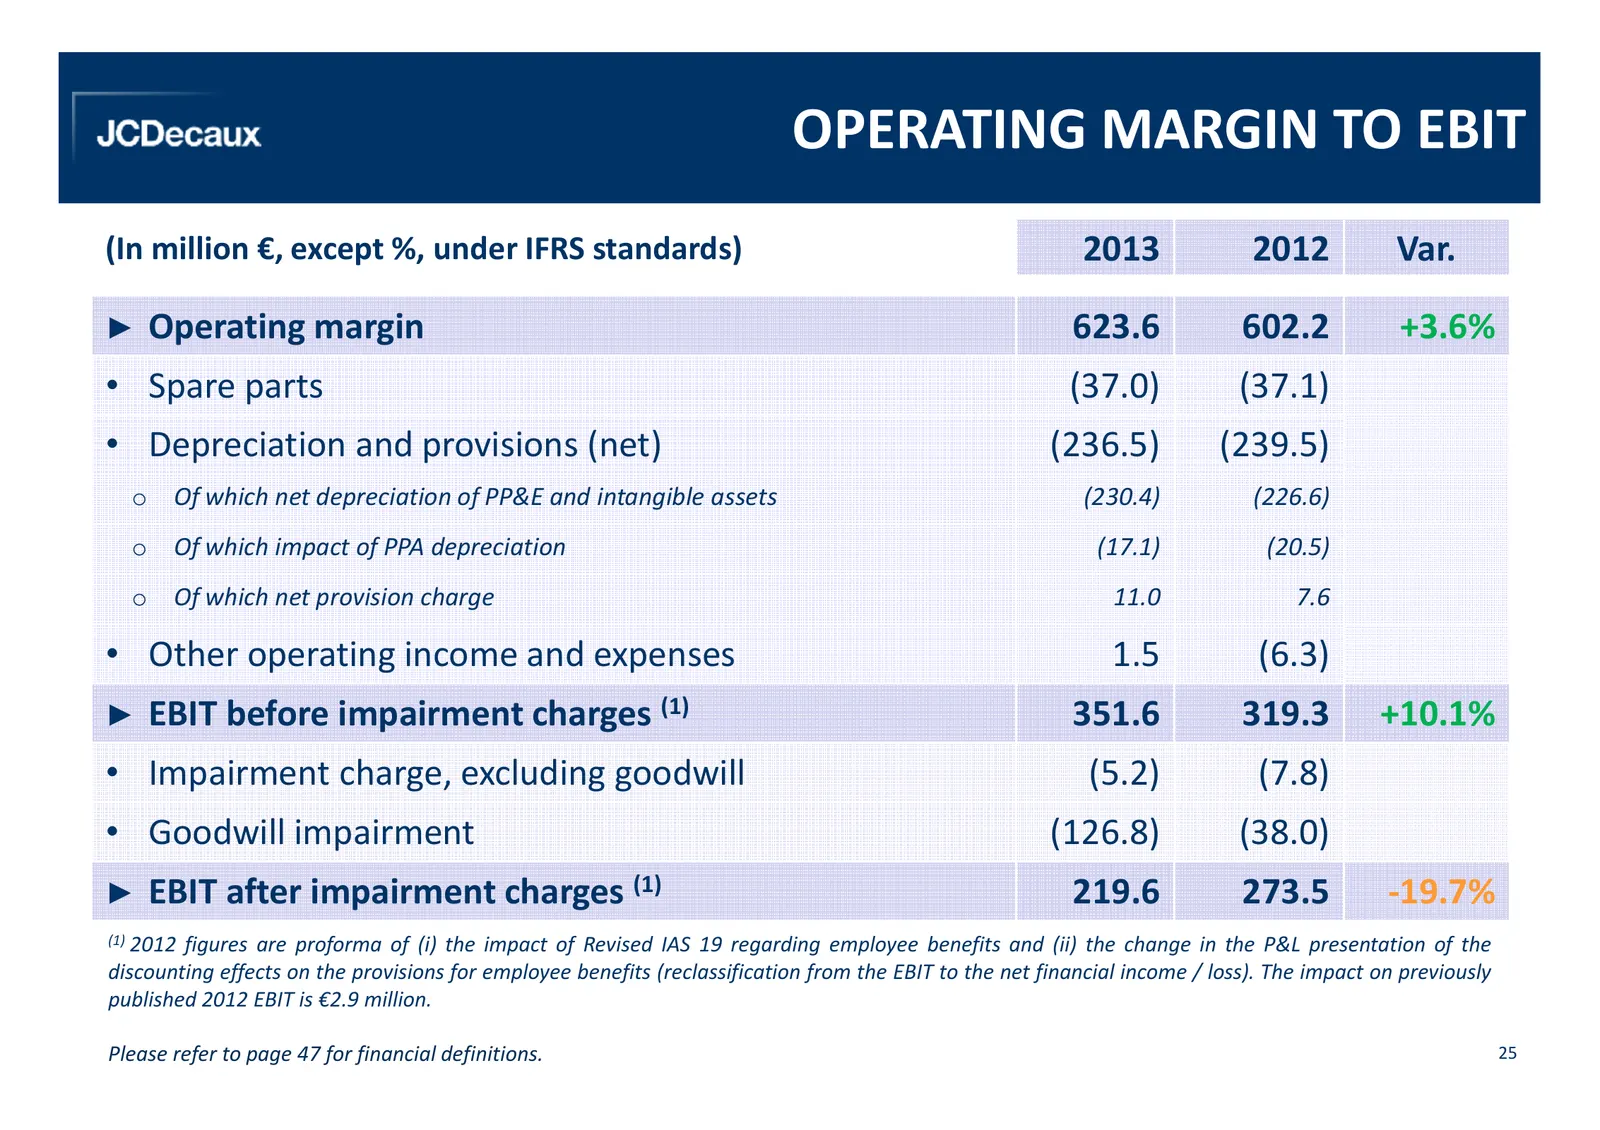
OPERATING MARGIN TO EBIT (In million €, except %, under IFRS standards) 2013 2012 Var. ► Operating margin 623.6 602.2 +3.6% • Spare parts (37.0) (37.1) • Depreciation and provisions (net) (236.5) (239.5) o Of which net depreciation of PP&E and intangible assets (230.4) (226.6) o Of which impact of P
Slide 26: Margins by Segment
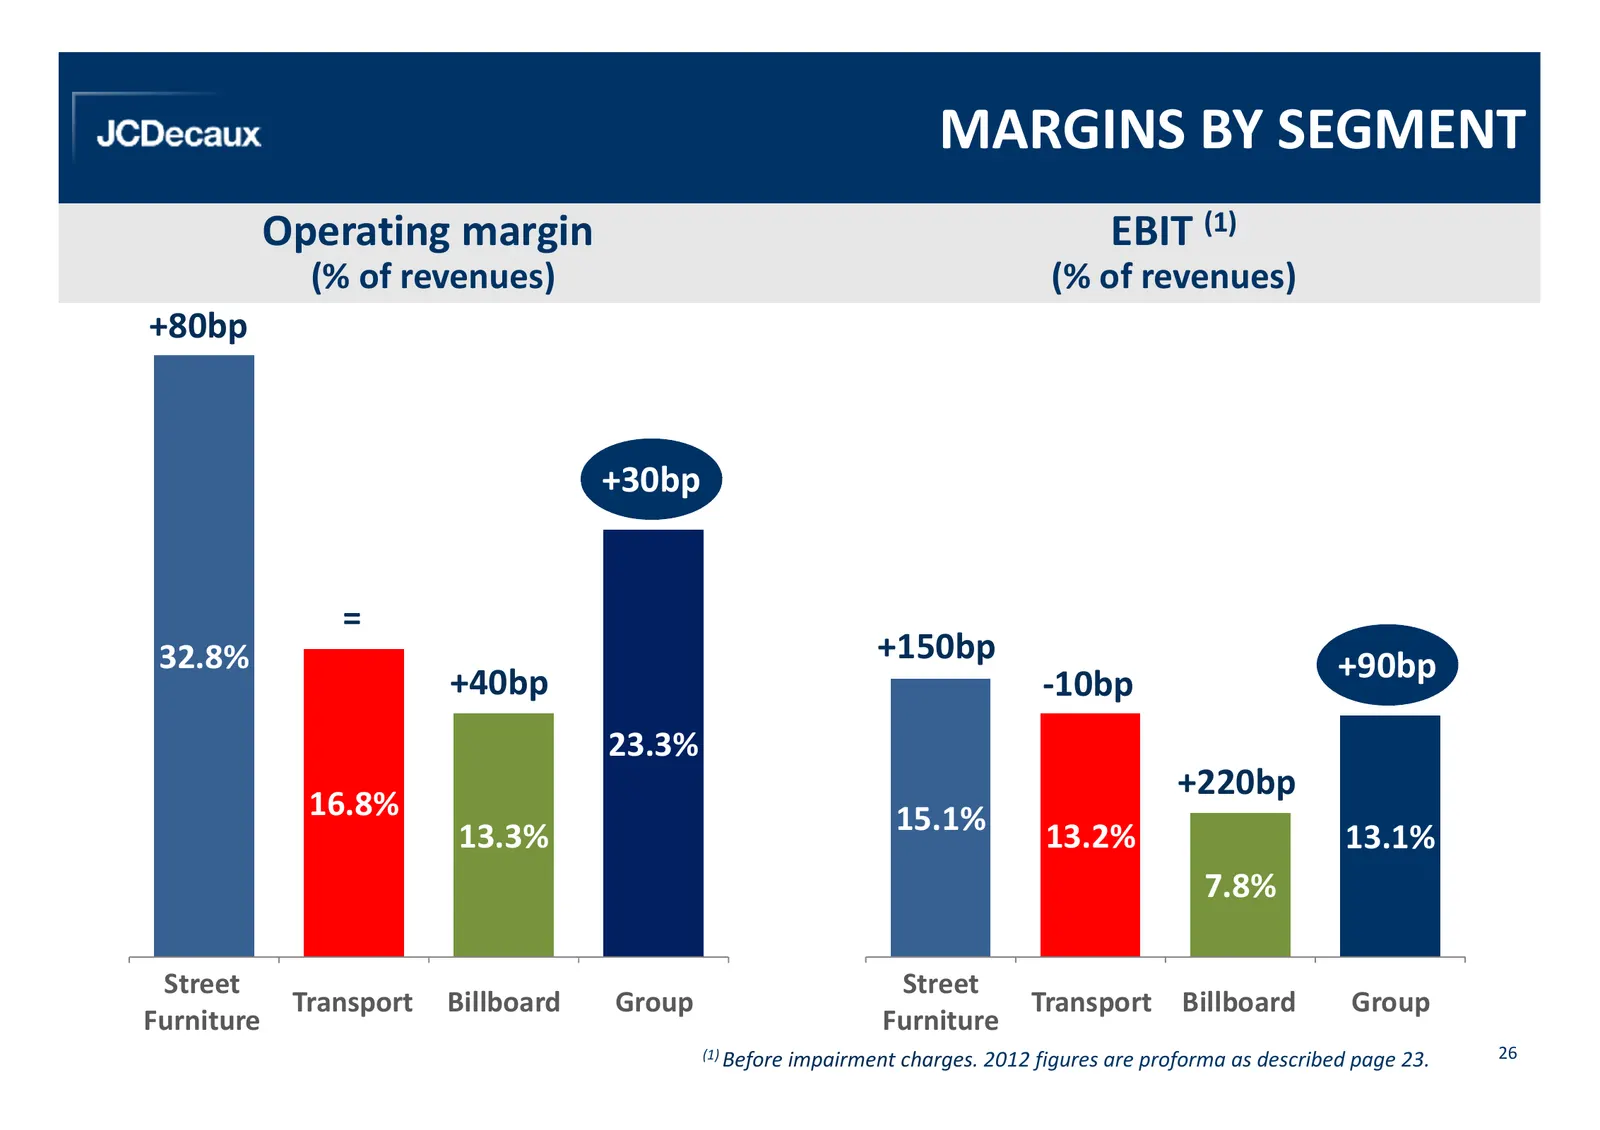
MARGINS BY SEGMENT Operating margin EBIT (1) (% of revenues) (% of revenues) +80bp +30bp = 32.8% +150bp +40bp -10bp +90bp 23.3% +220bp 16.8% 15.1% 13.3% 13.2% 13.1% 7.8% Street Street Transport Billboard Group Transport Billboard Group Furniture Furniture (1) Before impairment charges. 2012 figures
Slide 27: EBIT to Net Income
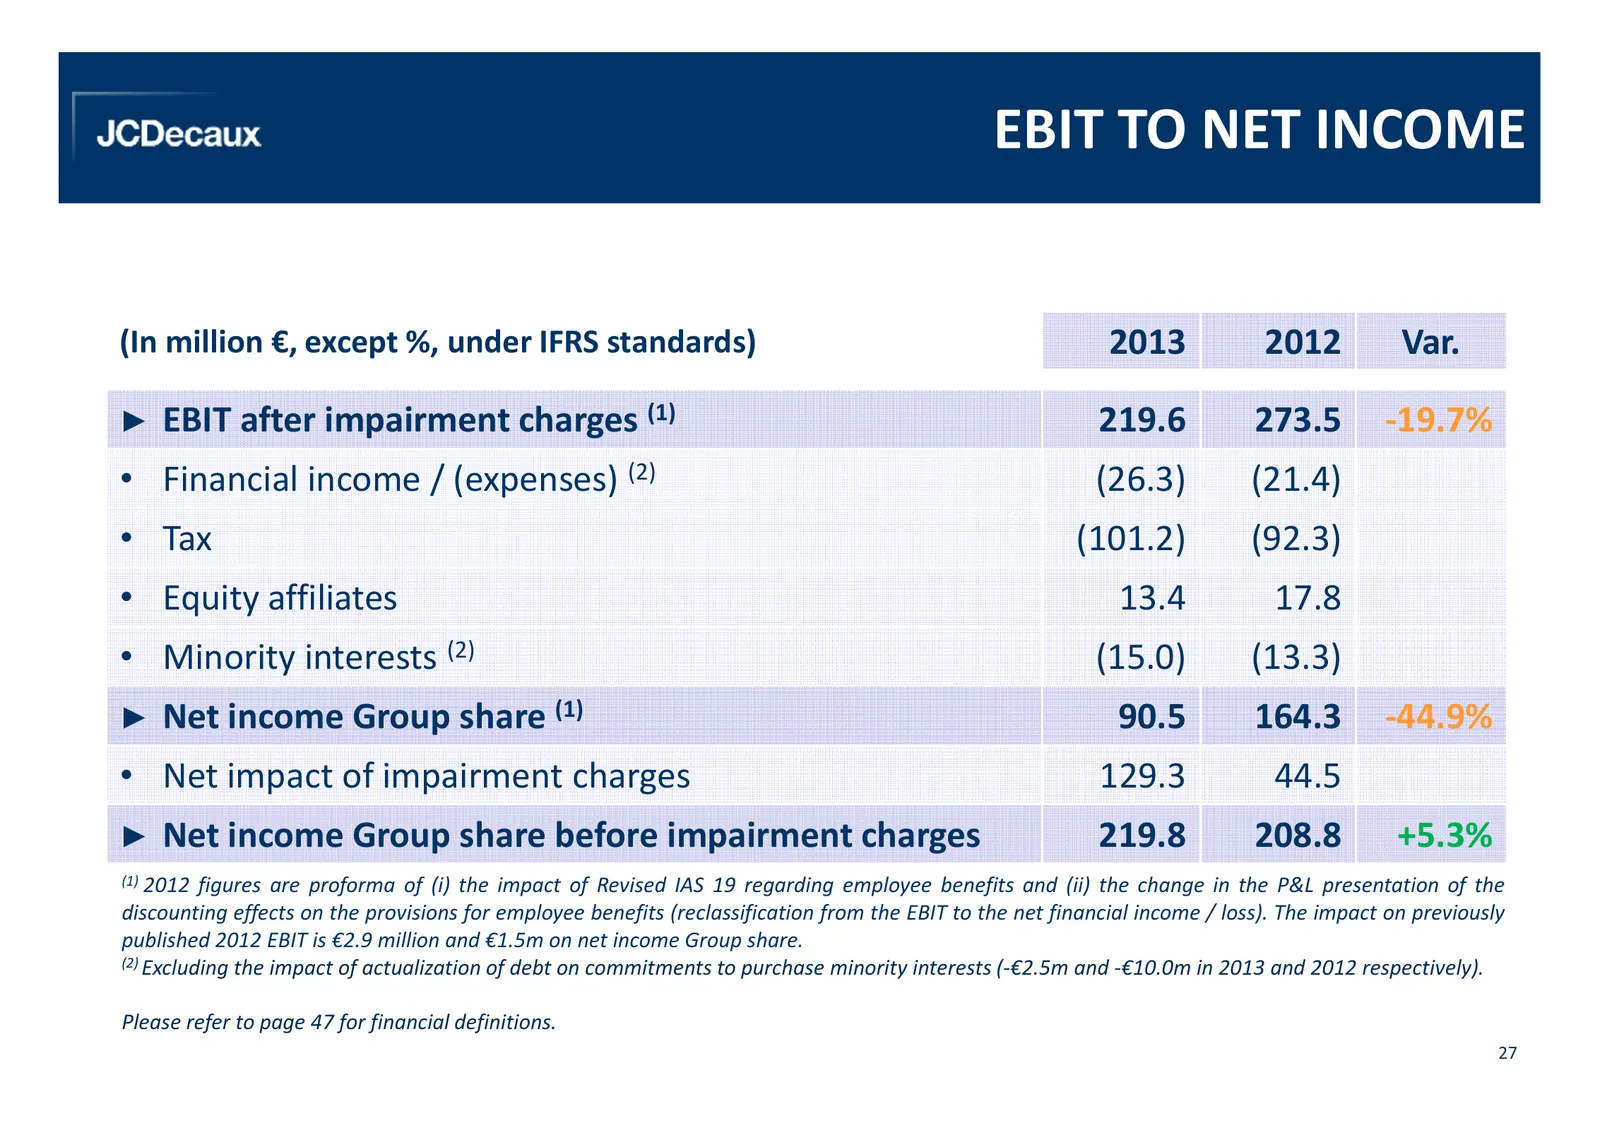
EBIT TO NET INCOME (In million €, except %, under IFRS standards) 2013 2012 Var. ► EBIT after impairment charges (1) 219.6 273.5 -19.7% • Financial income / (expenses) (2) (26.3) (21.4) • Tax (101.2) (92.3) • Equity affiliates 13.4 17.8 • Minority interests (2) (15.0) (13.3) ► Net income Group share
Slide 28: Cash Flow Statement
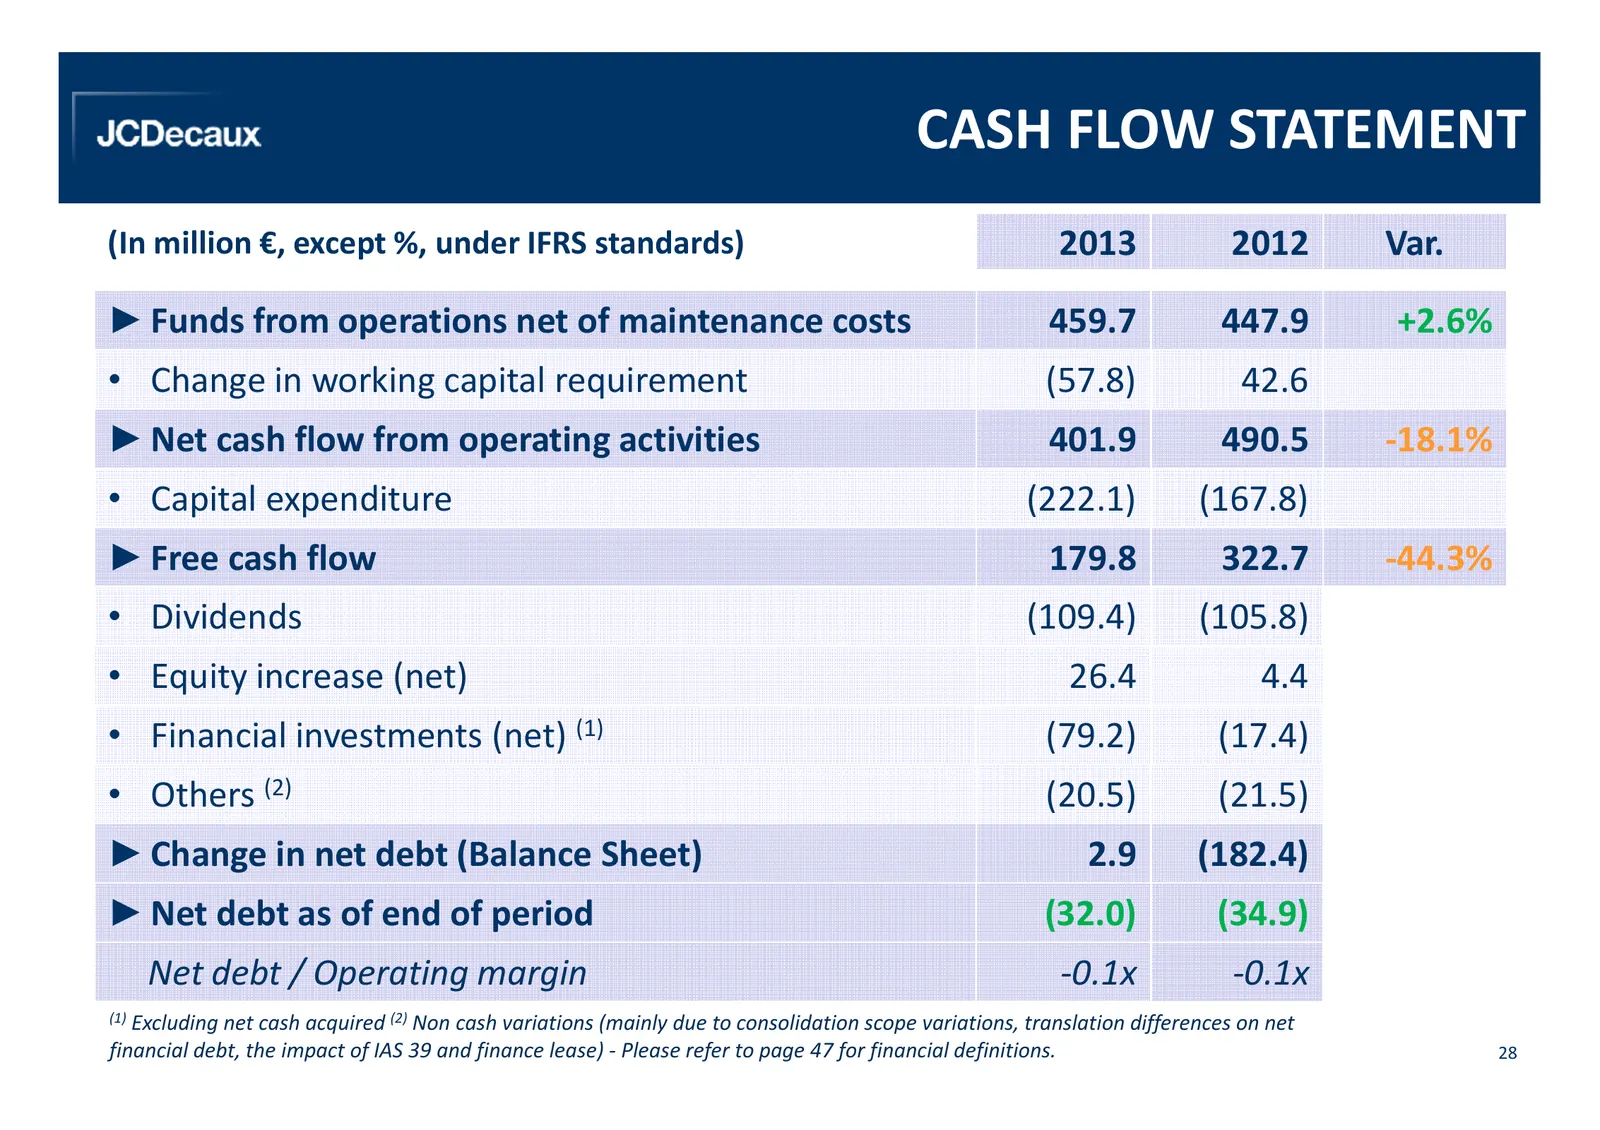
CASH FLOW STATEMENT (In million €, except %, under IFRS standards) 2013 2012 Var. ► Funds from operations net of maintenance costs 459.7 447.9 +2.6% • Change in working capital requirement (57.8) 42.6 ► Net cash flow from operating activities 401.9 490.5 -18.1% • Capital expenditure (222.1) (167.8)
Slide 29: Breakdown of Capex
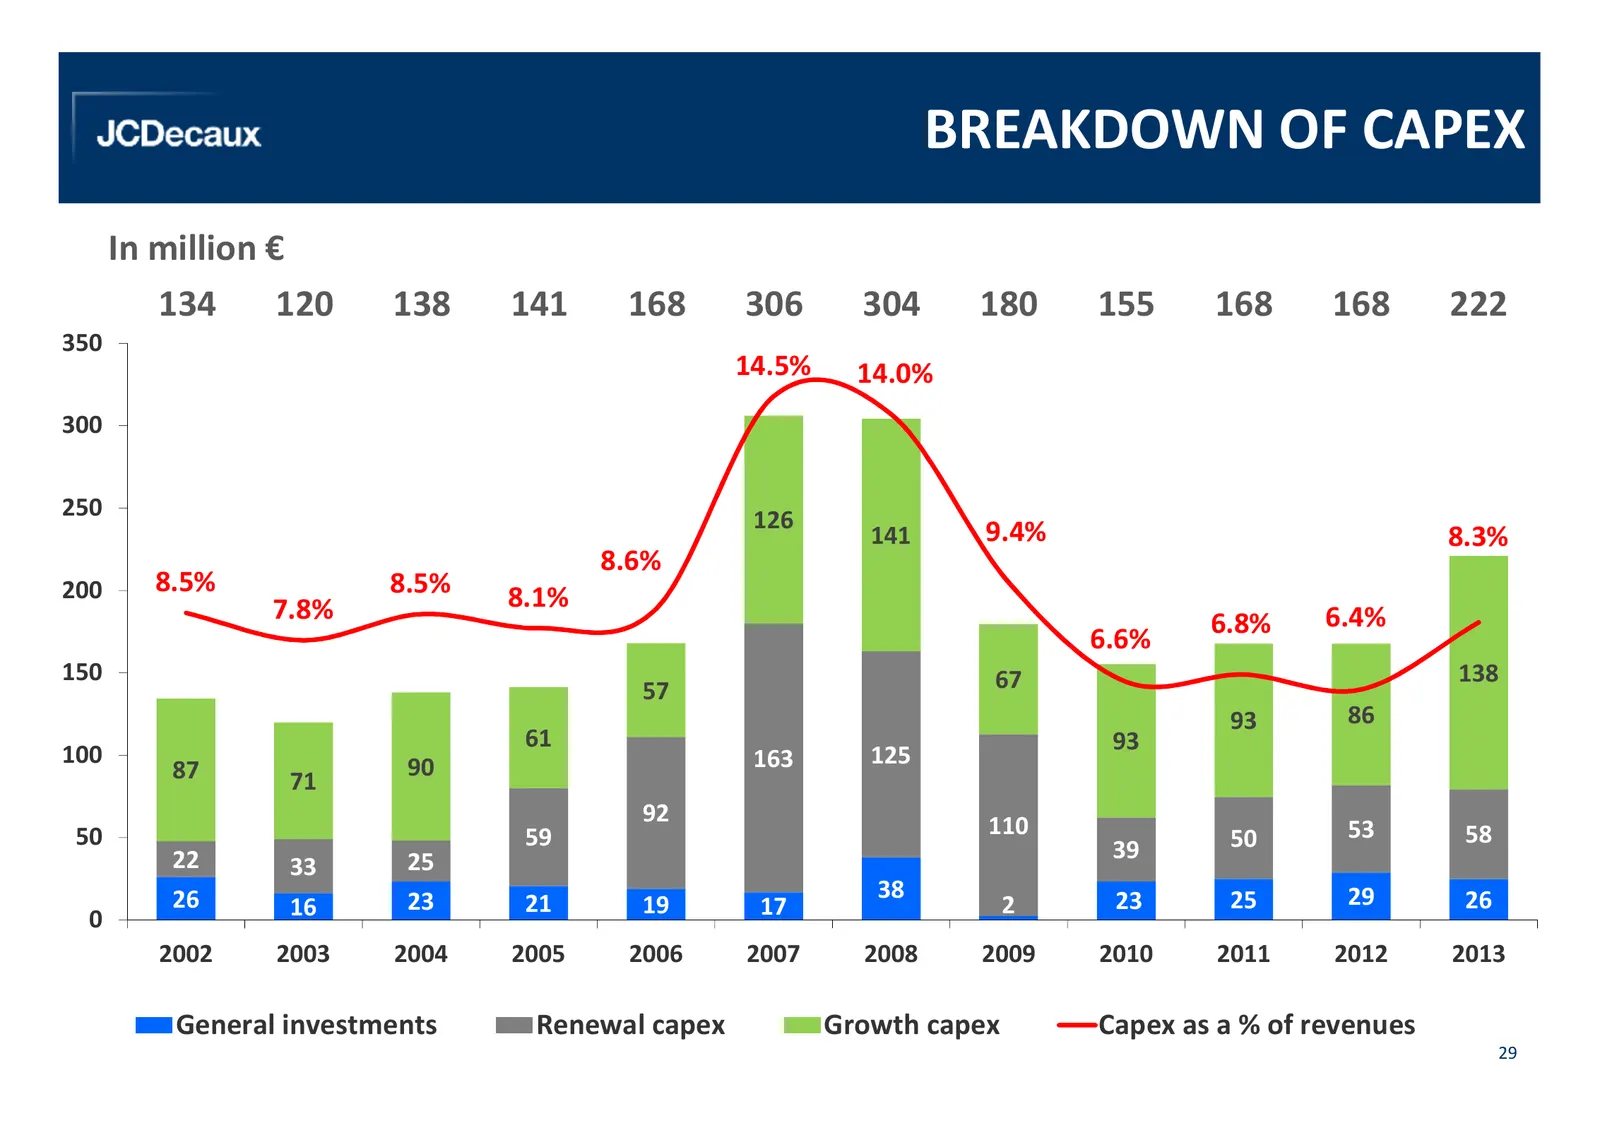
BREAKDOWN OF CAPEX In million € 134 120 138 141 168 306 304 180 155 168 168 222 350 14.5% 14.0% 300 250 126 141 9.4% 8.3% 8.6% 200 8.5% 8.5% 7.8% 8.1% 6.8% 6.4% 6.6% 150 67 138 57 93 86 61 93 100 90 163 125 87 71 92 110 50 59 50 53 58 22 25 39 33 26 23 38 23 25 29 26 16 21 19 17 2 0 2002 2003 2004 2
Slide 30: 2013 Financial Highlights
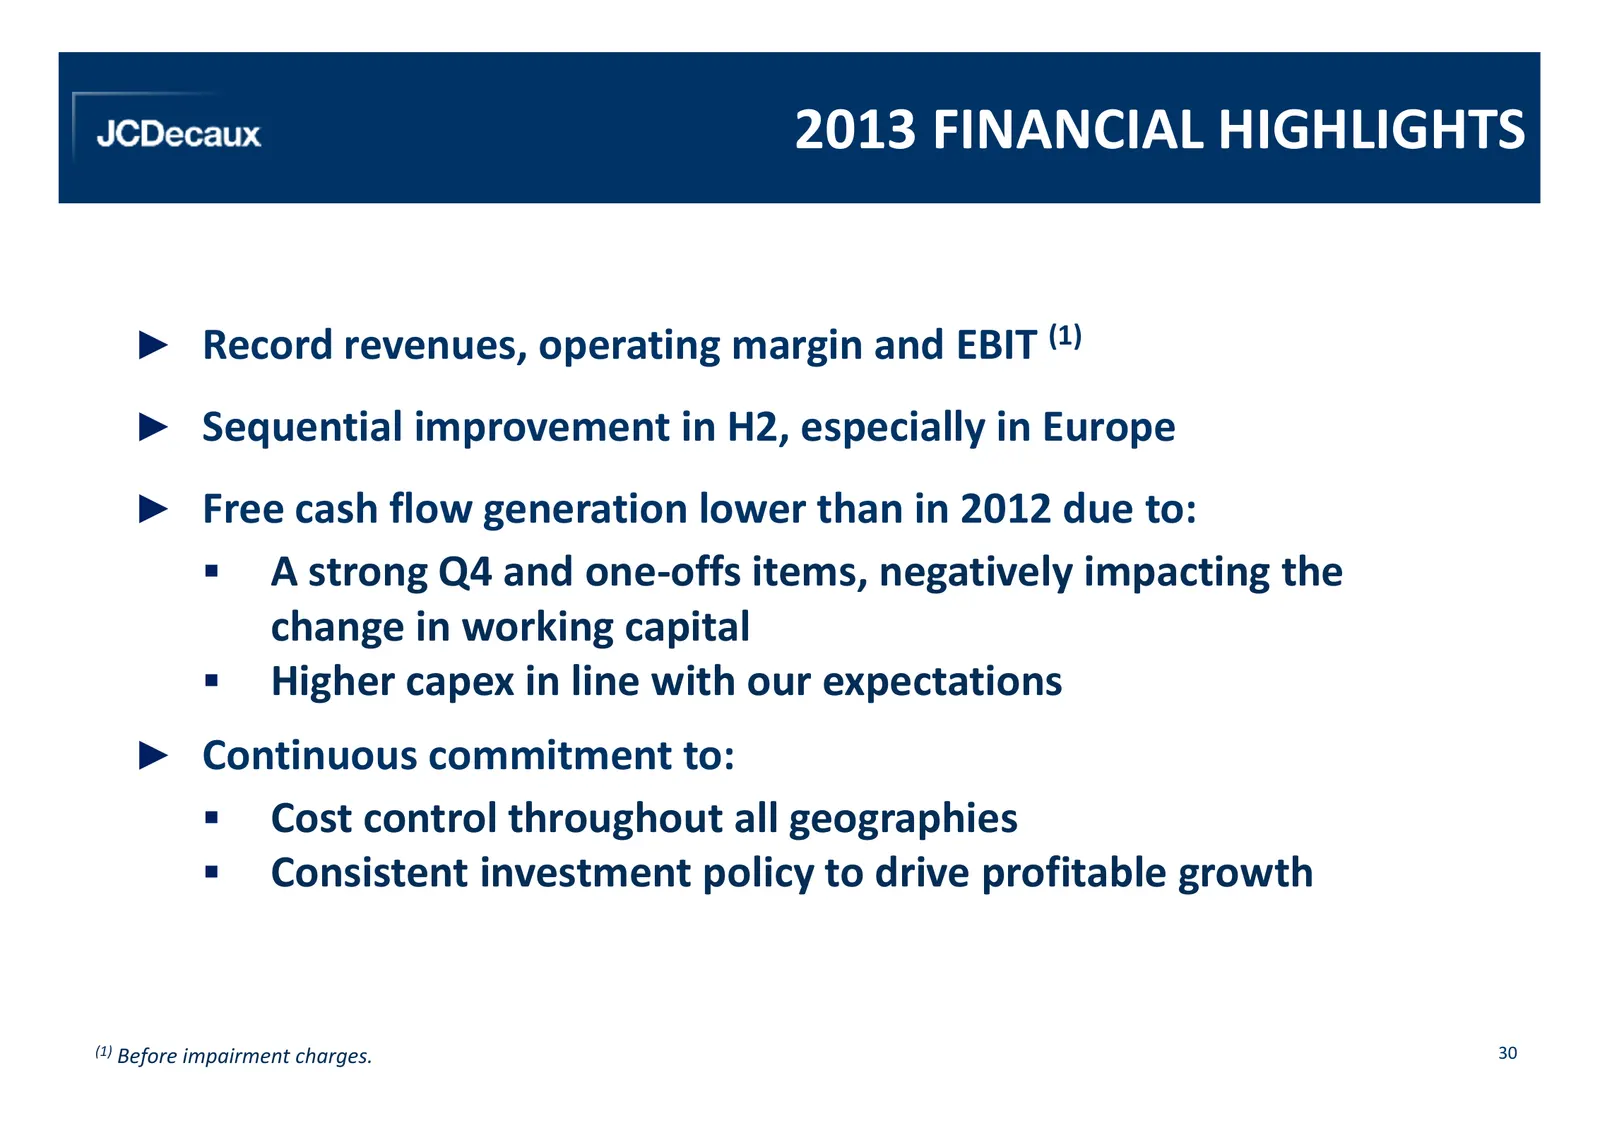
2013 FINANCIAL HIGHLIGHTS ► Record revenues, operating margin and EBIT (1) ► Sequential improvement in H2, especially in Europe ► Free cash flow generation lower than in 2012 due to: A strong Q4 and one-offs items, negatively impacting the change in working capital Higher capex in line with our expe

Slide 31: Growth Strategy and Outlook
GROWTH STRATEGY AND OUTLOOK 31
Slide 32: Urbanization Accelerates
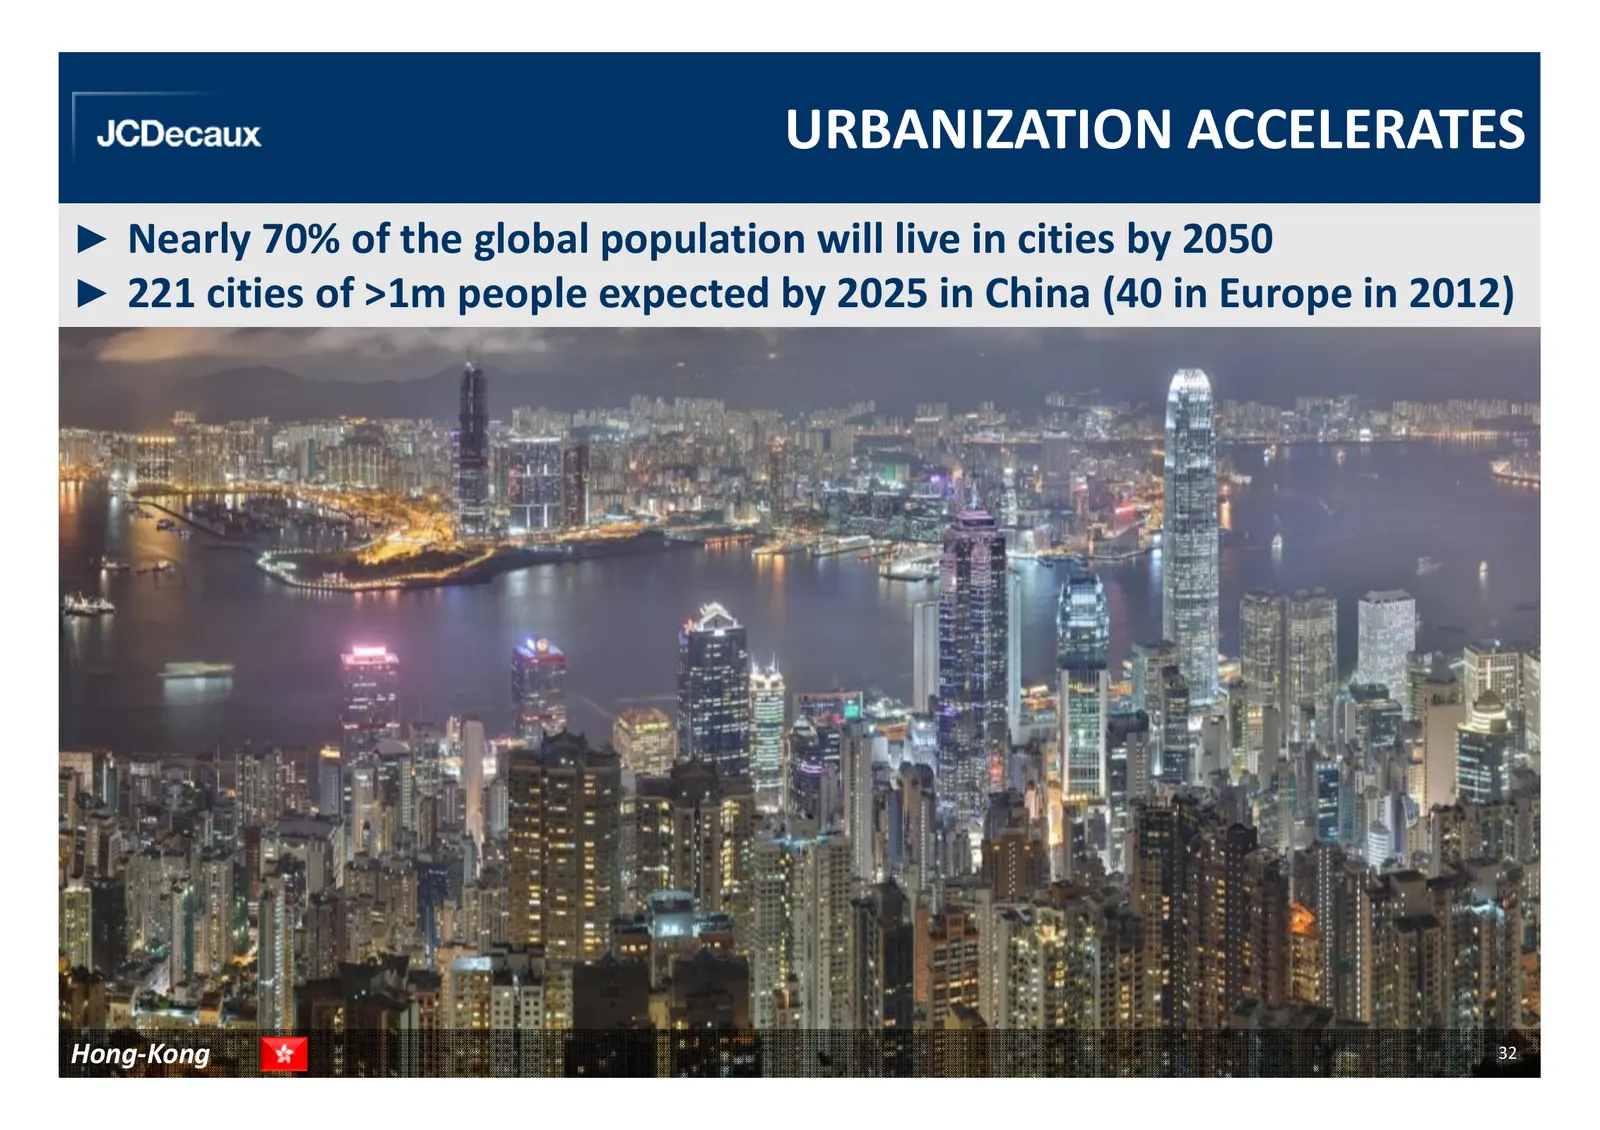
URBANIZATION ACCELERATES ► Nearly 70% of the global population will live in cities by 2050 ► 221 cities of >1m people expected by 2025 in China (40 in Europe in 2012) Hong-Kong 32
Slide 33: Global Wealth Is Concentrating in Cities
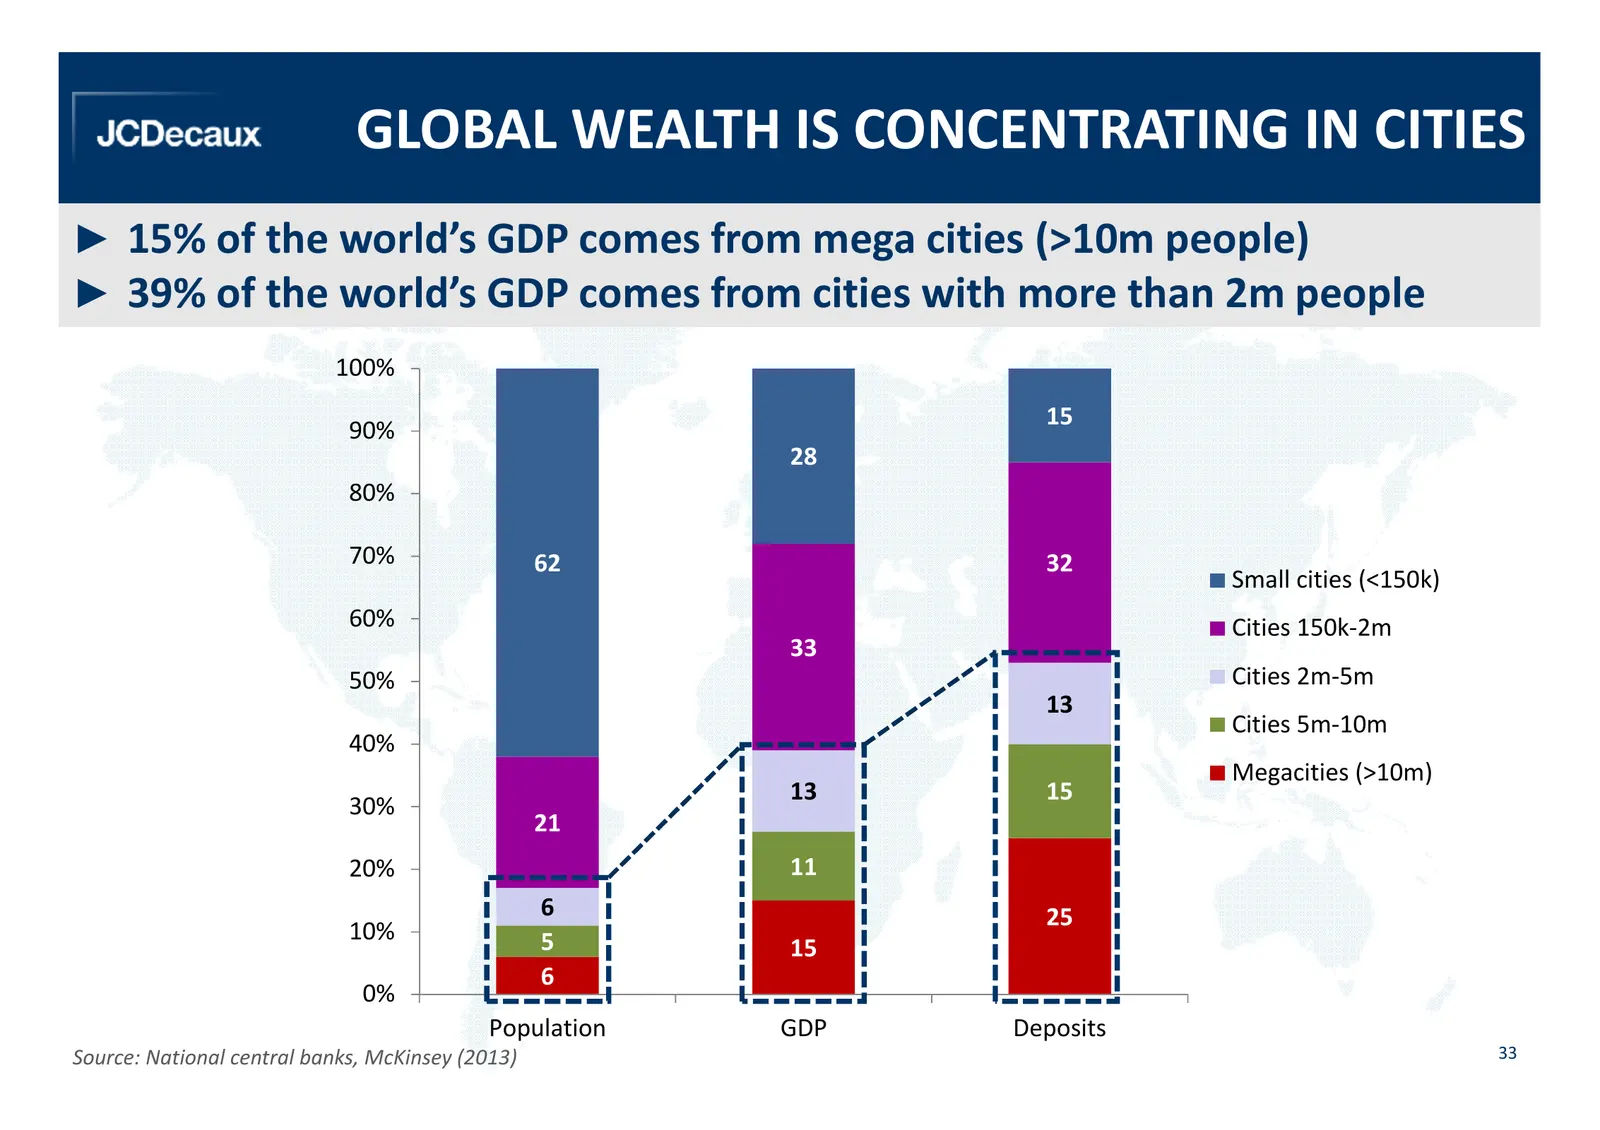
GLOBAL WEALTH IS CONCENTRATING IN CITIES ► 15% of the world’s GDP comes from mega cities (>10m people) ► 39% of the world’s GDP comes from cities with more than 2m people 100% 15 90% 28 80% 70% 62 32 Small cities (<150k) 60% Cities 150k-2m 33 50% Cities 2m-5m 13 Cities 5m-10m 40% Megacities (>10m) 1
Slide 34: Air Passenger Traffic Doubles Every 15 Years
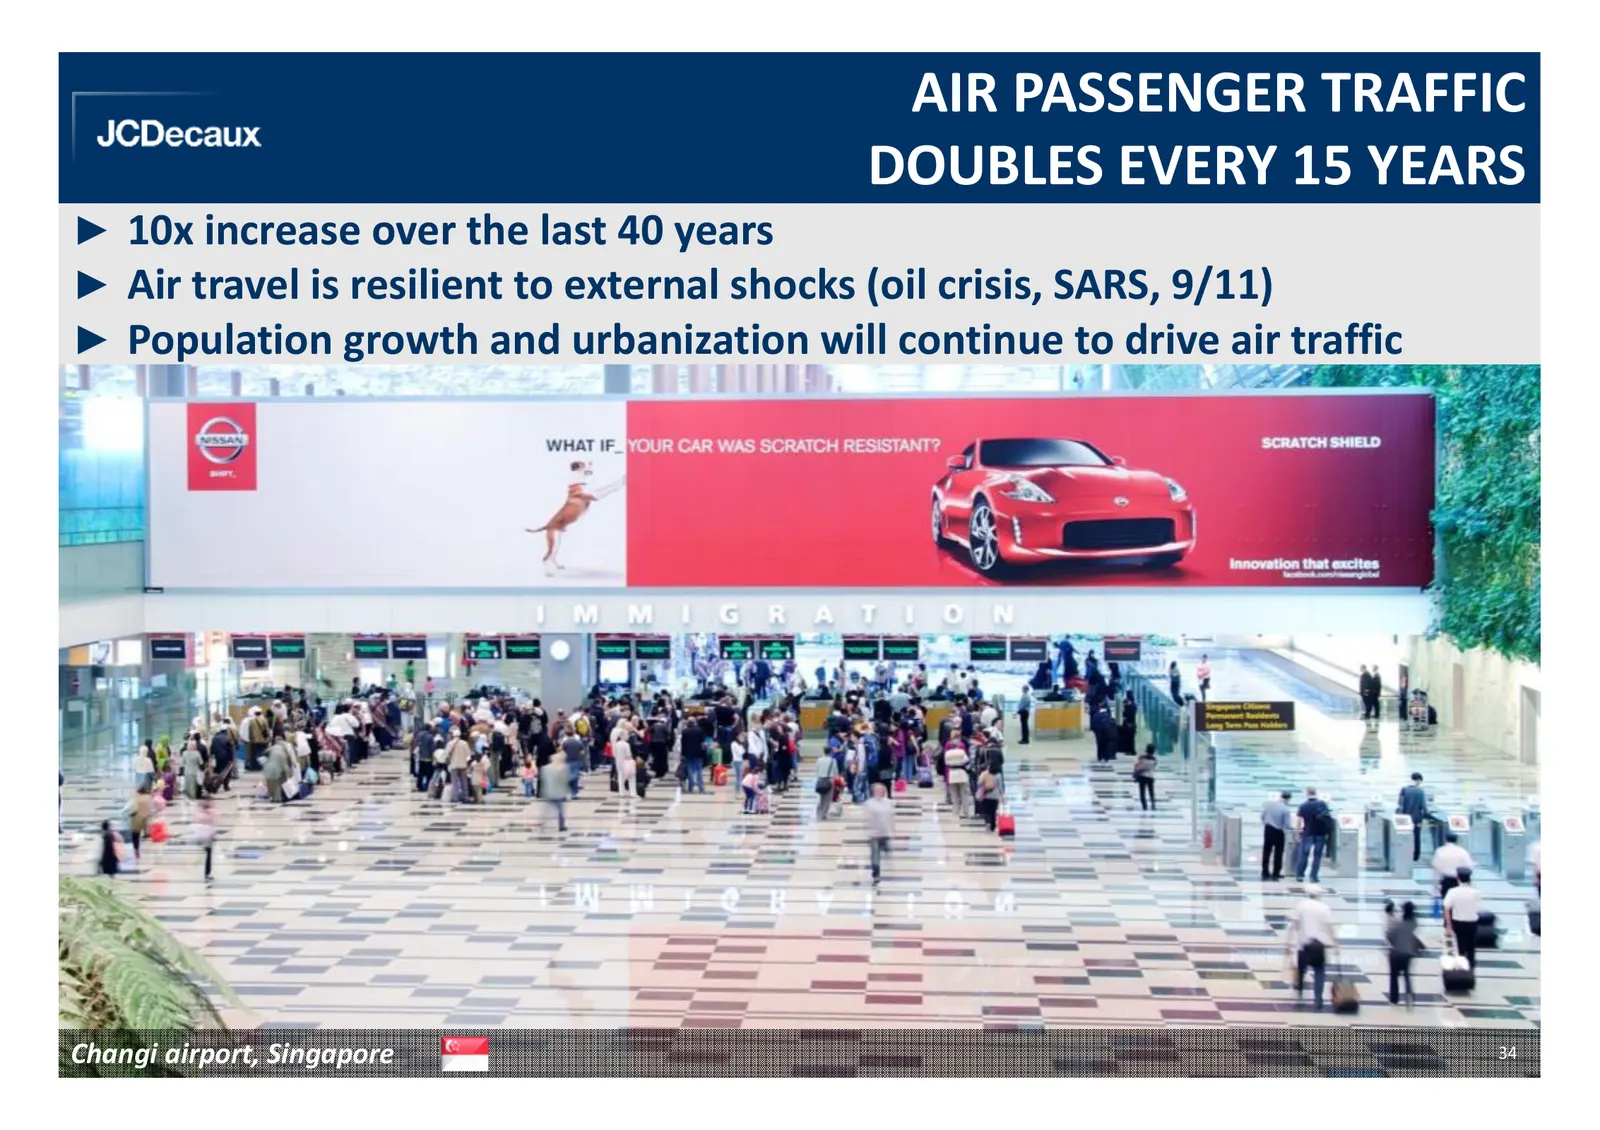
AIR PASSENGER TRAFFIC DOUBLES EVERY 15 YEARS ► 10x increase over the last 40 years ► Air travel is resilient to external shocks (oil crisis, SARS, 9/11) ► Population growth and urbanization will continue to drive air traffic Changi airport, Singapore 34
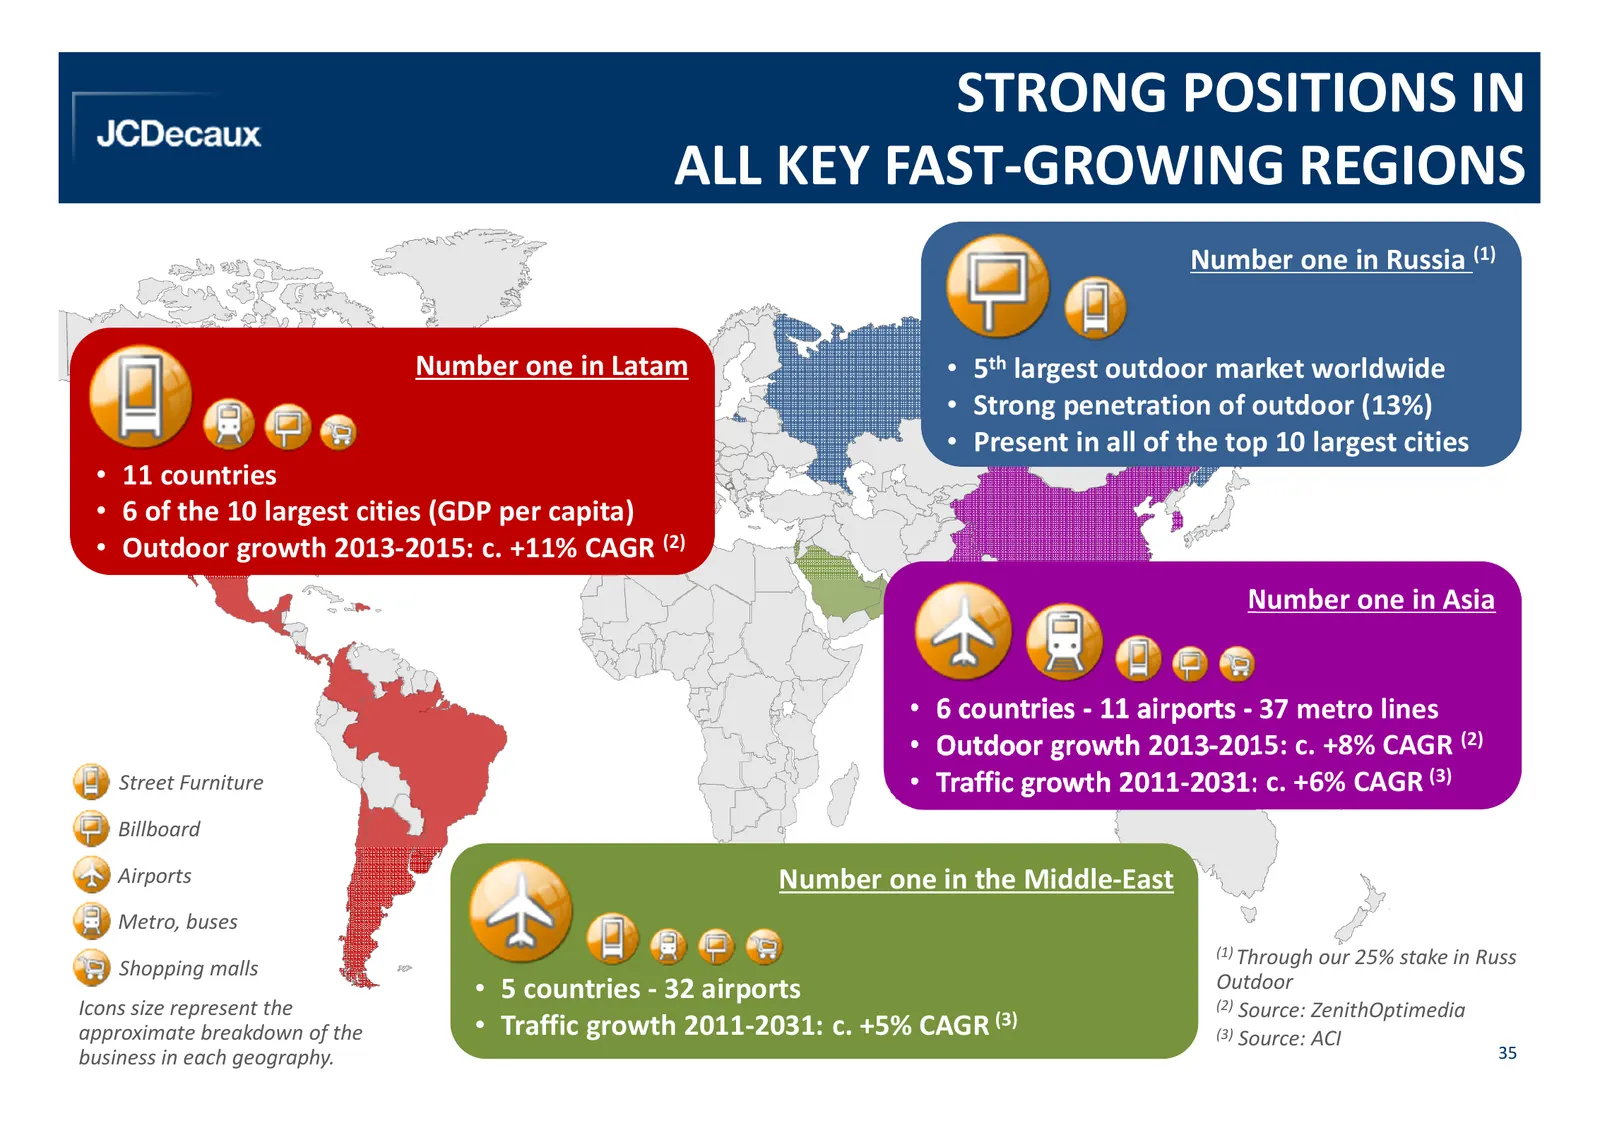
Slide 35: Strong Positions in All Key Fast-Growing Regions
STRONG POSITIONS IN ALL KEY FAST-GROWING REGIONS Number one in Russia (1) Number one in Latam • 5th largest outdoor market worldwide • Strong penetration of outdoor (13%) • Present in all of the top 10 largest cities • 11 countries • 6 of the 10 largest cities (GDP per capita) • Outdoor growth 2013-
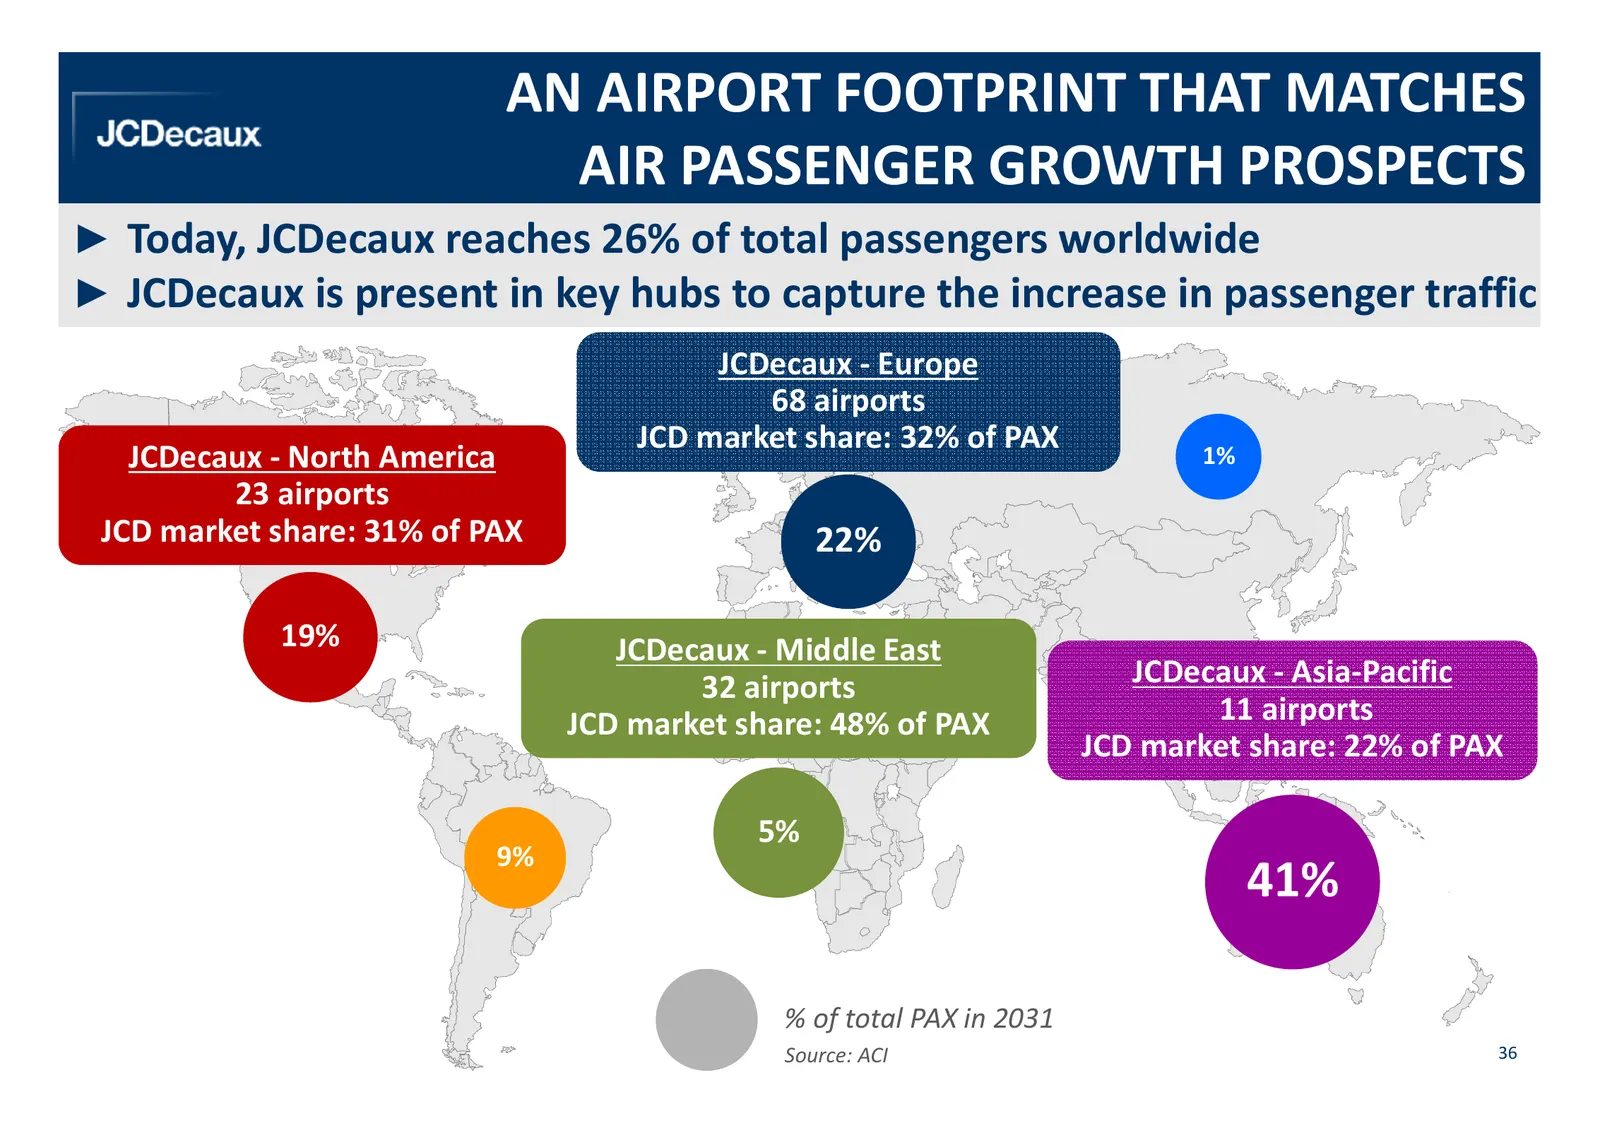
Slide 36: An Airport Footprint That Matches Air Passenger Growth Prospects
AN AIRPORT FOOTPRINT THAT MATCHES AIR PASSENGER GROWTH PROSPECTS ► Today, JCDecaux reaches 26% of total passengers worldwide ► JCDecaux is present in key hubs to capture the increase in passenger traffic JCDecaux - Europe 68 airports JCD market share: 32% of PAX JCDecaux - North America 1% 23 airpor
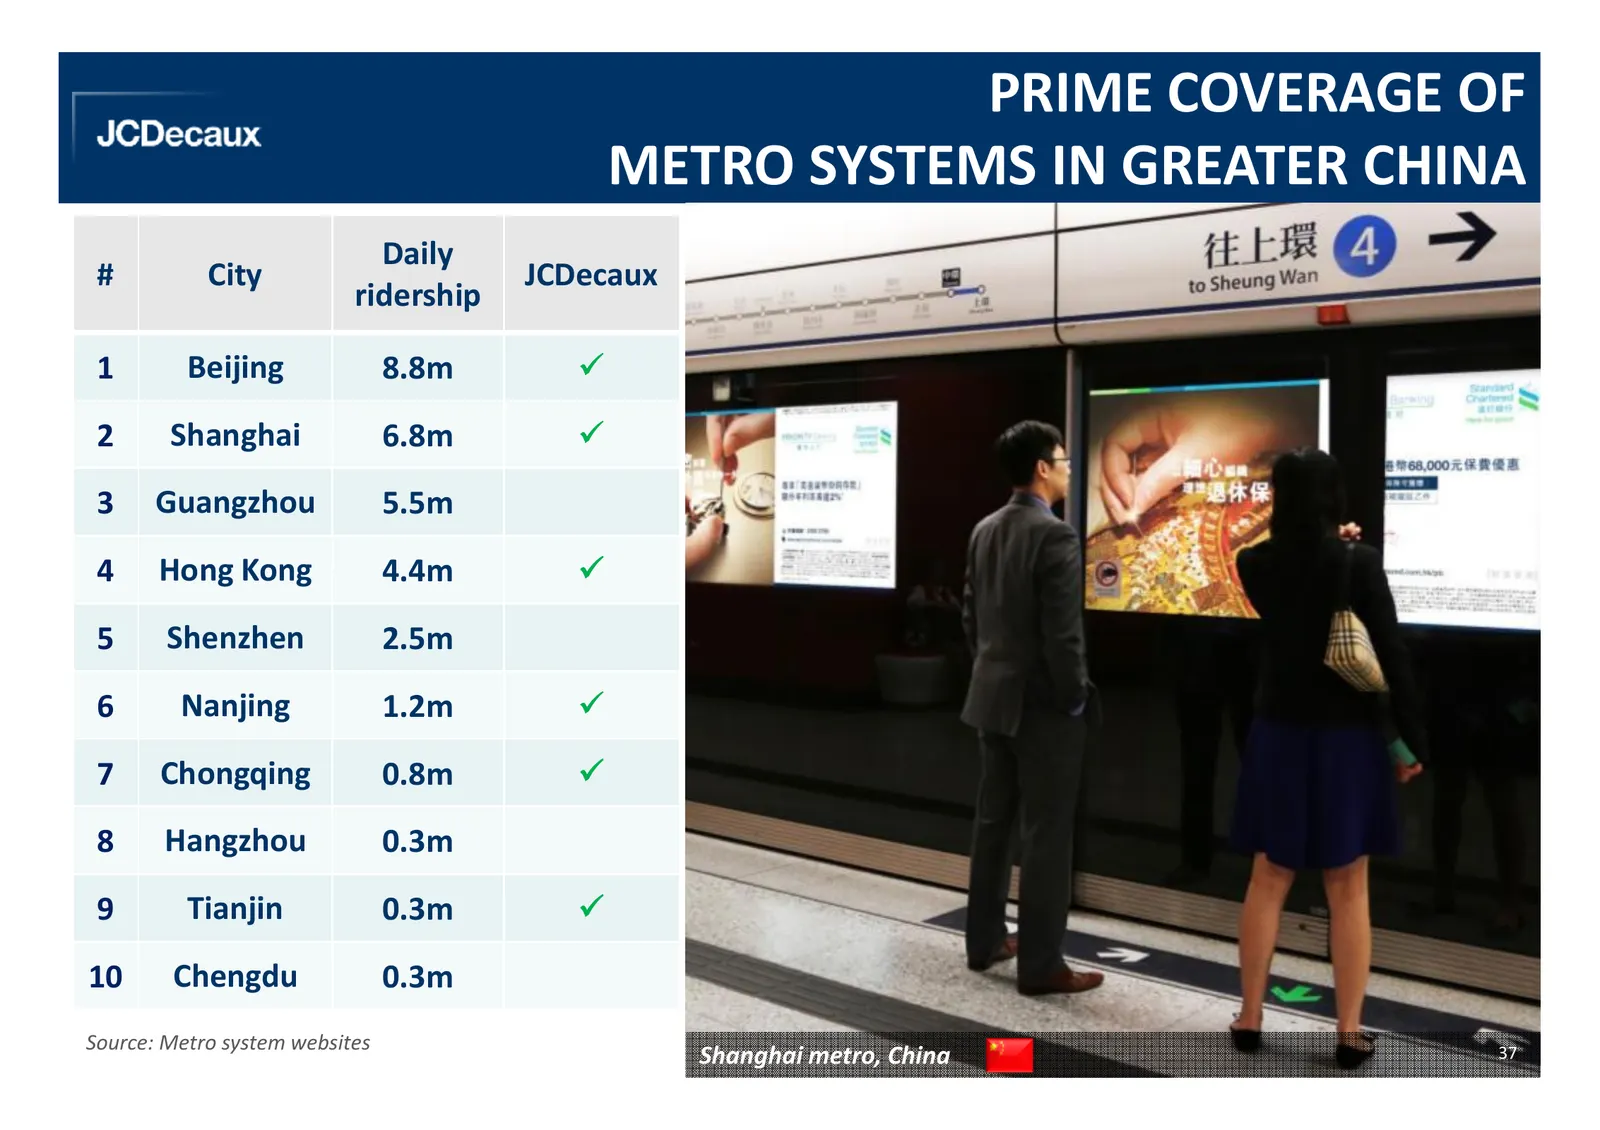
Slide 37: Prime Coverage of Metro Systems in Greater China
PRIME COVERAGE OF METRO SYSTEMS IN GREATER CHINA Daily # City JCDecaux ridership 1 Beijing 8.8m 2 Shanghai 6.8m 3 Guangzhou 5.5m 4 Hong Kong 4.4m 5 Shenzhen 2.5m 6 Nanjing 1.2m 7 Chongqing 0.8m 8 Hangzhou 0.3m 9 Tianjin 0.3m 10 Chengdu 0.3m Source: Metro system websites Shanghai metro, China 37
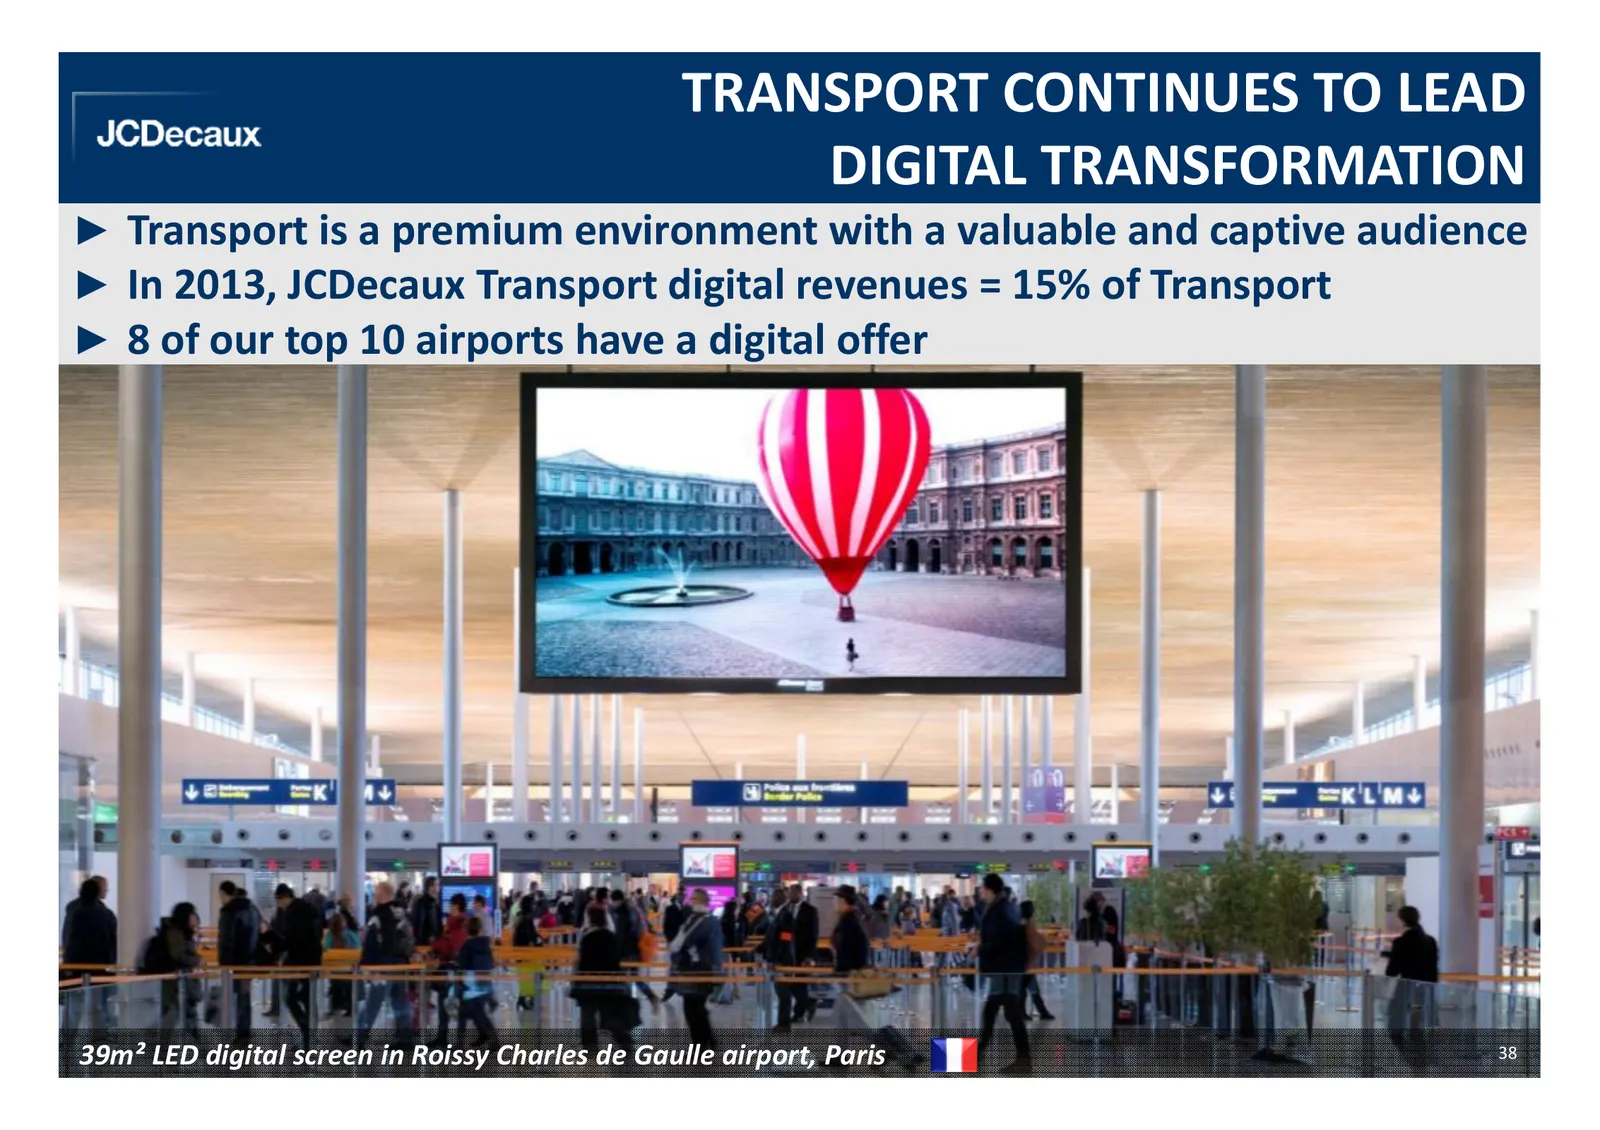
Slide 38: Transport Continues to Lead Digital Transformation
TRANSPORT CONTINUES TO LEAD DIGITAL TRANSFORMATION ► Transport is a premium environment with a valuable and captive audience ► In 2013, JCDecaux Transport digital revenues = 15% of Transport ► 8 of our top 10 airports have a digital offer 39m² LED digital screen in Roissy Charles de Gaulle airport,
Slide 39: Streets Ahead
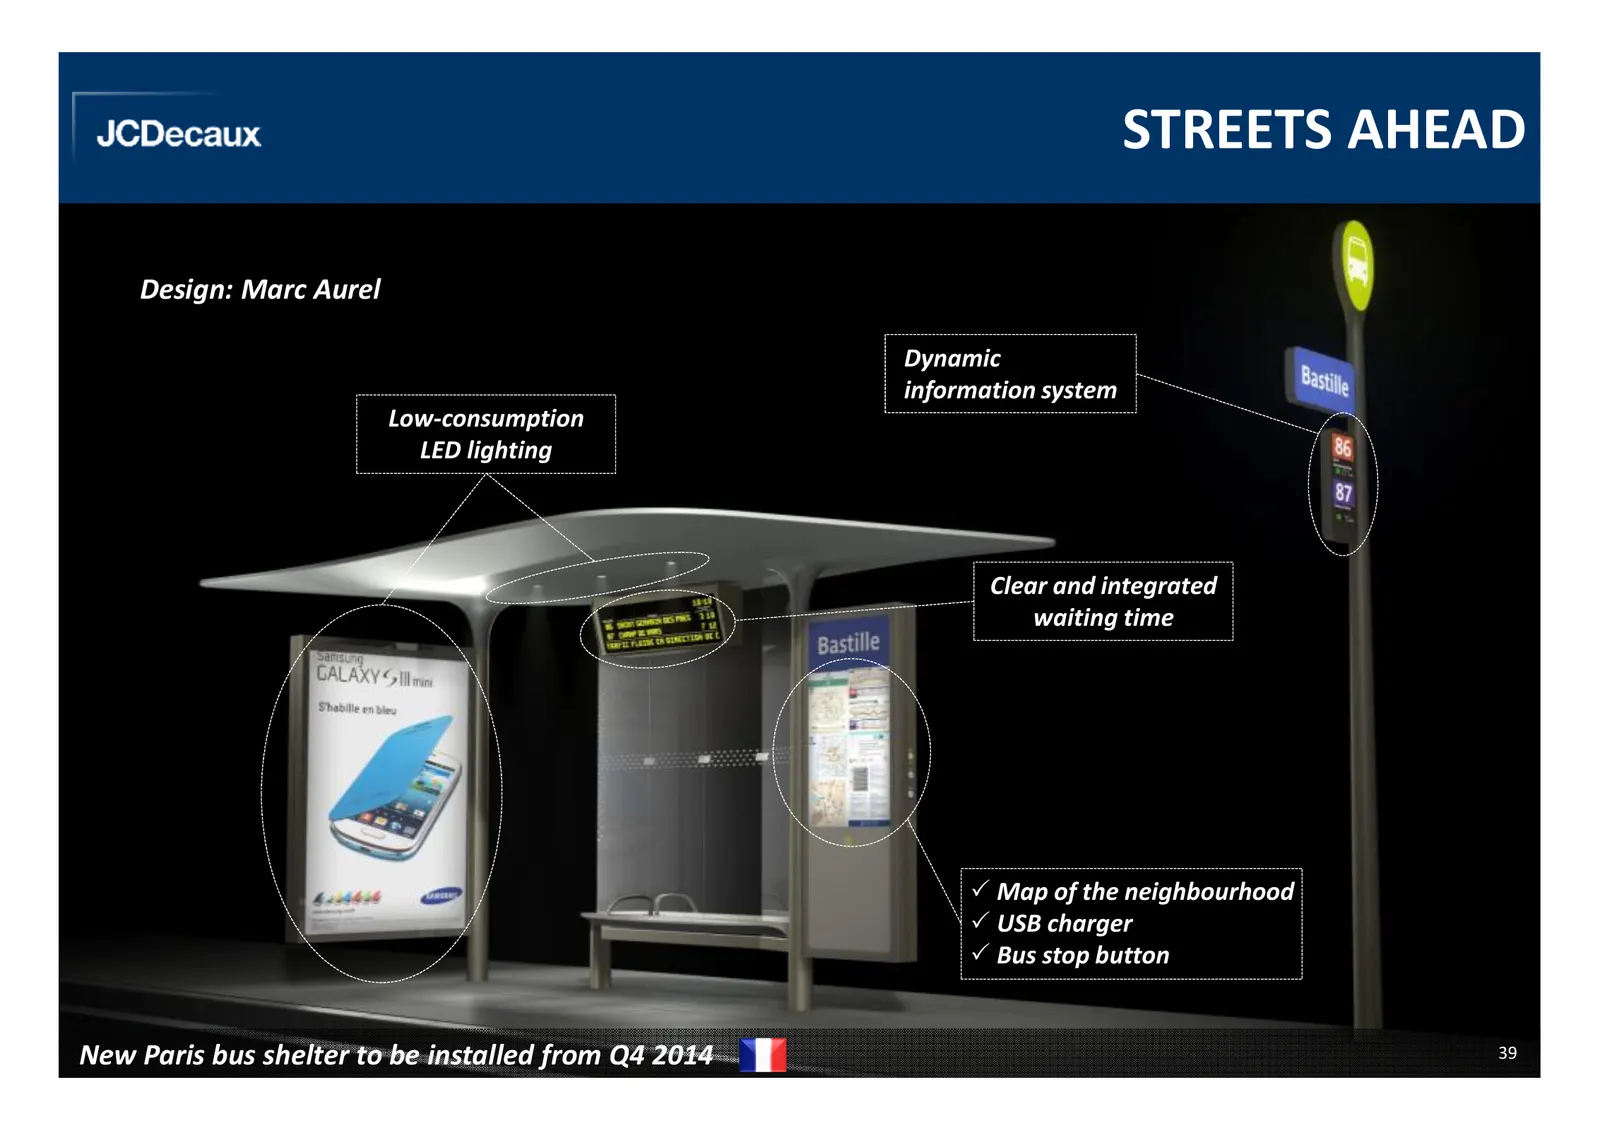
STREETS AHEAD Design: Marc Aurel Dynamic information system Low-consumption LED lighting Clear and integrated waiting time Map of the neighbourhood USB charger Bus stop button New Paris bus shelter to be installed from Q4 2014 39

Slide 40: US: Digital Billboards on Public Properties?
US: DIGITAL BILLBOARDS ON PUBLIC PROPERTIES ? ► Court of Appeals declared permits for almost 100 digital billboards on private property in Los Angeles illegal ► LA officials are now considering their options, including digital billboards on public property like in Chicago Digital billboard gone dark
Slide 41: JCDecaux Has the Strongest Balance Sheet in the Industry
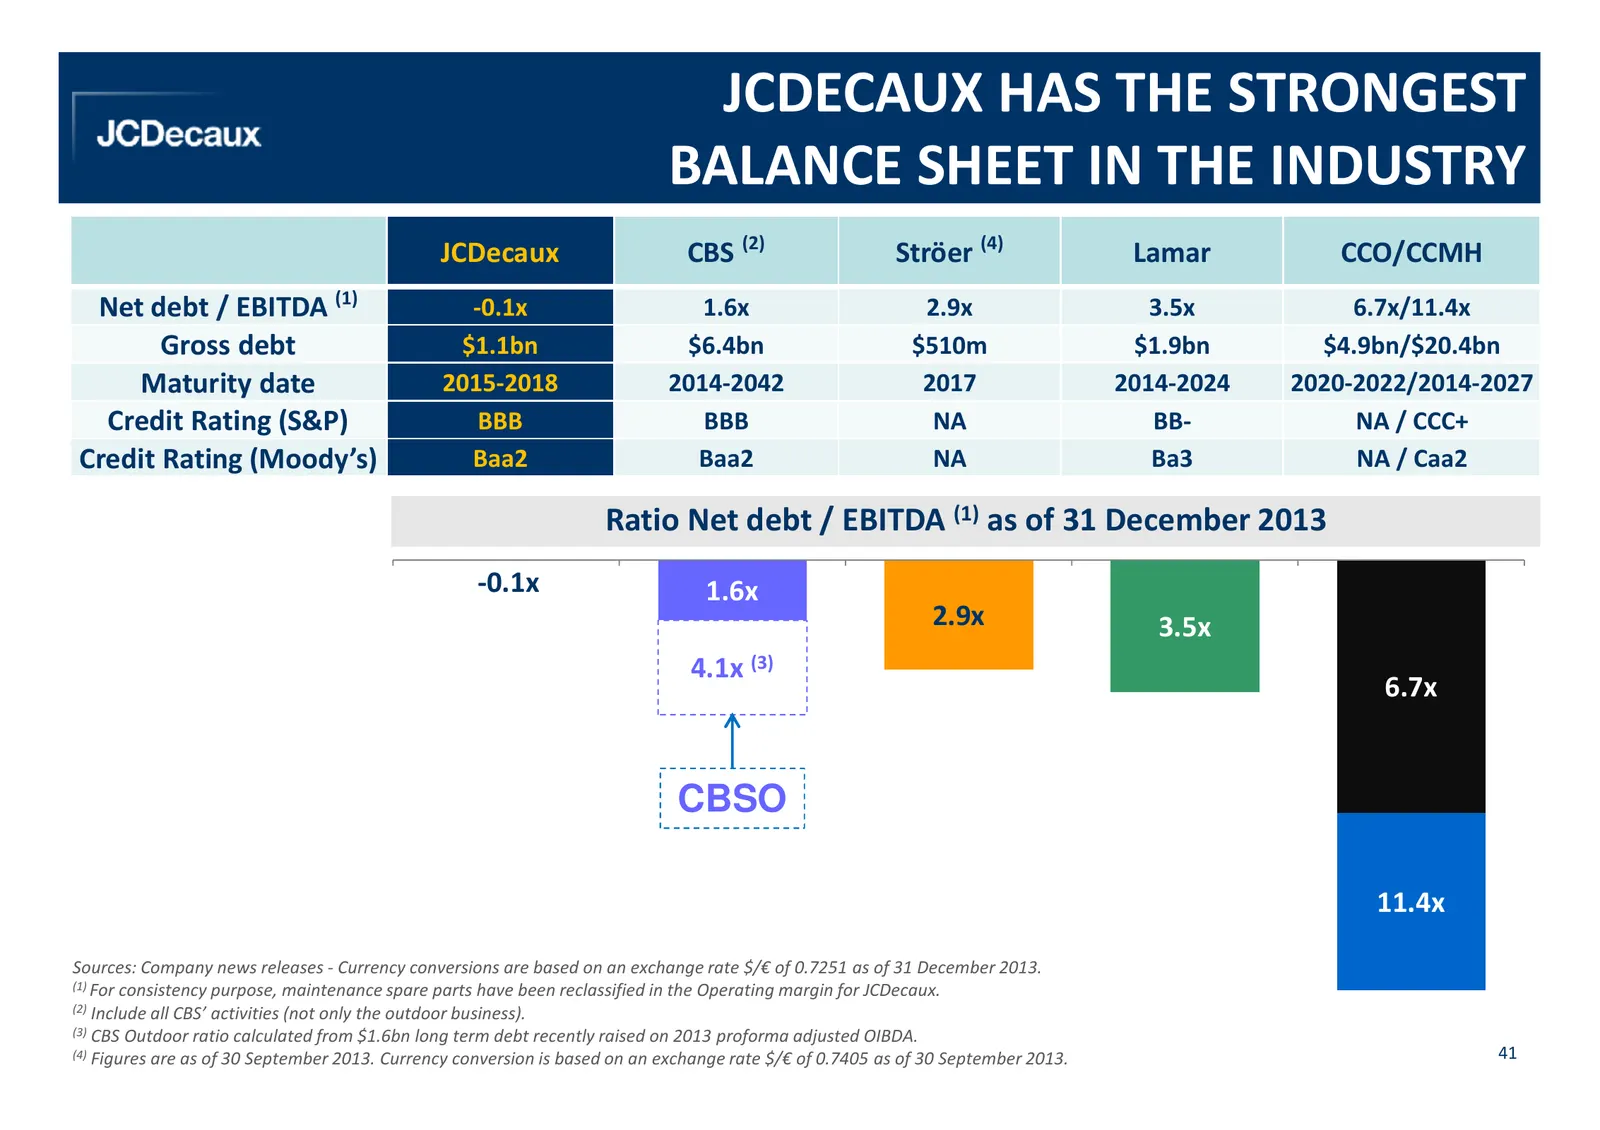
JCDECAUX HAS THE STRONGEST BALANCE SHEET IN THE INDUSTRY JCDecaux CBS (2) Ströer (4) Lamar CCO/CCMH Net debt / EBITDA (1) -0.1x 1.6x 2.9x 3.5x 6.7x/11.4x Gross debt $1.1bn $6.4bn $510m $1.9bn $4.9bn/$20.4bn Maturity date 2015-2018 2014-2042 2017 2014-2024 2020-2022/2014-2027 Credit Rating (S&P) BBB
Slide 42: Main Tenders Expected 2014/2015
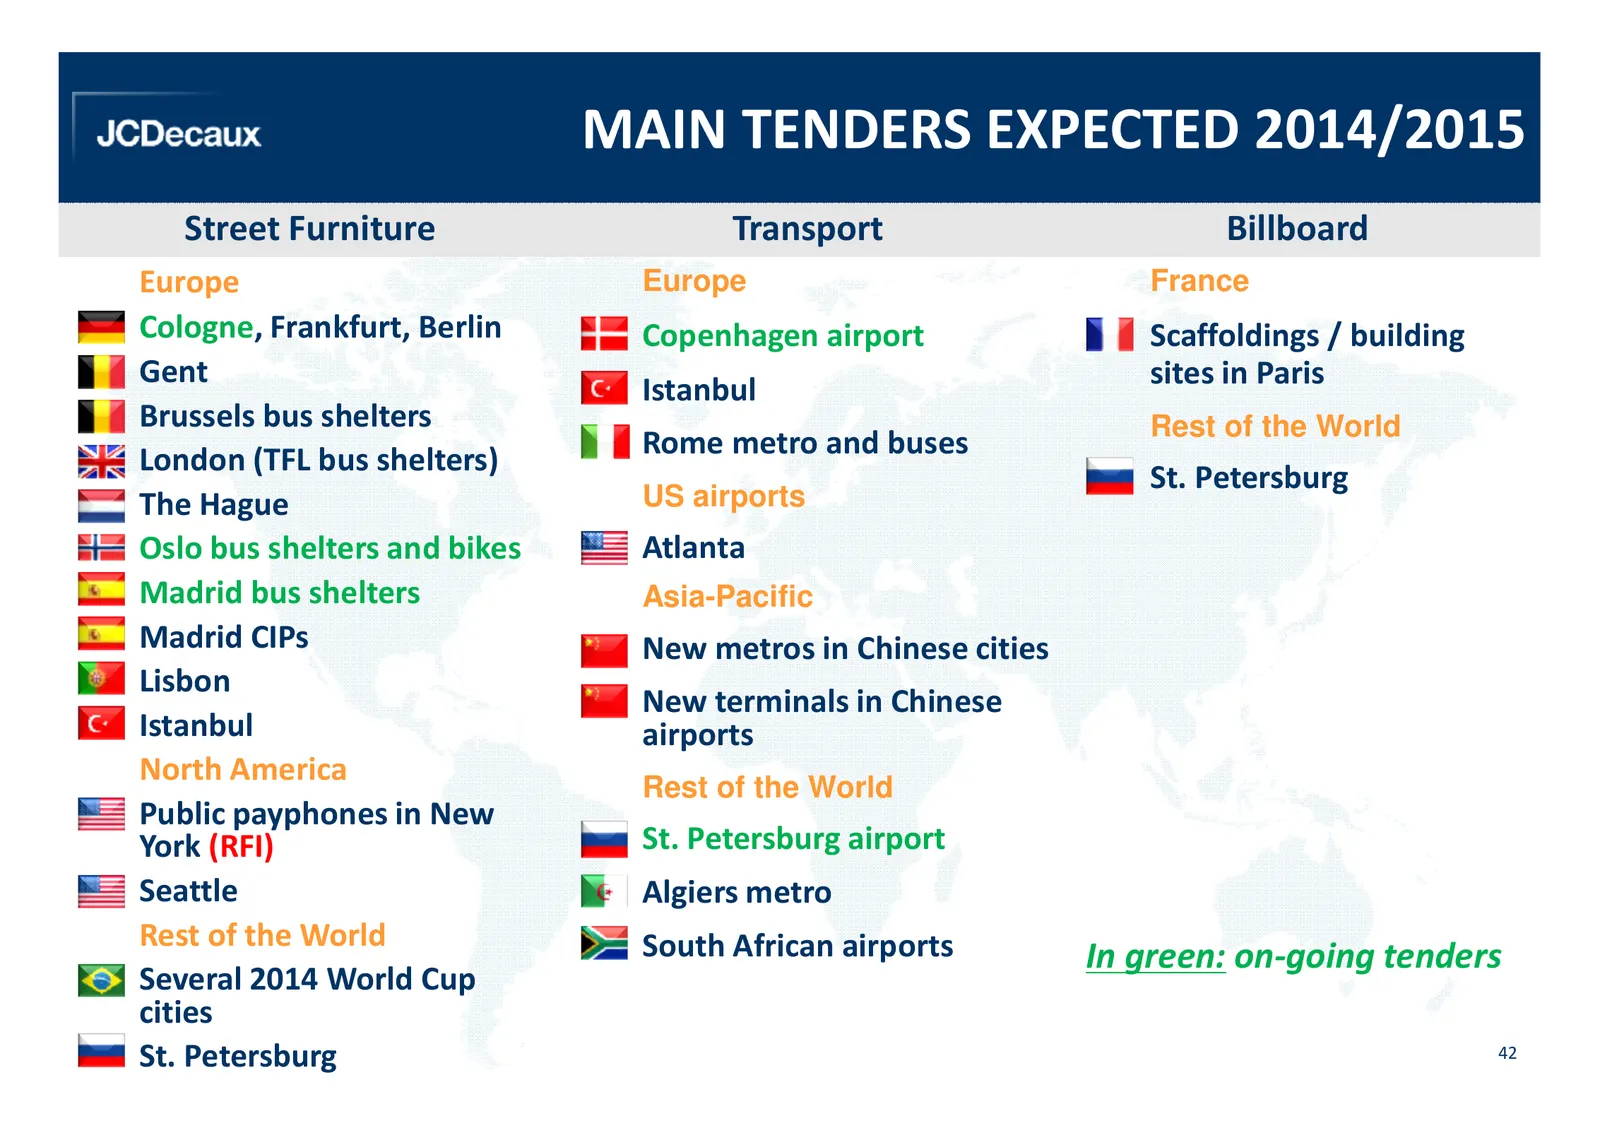
MAIN TENDERS EXPECTED 2014/2015 Street Furniture Transport Billboard Europe Europe France Cologne, Frankfurt, Berlin Copenhagen airport Scaffoldings / building Gent sites in Paris Istanbul Brussels bus shelters Rest of the World London (TFL bus shelters) Rome metro and buses St. Petersburg The Hague
Slide 43: Consolidation Resumes
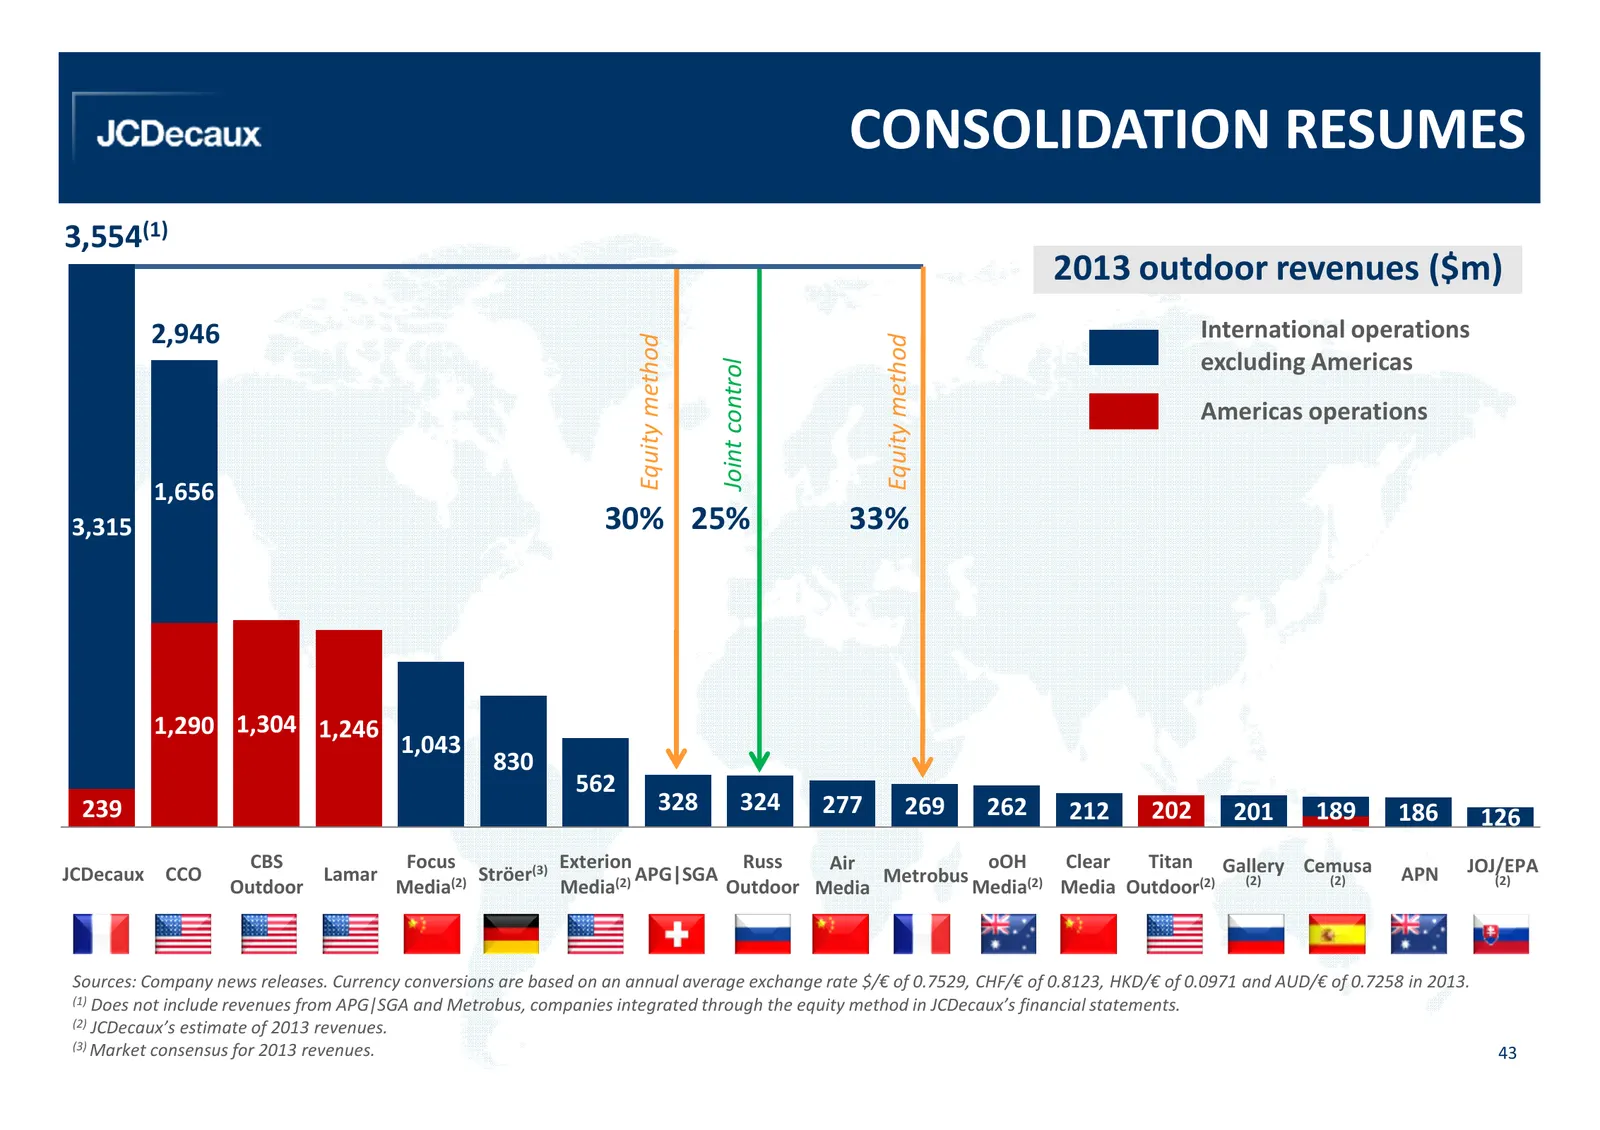
CONSOLIDATION RESUMES 3,554(1) 2013 outdoor revenues ($m) 2,946 International operations Equity method Equity method excluding Americas Joint control Americas operations 1,656 3,315 30% 25% 33% 1,290 1,304 1,246 1,043 830 562 239 328 324 277 269 262 212 202 201 189 186 126 CBS Focus Exterion Russ Ai
Slide 44: Conclusion
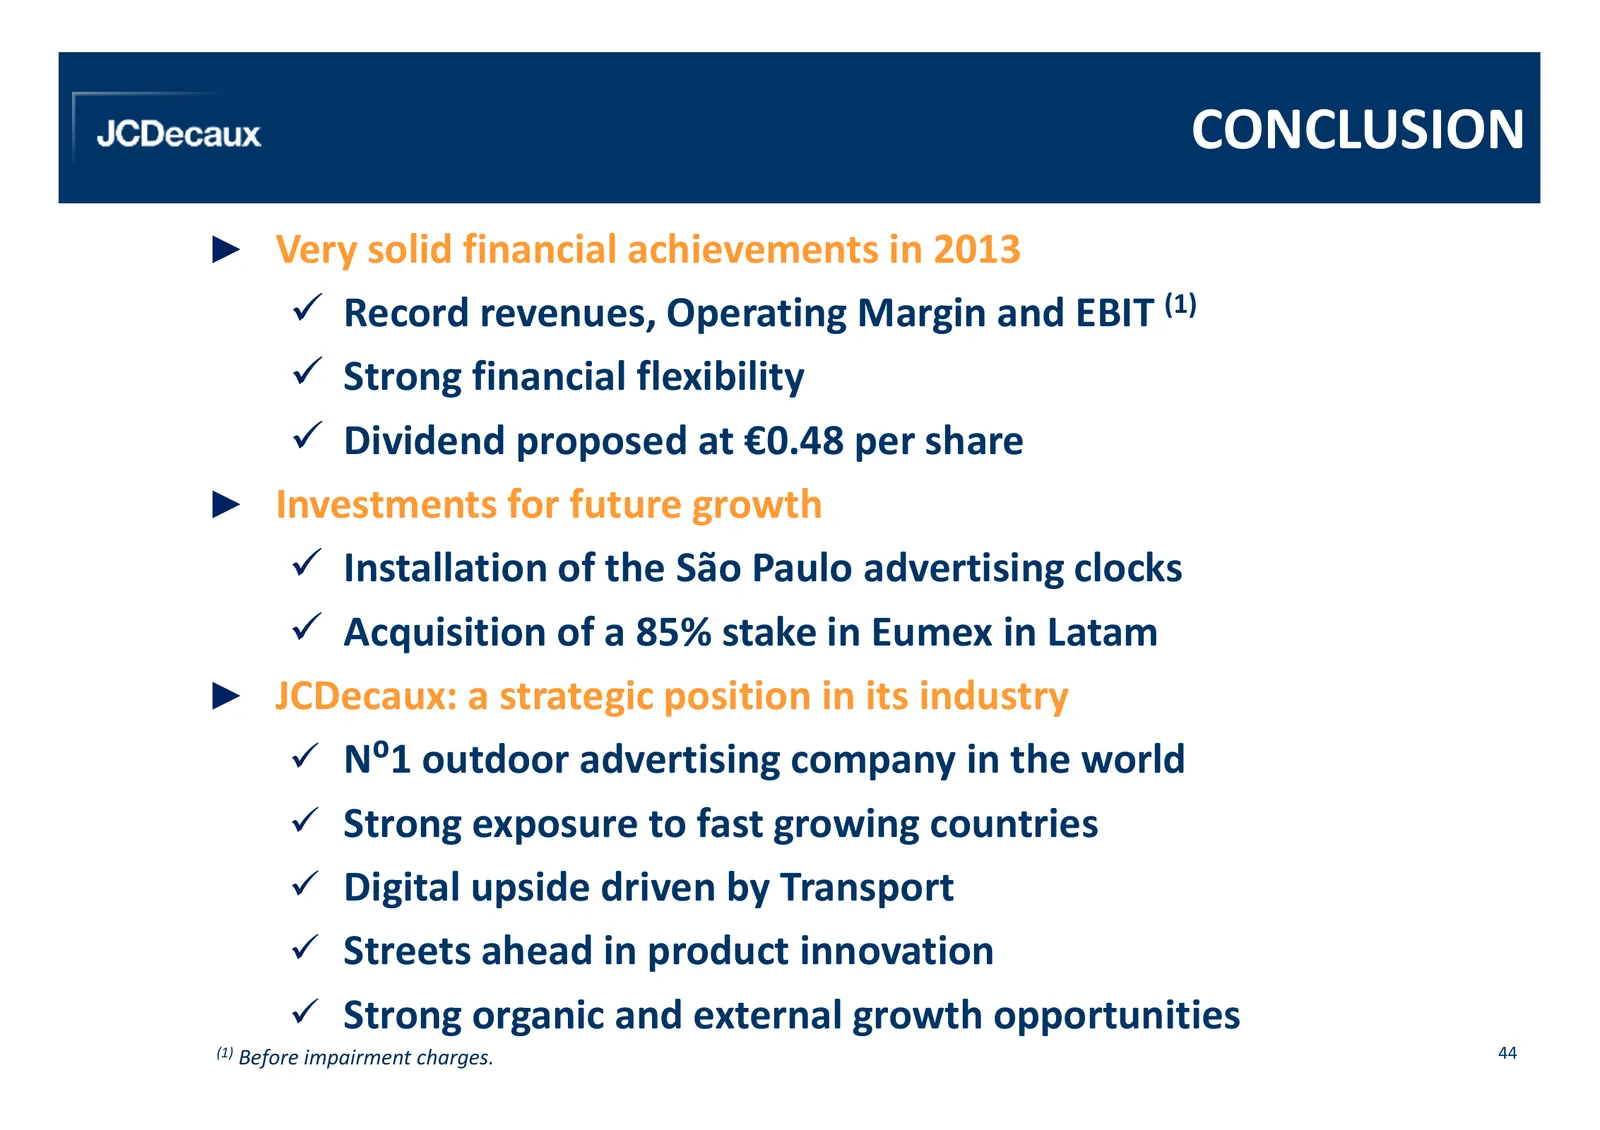
CONCLUSION ► Very solid financial achievements in 2013 Record revenues, Operating Margin and EBIT (1) Strong financial flexibility Dividend proposed at €0.48 per share ► Investments for future growth Installation of the São Paulo advertising clocks Acquisition of a 85% stake in Eumex in Latam ► JCDe
Slide 45: Q1 2014 Outlook
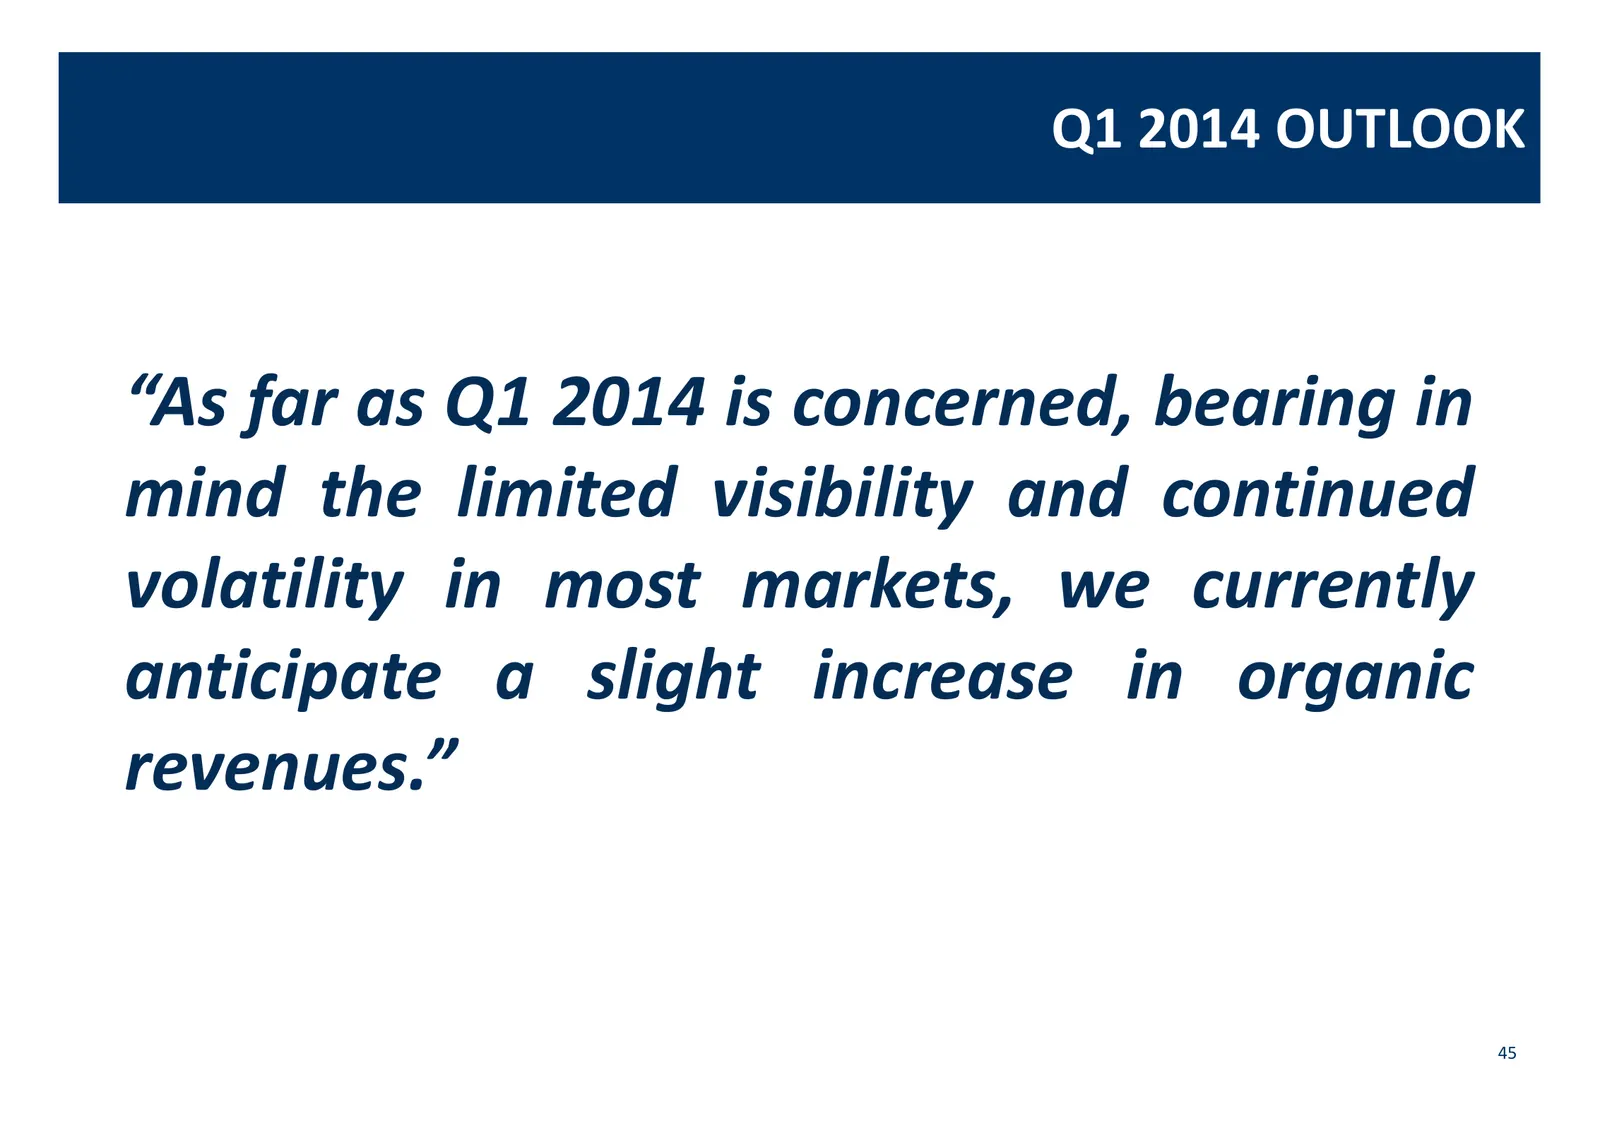
Q1 2014 OUTLOOK “As far as Q1 2014 is concerned, bearing in mind the limited visibility and continued volatility in most markets, we currently anticipate a slight increase in organic revenues.” 45
Slide 46: JCDecaux Celebrates Its 50th Anniversary
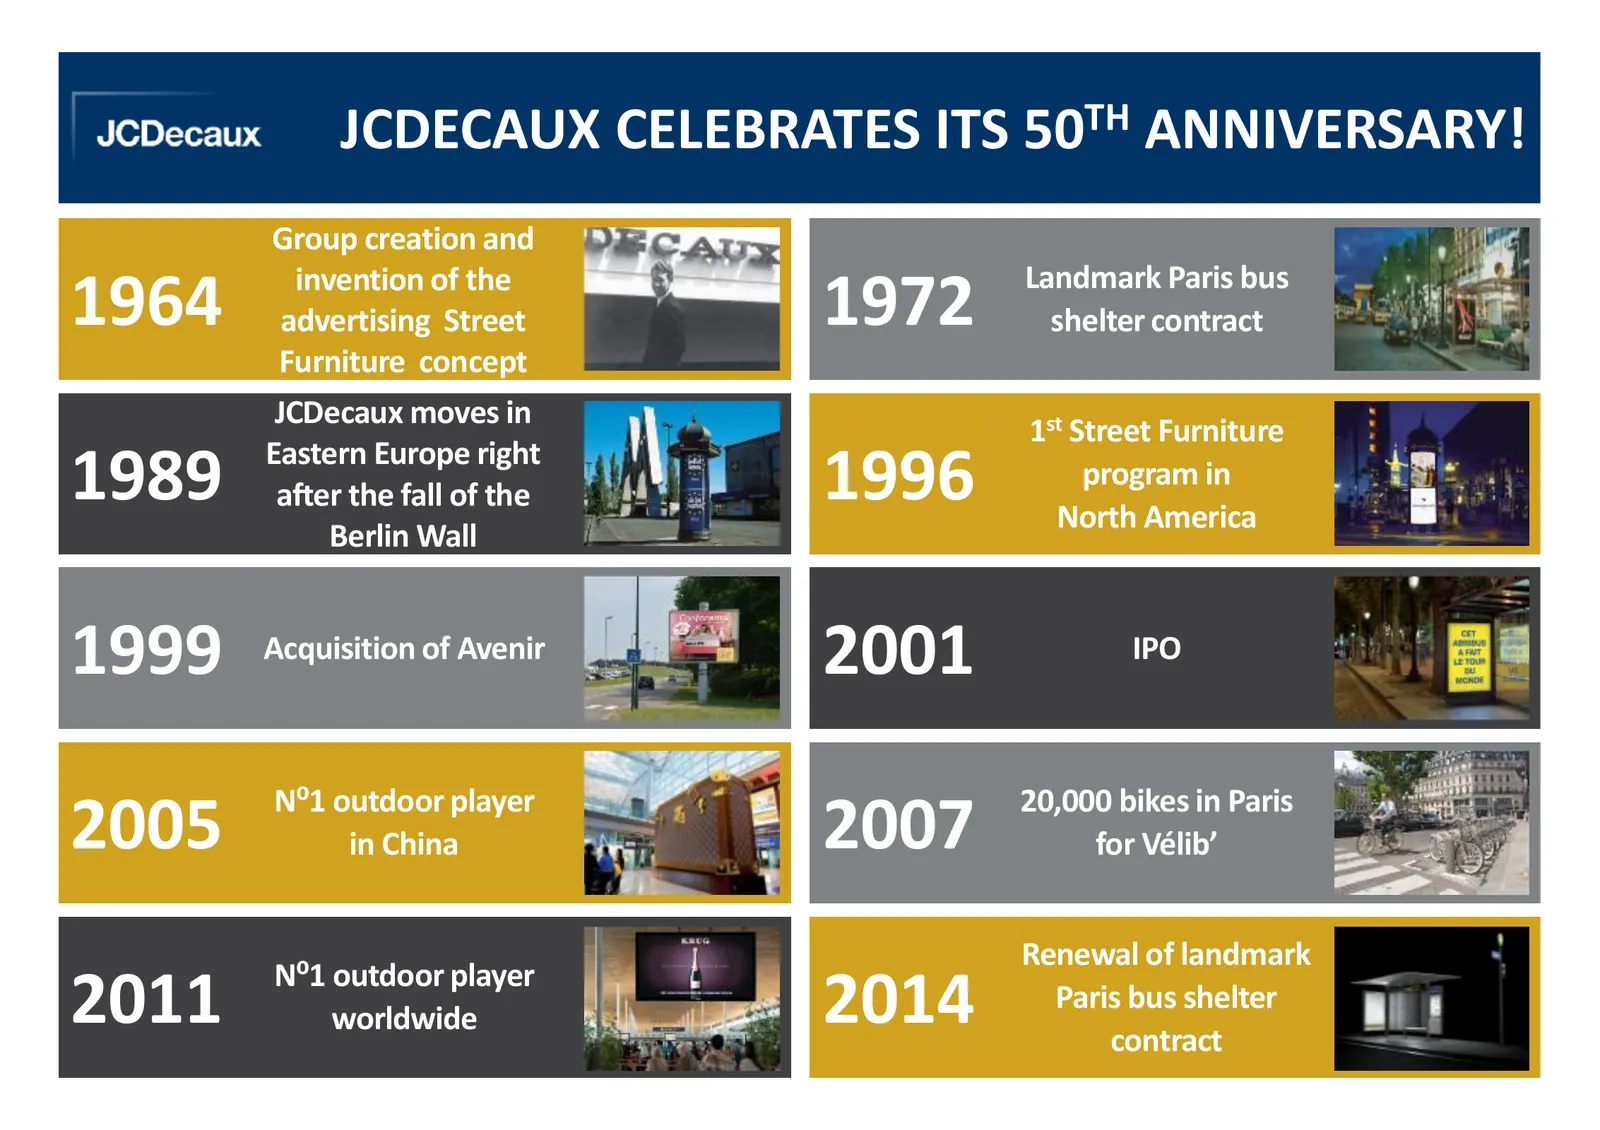
JCDECAUX CELEBRATES ITS 50TH ANNIVERSARY! Group creation and invention of the Landmark Paris bus 1964 advertising Street 1972 shelter contract Furniture concept JCDecaux moves in 1st Street Furniture Eastern Europe right 1989 after the fall of the 1996 program in North America Berlin Wall 1999 Acqui
Slide 47: Financial Definitions
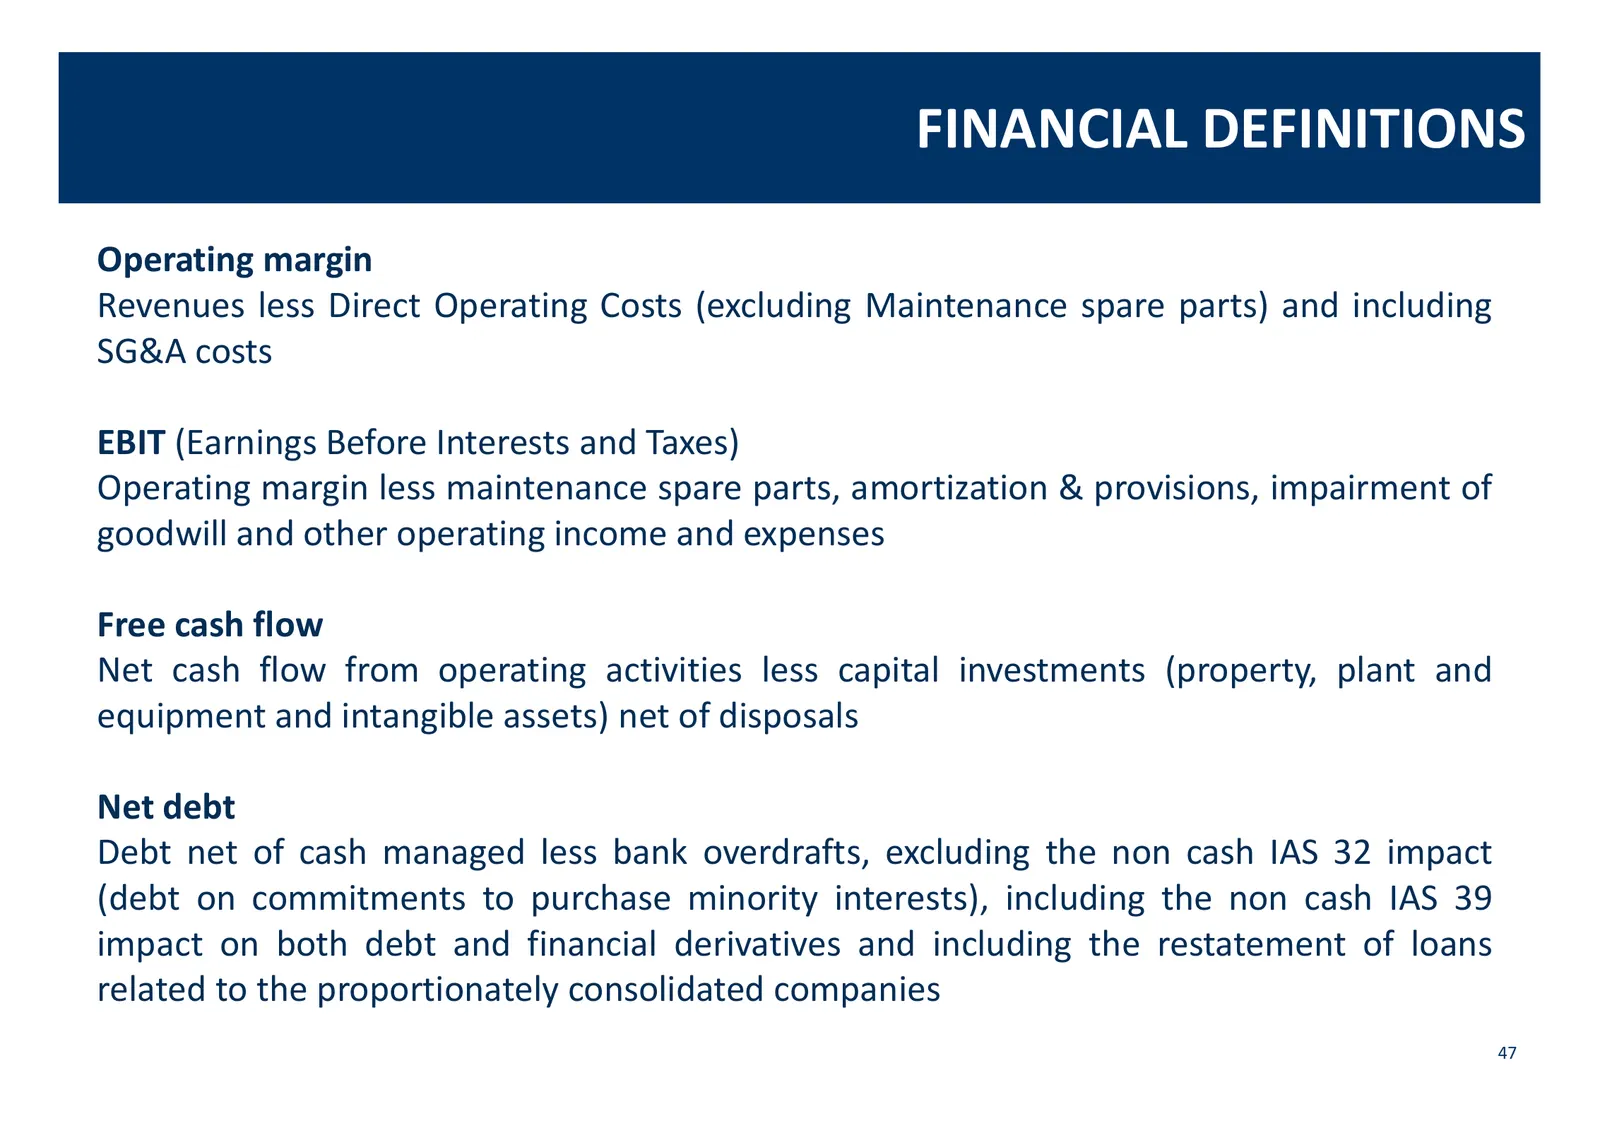
FINANCIAL DEFINITIONS Operating margin Revenues less Direct Operating Costs (excluding Maintenance spare parts) and including SG&A costs EBIT (Earnings Before Interests and Taxes) Operating margin less maintenance spare parts, amortization & provisions, impairment of goodwill and other operating inc
Slide 48: Forward Looking Statements
FORWARD LOOKING STATEMENTS This presentation may contain some forward-looking statements. These statements are not undertakings as to the future performance of the Company. Although the Company considers that such statements are based on reasonable expectations and assumptions on the date of publica

Slide 49: YEARS OF PA
YEARS OF PA AND INNOVA JCDecaux
Source: Internet Archive copy of jcdecaux.com
More decks from JCDecaux SE
 Q2 2026 Earnings Presentation45 slides · Jul 30, 2026
 Shareholder Meeting (May 2026)97 slides · May 13, 2026
 FY2025 Earnings Presentation48 slides · Mar 12, 2026
 H1 2025 Earnings Presentation43 slides · Jul 31, 2025
 FY2024 Earnings Presentation47 slides · Mar 6, 2025
 H1 2024 Earnings Presentation48 slides · Jul 25, 2024