Compass Bancshares — Merger or Acquisition (November 2005)
36 slides from Compass Bancshares's merger presentation, Nov 15, 2005
Slide 1: Filed by Compass Bancshares, Inc. Pursuant to Rule 425
November 17, 2005 - - Filed by Compass Bancshares, Inc. - - Pursuant to Rule 425 under the Securities Act of 1933, as amended - - Subject Company: TexasBanc Holding Co. - - Commission File No. 001-31272 - - Dated: November 15, 2005
Slide 2: Forward-Looking Statement Disclosure
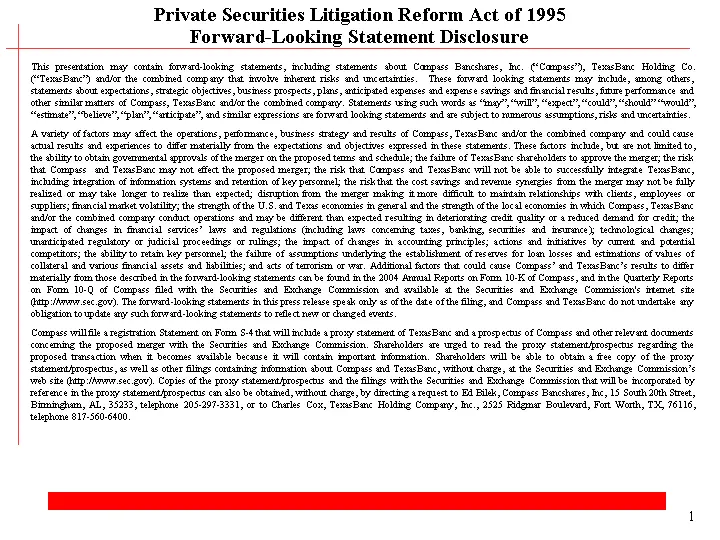
Private Securities Litigation Reform Act of 1995 Forward-Looking Statement Disclosure 1 This presentation may contain forward-looking statements, including statements about Compass Bancshares, Inc. ("Compass"), TexasBanc Holding Co. ("TexasBanc") and/or the combined company that involve inherent ris
Slide 3: Company Profile
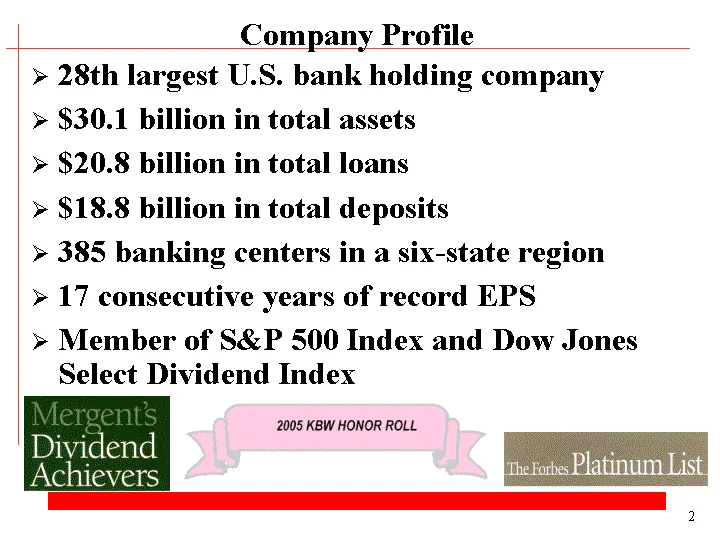
28th largest U.S. bank holding company $30.1 billion in total assets $20.8 billion in total loans $18.8 billion in total deposits 385 banking centers in a six-state region 17 consecutive years of record EPS Member of S&P 500 Index and Dow Jones Select Dividend Index Company Profile 2
Slide 4: A Southwestern Powerhouse
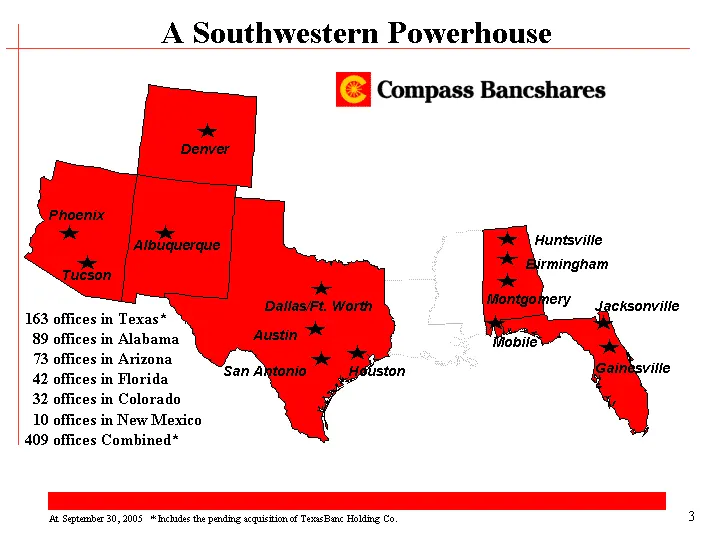
Denver Albuquerque Tucson Phoenix San Antonio Austin Dallas/Ft. Worth Houston Mobile Montgomery Birmingham Gainesville Huntsville Jacksonville A Southwestern Powerhouse 163 offices in Texas* 89 offices in Alabama 73 offices in Arizona 42 offices in Florida 32 offices in Colorado 10 offices in New Me
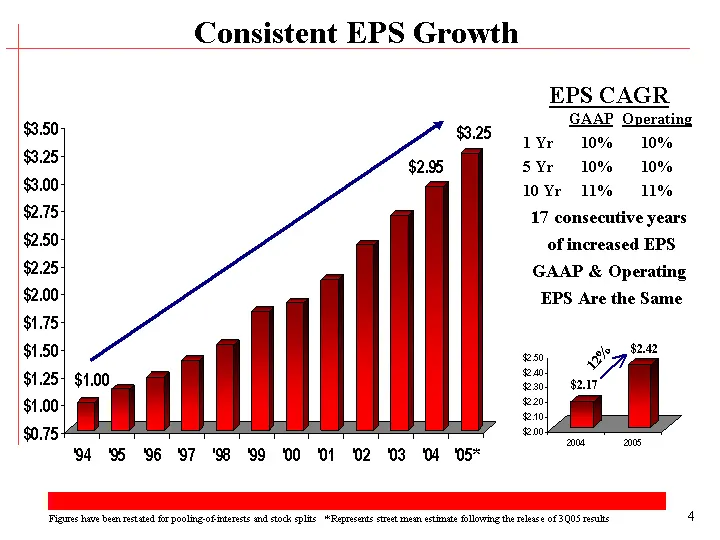
Slide 5: Consistent EPS Growth
EPS CAGR GAAP Operating 1 Yr 10% 10% 5 Yr 10% 10% 10 Yr 11% 11% 17 consecutive years of increased EPS GAAP & Operating EPS Are the Same Figures have been restated for pooling-of-interests and stock splits * Represents street mean estimate following the release of 3Q05 results Consistent EPS Growth 1
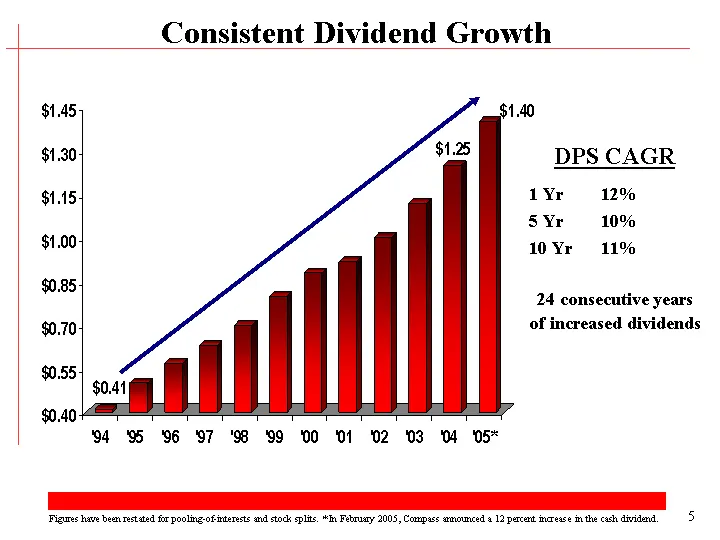
Slide 6: Consistent Dividend Growth
DPS CAGR 1 Yr 12% 5 Yr 10% 10 Yr 11% 24 consecutive years of increased dividends Figures have been restated for pooling-of-interests and stock splits. * In February 2005, Compass announced a 12 percent increase in the cash dividend. Consistent Dividend Growth 1989 1990 '91 '92 '93 '94 '95 '96 '97 '9
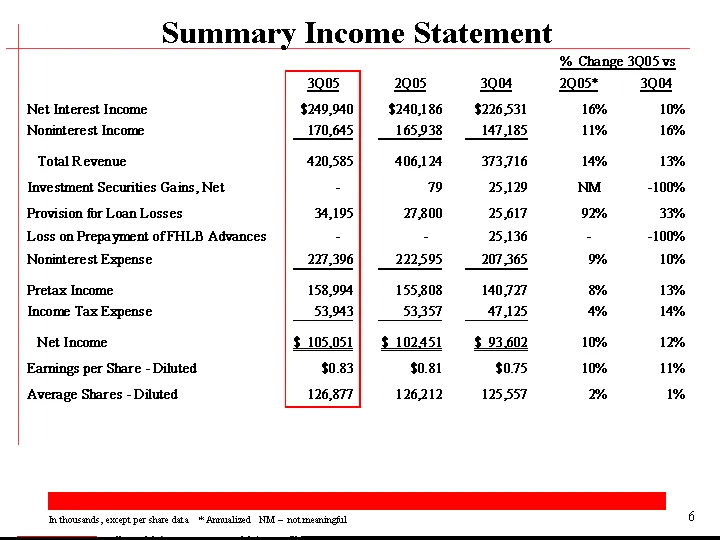
Slide 7: Summary Income Statement
Summary Income Statement In thousands, except per share data * Annualized NM - not meaningful 6
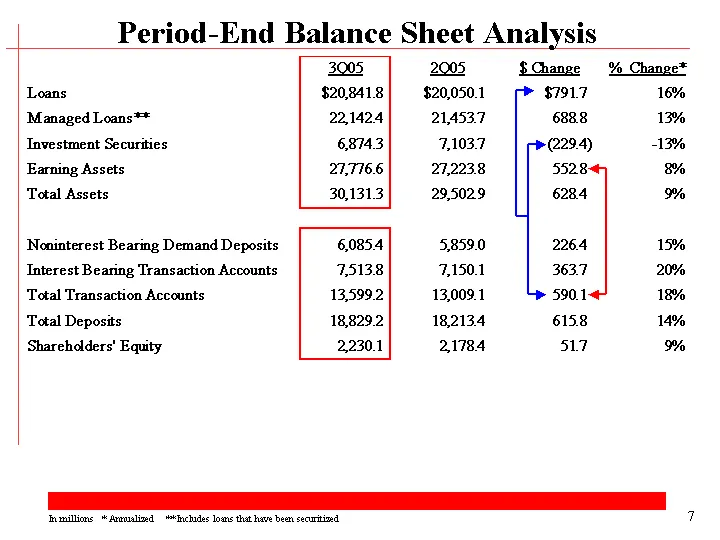
Slide 8: Period-End Balance Sheet Analysis
Period-End Balance Sheet Analysis In millions * Annualized ** Includes loans that have been securitized 7
Slide 9: Focused on Revenue Growth: Ingrained Sales Culture
Focused on Revenue Growth Ingrained Sales Culture 8
Slide 10: Consistent Revenue Growth
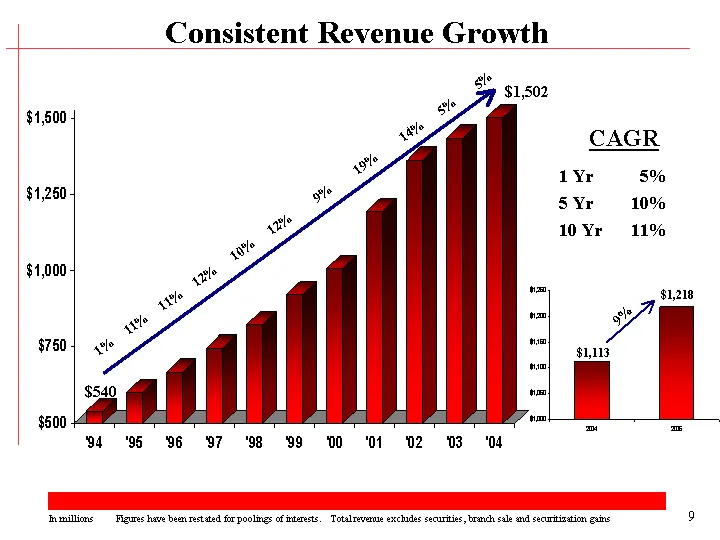
Consistent Revenue Growth '88 89 '90 '91 '92 '93 '94 '95 '96 '97 '98 '99 '00 '01 3Q01 3Q02 '02 '03 '04 Net interest income 136749 134701 136919 138044 142223 147548 151572 Noninterest income 46150 44845 49872 51882 51782 54012 56305 Total Revenue 242833 271643 321360 403653 486705 518408 524227 5839
Slide 11: Net Interest Income & Margin (TE)
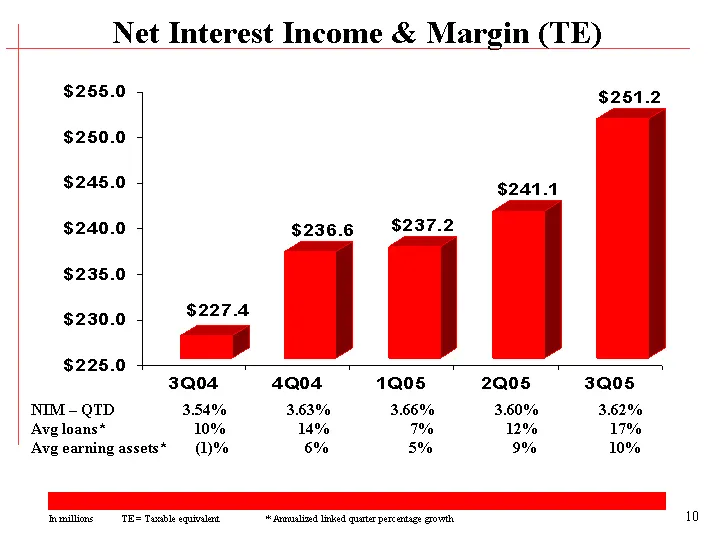
Net Interest Income & Margin (TE) 3Q99 4Q99 1Q00 2Q00 3Q00 4Q00 1Q01 2Q01 3Q01 4Q01 1Q02 2Q02 3Q02 4Q02 1Q03 2Q03 3Q03 4Q03 1Q04 2Q04 3Q04 4Q04 1Q05 2Q05 3Q05 Net Interest Income 167539 169513 173782 182888 182386 184427 189246 202400 210378 228883 234.937 229.779 231.799 232.743 228.22 224.269 231.
Slide 12: Interest Rate Sensitivity
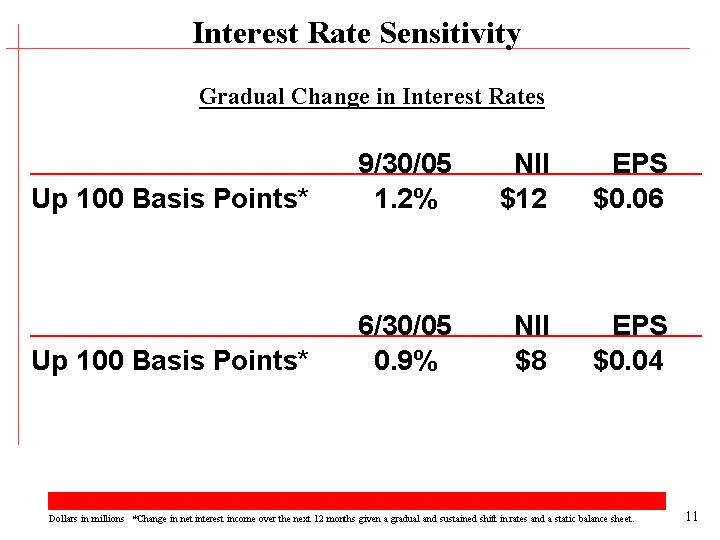
9/30/05 NII EPS Up 100 Basis Points* 1.2% $12 $0.06 Interest Rate Sensitivity Dollars in millions *Change in net interest income over the next 12 months given a gradual and sustained shift in rates and a static balance sheet. Gradual Change in Interest Rates 11 6/30/05 NII EPS Up 100 Basis Points* 0
Slide 13: Accelerating Fee Income Growth
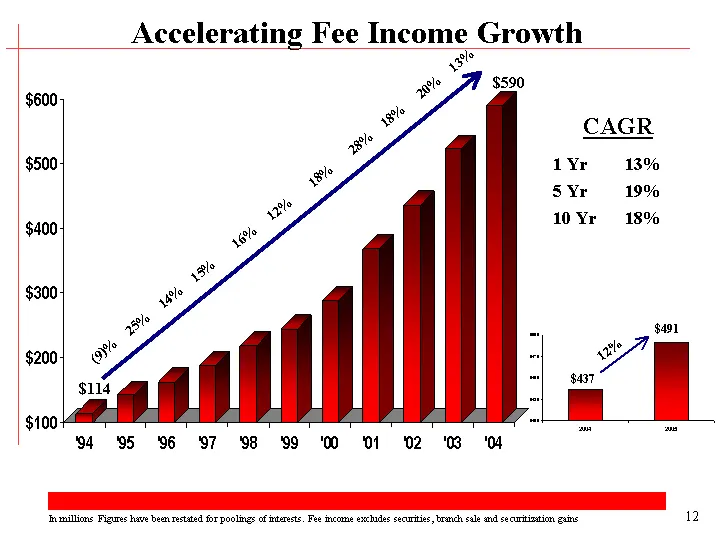
Accelerating Fee Income Growth In millions Figures have been restated for poolings of interests. Fee income excludes securities, branch sale and securitization gains CAGR 1 Yr 13% 5 Yr 19% 10 Yr 18% '88 89 '90 '91 '92 '93 '94 '95 '96 '97 '98 '99 '00 '01 3Q01 3Q02 '02 '03 '04 Net interest income 1367
Slide 14: Noninterest Income
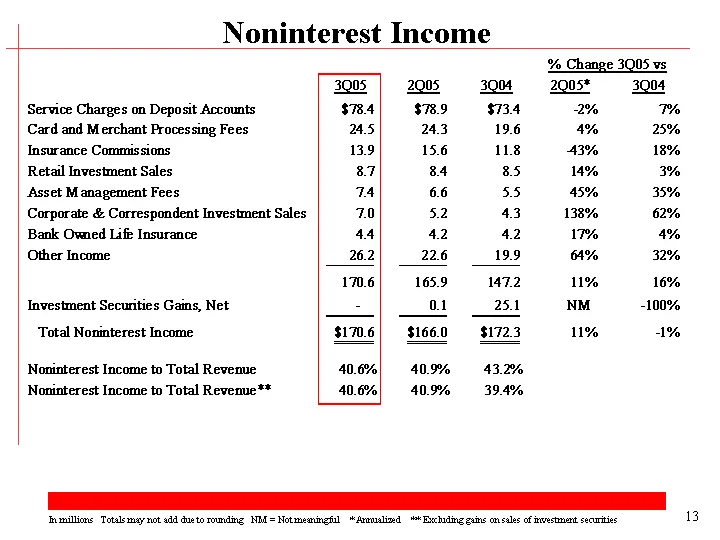
Noninterest Income In millions Totals may not add due to rounding NM = Not meaningful * Annualized ** Excluding gains on sales of investment securities 13
Slide 15: Improved Revenue Mix
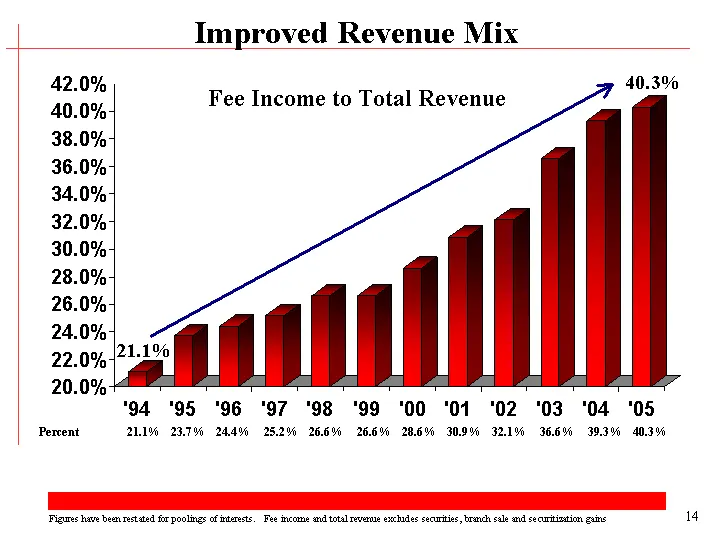
Improved Revenue Mix Fee Income to Total Revenue '88 89 '90 '91 '92 '93 '94 '95 '96 '97 '98 '99 '00 '01 3Q01 3Q02 '02 '03 '04 '05 Net interest income 136749 134701 136919 138044 142223 147548 151572 Noninterest income 46150 44845 49872 51882 51782 54012 56305 Total Revenue 242833 271643 321360 40365
Slide 16: Noninterest Expense
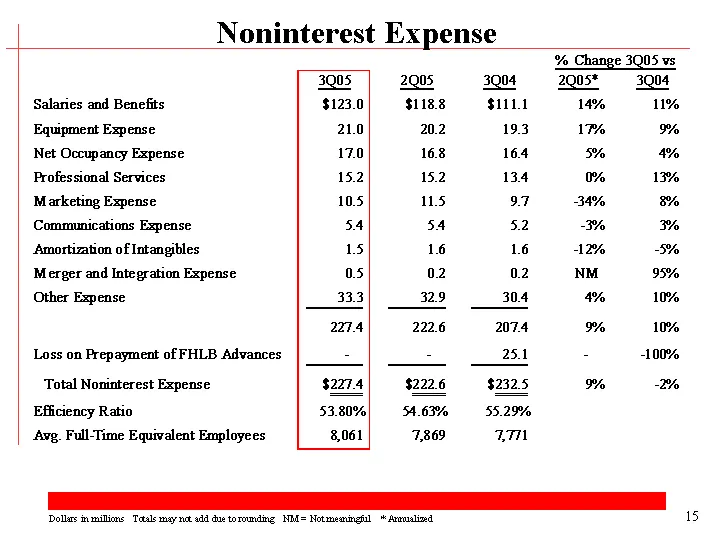
Noninterest Expense Dollars in millions Totals may not add due to rounding NM = Not meaningful * Annualized 15
Slide 17: Focused on Revenue Growth: Leveraging Investments in Franchise
Focused on Revenue Growth Leveraging Investments in Franchise Ingrained Sales Culture 16
Slide 18: Enhanced Texas Distribution Network
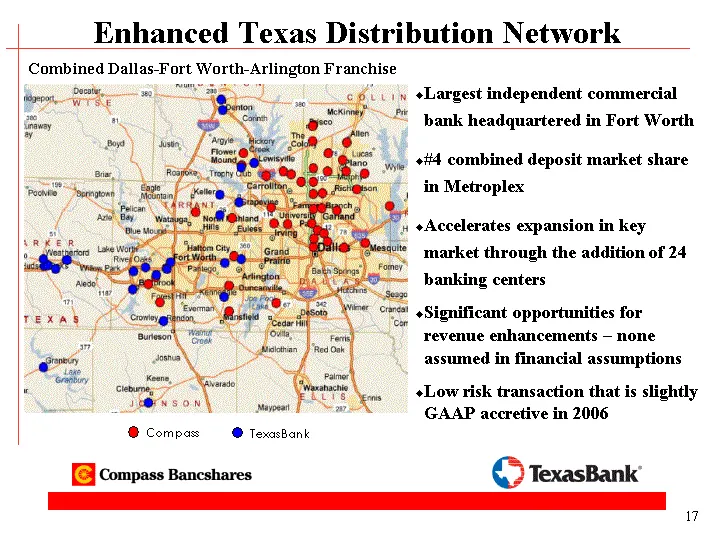
Enhanced Texas Distribution Network 17 Combined Dallas-Fort Worth-Arlington Franchise Largest independent commercial bank headquartered in Fort Worth #4 combined deposit market share in Metroplex Accelerates expansion in key market through the addition of 24 banking centers Significant opportunities
Slide 19: Top Demographic Profile Among Peers
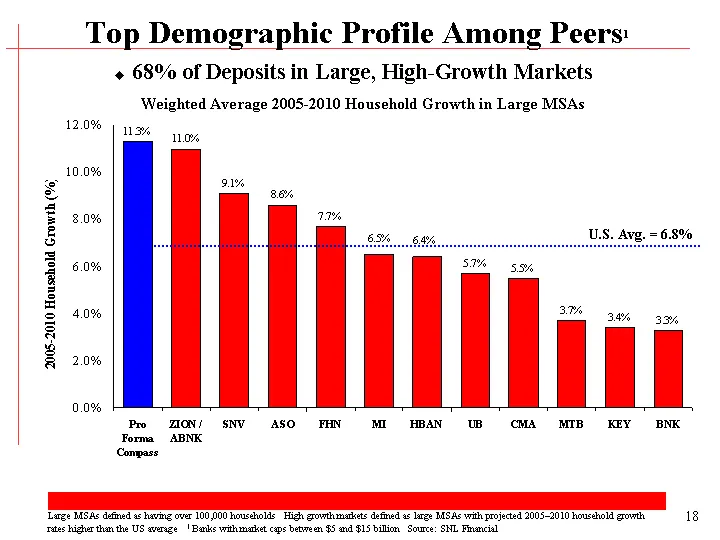
Top Demographic Profile Among Peers1 Large MSAs defined as having over 100,000 households High growth markets defined as large MSAs with projected 2005-2010 household growth rates higher than the US average 1 Banks with market caps between $5 and $15 billion Source: SNL Financial Pro Forma Compass Z
Slide 20: Compass: Primarily a Texas-Based Franchise
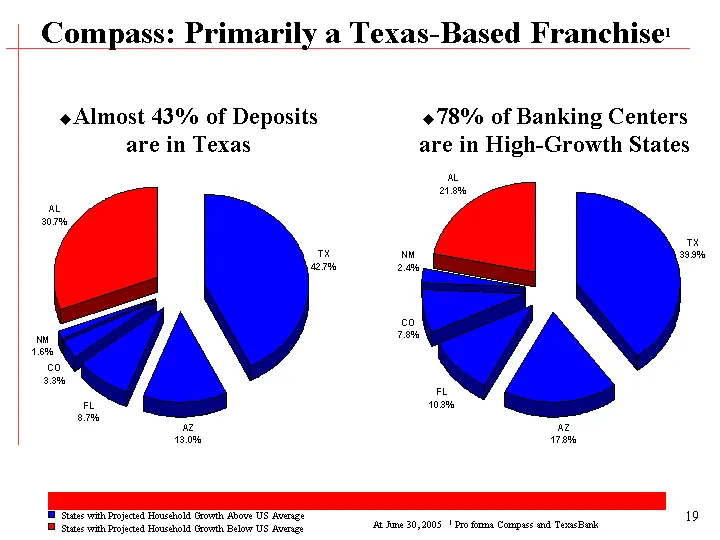
Compass: Primarily a Texas-Based Franchise1 Almost 43% of Deposits are in Texas TX AZ FL CO NM AL Deposits 0.427 0.13 0.087 0.033 0.016 0.307 TX AZ FL CO NM AL Deposits 0.399 0.178 0.103 0.078 0.024 0.218 78% of Banking Centers are in High-Growth States States with Projected Household Growth Above U
Slide 21: Highly Attractive Markets
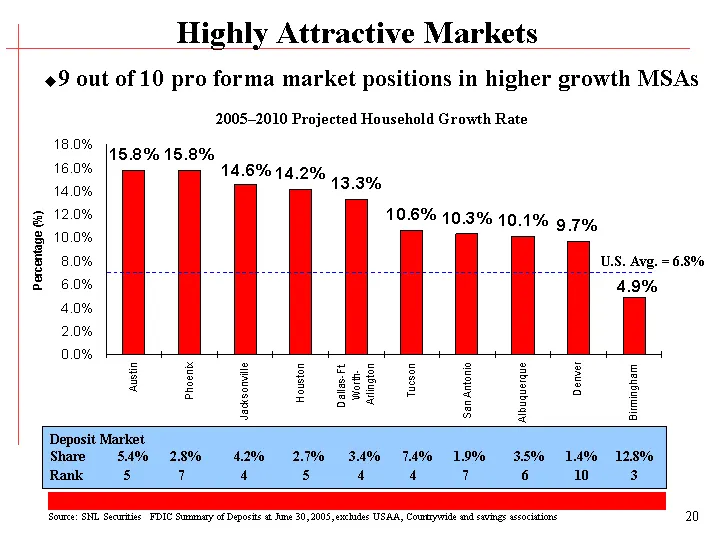
Highly Attractive Markets 2005-2010 Projected Household Growth Rate Source: SNL Securities FDIC Summary of Deposits at June 30, 2005, excludes USAA, Countrywide and savings associations 9 out of 10 pro forma market positions in higher growth MSAs U.S. Avg. = 6.8% Deposit Market Share 5.4% 2.8% 4.2%
Slide 22: New Personal & Small Business Checking Accounts
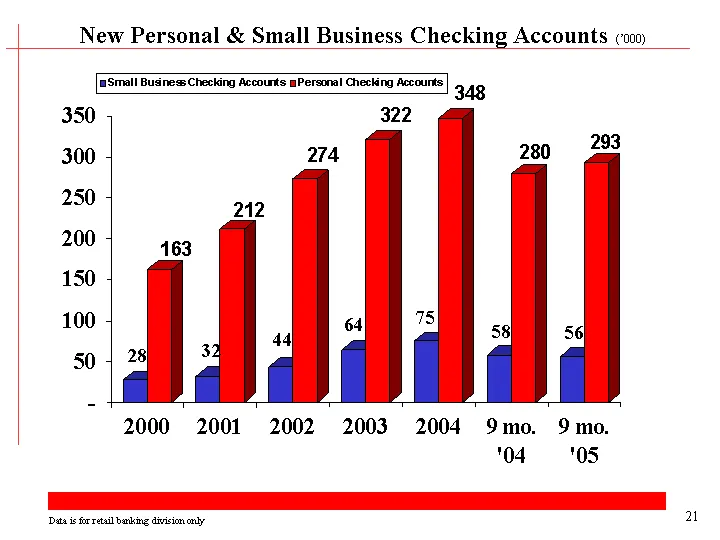
Data is for retail banking division only New Personal & Small Business Checking Accounts ('000) 21 1997 1998 1999 2000 2001 2002 2003 2003* 2004 9 mo. '04 9 mo. '05 Small Business Checking Accounts 2.934 27.857 32.458 43.607 64.435 75.315 58.413 56.021 Personal Checking Accounts -12532 28.344 26.661
Slide 23: Period-End Deposits
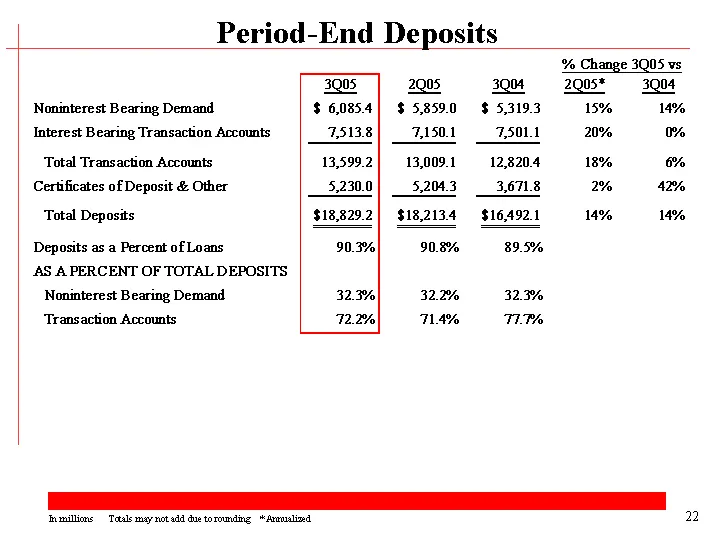
Period-End Deposits In millions Totals may not add due to rounding * Annualized 22
Slide 24: Strong Credit Culture: Low Risk Profile
Strong Credit Culture Low Risk Profile 23
Slide 25: Strong Credit Culture
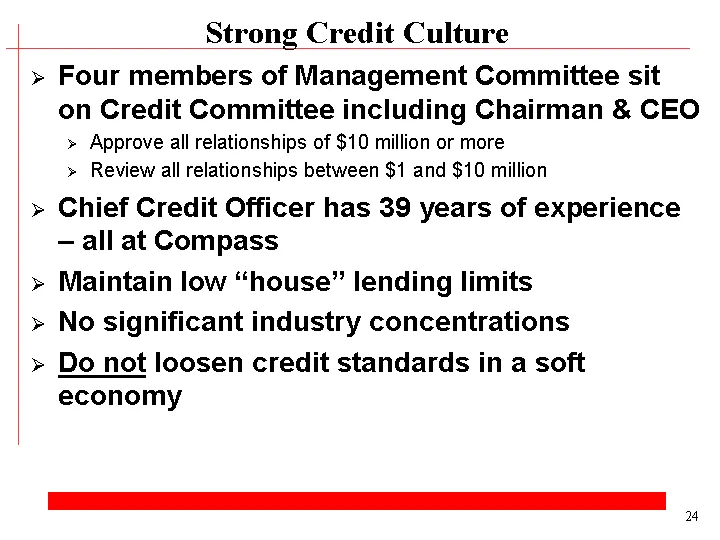
Strong Credit Culture 24 Four members of Management Committee sit on Credit Committee including Chairman & CEO Approve all relationships of $10 million or more Review all relationships between $1 and $10 million Chief Credit Officer has 39 years of experience - - all at Compass Maintain low "house"
Slide 26: Historical Perspective on Asset Quality
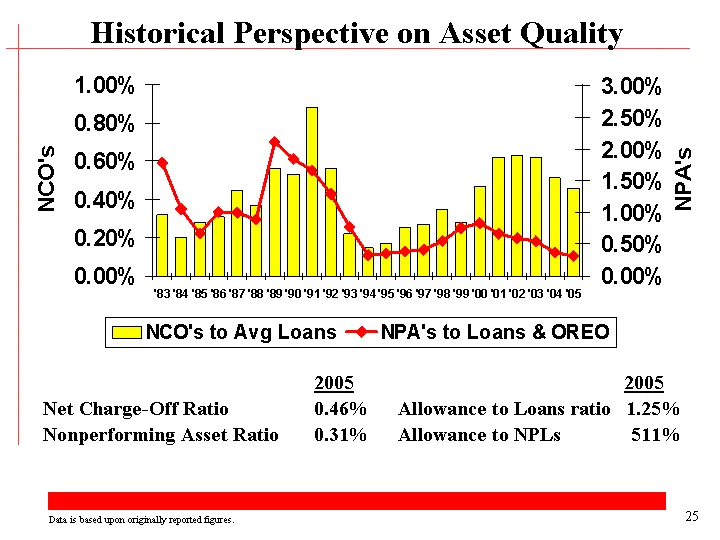
'80 '81 '82 '83 '84 '85 '86 '87 '88 '89 '90 '91 '92 '93 '94 '95 '96 '97 '98 '99 '00 '01 '02 '03 '04 '05 NCO's to Avg Loans 0.01 0.0099 0.0067 0.0032 0.002 0.0028 0.0031 0.0045 0.0037 0.0056 0.0053 0.0088 0.0056 0.0022 0.0015 0.0017 0.0025 0.0027 0.0035 0.0028 0.0047 0.0062 0.0063 0.0062 0.0051 0.004
Slide 27: Consistent Credit Performance
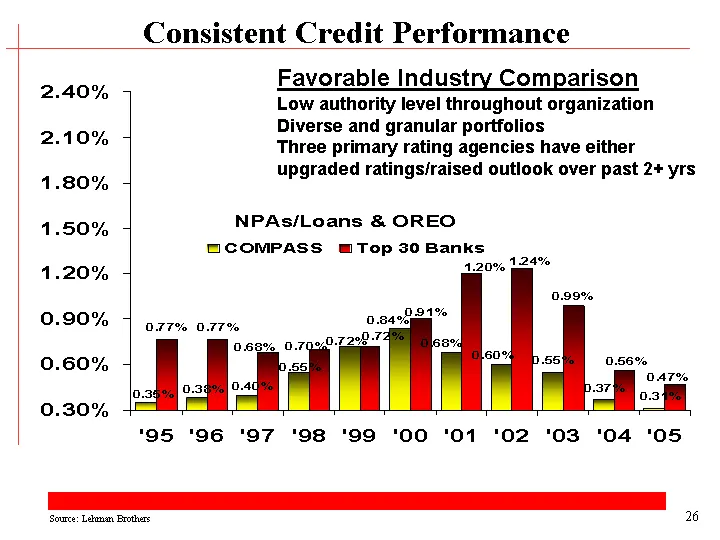
Source: Lehman Brothers Consistent Credit Performance '92 '93 '94 '95 '96 '97 '98 '99 '00 '01 '02 '03 '04 '05 COMPASS 0.0141 0.0077 0.0035 0.0035 0.0038 0.004 0.0055 0.0072 0.0084 0.0068 0.006 0.0055 0.0037 0.0031 Top 30 Banks 0.0232 0.0161 0.0094 0.0077 0.0077 0.0068 0.007 0.0072 0.0091 0.012 0.012
Slide 28: Asset Quality - NPAs
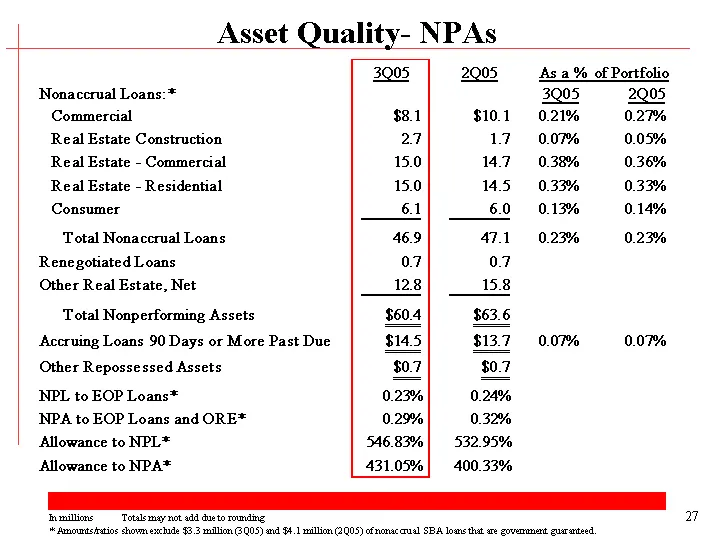
Asset Quality- NPAs In millions Totals may not add due to rounding * Amounts/ratios shown exclude $3.3 million (3Q05) and $4.1 million (2Q05) of nonaccrual SBA loans that are government guaranteed. 27
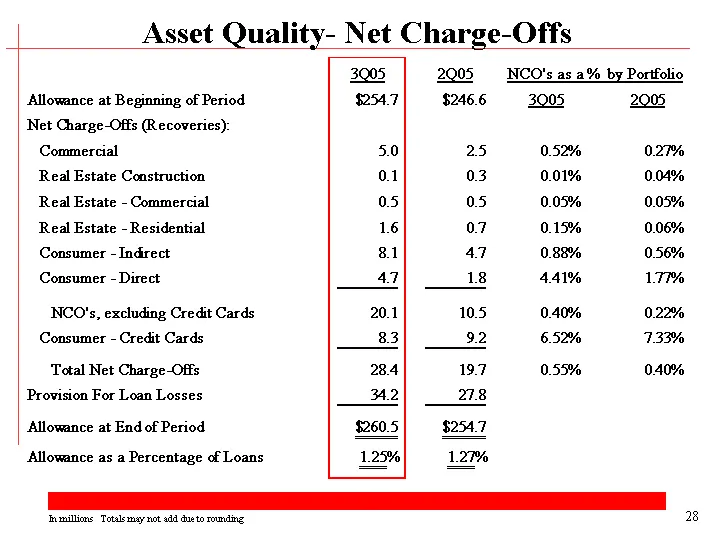
Slide 29: Asset Quality - Net Charge-Offs
Asset Quality- Net Charge-Offs In millions Totals may not add due to rounding 28
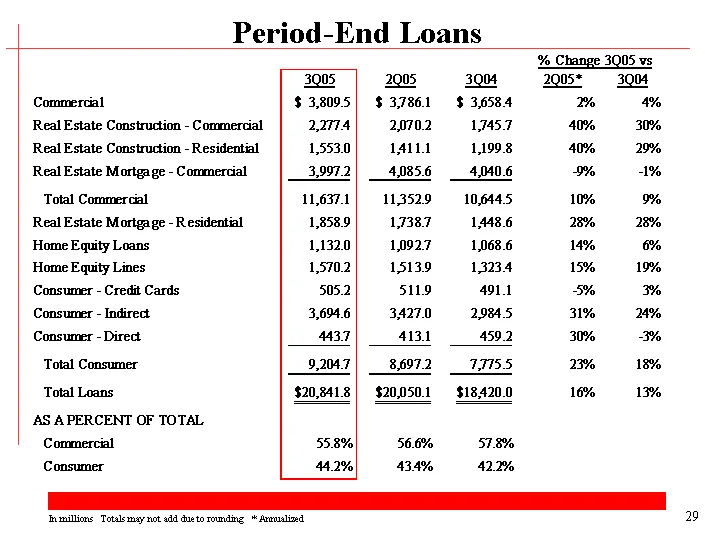
Slide 30: Period-End Loans
Period-End Loans In millions Totals may not add due to rounding * Annualized 29
Slide 31: Building Relationships Through Sales and Service
Building Relationships Through Sales and Service 30
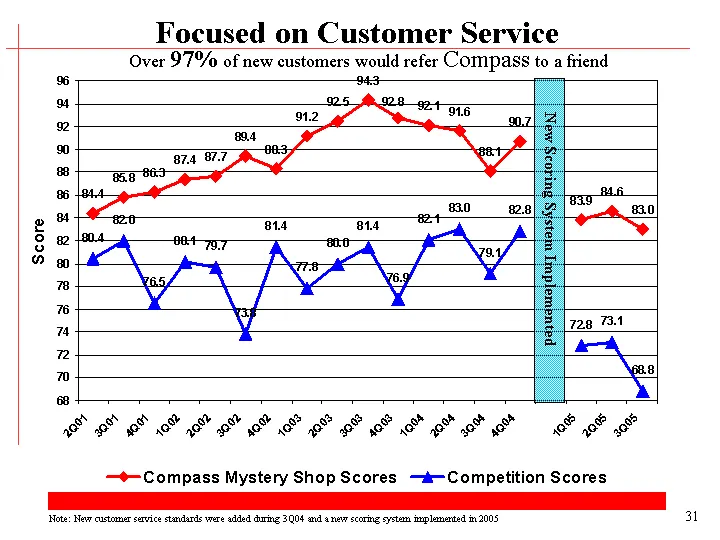
Slide 32: Focused on Customer Service
Over 97% of new customers would refer Compass to a friend Jan Feb Mar Apr May Jun Jul Aug Sept Oct Nov Dec Jan Feb 1Q01 2Q01 3Q01 4Q01 1Q02 2Q02 3Q02 4Q02 1Q03 2Q03 3Q03 4Q03 1Q04 2Q04 3Q04 4Q04 1Q05 2Q05 3Q05 Compass Mystery Shop Scores 83.77 84.38 82.28 86.35 86.78 86 85.07 85.76 87.06 85.59 87.55
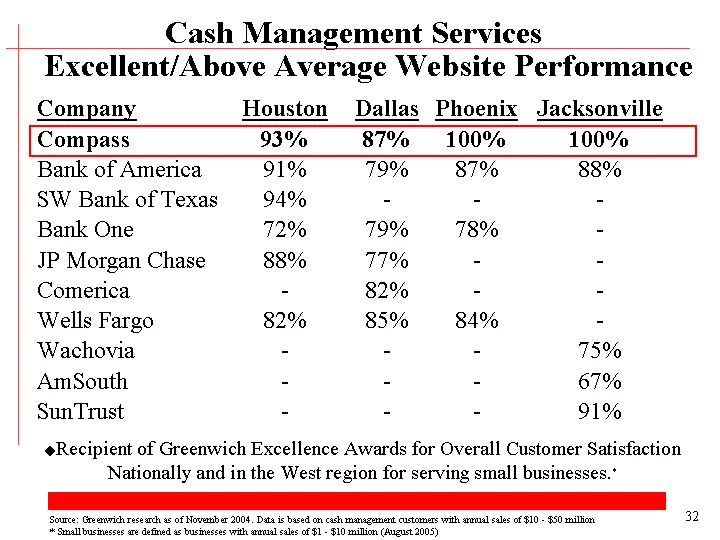
Slide 33: Greenwich Excellence Awards for Customer Satisfaction
Source: Greenwich research as of November 2004. Data is based on cash management customers with annual sales of $10 - $50 million * Small businesses are defined as businesses with annual sales of $1 - $10 million (August 2005) Company Compass Bank of America SW Bank of Texas Bank One JP Morgan Chase
Slide 34: Outlook
Outlook Compass Bancshares, Inc. 33
Slide 35: 2005 Expectations
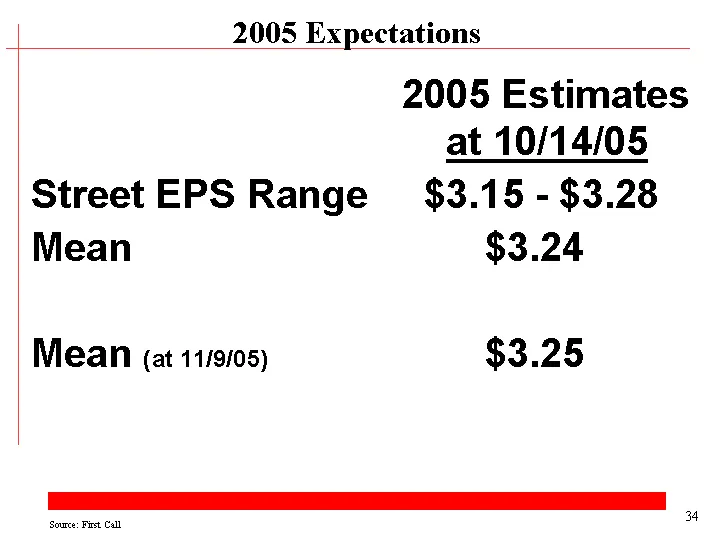
2005 Expectations 2005 Estimates at 10/14/05 Street EPS Range $3.15 - $3.28 Mean $3.24 Mean (at 11/9/05) $3.25 Source: First Call 34
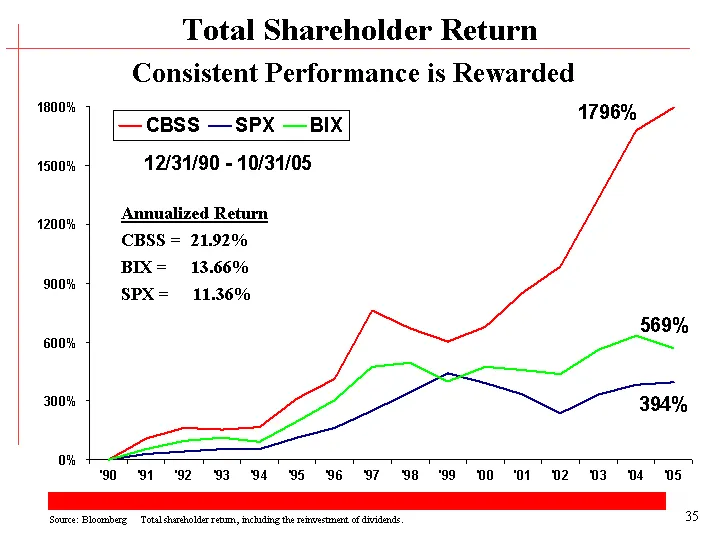
Slide 36: Consistent Performance is Rewarded
Source: Bloomberg Total shareholder return, including the reinvestment of dividends. Consistent Performance is Rewarded '90 '91 '92 '93 '94 '95 '96 '97 '98 '99 '00 '01 '02 '03 '04 '05 CBSS 0 1.0618 1.6224 1.5398 1.646 3.1038 4.1024 7.606 6.6938 6.0078 6.7749 8.5155 9.8504 13.3406 16.8147 17.9578 SPX
Source: SEC EDGAR · 425 filed Nov 15, 2005
More decks from Compass Bancshares Inc
 Compass Bancshares — Merger or Acquisition (June 2007)36 slides · Jun 21, 2007
 Compass Bancshares — Merger or Acquisition (May 2007)39 slides · May 1, 2007
 Compass Bancshares — Merger or Acquisition (March 2007)7 slides · Mar 29, 2007
 Compass Bancshares — Merger or Acquisition (March 2007)4 slides · Mar 19, 2007
 Q4 2005 Earnings Presentation25 slides · Jan 17, 2006
 Corporate Update (January 2006)7 slides · Jan 3, 2006