Science Group PLC · LSE:SAG
Science — FY2013 Earnings Presentation
13 slides from Science's earnings presentation, March 2014
Slide 1: 2013 Preliminary Results Presentation
2013 Preliminary Results Presentation March 2014 Martyn Ratcliffe Chairman Rebecca Hemsted Finance Director
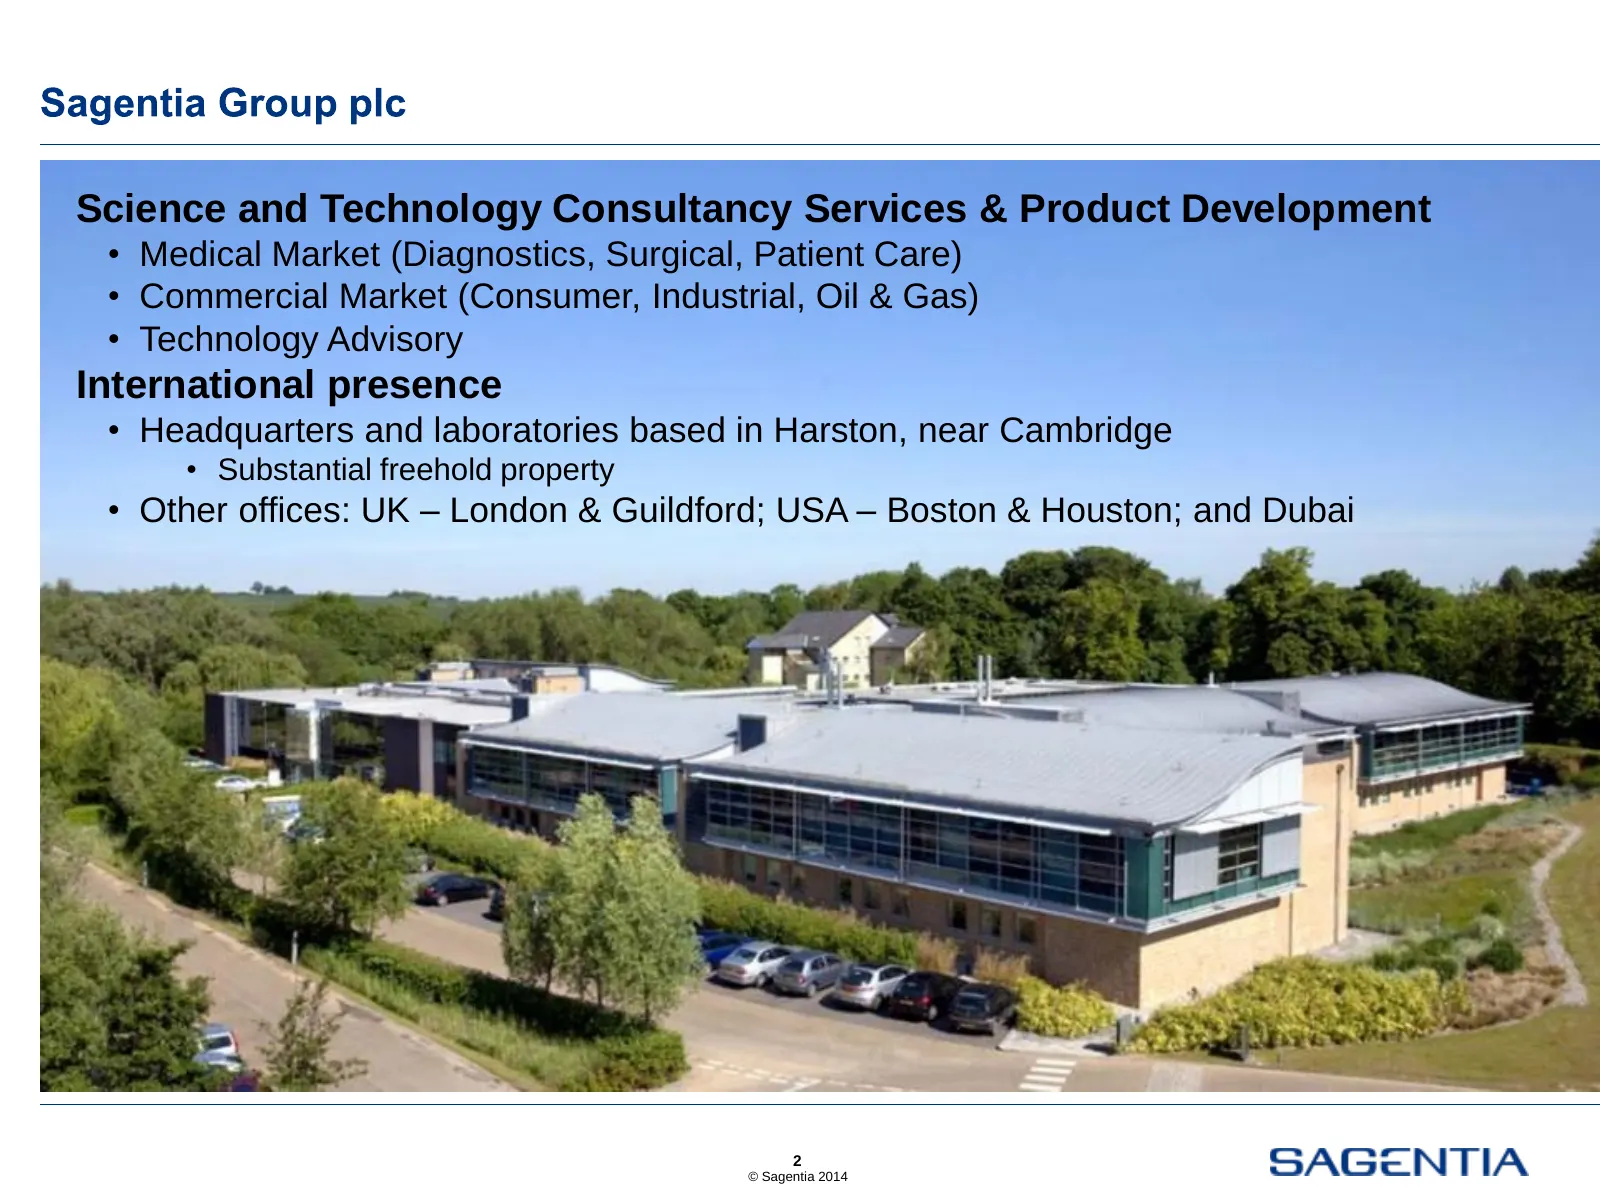
Slide 2: Science and Technology Consultancy Services & Product Development
Science and Technology Consultancy Services & Product Development • Medical Market (Diagnostics, Surgical, Patient Care) • Commercial Market (Consumer, Industrial, Oil & Gas) • Technology Advisory International presence • Headquarters and laboratories based in Harston, near Cambridge • Substantial f
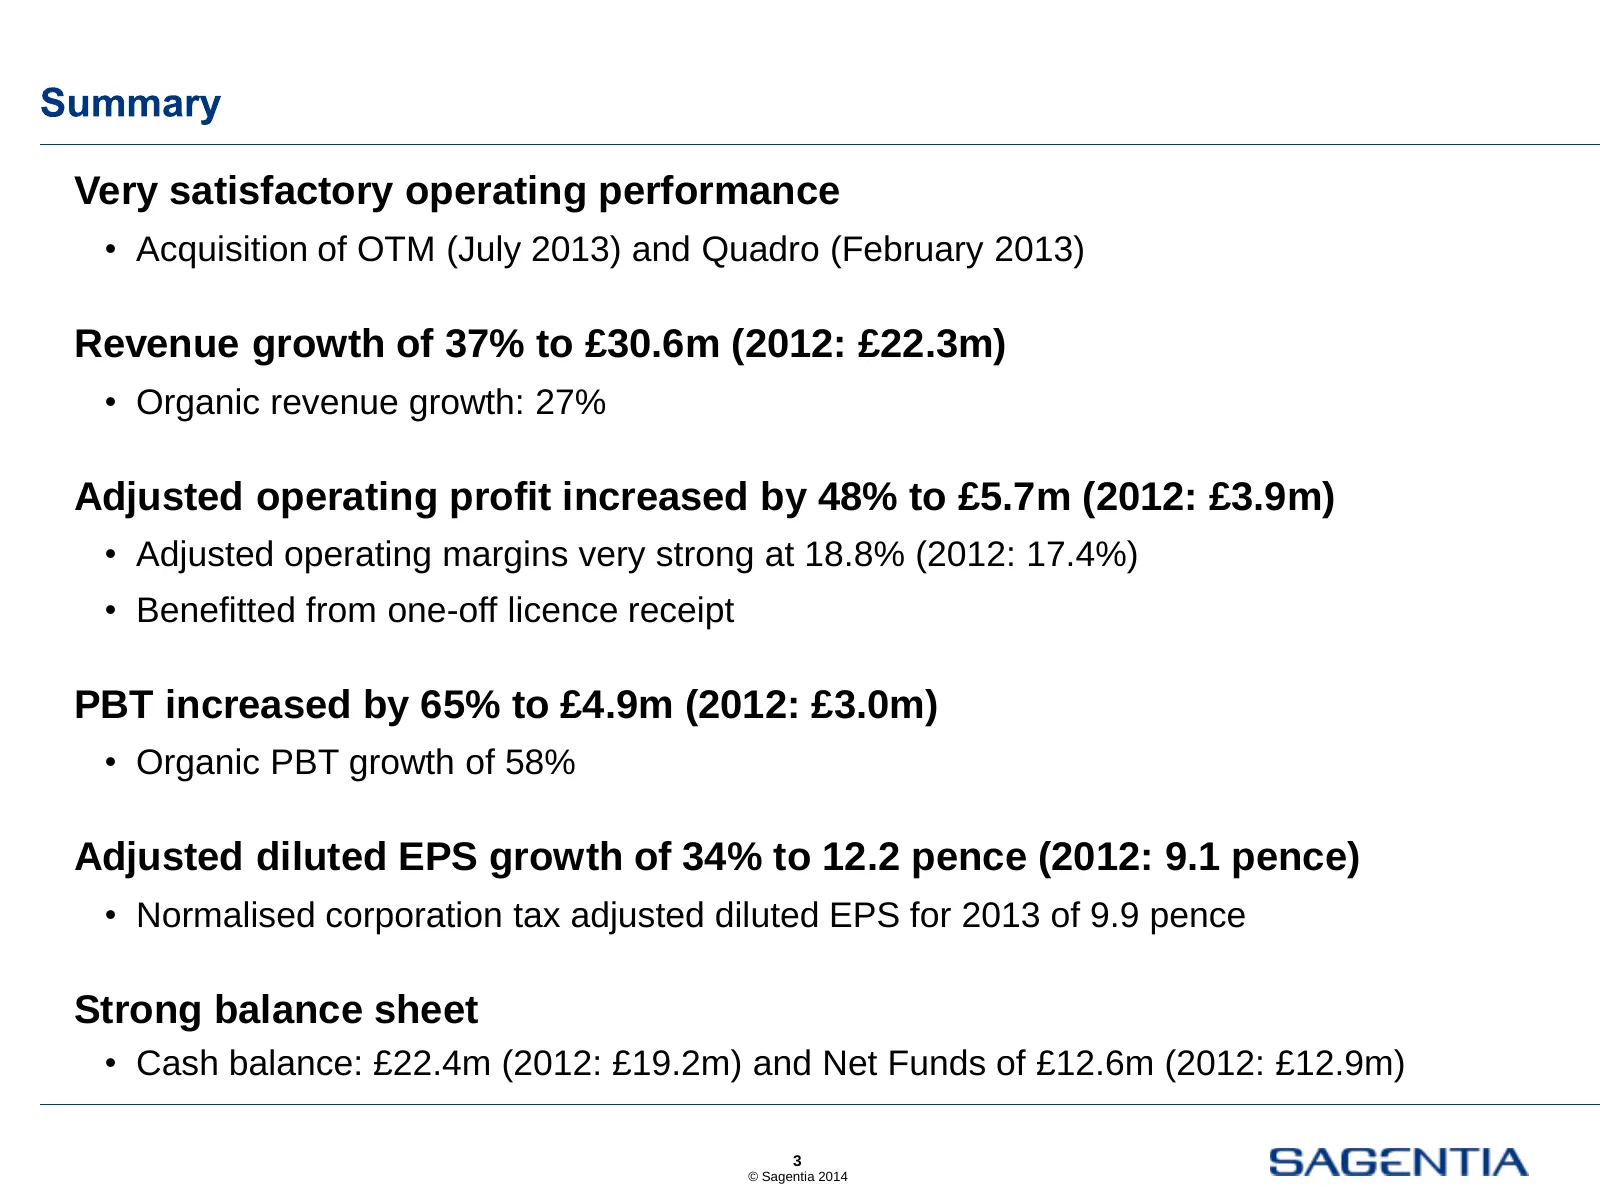
Slide 3: Very satisfactory operating performance
Very satisfactory operating performance • Acquisition of OTM (July 2013) and Quadro (February 2013) Revenue growth of 37% to £30.6m (2012: £22.3m) • Organic revenue growth: 27% Adjusted operating profit increased by 48% to £5.7m (2012: £3.9m) • Adjusted operating margins very strong at 18.8% (2012:
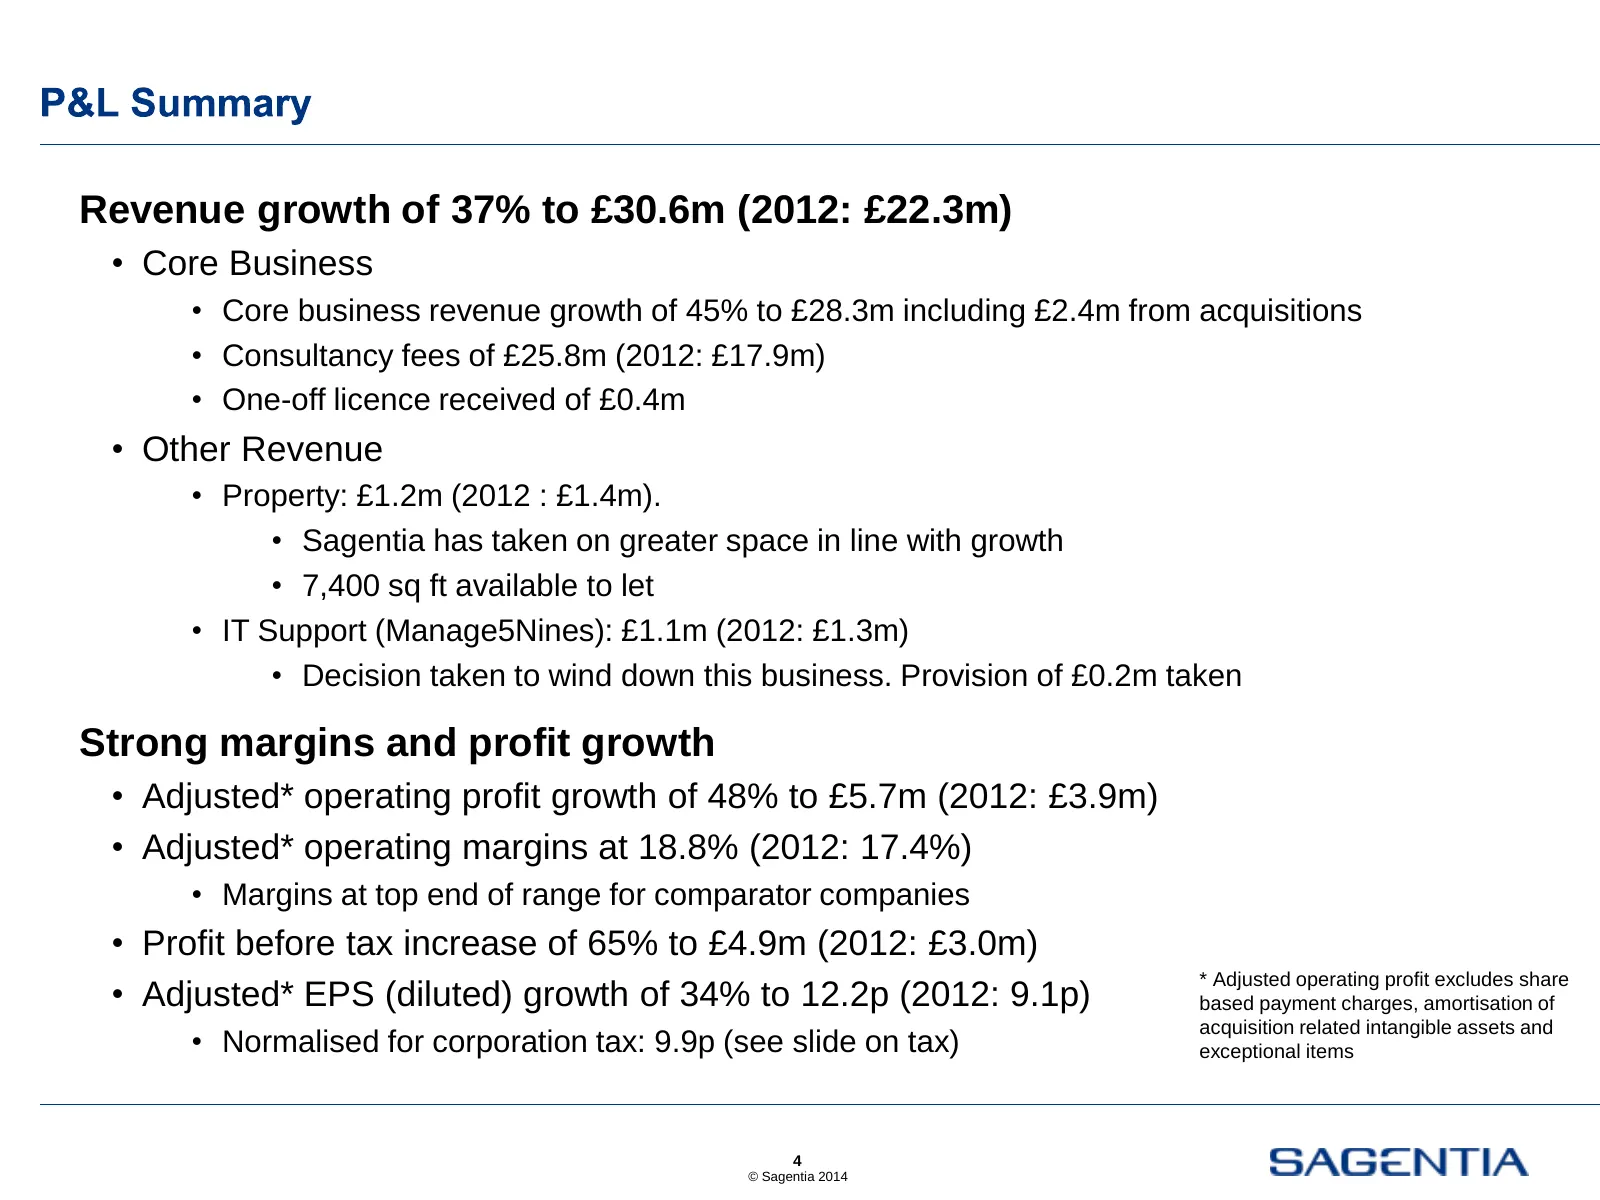
Slide 4: Revenue growth of 37% to £30.6m
Revenue growth of 37% to £30.6m (2012: £22.3m) • Core Business • Core business revenue growth of 45% to £28.3m including £2.4m from acquisitions • Consultancy fees of £25.8m (2012: £17.9m) • One-off licence received of £0.4m • Other Revenue • Property: £1.2m (2012 : £1.4m). • Sagentia has taken on g
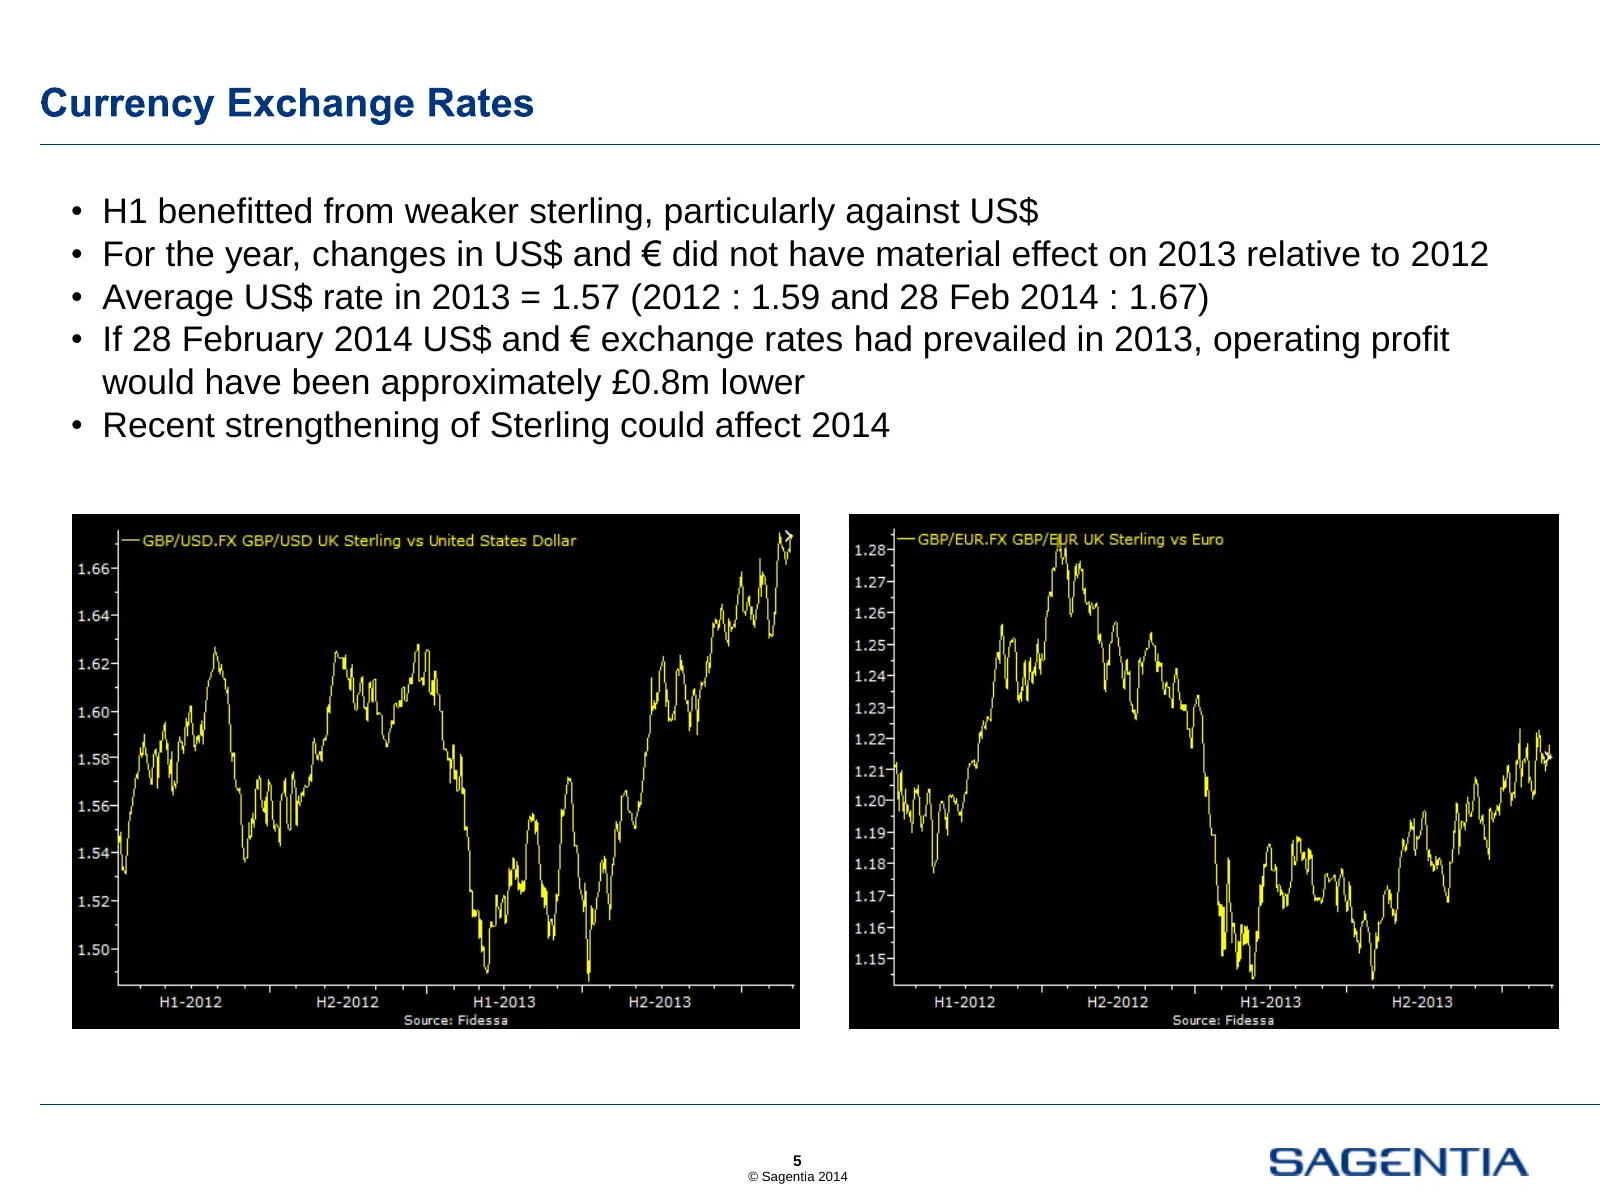
Slide 5: Currency impact on 2013 results
• H1 benefitted from weaker sterling, particularly against US$ • For the year, changes in US$ and € did not have material effect on 2013 relative to 2012 • Average US$ rate in 2013 = 1.57 (2012 : 1.59 and 28 Feb 2014 : 1.67) • If 28 February 2014 US$ and € exchange rates had prevailed in 2013, opera
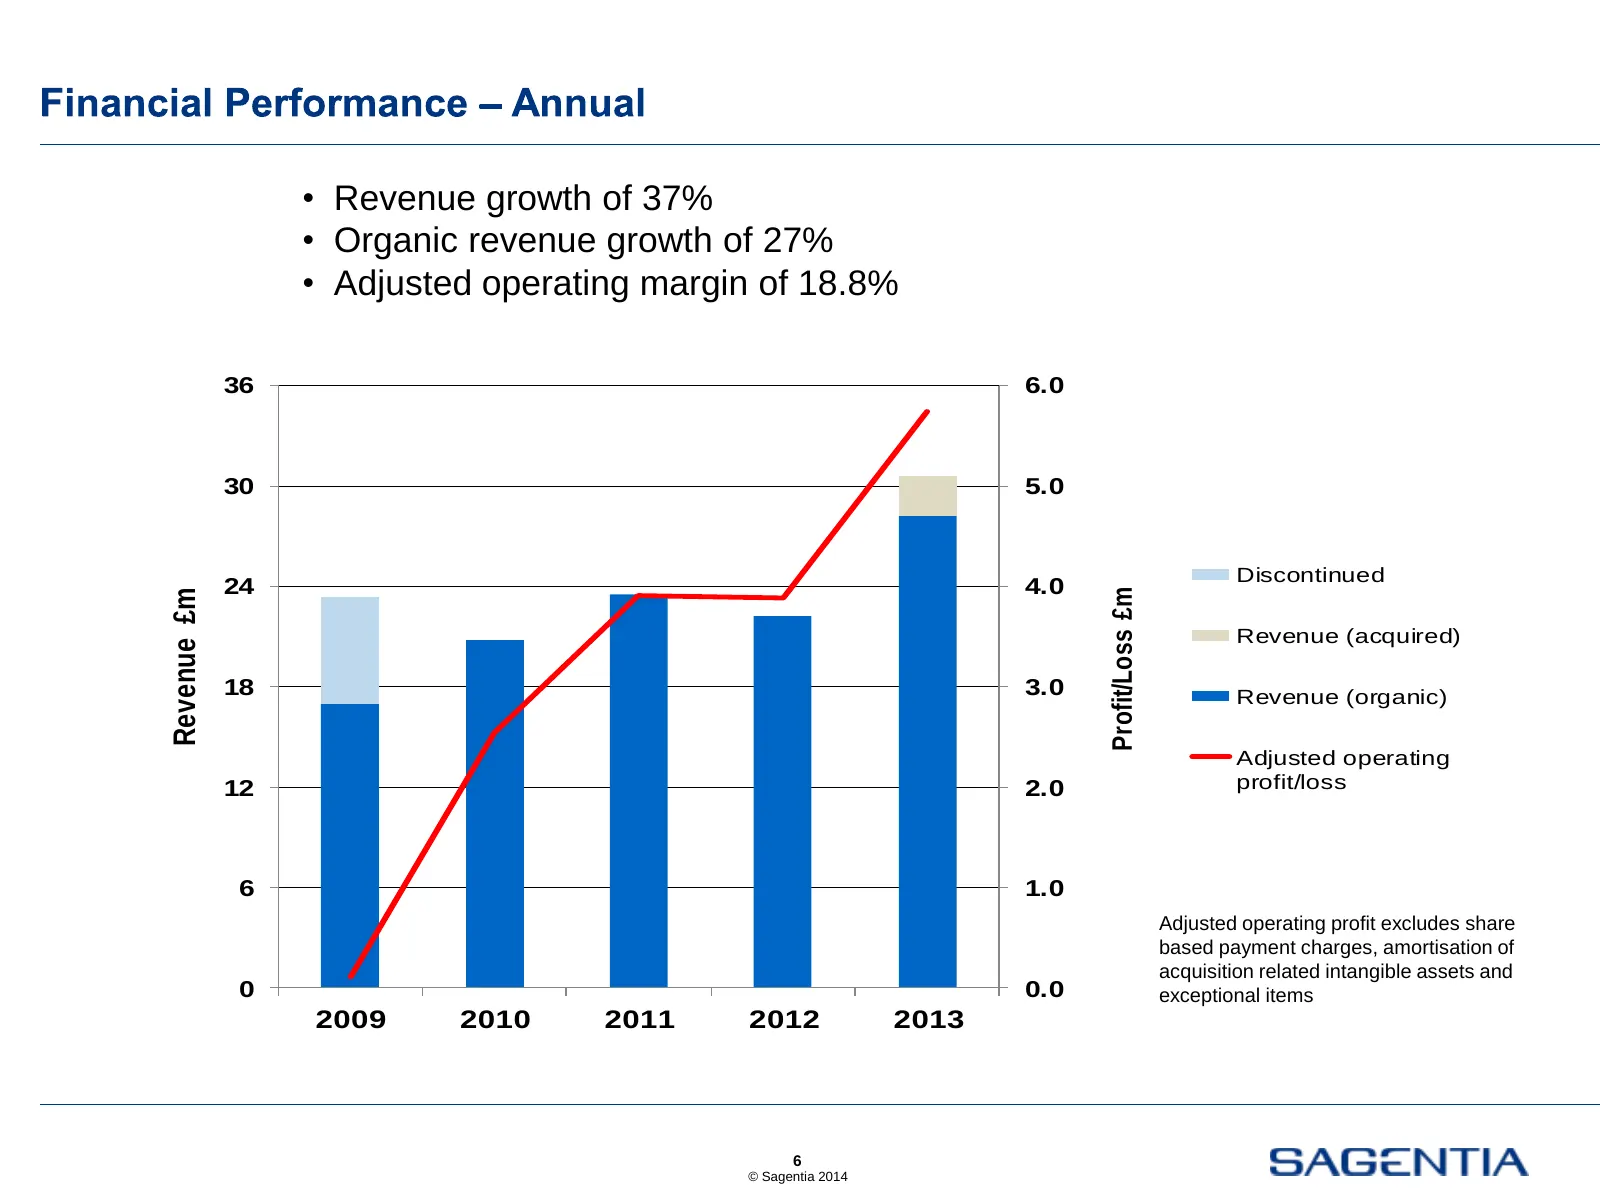
Slide 6: Annual revenue and adjusted operating profit
• Revenue growth of 37% • Organic revenue growth of 27% • Adjusted operating margin of 18.8% 36 6.0 30 5.0 Discontinued 24 4.0 Profit/Loss £m Revenue £m Revenue (acquired) 18 3.0 Revenue (organic) Adjusted operating 12 2.0 profit/loss 6 1.0 Adjusted operating profit excludes share based payment char
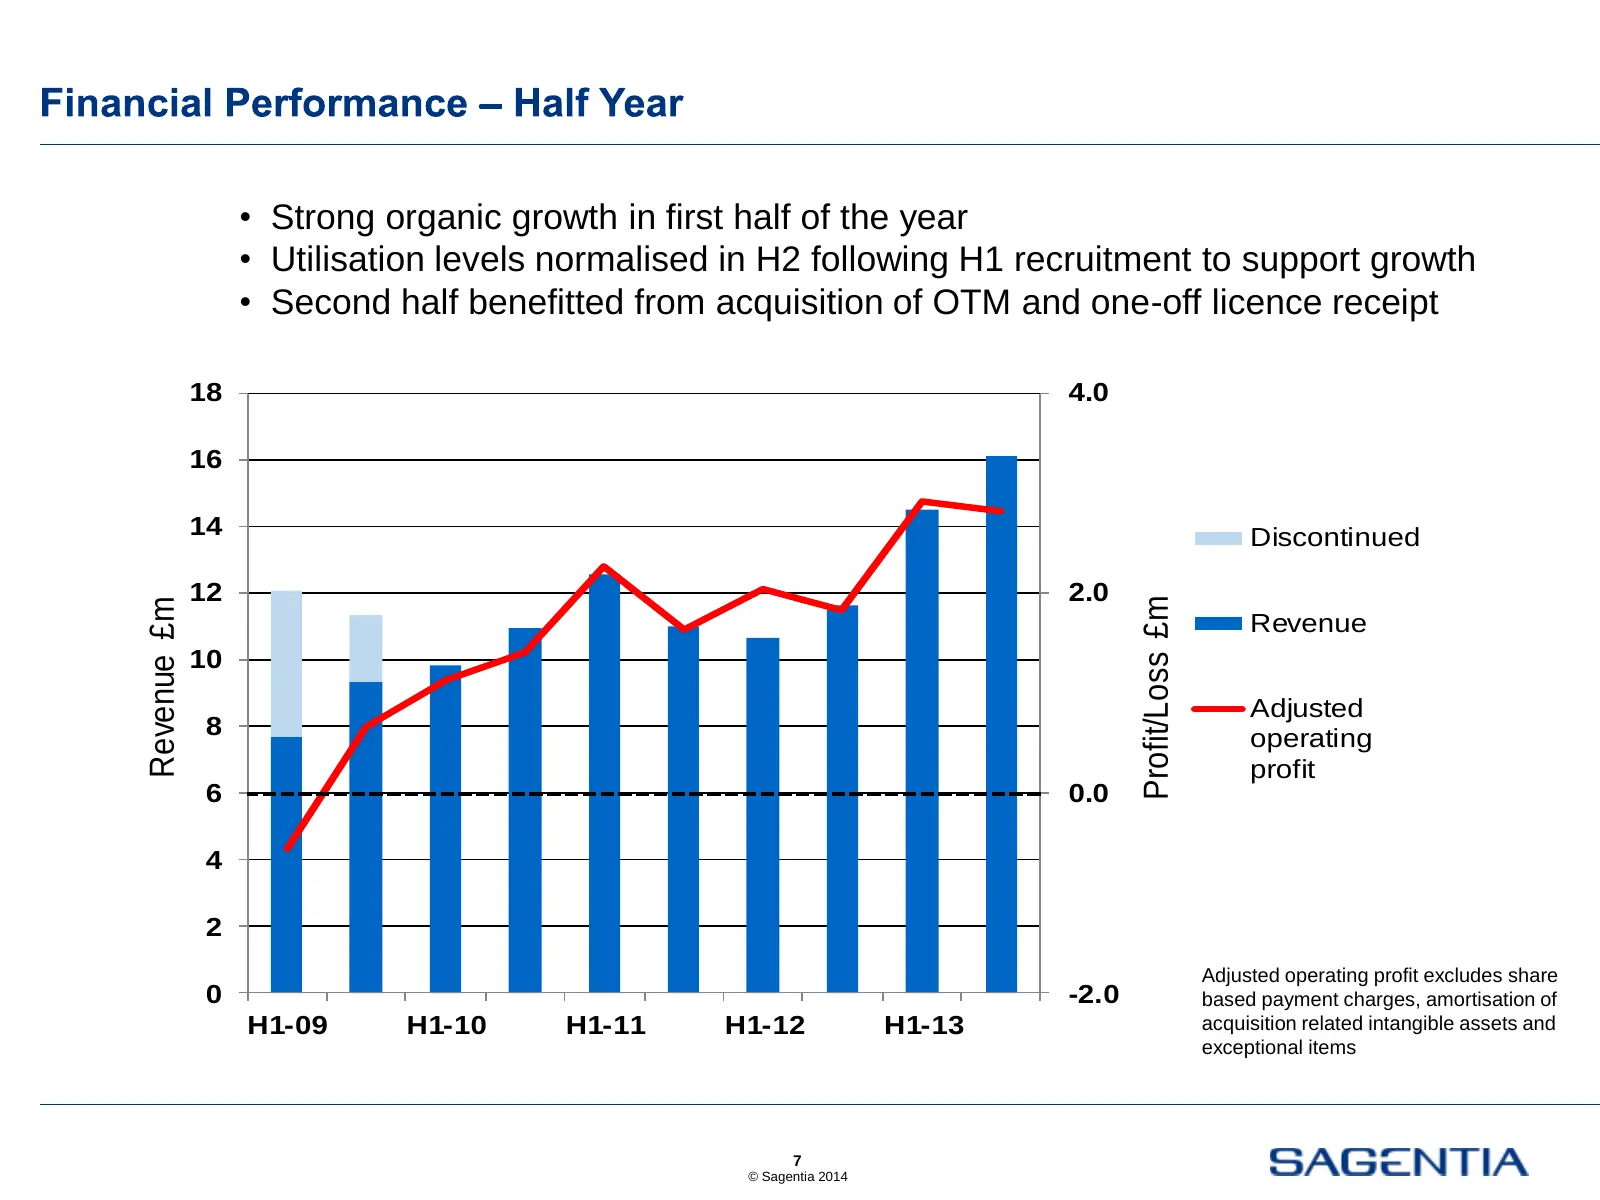
Slide 7: Half-year revenue and adjusted operating profit
• Strong organic growth in first half of the year • Utilisation levels normalised in H2 following H1 recruitment to support growth • Second half benefitted from acquisition of OTM and one-off licence receipt 18 4.0 16 14 Discontinued 12 2.0 Profit/Loss £m Revenue £m Revenue 10 Adjusted 8 operating p
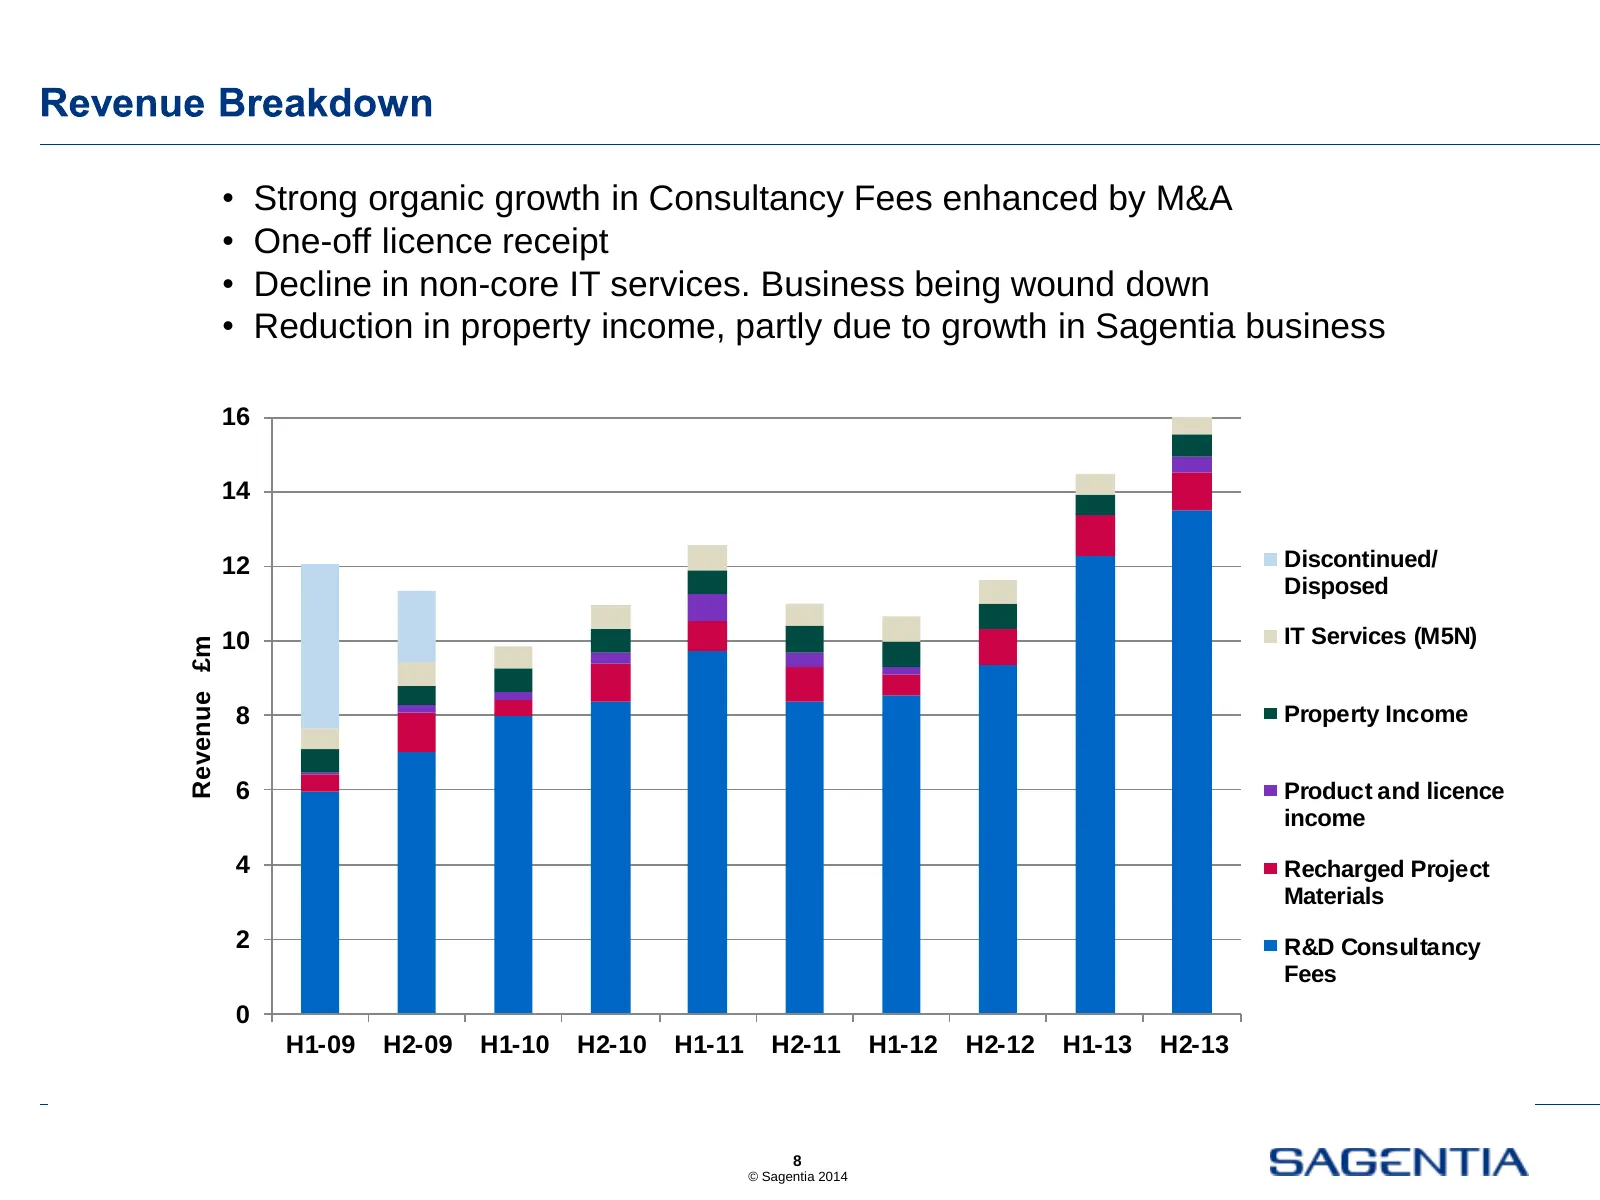
Slide 8: Revenue by half-year and stream
• Strong organic growth in Consultancy Fees enhanced by M&A • One-off licence receipt • Decline in non-core IT services. Business being wound down • Reduction in property income, partly due to growth in Sagentia business 16 14 12 Discontinued/ Disposed 10 IT Services (M5N) Revenue £m 8 Property Inco
Slide 9: Business sectors
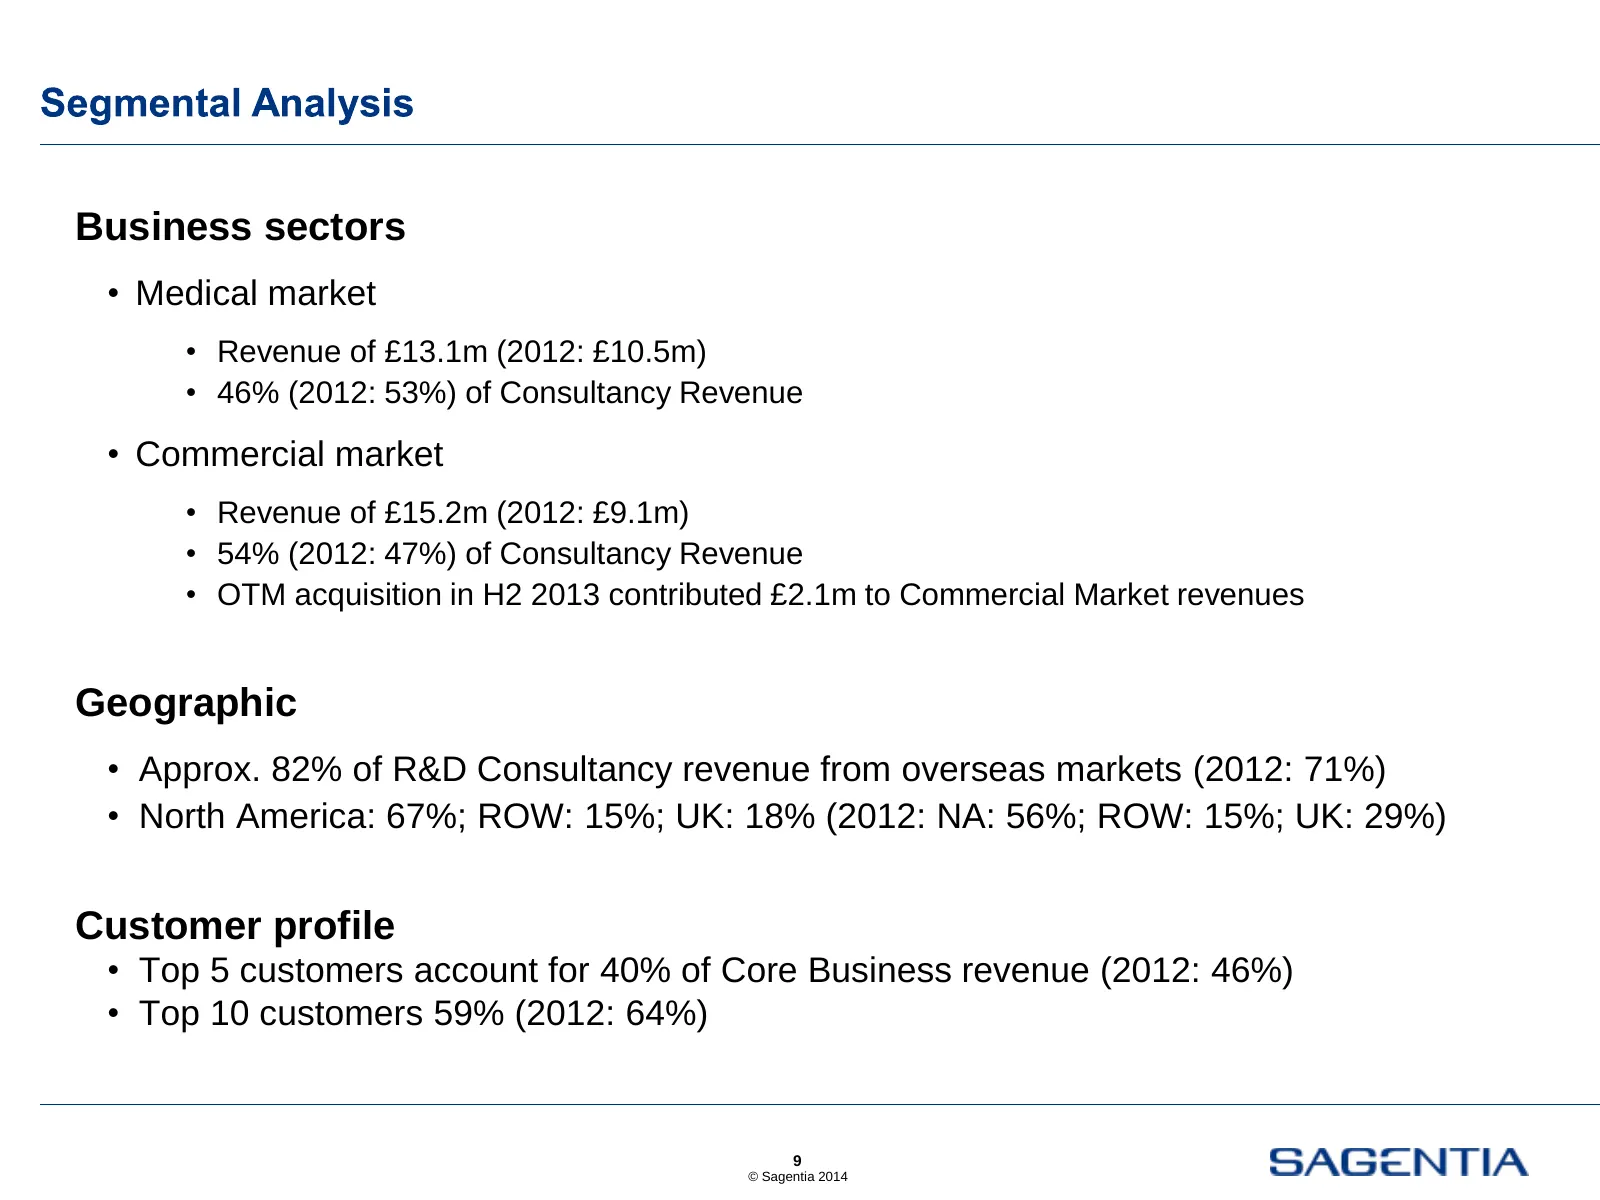
Business sectors • Medical market • Revenue of £13.1m (2012: £10.5m) • 46% (2012: 53%) of Consultancy Revenue • Commercial market • Revenue of £15.2m (2012: £9.1m) • 54% (2012: 47%) of Consultancy Revenue • OTM acquisition in H2 2013 contributed £2.1m to Commercial Market revenues Geographic • Appro
Slide 10: Strong cash position
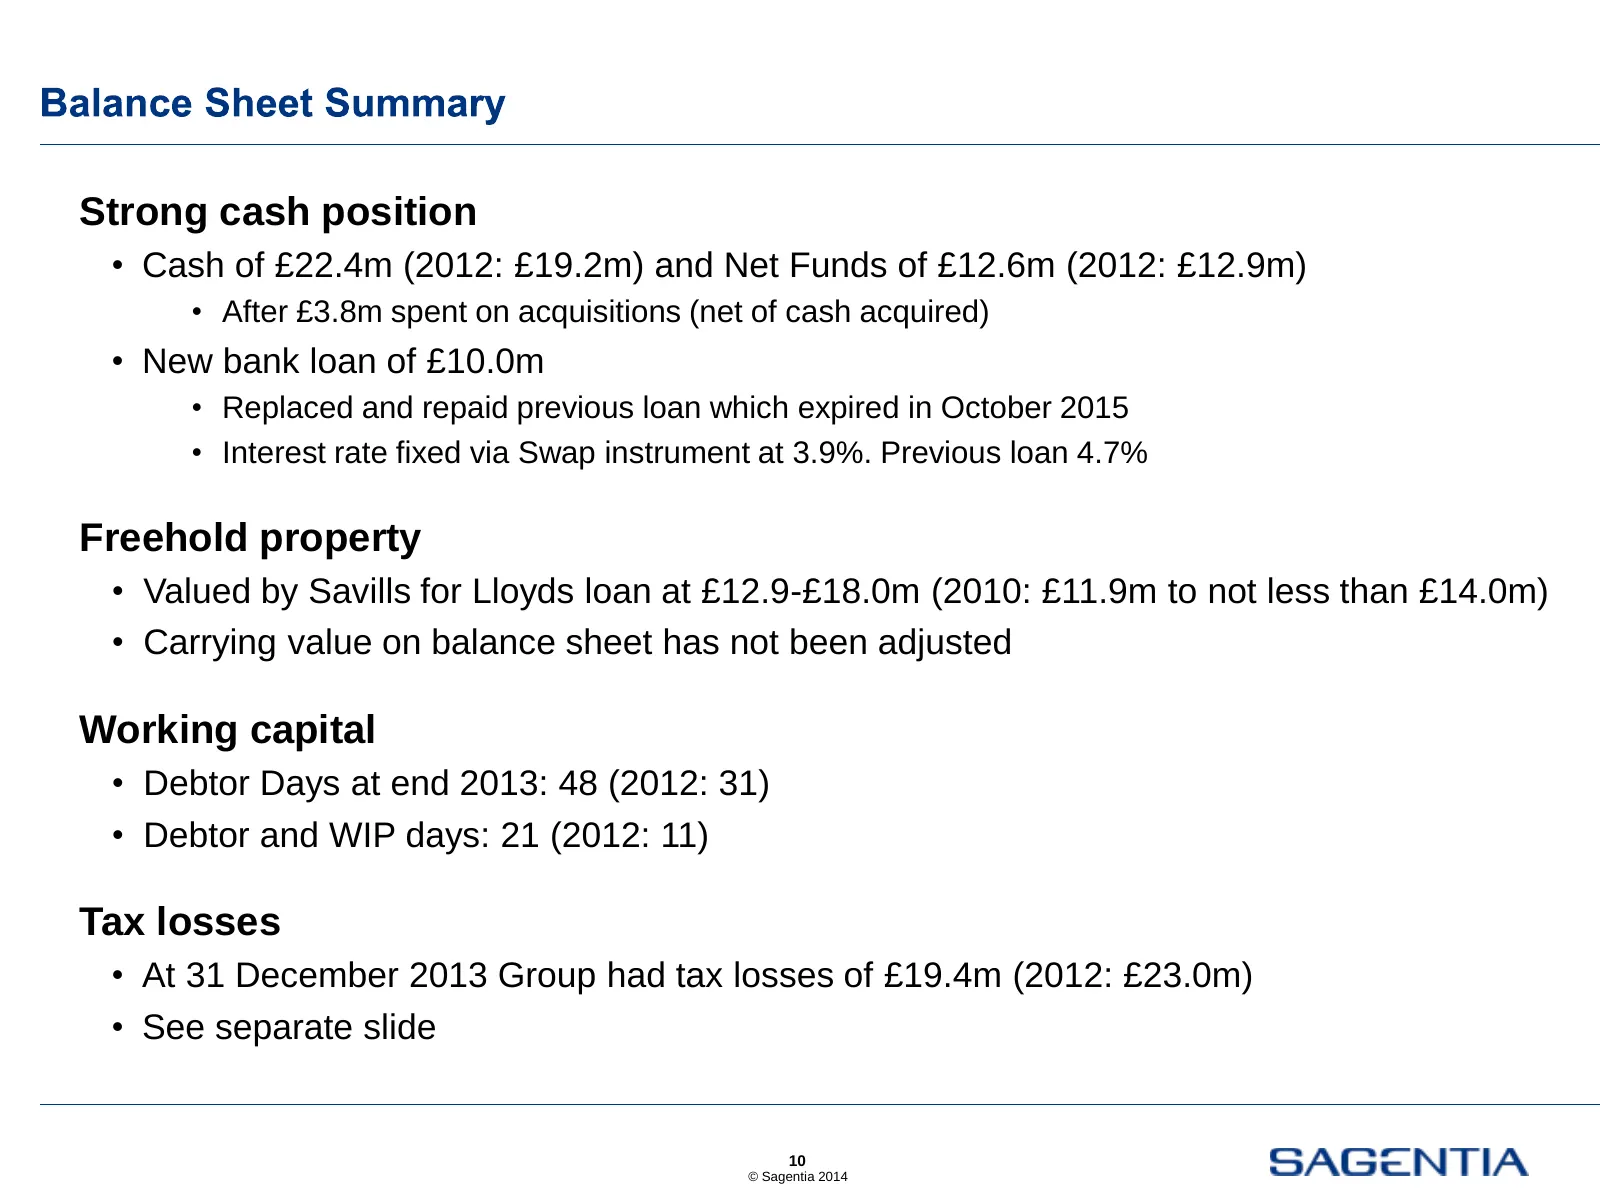
Strong cash position • Cash of £22.4m (2012: £19.2m) and Net Funds of £12.6m (2012: £12.9m) • After £3.8m spent on acquisitions (net of cash acquired) • New bank loan of £10.0m • Replaced and repaid previous loan which expired in October 2015 • Interest rate fixed via Swap instrument at 3.9%. Previo
Slide 11: Tax losses
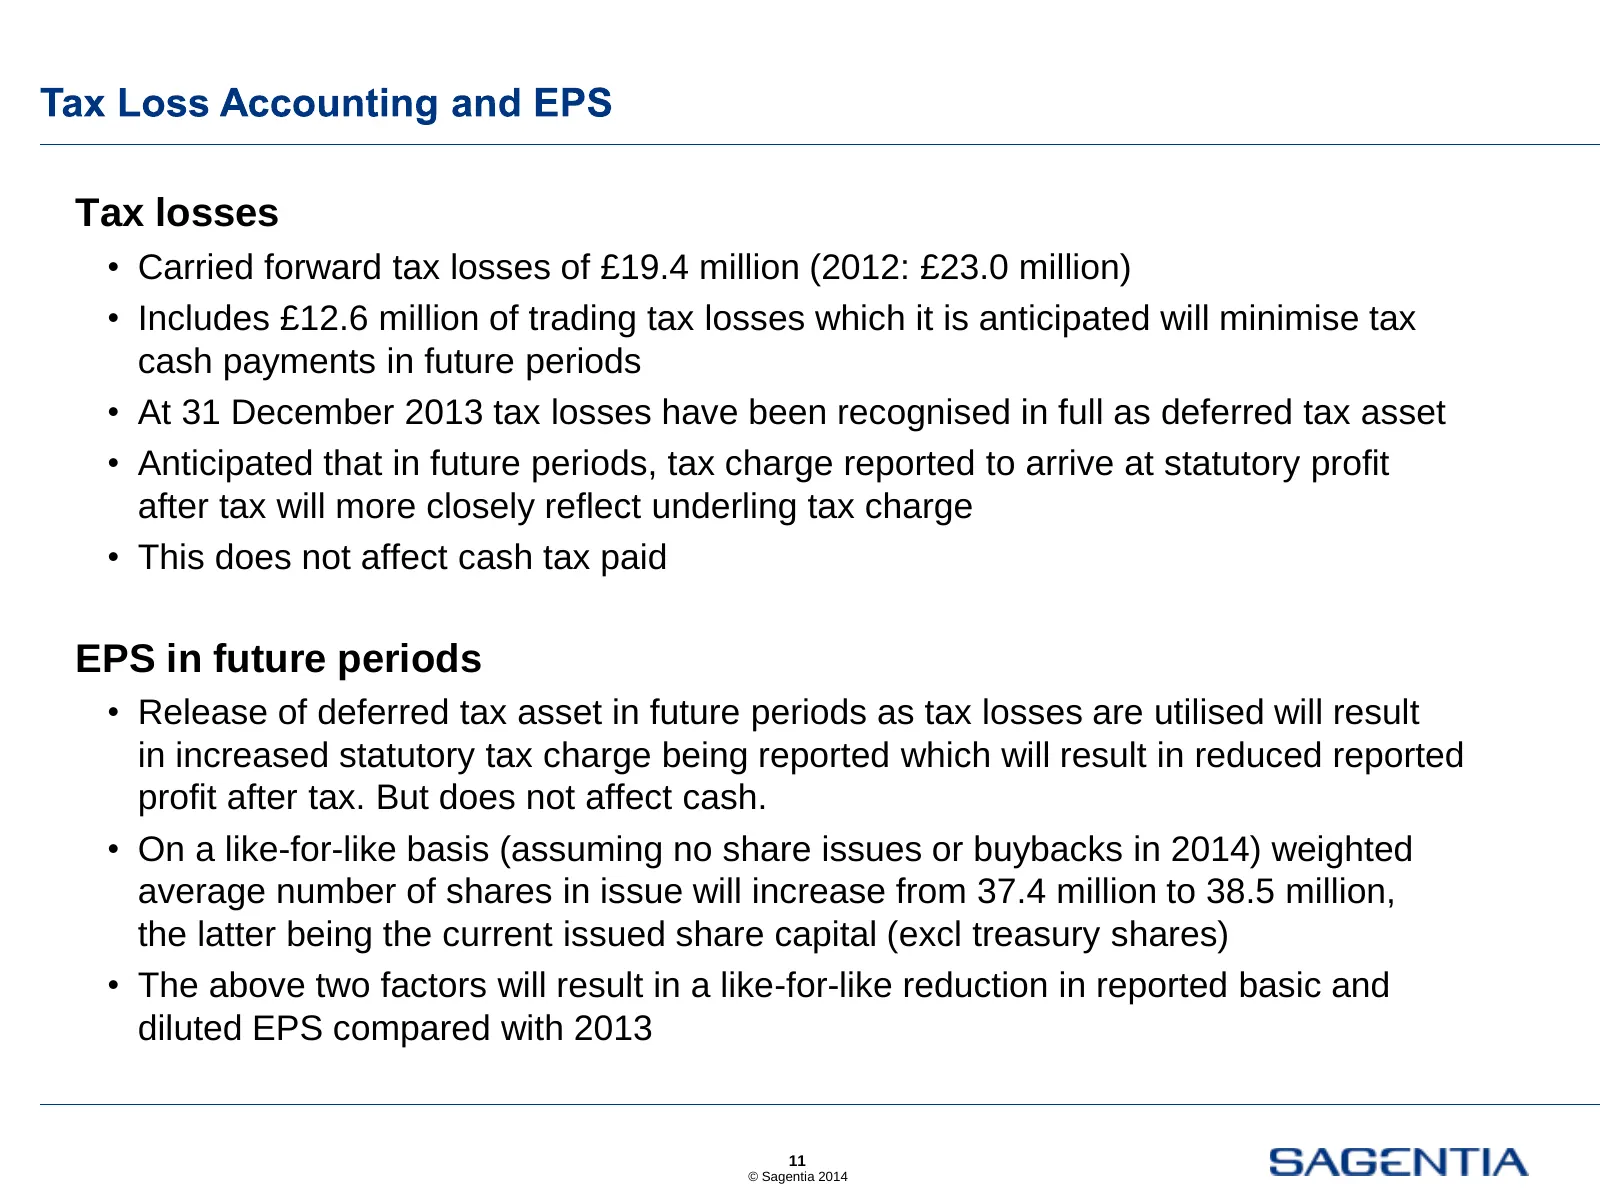
Tax losses • Carried forward tax losses of £19.4 million (2012: £23.0 million) • Includes £12.6 million of trading tax losses which it is anticipated will minimise tax cash payments in future periods • At 31 December 2013 tax losses have been recognised in full as deferred tax asset • Anticipated th
Slide 12: OTM, Quadro and Manage5Nines subsidiaries
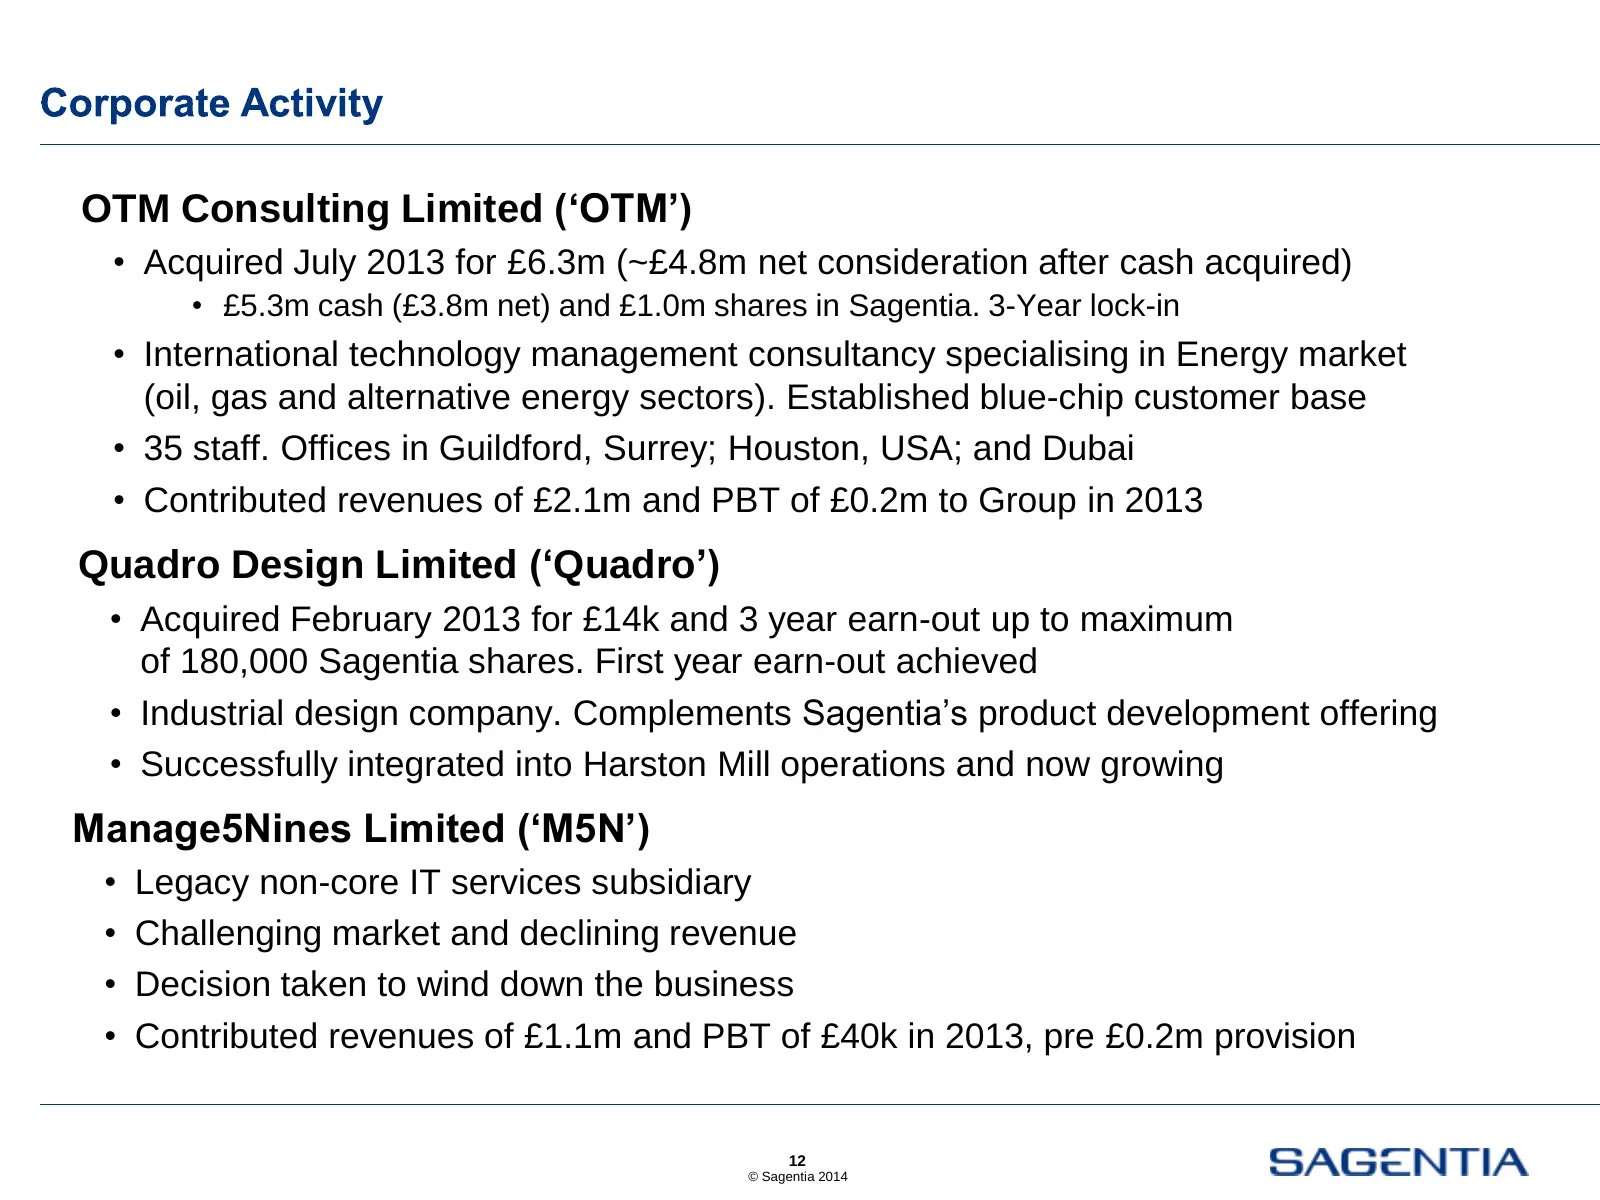
OTM Consulting Limited (‘OTM’) • Acquired July 2013 for £6.3m (~£4.8m net consideration after cash acquired) • £5.3m cash (£3.8m net) and £1.0m shares in Sagentia. 3-Year lock-in • International technology management consultancy specialising in Energy market (oil, gas and alternative energy sectors)
Slide 13: Sagentia is listed on the London Stock Exchange
www.sagentia.com info@sagentia.com Sagentia is listed on the London Stock Exchange (SAG.L) SAGENTIA
Source: Internet Archive copy of sciencegroup.com
More decks from Science Group PLC
 FY2025 Earnings Presentation18 slides · Mar 17, 2026
 Leatherhead Food Research — Technical Presentation (March 2026)37 slides · Mar 4, 2026
 H1 2025 Earnings Presentation12 slides · Jul 28, 2025
 FY2024 Earnings Presentation16 slides · Mar 24, 2025
 H1 2024 Earnings Presentation10 slides · Jul 23, 2024
 FY2023 Earnings Presentation19 slides · Mar 21, 2024