Western Union Company (the) · NYSE:WU
Western Union Company (the) — The Western Union Company — Q2 2020 Earnings Presentation
27 slides from Western Union Company (the)'s earnings presentation, Aug 4, 2020
Slide 1: Second Quarter 2020 Earnings Webcast and Conference Call
Second Quarter 2020 Earnings Webcast and Conference Call August 4, 2020 1

Slide 2: Brendan Metrano, Vice President of Investor Relations
Brendan Metrano Vice President of Investor Relations 2

Slide 3: Safe Harbor
Safe Harbor This presentation contains certain statements that are forward-looking within the meaning of the Private Securities Litigation Reform Act of 1995. These statements are not guarantees of future performance and involve certain risks, uncertainties, and assumptions that are difficult to pre
Slide 4: Hikmet Ersek, Chief Executive Officer
Hikmet Ersek Chief Executive Officer 4
Slide 5: Strong Competitive Position
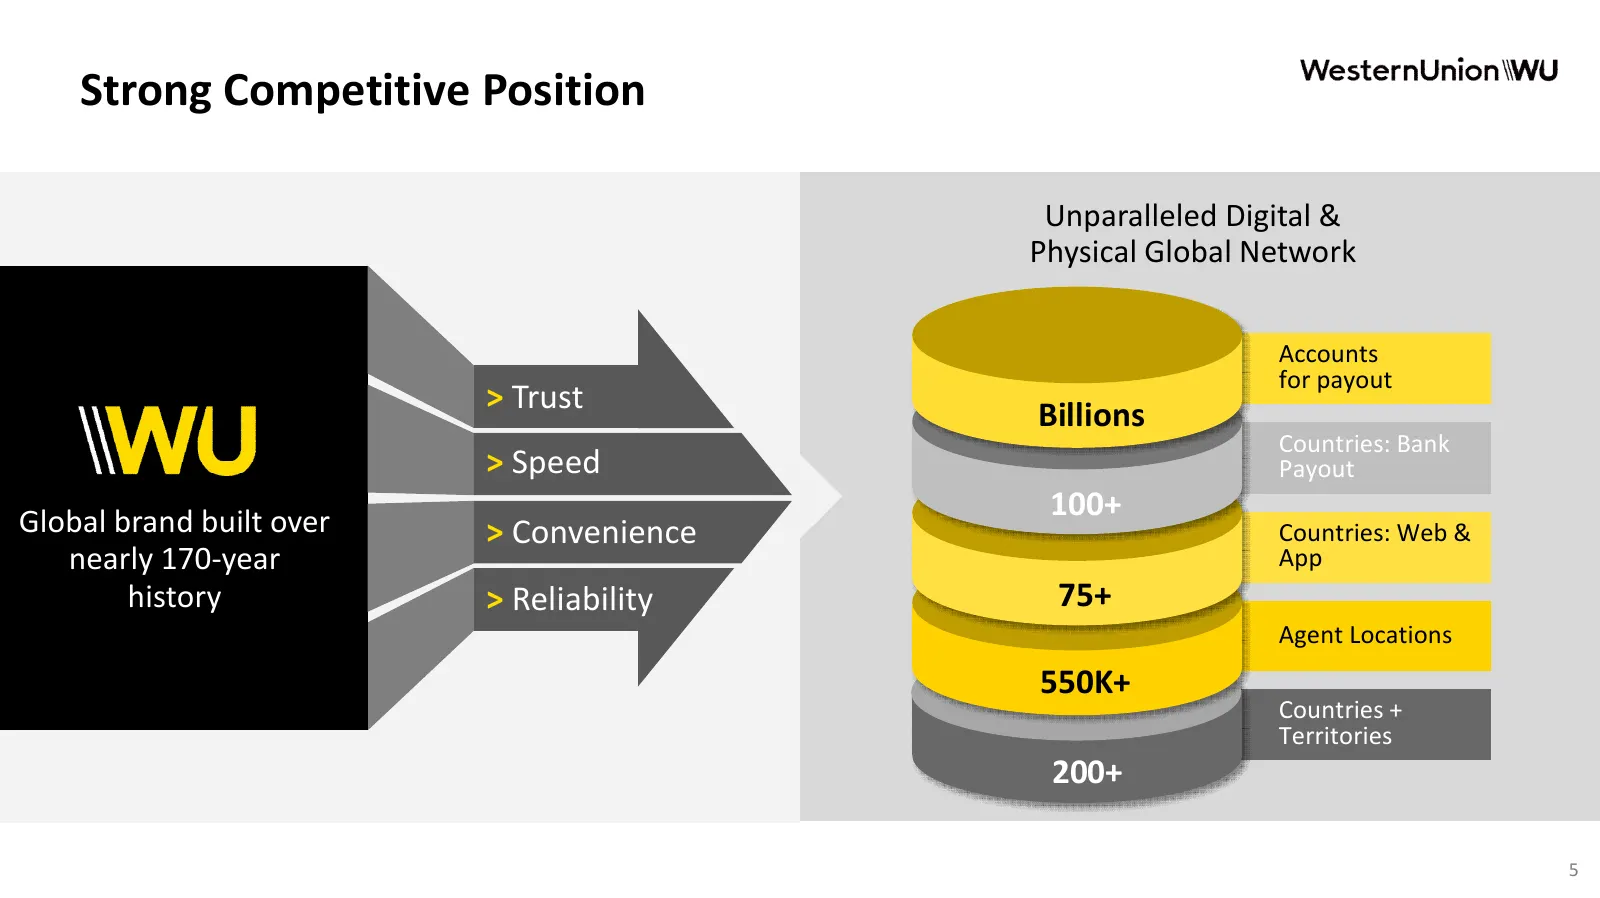
Strong Competitive Position Unparalleled Digital & Physical Global Network Accounts for payout > Trust Billions Countries: Bank > Speed Payout Global brand built over 100+ > Convenience Countries: Web & nearly 170-year App history > Reliability 75+ Agent Locations 550K+ Countries + Territories 200+
Slide 6: Digital Business Accelerating
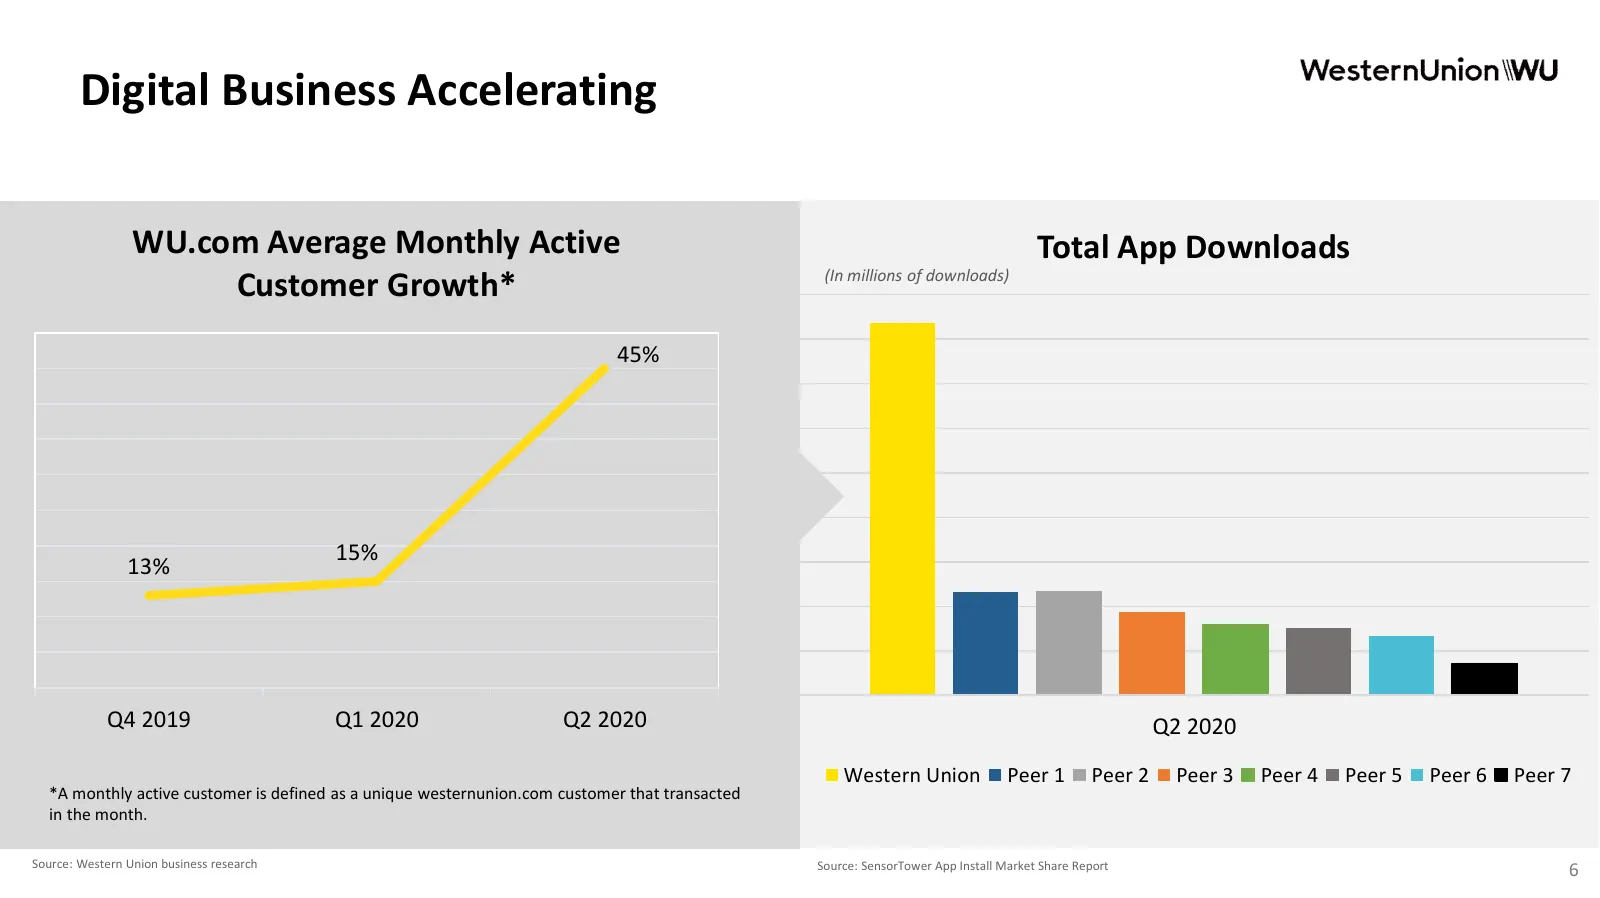
Digital Business Accelerating WU.com Average Monthly Active Total App Downloads Customer Growth* (In millions of downloads) 45% 15% 13% Q4 2019 Q1 2020 Q2 2020 Q2 2020 Western Union Peer 1 Peer 2 Peer 3 Peer 4 Peer 5 Peer 6 Peer 7 *A monthly active customer is defined as a unique westernunion.com cu
Slide 7: Second Quarter Snapshot
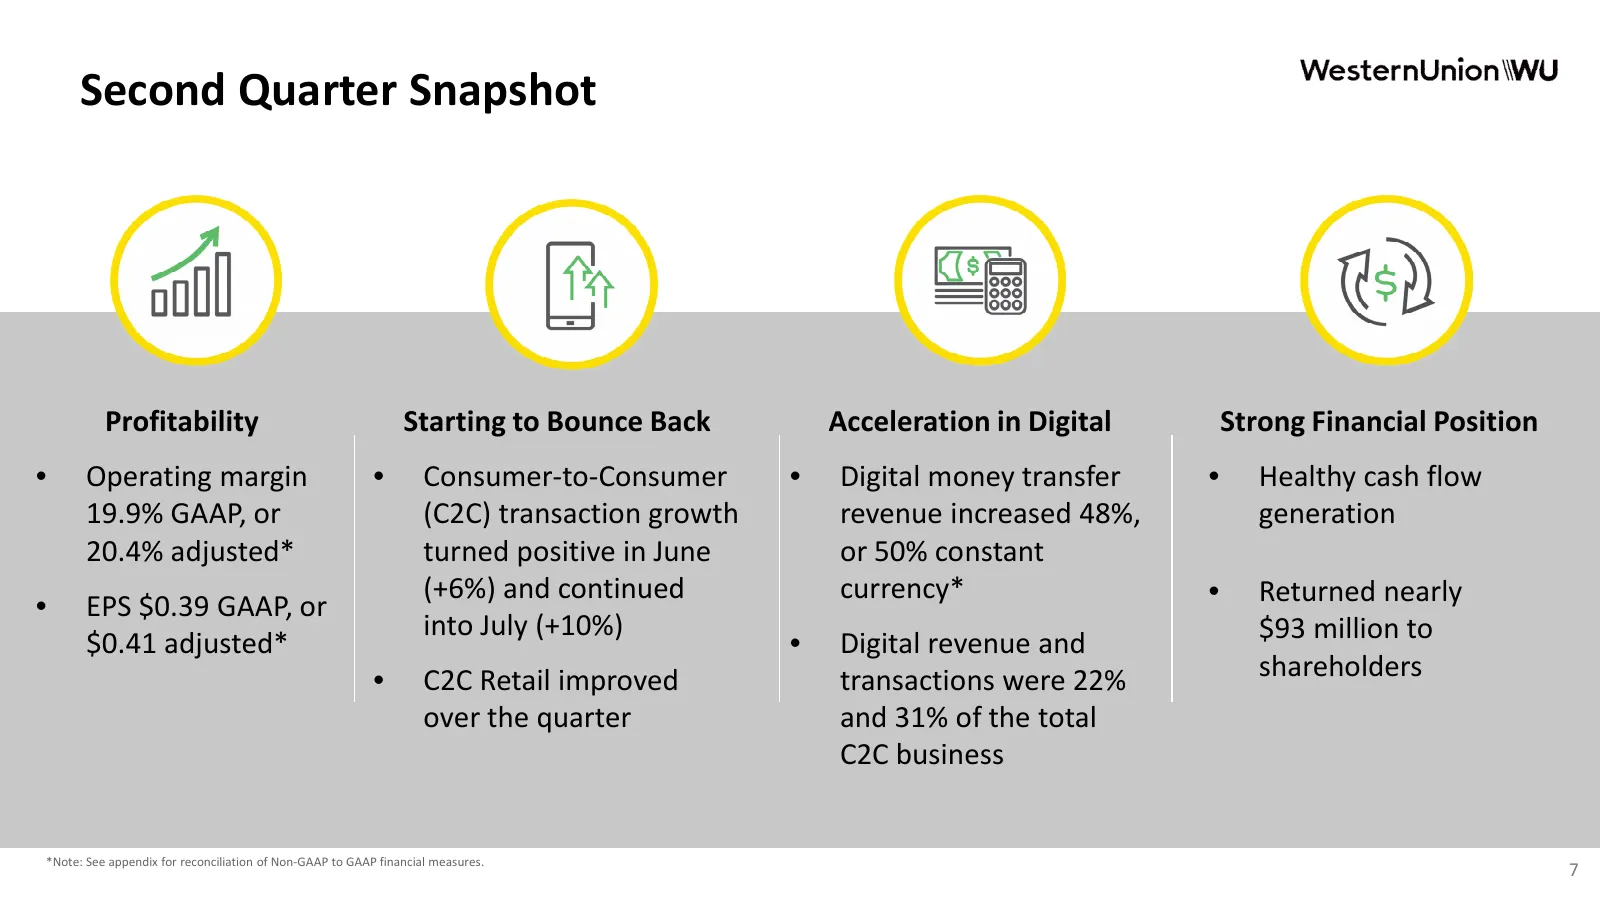
Second Quarter Snapshot Profitability Starting to Bounce Back Acceleration in Digital Strong Financial Position • Operating margin • Consumer-to-Consumer • Digital money transfer • Healthy cash flow 19.9% GAAP, or (C2C) transaction growth revenue increased 48%, generation 20.4% adjusted* turned posi
Slide 8: 2020 Strategic Agenda
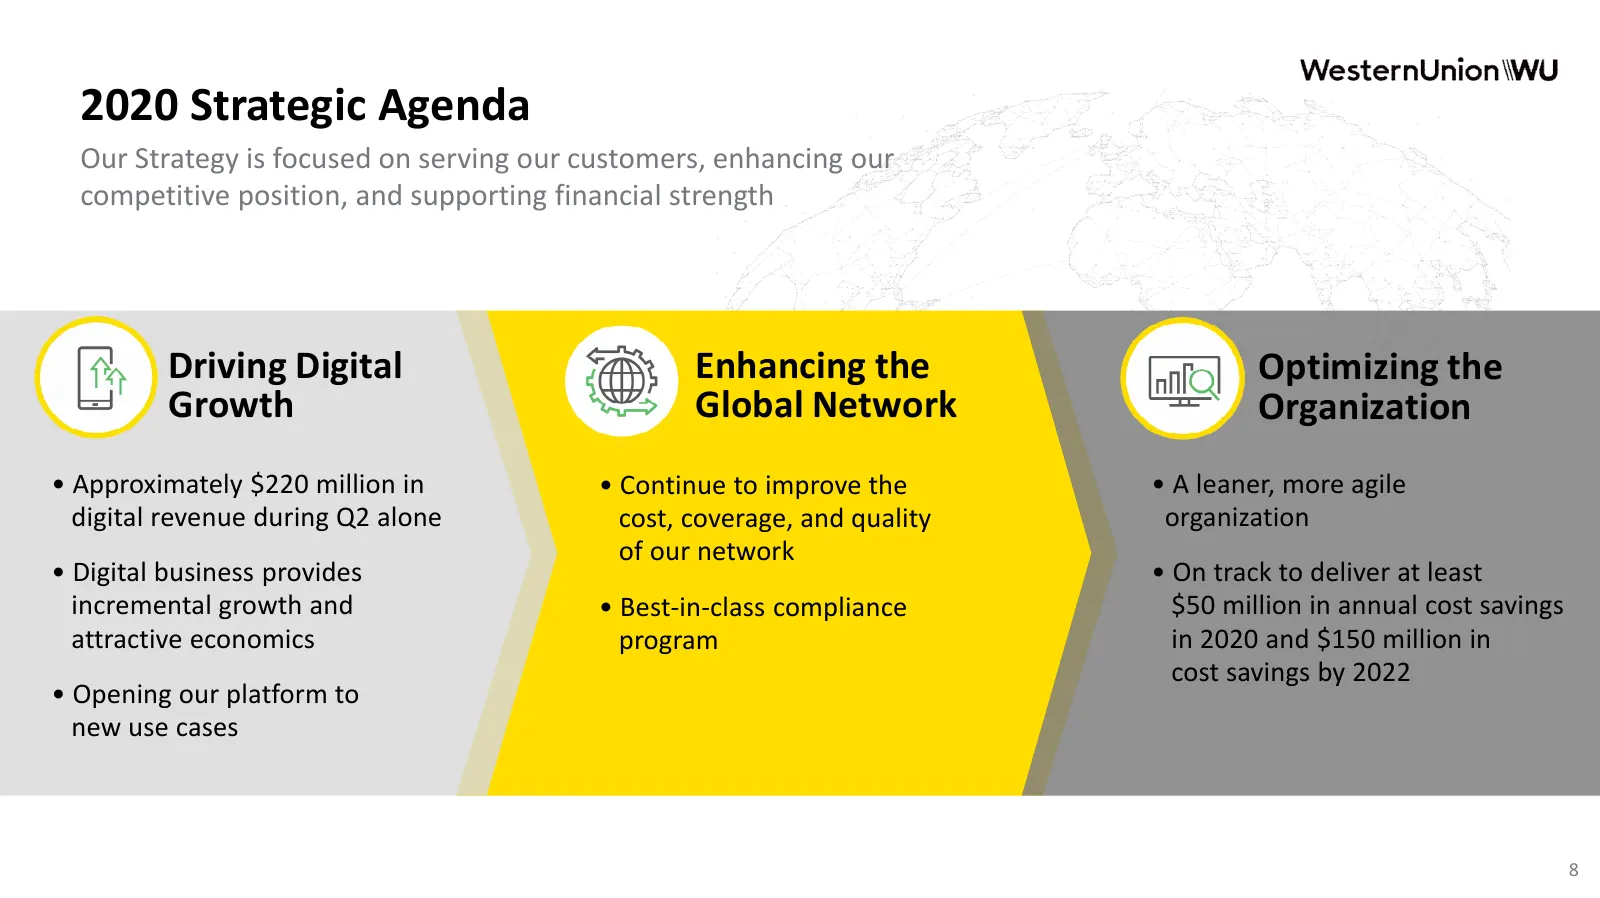
2020 Strategic Agenda Our Strategy is focused on serving our customers, enhancing our competitive position, and supporting financial strength Driving Digital Enhancing the Optimizing the Growth Global Network Organization • Approximately $220 million in • Continue to improve the • A leaner, more agi

Slide 9: Raj Agrawal, Chief Financial Officer
Raj Agrawal Chief Financial Officer 9
Slide 10: Q2 and Early Q3 Trends
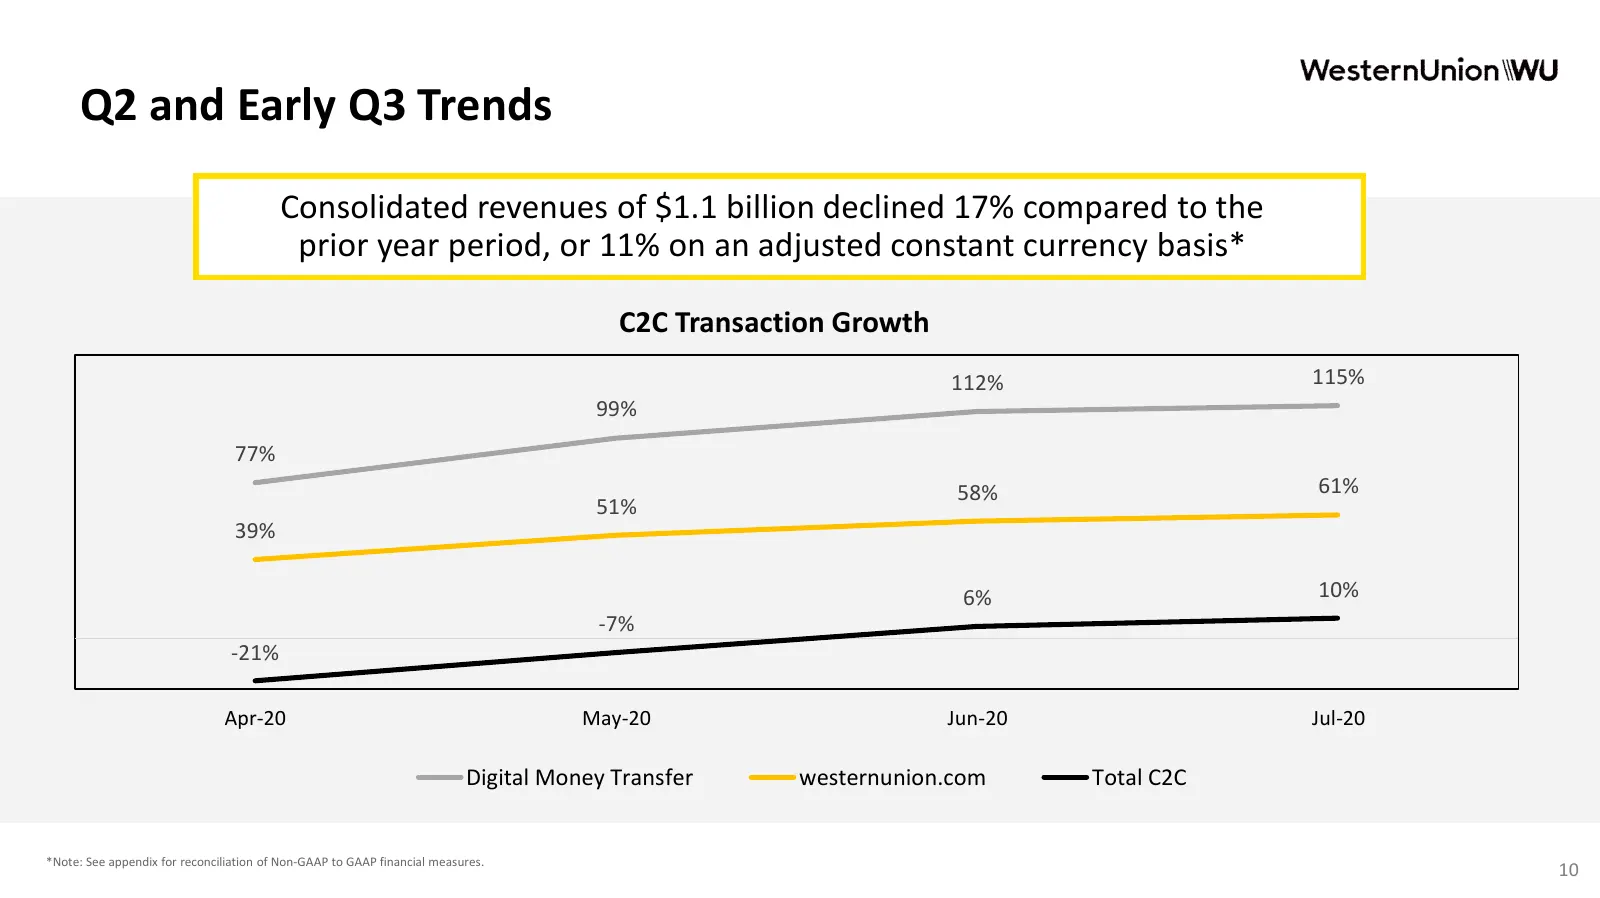
Q2 and Early Q3 Trends Consolidated revenues of $1.1 billion declined 17% compared to the prior year period, or 11% on an adjusted constant currency basis* C2C Transaction Growth 112% 115% 99% 77% 58% 61% 51% 39% 6% 10% -7% -21% Apr-20 May-20 Jun-20 Jul-20 Digital Money Transfer westernunion.com Tot
Slide 11: Consumer-to-Consumer Q2
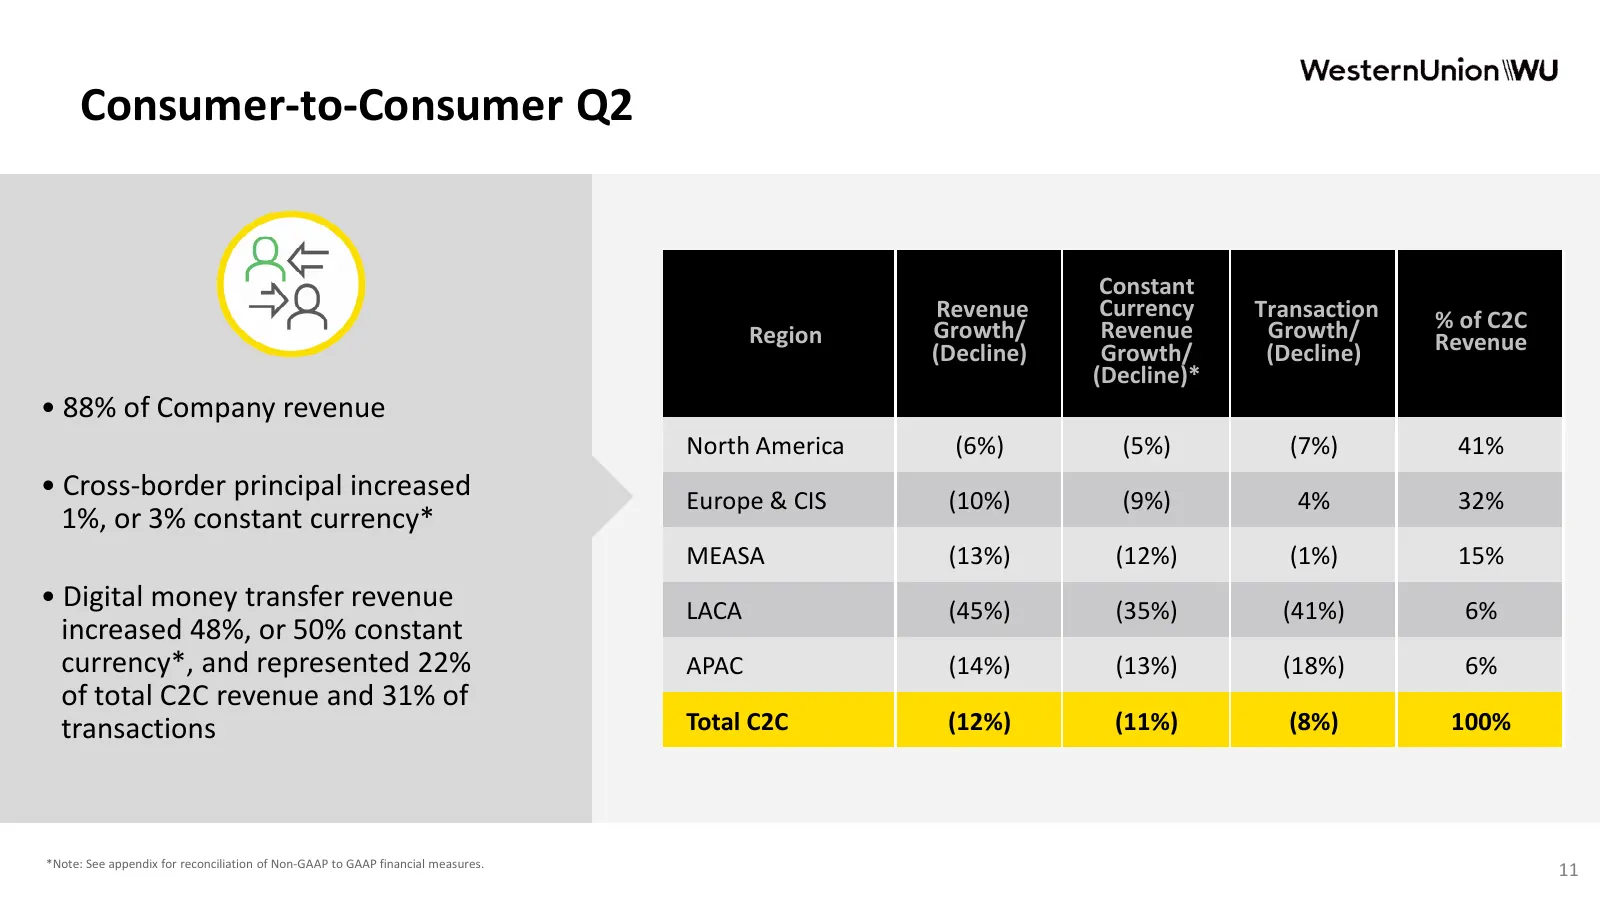
Consumer-to-Consumer Q2 Constant Revenue Currency Transaction % of C2C Region Growth/ Revenue Growth/ Revenue (Decline) Growth/ (Decline) (Decline)* • 88% of Company revenue North America (6%) (5%) (7%) 41% • Cross-border principal increased Europe & CIS (10%) (9%) 4% 32% 1%, or 3% constant currency
Slide 12: Business Solutions and Other Q2
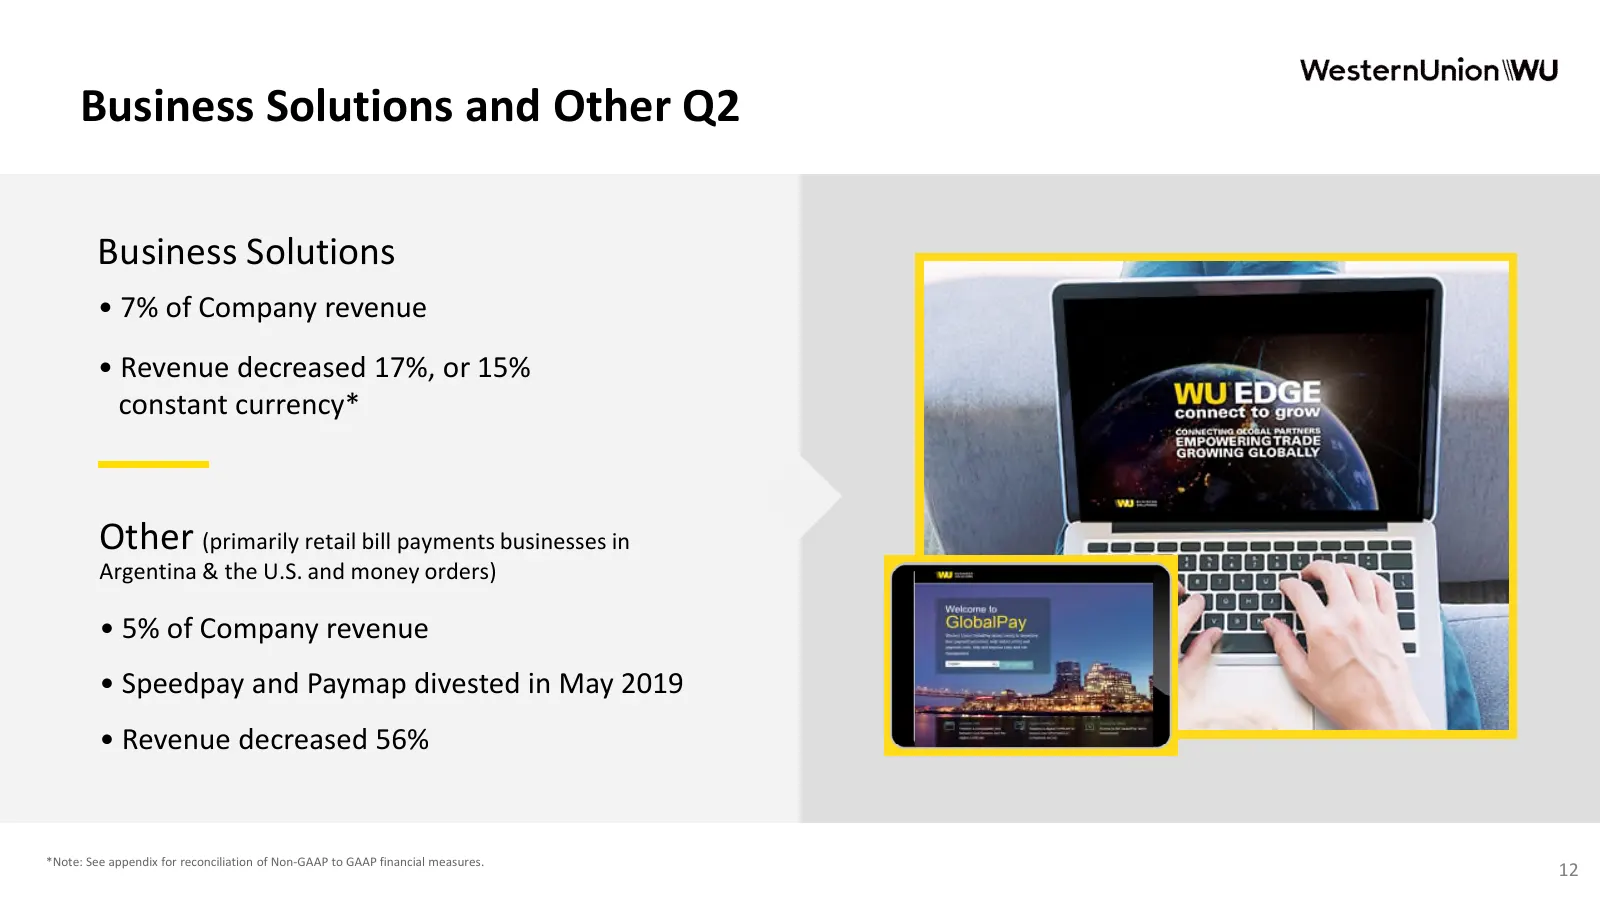
Business Solutions and Other Q2 Business Solutions • 7% of Company revenue • Revenue decreased 17%, or 15% constant currency* Other (primarily retail bill payments businesses in Argentina & the U.S. and money orders) • 5% of Company revenue • Speedpay and Paymap divested in May 2019 • Revenue decrea
Slide 13: Operating Margin Q2
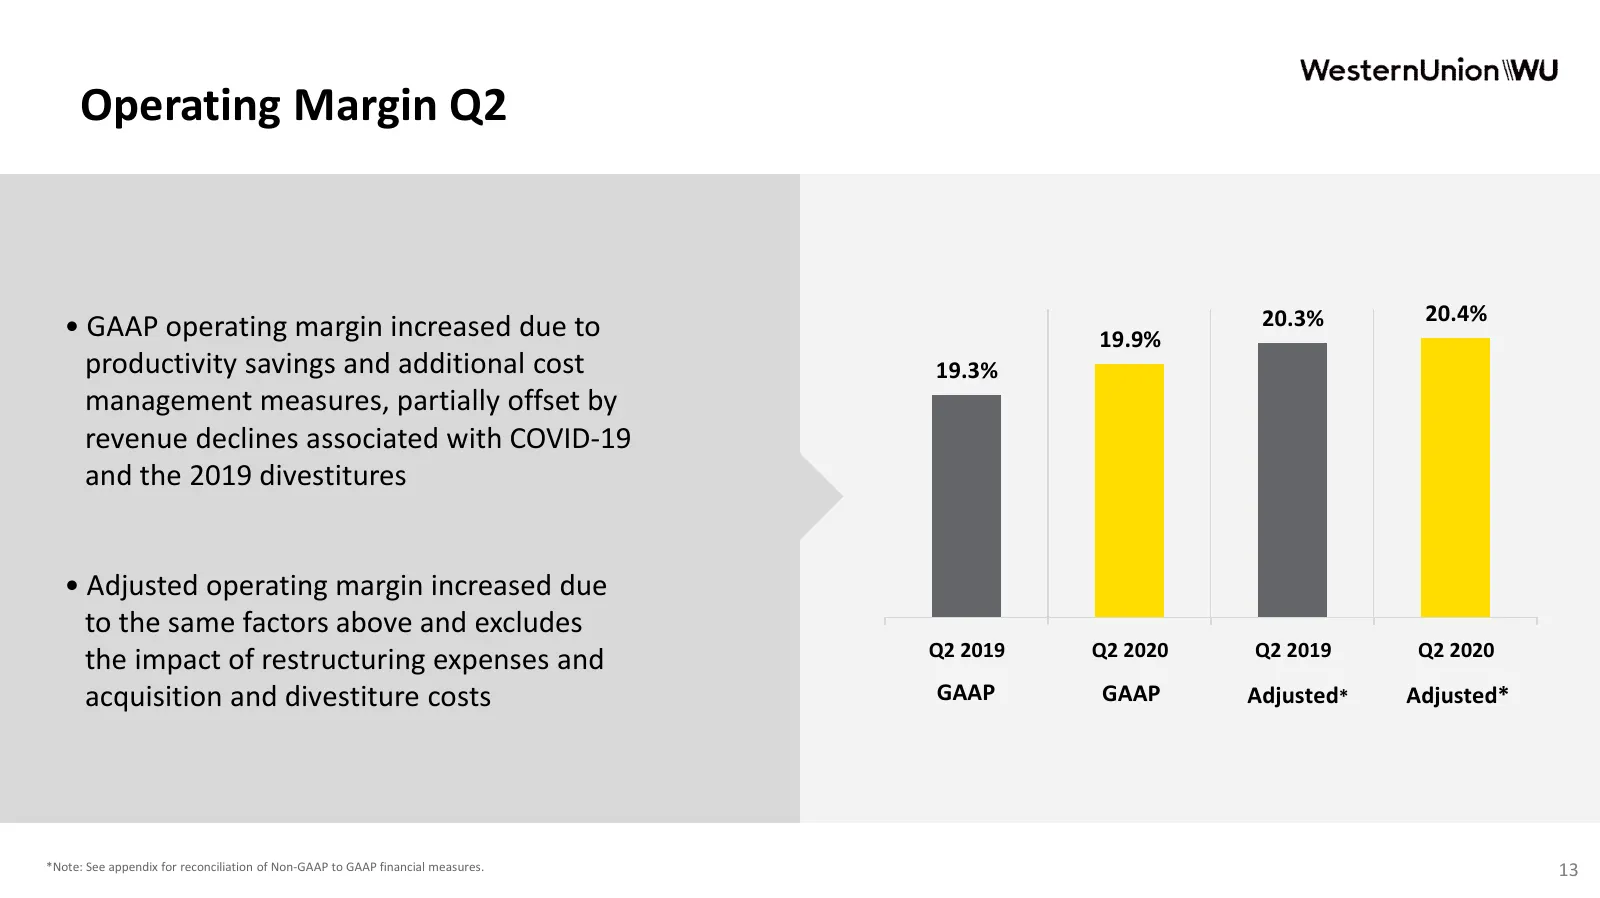
Operating Margin Q2 20.3% 20.4% • GAAP operating margin increased due to 19.9% productivity savings and additional cost 19.3% management measures, partially offset by revenue declines associated with COVID-19 and the 2019 divestitures • Adjusted operating margin increased due to the same factors abo
Slide 14: Financial Highlights
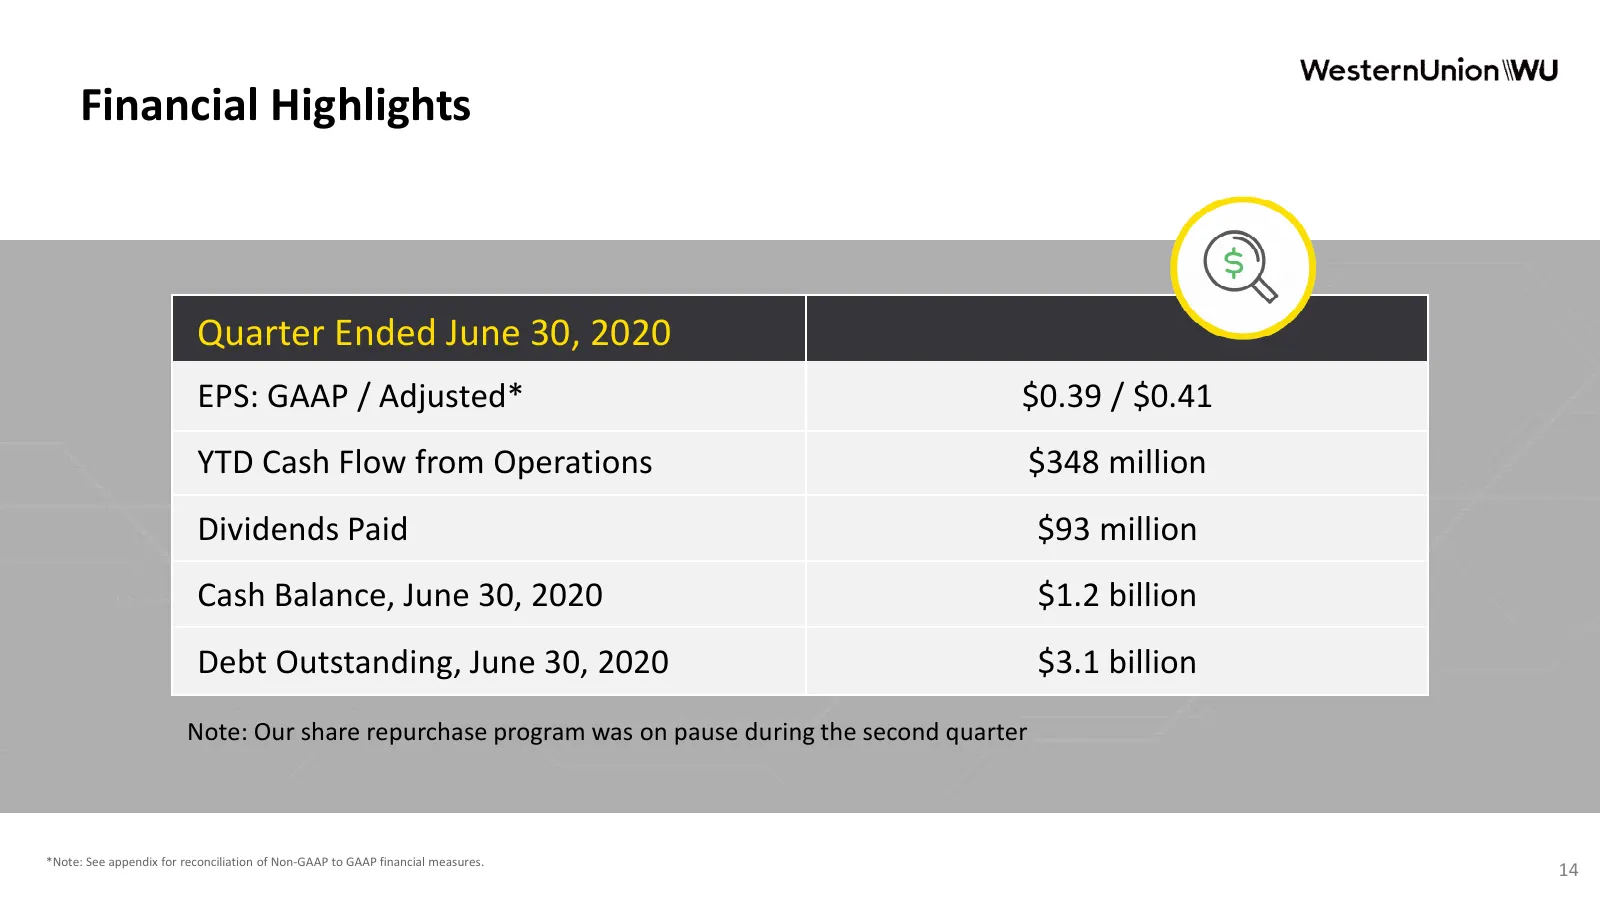
Financial Highlights Quarter Ended June 30, 2020 EPS: GAAP / Adjusted* $0.39 / $0.41 YTD Cash Flow from Operations $348 million Dividends Paid $93 million Cash Balance, June 30, 2020 $1.2 billion Debt Outstanding, June 30, 2020 $3.1 billion Note: Our share repurchase program was on pause during the
Slide 15: 2020 Business Update
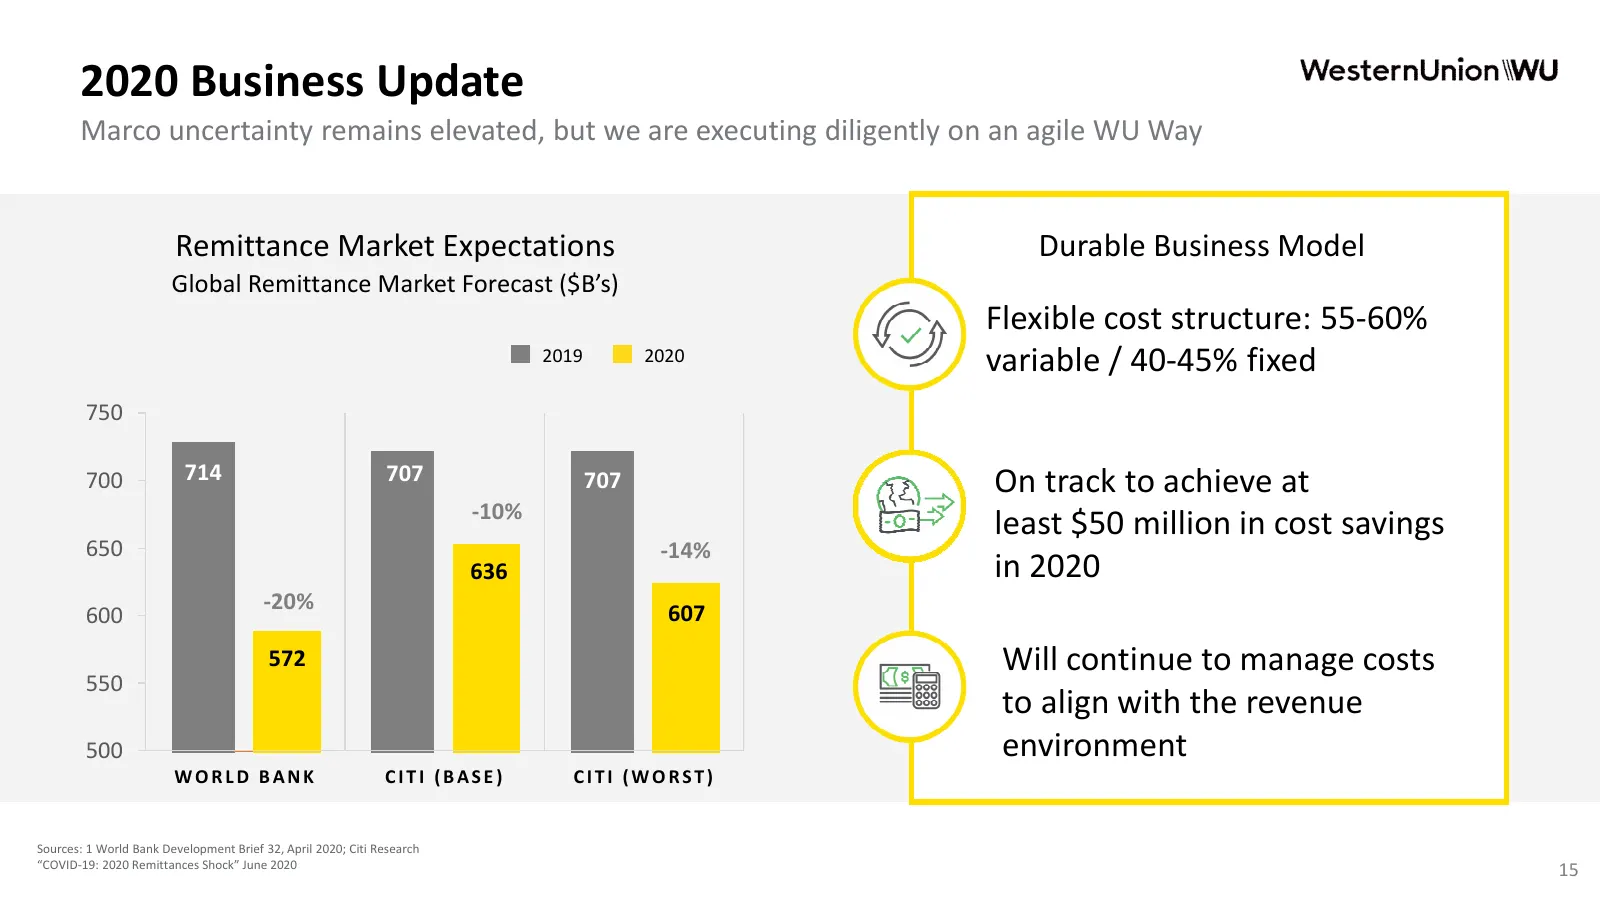
2020 Business Update Marco uncertainty remains elevated, but we are executing diligently on an agile WU Way Remittance Market Expectations Durable Business Model Global Remittance Market Forecast ($B’s) Flexible cost structure: 55-60% 2019 2020 variable / 40-45% fixed 750 700 714 707 707 On track to

Slide 16: Questions and Answers
WesternUnion\WU Questions and Answers
Slide 17: Appendix
Appendix 2nd Quarter 2020 Earnings Webcast and Conference Call 17
Slide 18: Key Statistics and Reconciliation of Non-GAAP Measures
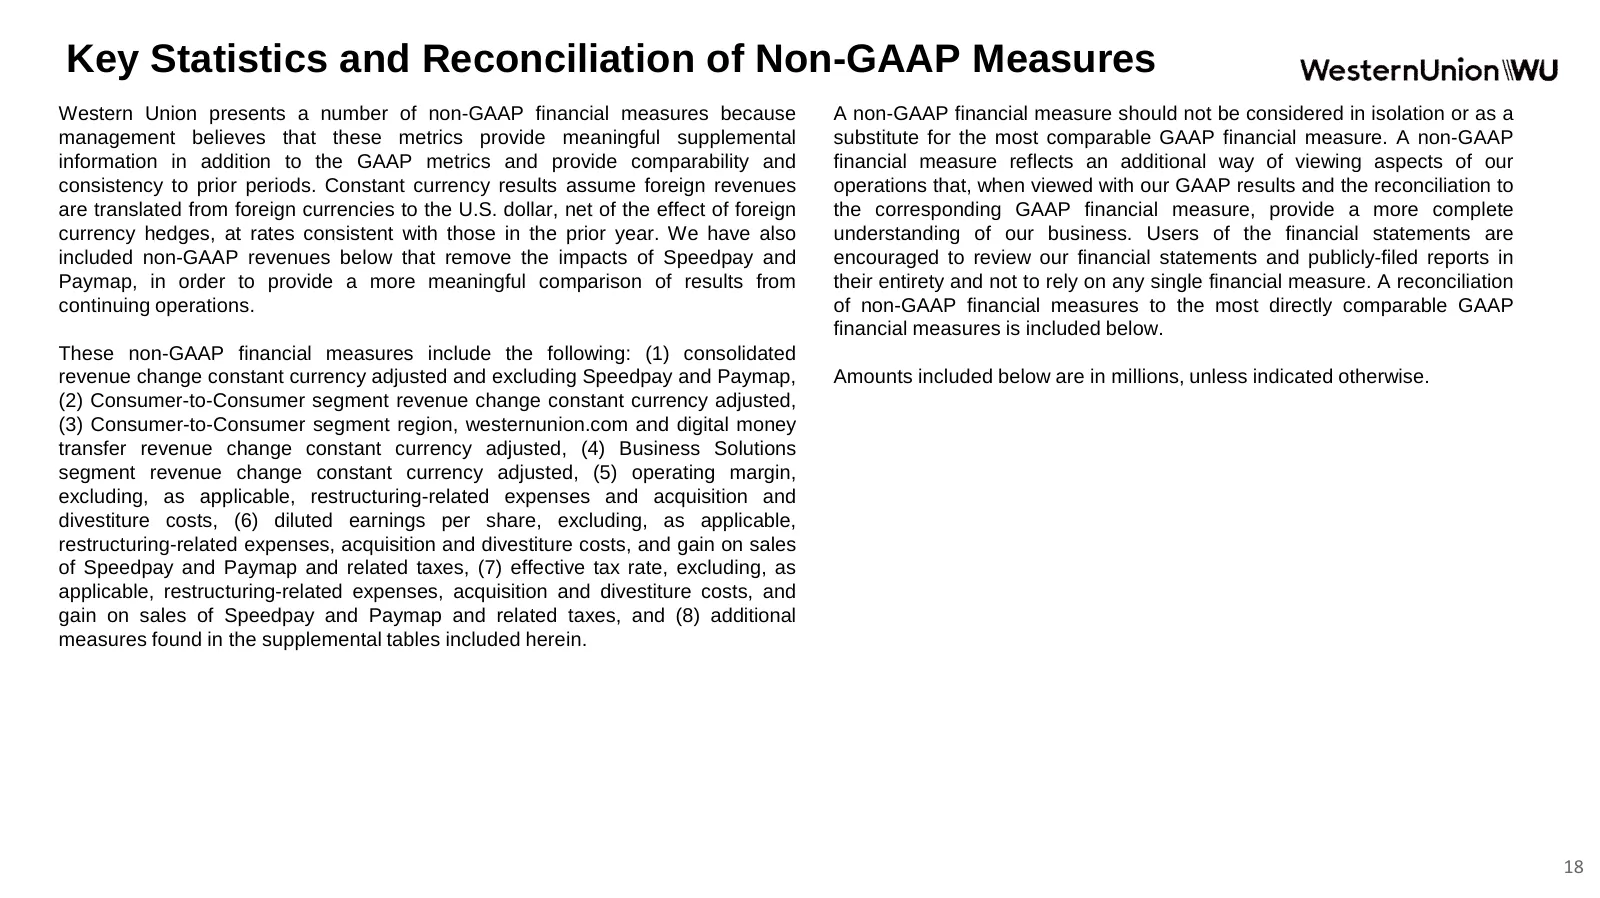
Key Statistics and Reconciliation of Non-GAAP Measures Western Union presents a number of non-GAAP financial measures because A non-GAAP financial measure should not be considered in isolation or as a management believes that these metrics provide meaningful supplemental substitute for the most comp
Slide 19: Key Statistics and Reconciliation of Non-GAAP Measures
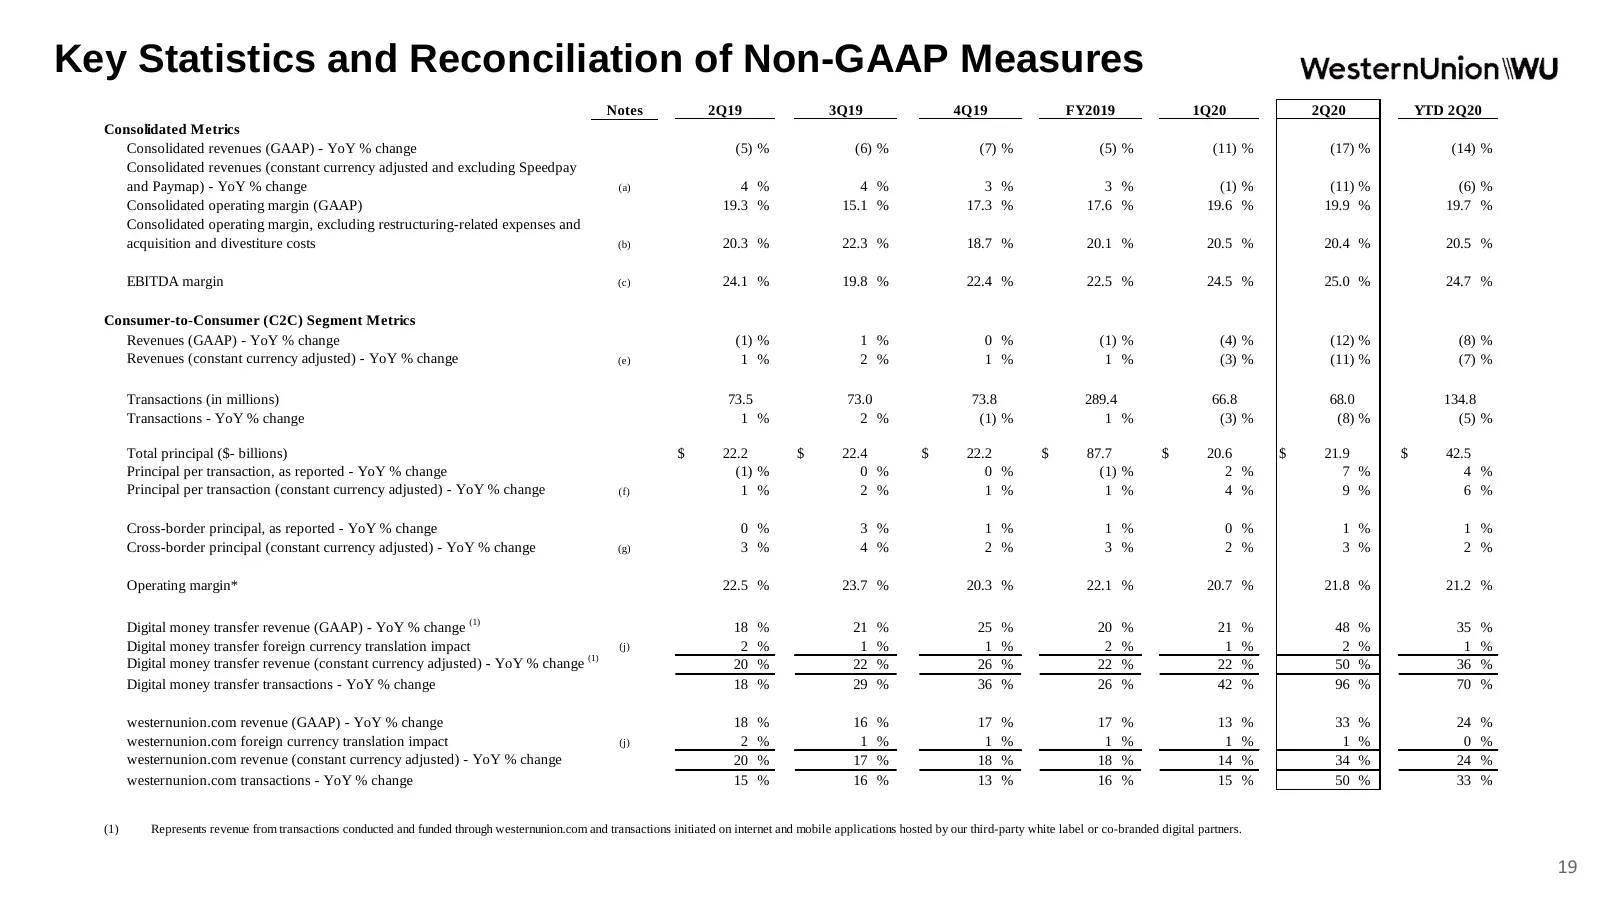
Key Statistics and Reconciliation of Non-GAAP Measures Notes 2Q19 3Q19 4Q19 FY2019 1Q20 2Q20 YTD 2Q20 Consolidated Metrics Consolidated revenues (GAAP) - YoY % change (5) % (6) % (7) % (5) % (11) % (17) % (14) % Consolidated revenues (constant currency adjusted and excluding Speedpay and Paymap) - Y
Slide 20: Key Statistics and Reconciliation of Non-GAAP Measures
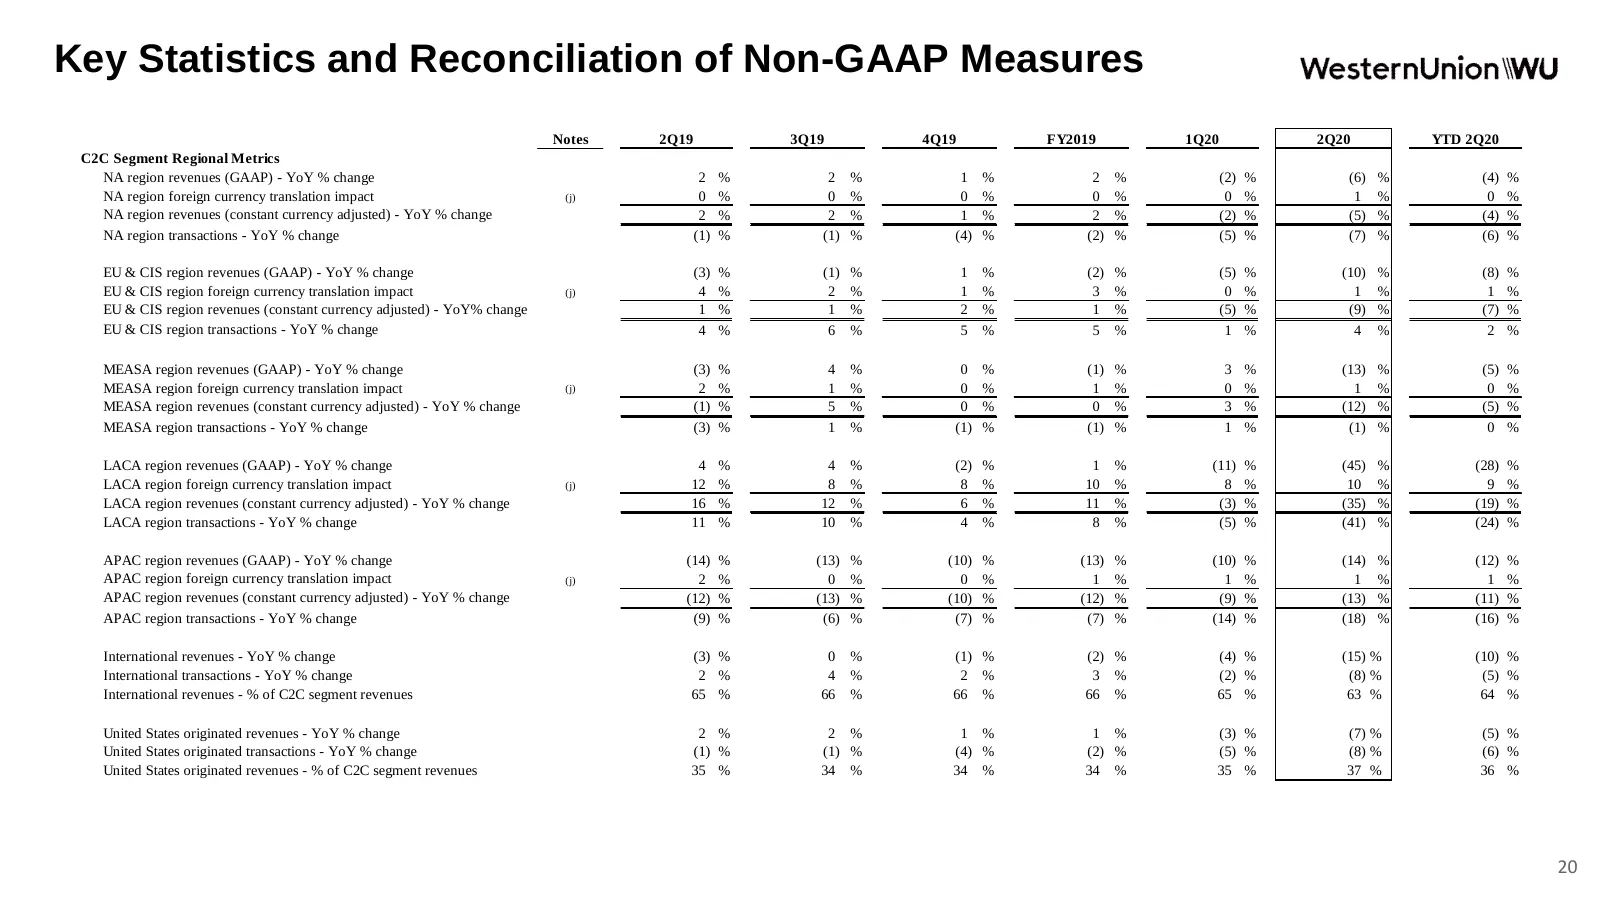
Key Statistics and Reconciliation of Non-GAAP Measures Notes 2Q19 3Q19 4Q19 FY2019 1Q20 2Q20 YTD 2Q20 C2C Segment Regional Metrics NA region revenues (GAAP) - YoY % change 2 % 2 % 1 % 2 % (2) % (6) % (4) % NA region foreign currency translation impact (j) 0 % 0 % 0 % 0 % 0 % 1 % 0 % NA region revenu
Slide 21: Key Statistics and Reconciliation of Non-GAAP Measures
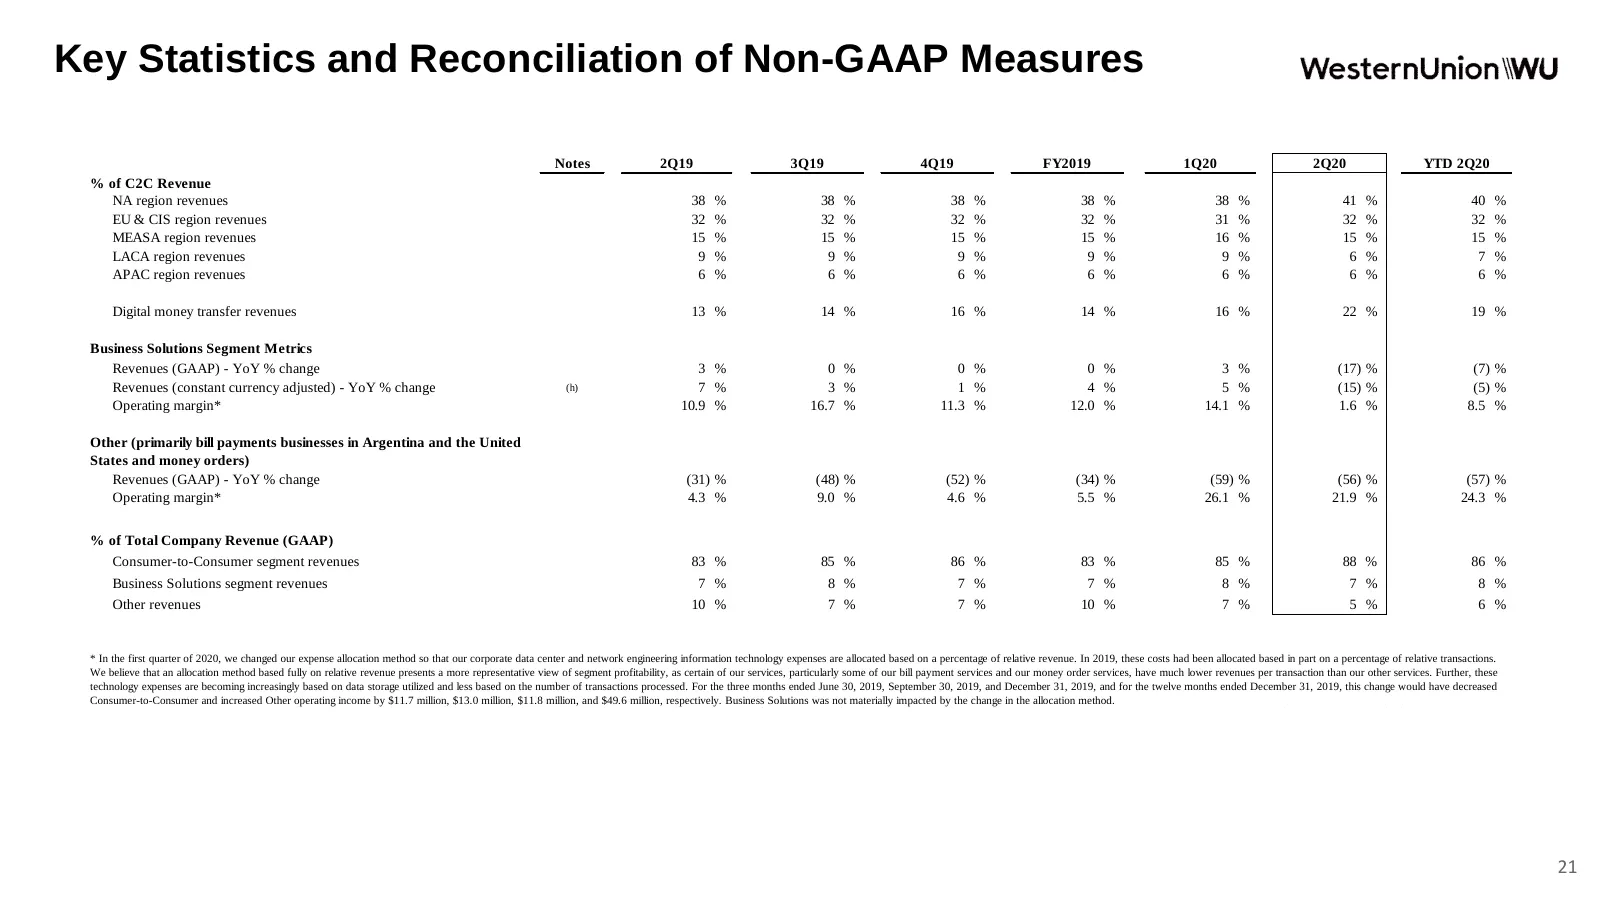
Key Statistics and Reconciliation of Non-GAAP Measures Notes 2Q19 3Q19 4Q19 FY2019 1Q20 2Q20 YTD 2Q20 % of C2C Revenue NA region revenues 38 % 38 % 38 % 38 % 38 % 41 % 40 % EU & CIS region revenues 32 % 32 % 32 % 32 % 31 % 32 % 32 % MEASA region revenues 15 % 15 % 15 % 15 % 16 % 15 % 15 % LACA regio
Slide 22: Key Statistics and Reconciliation of Non-GAAP Measures
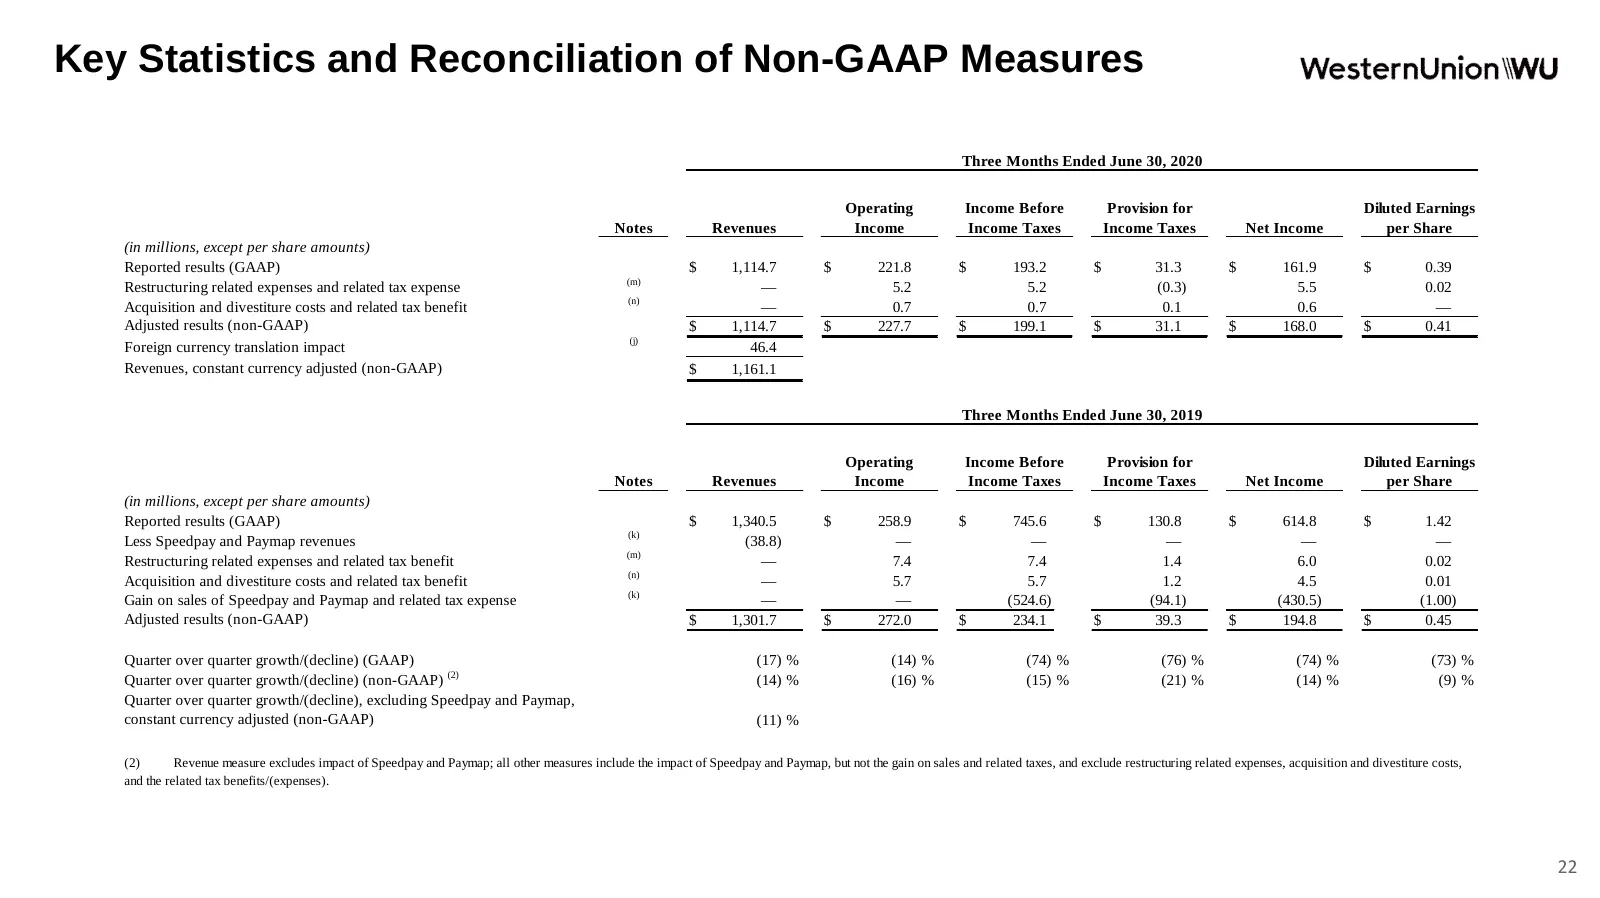
Key Statistics and Reconciliation of Non-GAAP Measures Three Months Ended June 30, 2020 Operating Income Before Provision for Diluted Earnings Notes Revenues Income Income Taxes Income Taxes Net Income per Share (in millions, except per share amounts) Reported results (GAAP) $ 1,114.7 $ 221.8 $ 193.
Slide 23: Key Statistics and Reconciliation of Non-GAAP Measures
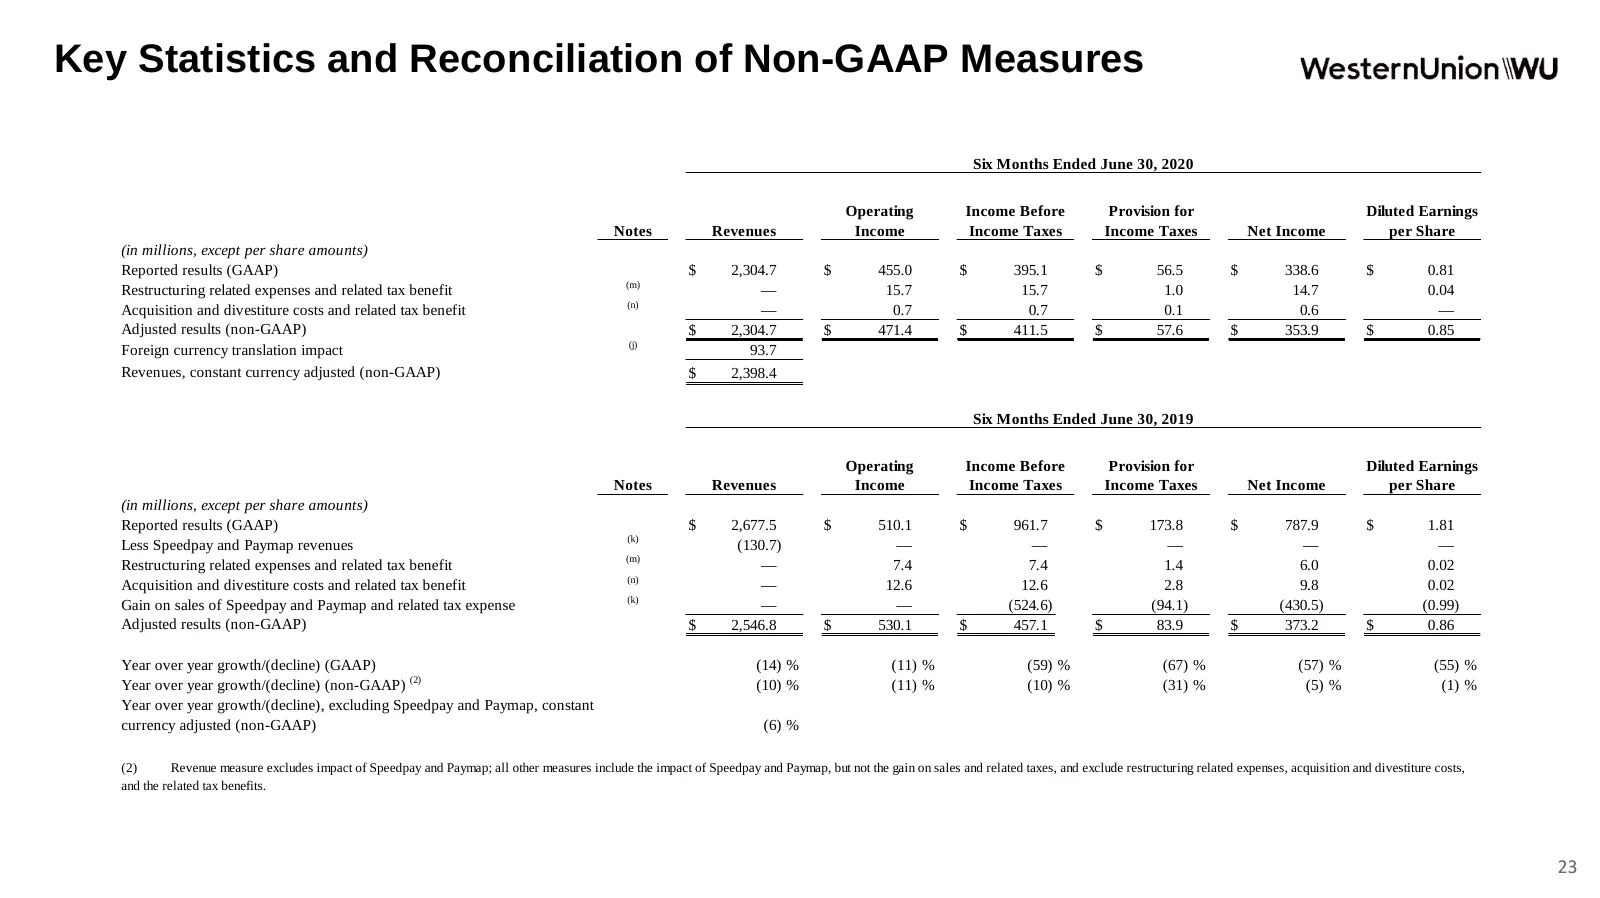
Key Statistics and Reconciliation of Non-GAAP Measures Six Months Ended June 30, 2020 Operating Income Before Provision for Diluted Earnings Notes Revenues Income Income Taxes Income Taxes Net Income per Share (in millions, except per share amounts) Reported results (GAAP) $ 2,304.7 $ 455.0 $ 395.1
Slide 24: Key Statistics and Reconciliation of Non-GAAP Measures
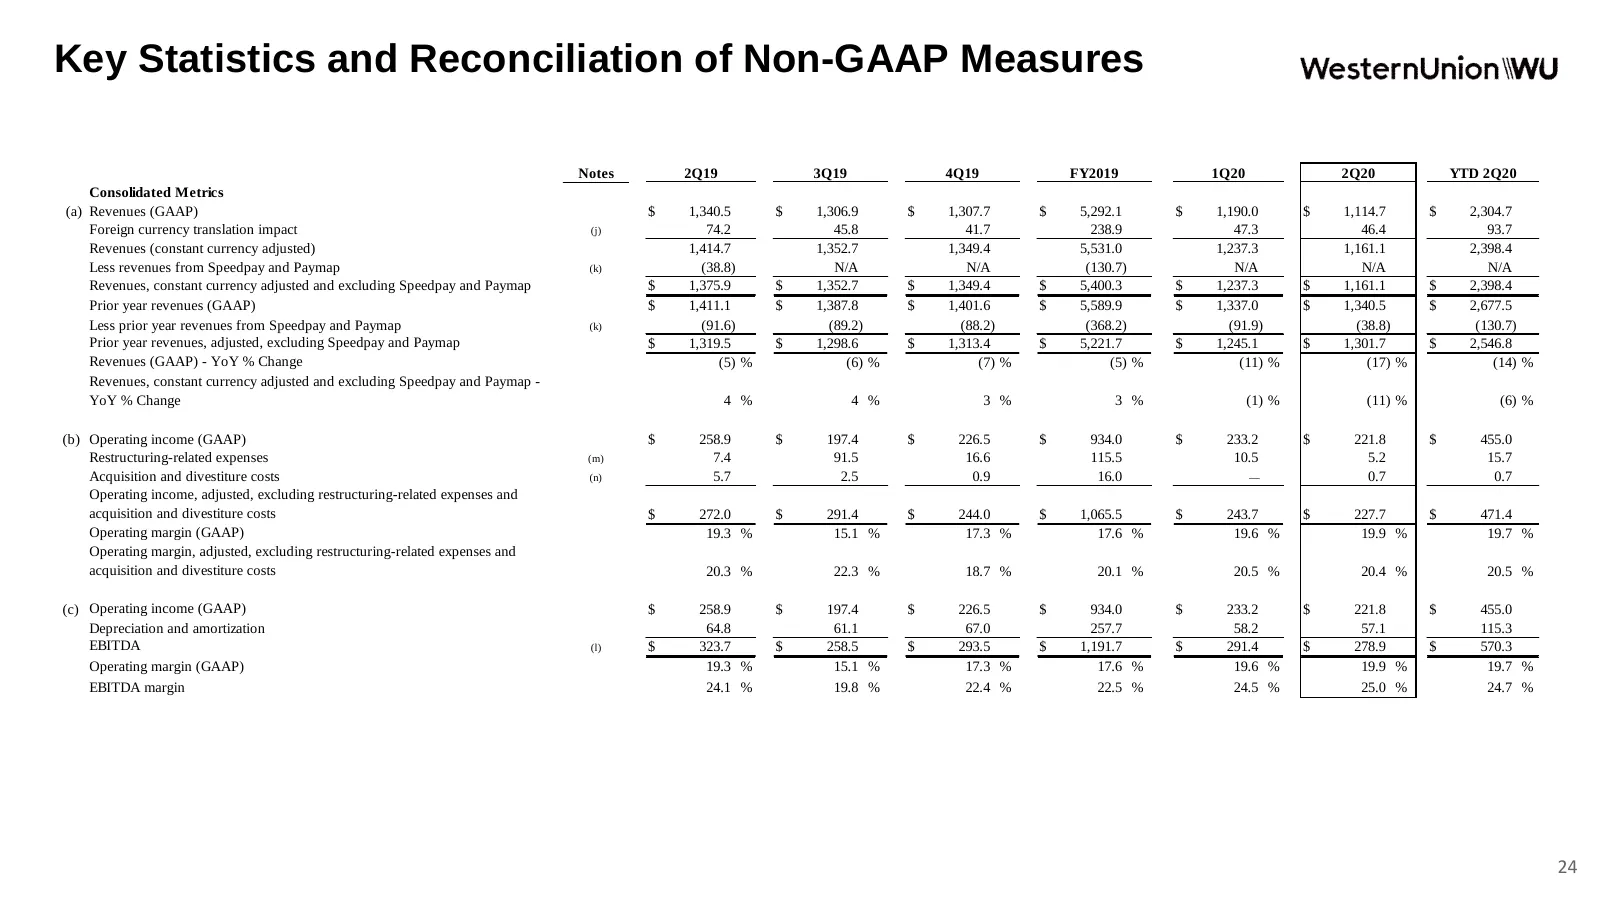
Key Statistics and Reconciliation of Non-GAAP Measures Notes 2Q19 3Q19 4Q19 FY2019 1Q20 2Q20 YTD 2Q20 Consolidated Metrics (a) Revenues (GAAP) $ 1,340.5 $ 1,306.9 $ 1,307.7 $ 5,292.1 $ 1,190.0 $ 1,114.7 $ 2,304.7 Foreign currency translation impact (j) 74.2 45.8 41.7 238.9 47.3 46.4 93.7 Revenues (c
Slide 25: Key Statistics and Reconciliation of Non-GAAP Measures
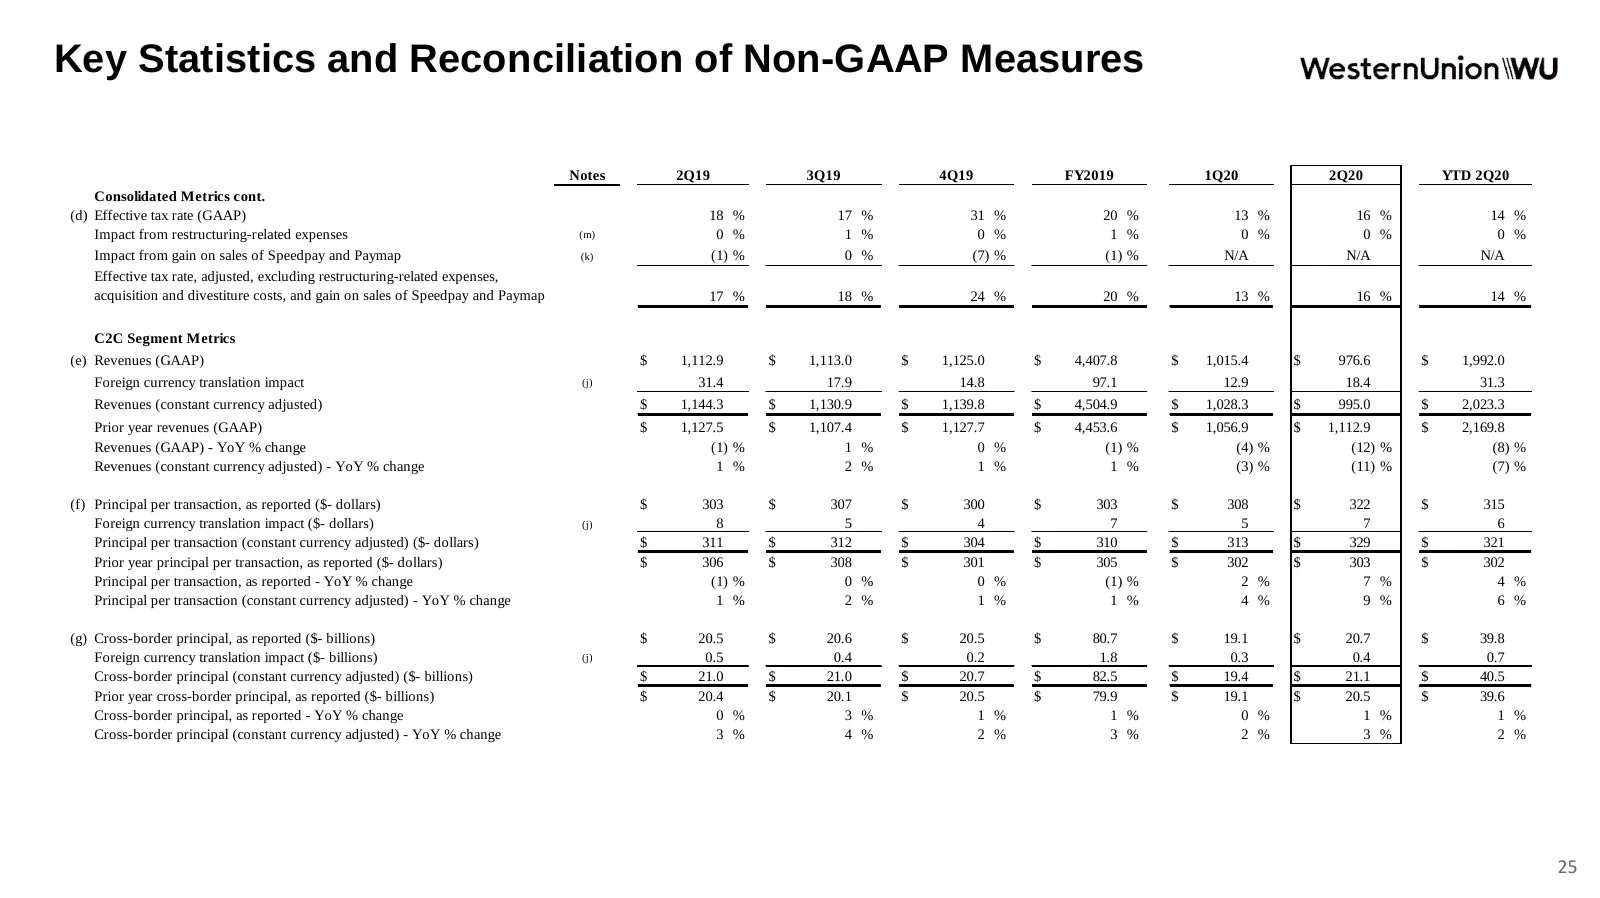
Key Statistics and Reconciliation of Non-GAAP Measures Notes 2Q19 3Q19 4Q19 FY2019 1Q20 2Q20 YTD 2Q20 Consolidated Metrics cont. (d) Effective tax rate (GAAP) 18 % 17 % 31 % 20 % 13 % 16 % 14 % Impact from restructuring-related expenses (m) 0 % 1 % 0 % 1 % 0 % 0 % 0 % Impact from gain on sales of Sp
Slide 26: Key Statistics and Reconciliation of Non-GAAP Measures
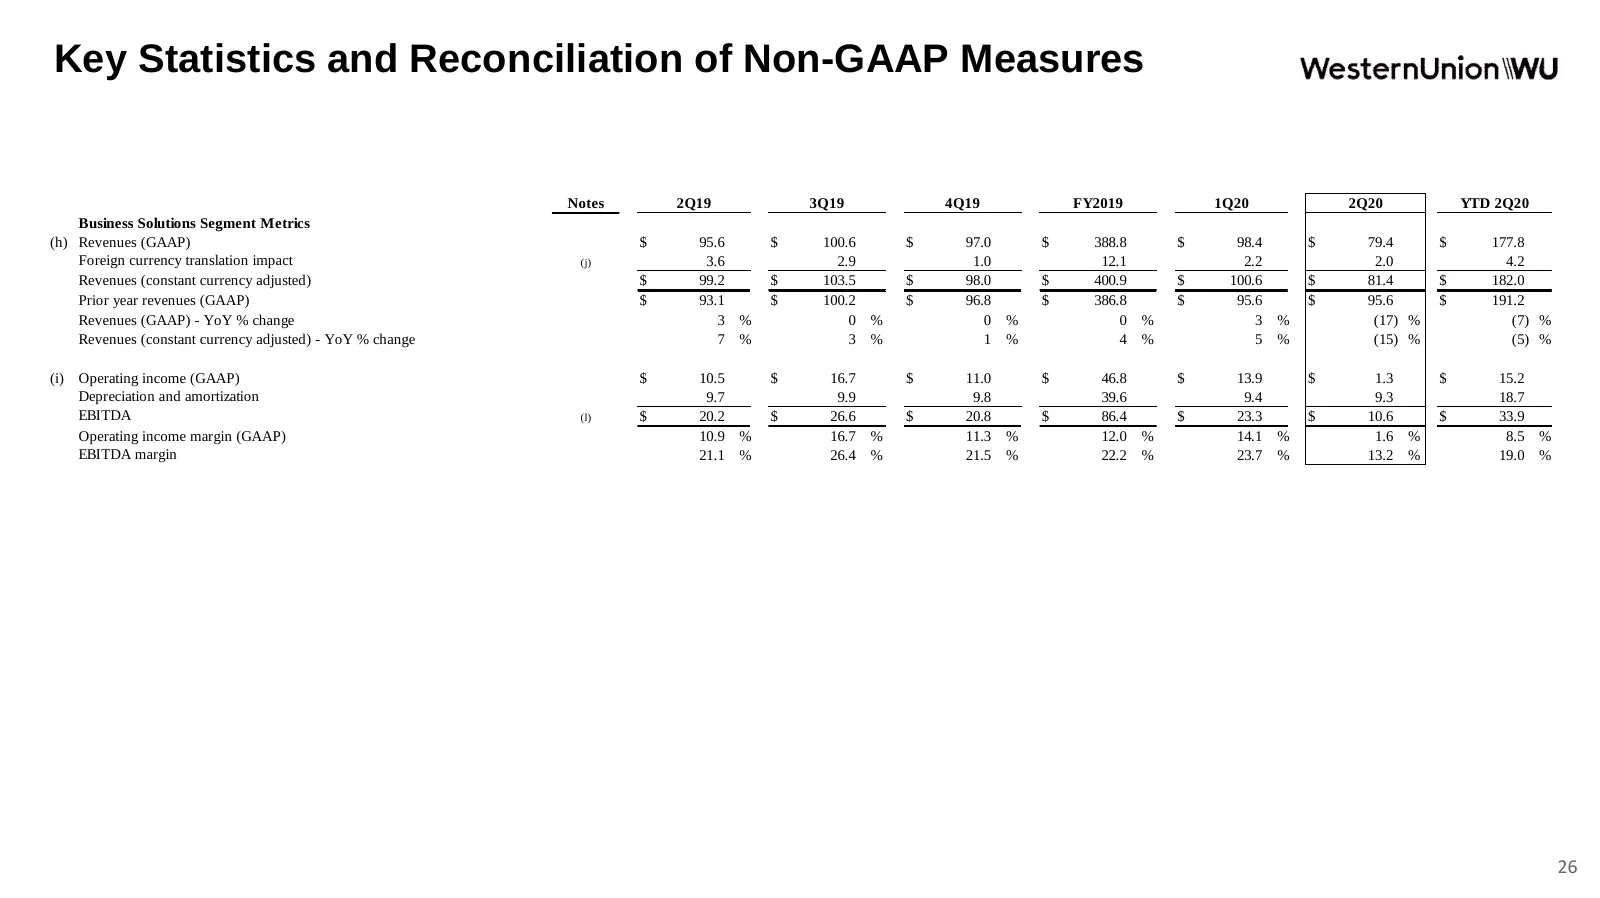
Key Statistics and Reconciliation of Non-GAAP Measures Notes 2Q19 3Q19 4Q19 FY2019 1Q20 2Q20 YTD 2Q20 Business Solutions Segment Metrics (h) Revenues (GAAP) $ 95.6 $ 100.6 $ 97.0 $ 388.8 $ 98.4 $ 79.4 $ 177.8 Foreign currency translation impact (j) 3.6 2.9 1.0 12.1 2.2 2.0 4.2 Revenues (constant cur
Slide 27: Key Statistics and Reconciliation of Non-GAAP Measures
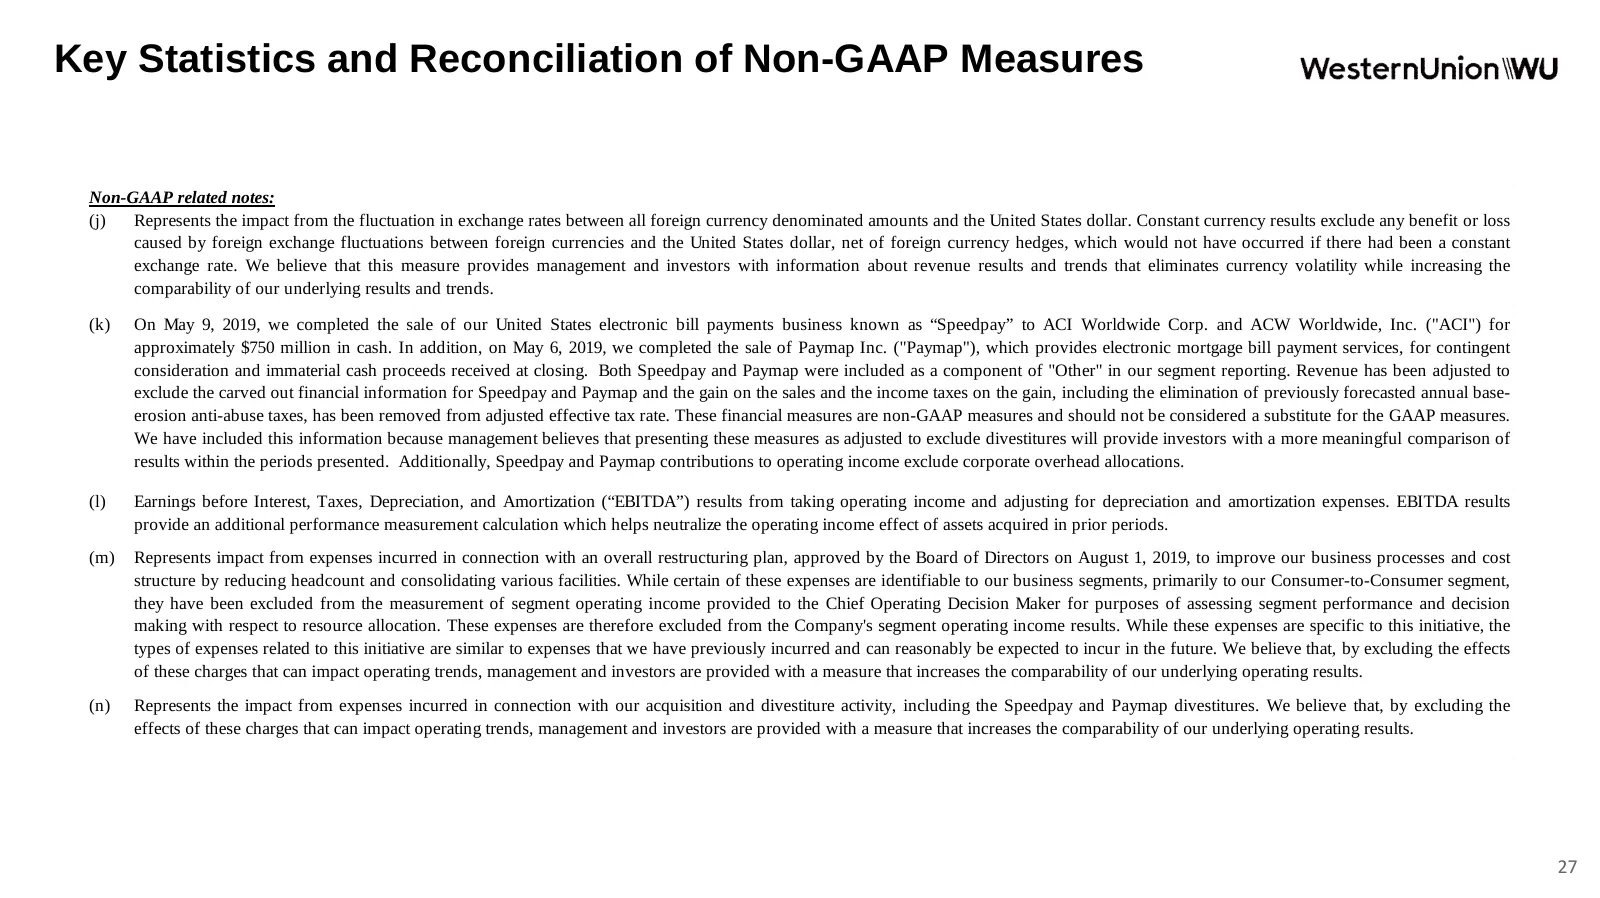
Key Statistics and Reconciliation of Non-GAAP Measures Non-GAAP related notes: (j) Represents the impact from the fluctuation in exchange rates between all foreign currency denominated amounts and the United States dollar. Constant currency results exclude any benefit or loss caused by foreign excha
Source: company website
More decks from Western Union Company (the)
 Q3 2026 Earnings Presentation33 slides · Nov 4, 2026
 Shareholder Meeting (April 2026)20 slides · Apr 28, 2026
 Q1 2026 Earnings Presentation38 slides · Apr 24, 2026
 Q4 2025 Earnings Presentation41 slides · Feb 20, 2026
 Investor Day (November 2025)135 slides · Nov 6, 2025
 Investor Day (November 2025)134 slides · Nov 6, 2025