Furmanite — Q2 2013 Earnings Presentation
16 slides from Furmanite's earnings presentation, Aug 2, 2013
Slide 1: Furmanite Corporation Quarter and Six Months Ended June 30, 2013
Exhibit 99.2 Furmanite Corporation QUARTER AND SIX MONTHS ENDED JUNE 30, 2013 Charles R. Cox, Chairman & CEO Joseph E. Milliron, President & COO Robert S. Muff, Principal Financial Officer
Slide 2: Safe Harbor Statement
Safe Harbor Statement Certain of the Company’s statements in this presentation are not purely historical, and as such are “forward-looking statements” within the meaning of the Private Securities Litigation Reform Act of 1995. These include statements regarding management’s plans, beliefs, expectati
Slide 3: Furmanite Corporation
Furmanite Corporation QUARTER AND SIX MONTHS ENDED JUNE 30, 2013 Charles R. Cox, Chairman & CEO 3
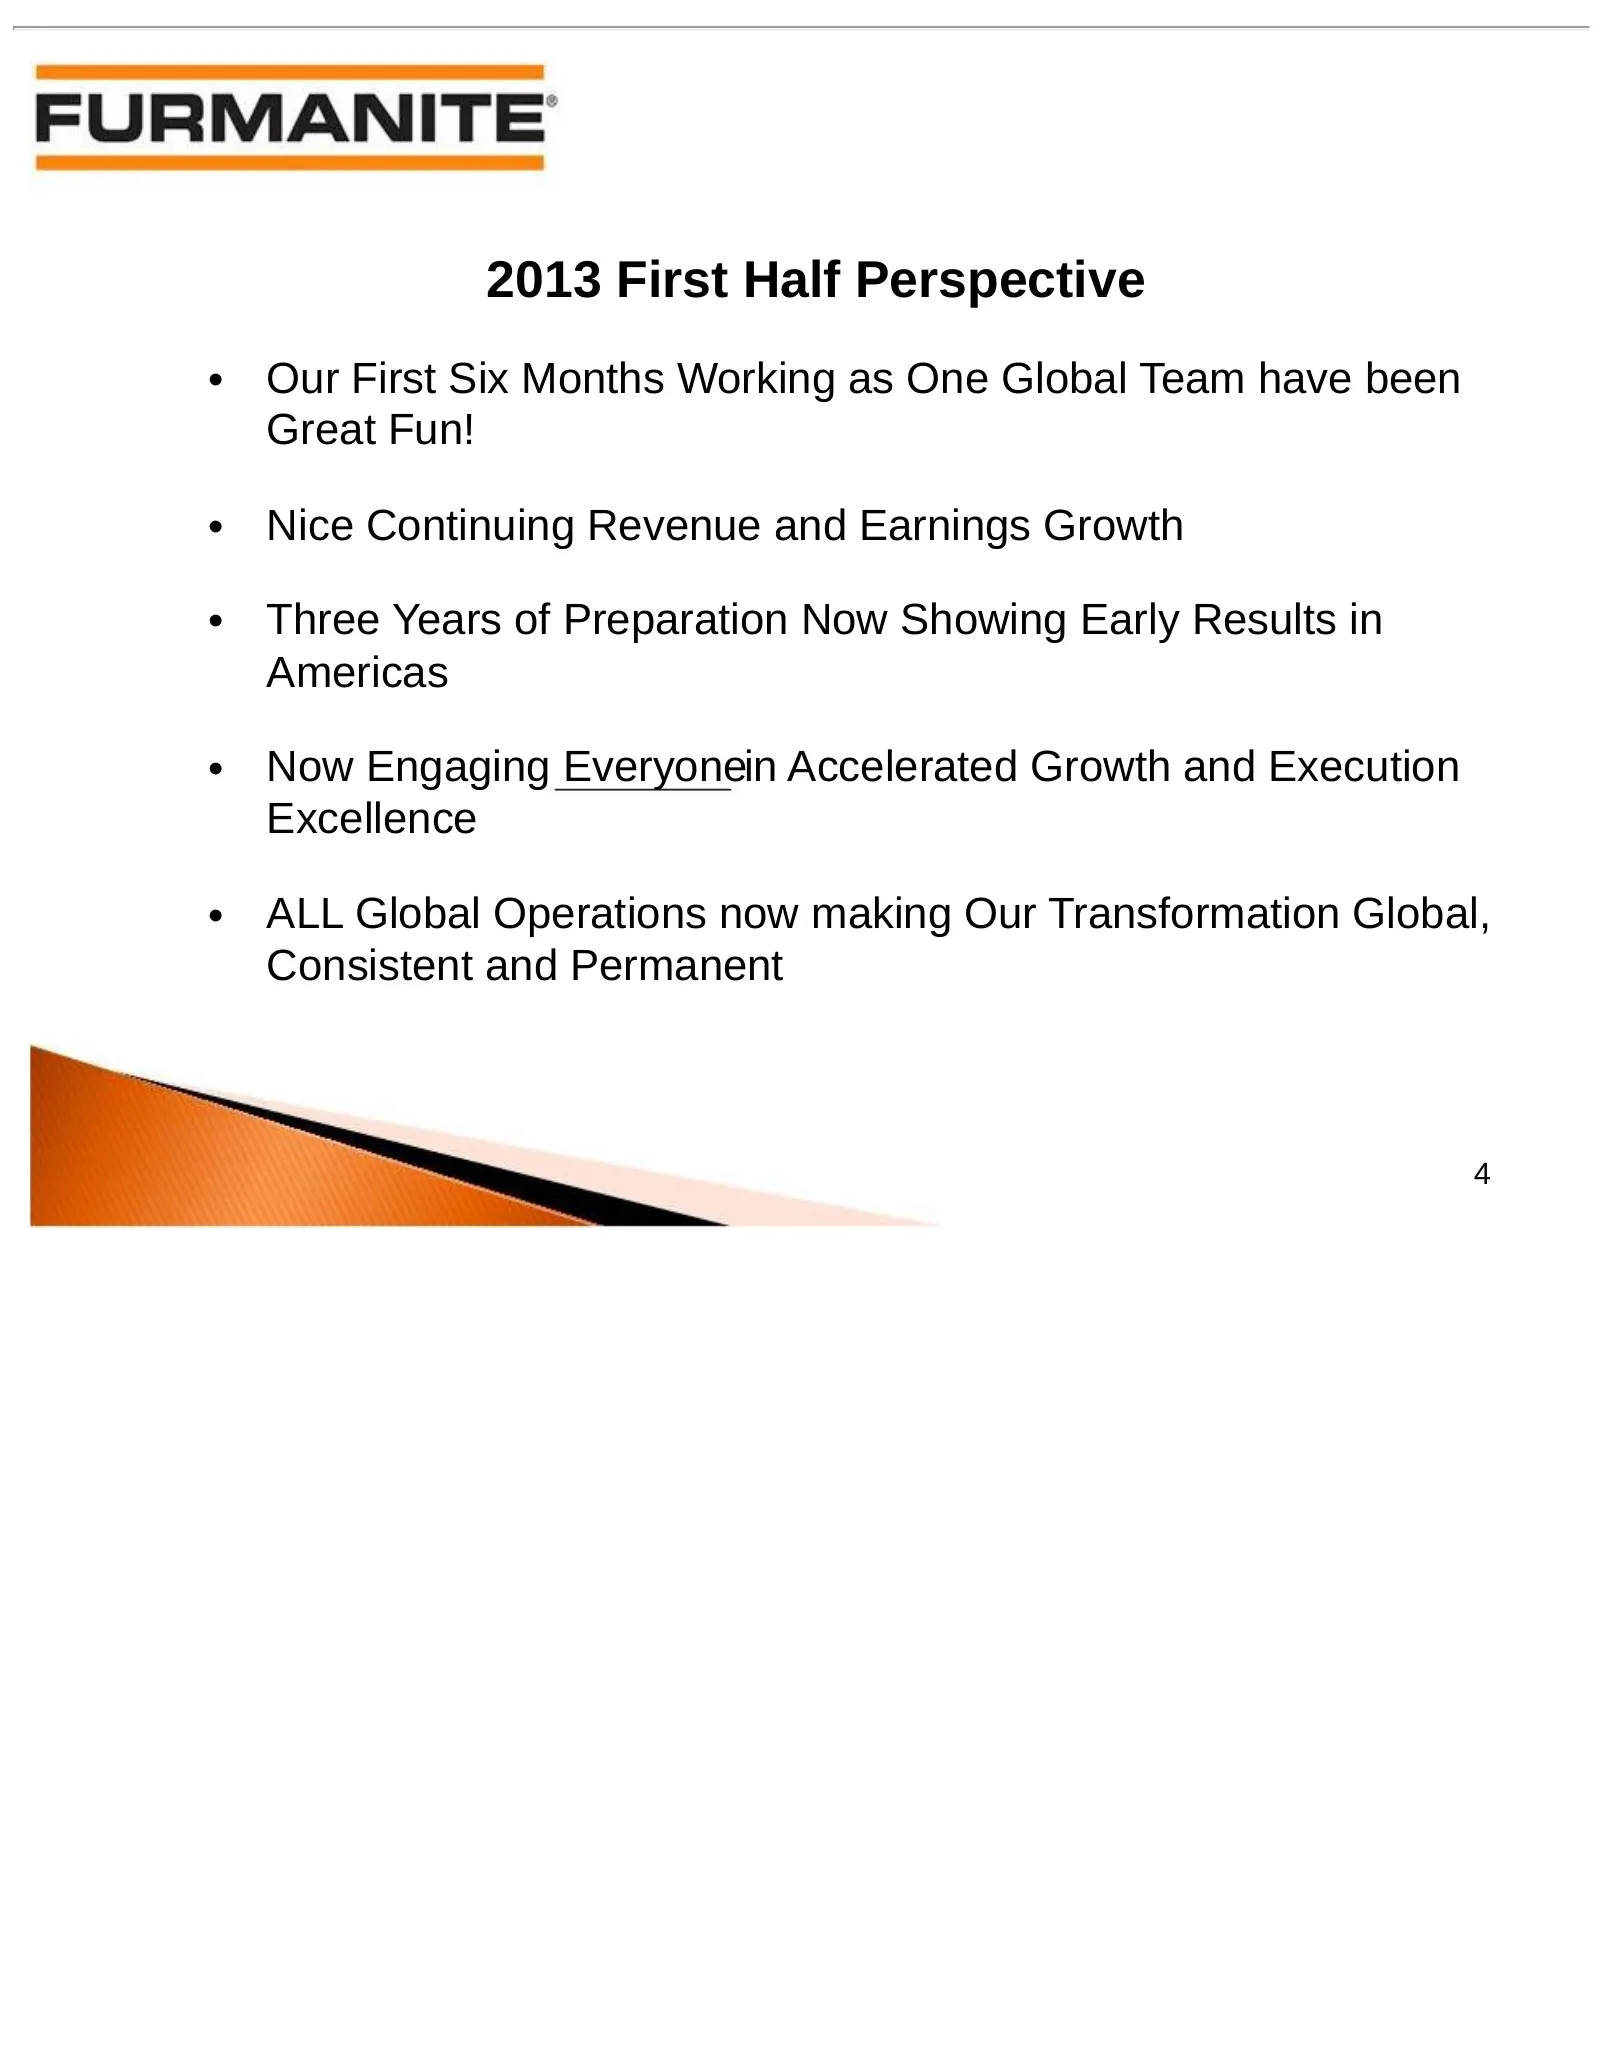
Slide 4: 2013 First Half Perspective
2013 First Half Perspective • Our First Six Months Working as One Global Team have been Great Fun! • Nice Continuing Revenue and Earnings Growth • Three Years of Preparation Now Showing Early Results in Americas • Now Engaging Everyonein Accelerated Growth and Execution Excellence • ALL Global Opera
Slide 5: 2013 – 2015 Strategic Direction
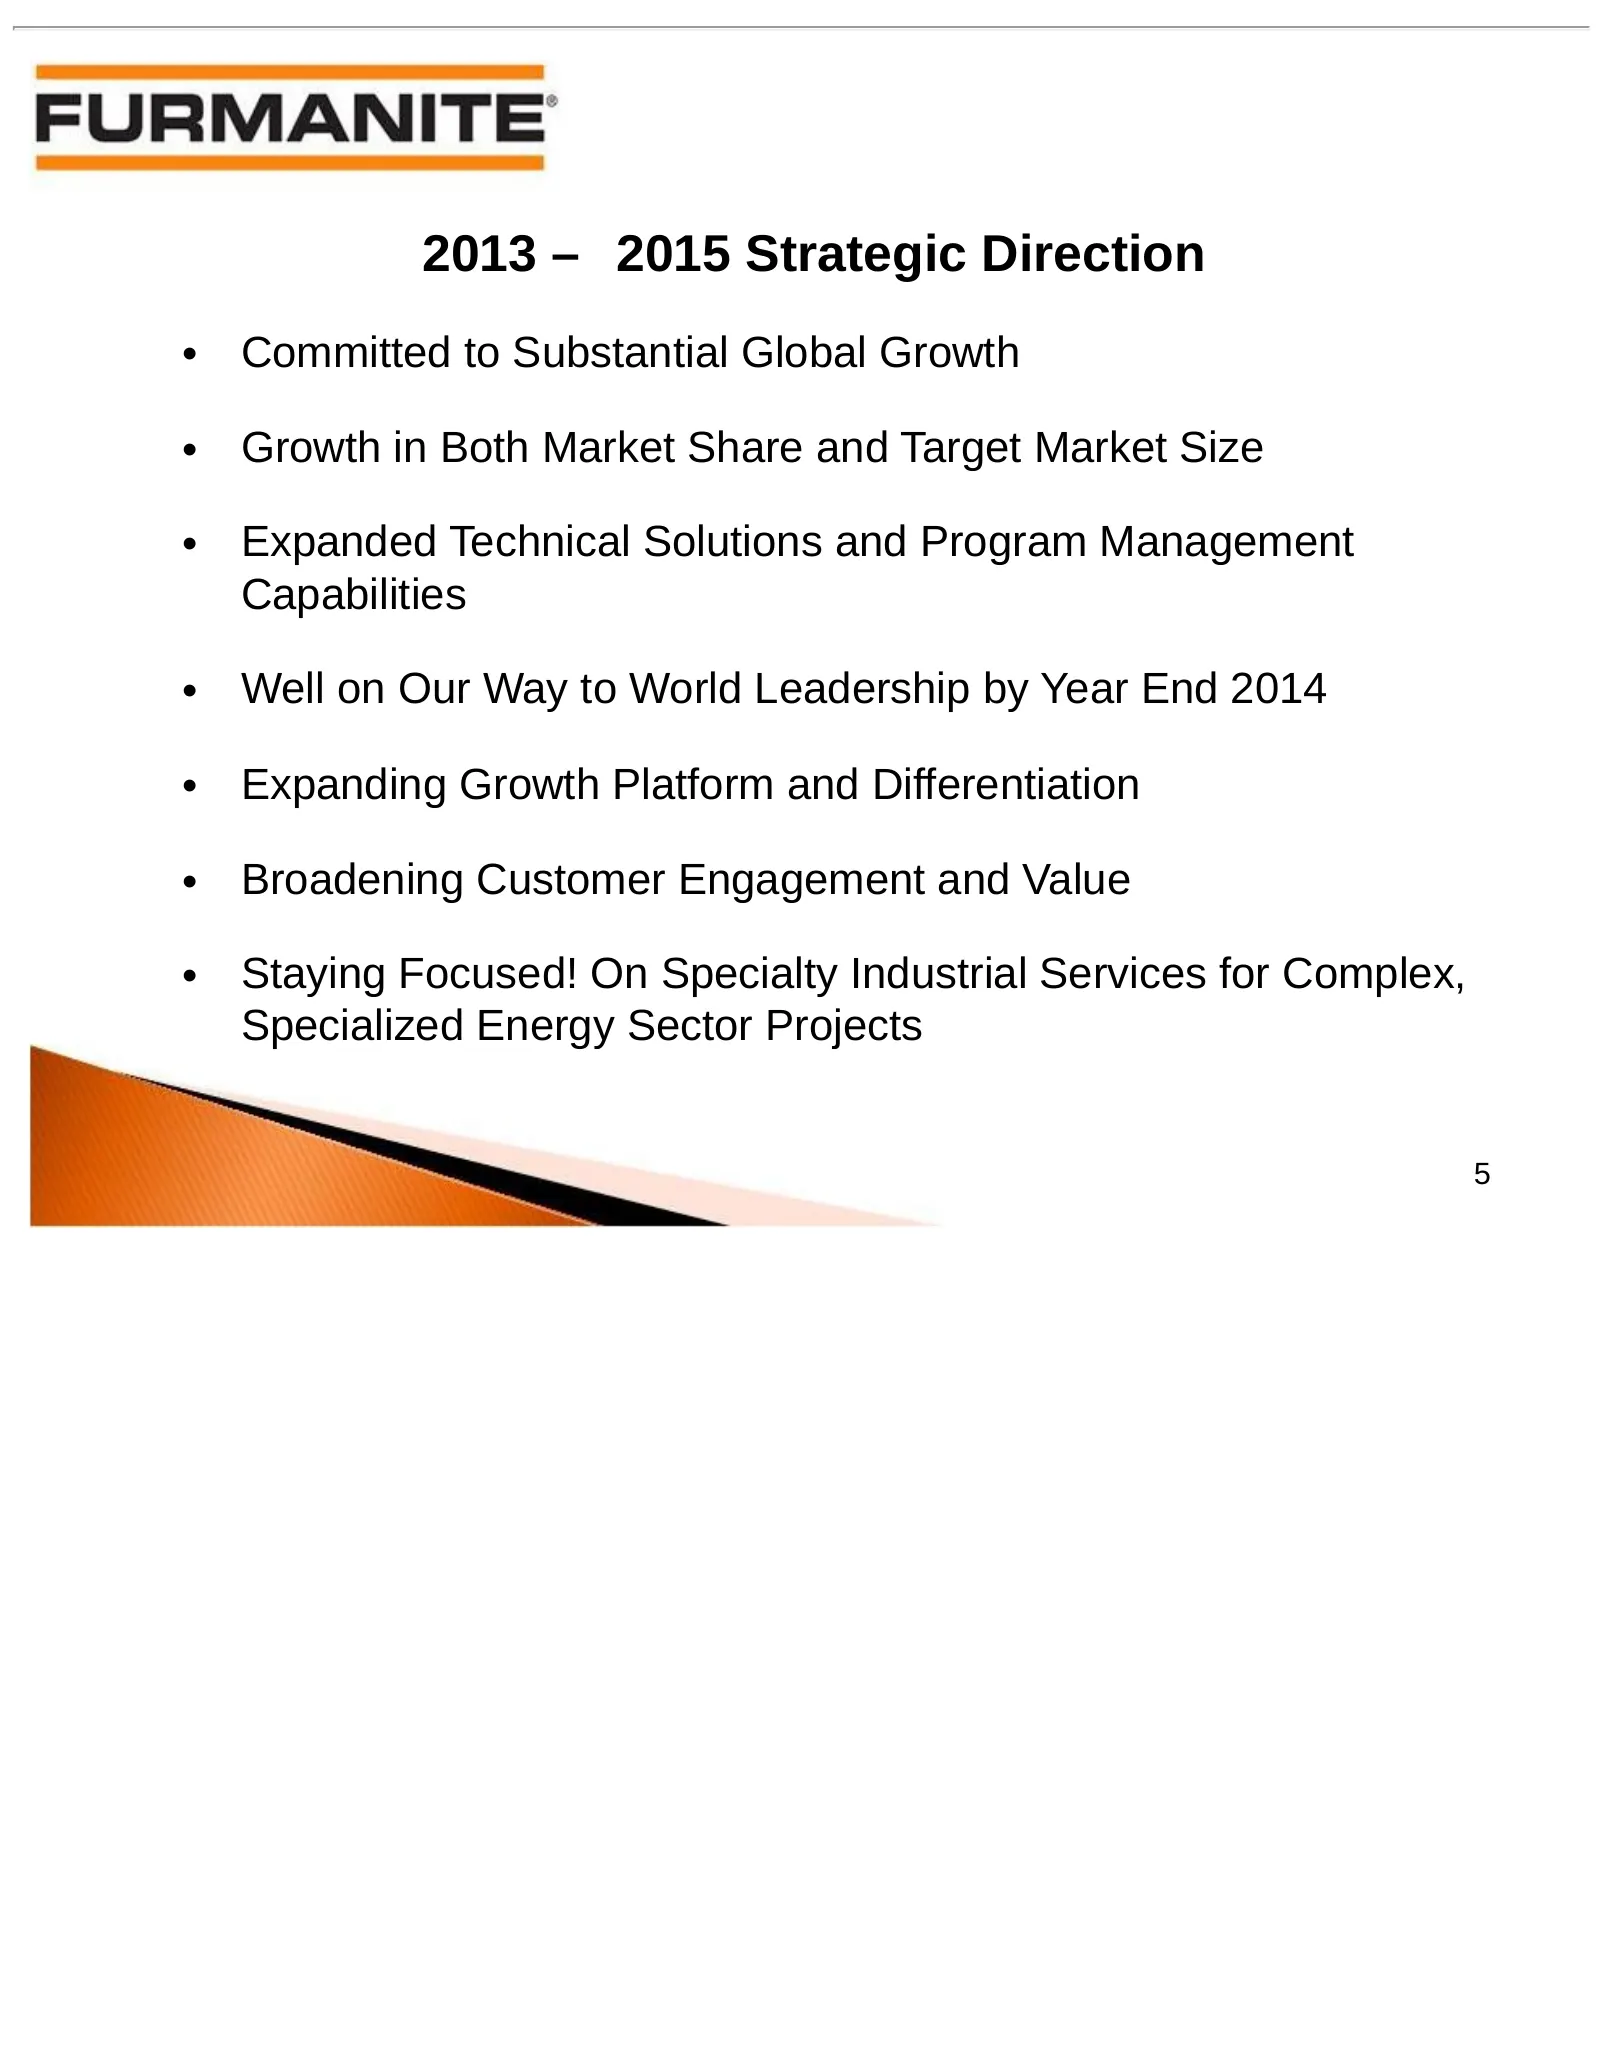
2013 – 2015 Strategic Direction • Committed to Substantial Global Growth • Growth in Both Market Share and Target Market Size • Expanded Technical Solutions and Program Management Capabilities • Well on Our Way to World Leadership by Year End 2014 • Expanding Growth Platform and Differentiation • Br
Slide 6: Financial Review
Furmanite Corporation QUARTER AND SIX MONTHS ENDED JUNE 30, 2013 Financial Review Robert S. Muff, Principal Financial Officer 6
Slide 7: Condensed Consolidated Income Statements
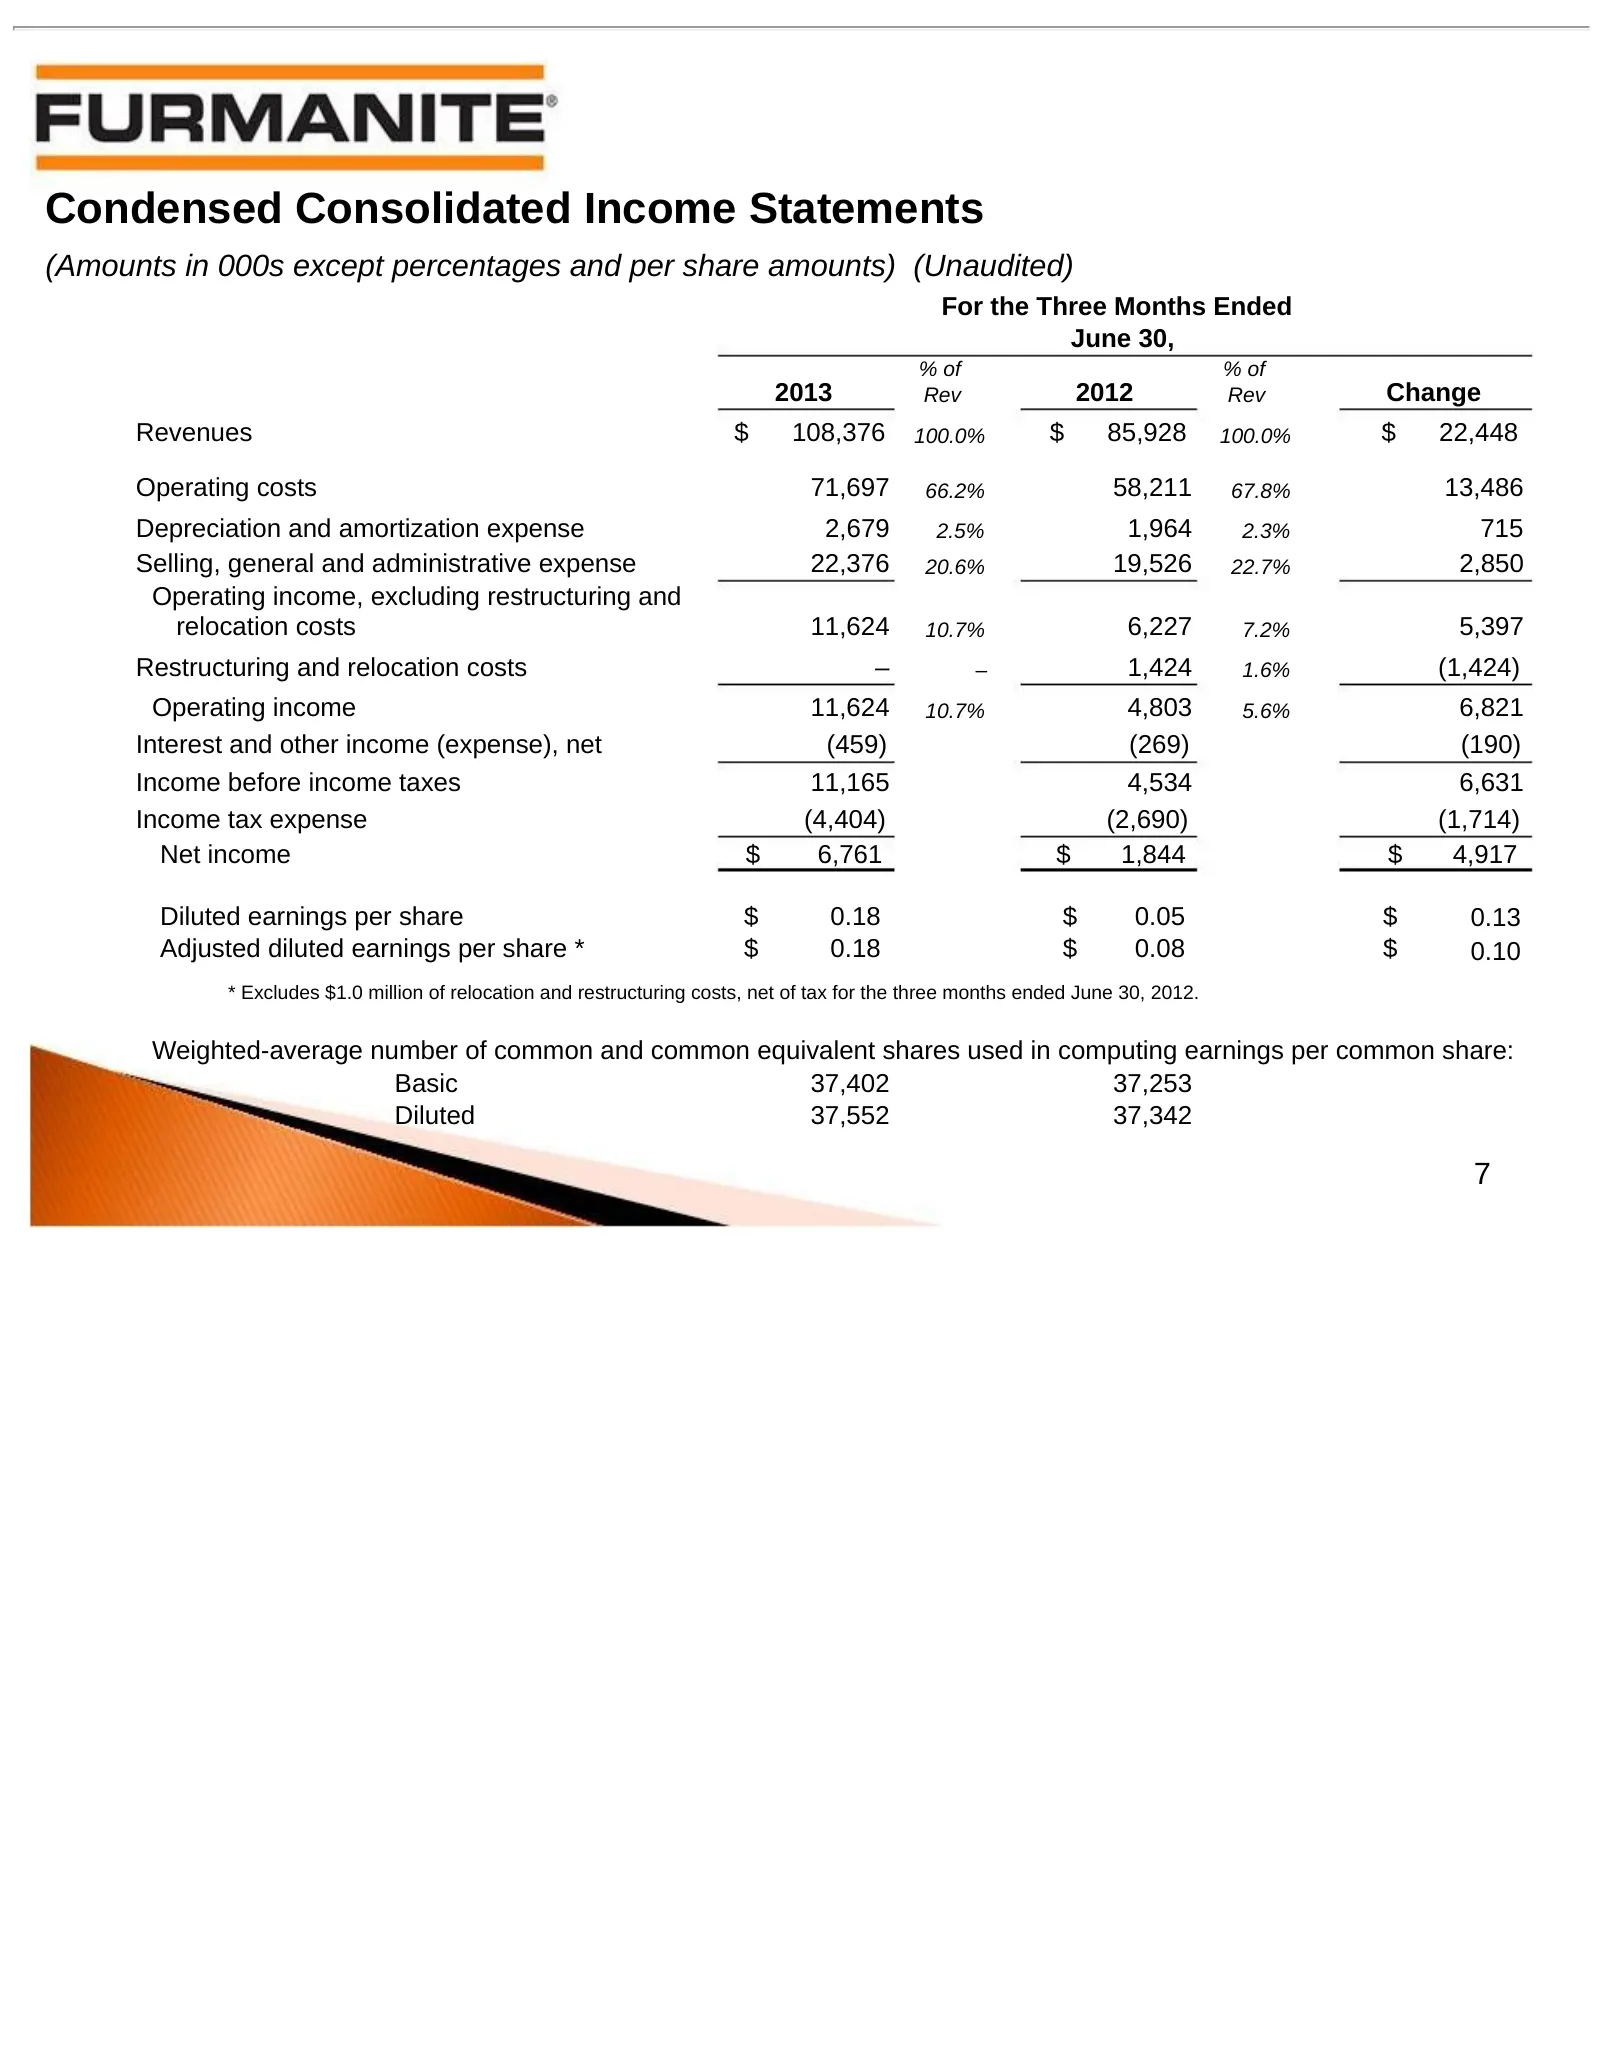
Condensed Consolidated Income Statements (Amounts in 000s except percentages and per share amounts) (Unaudited) For the Three Months Ended June 30, % of % of 2013 Rev 2012 Rev Change Revenues $ 108,376 100.0% $ 85,928 100.0% $ 22,448 Operating costs 71,697 66.2% 58,211 67.8% 13,486 Depreciation and
Slide 8: Condensed Consolidated Income Statements
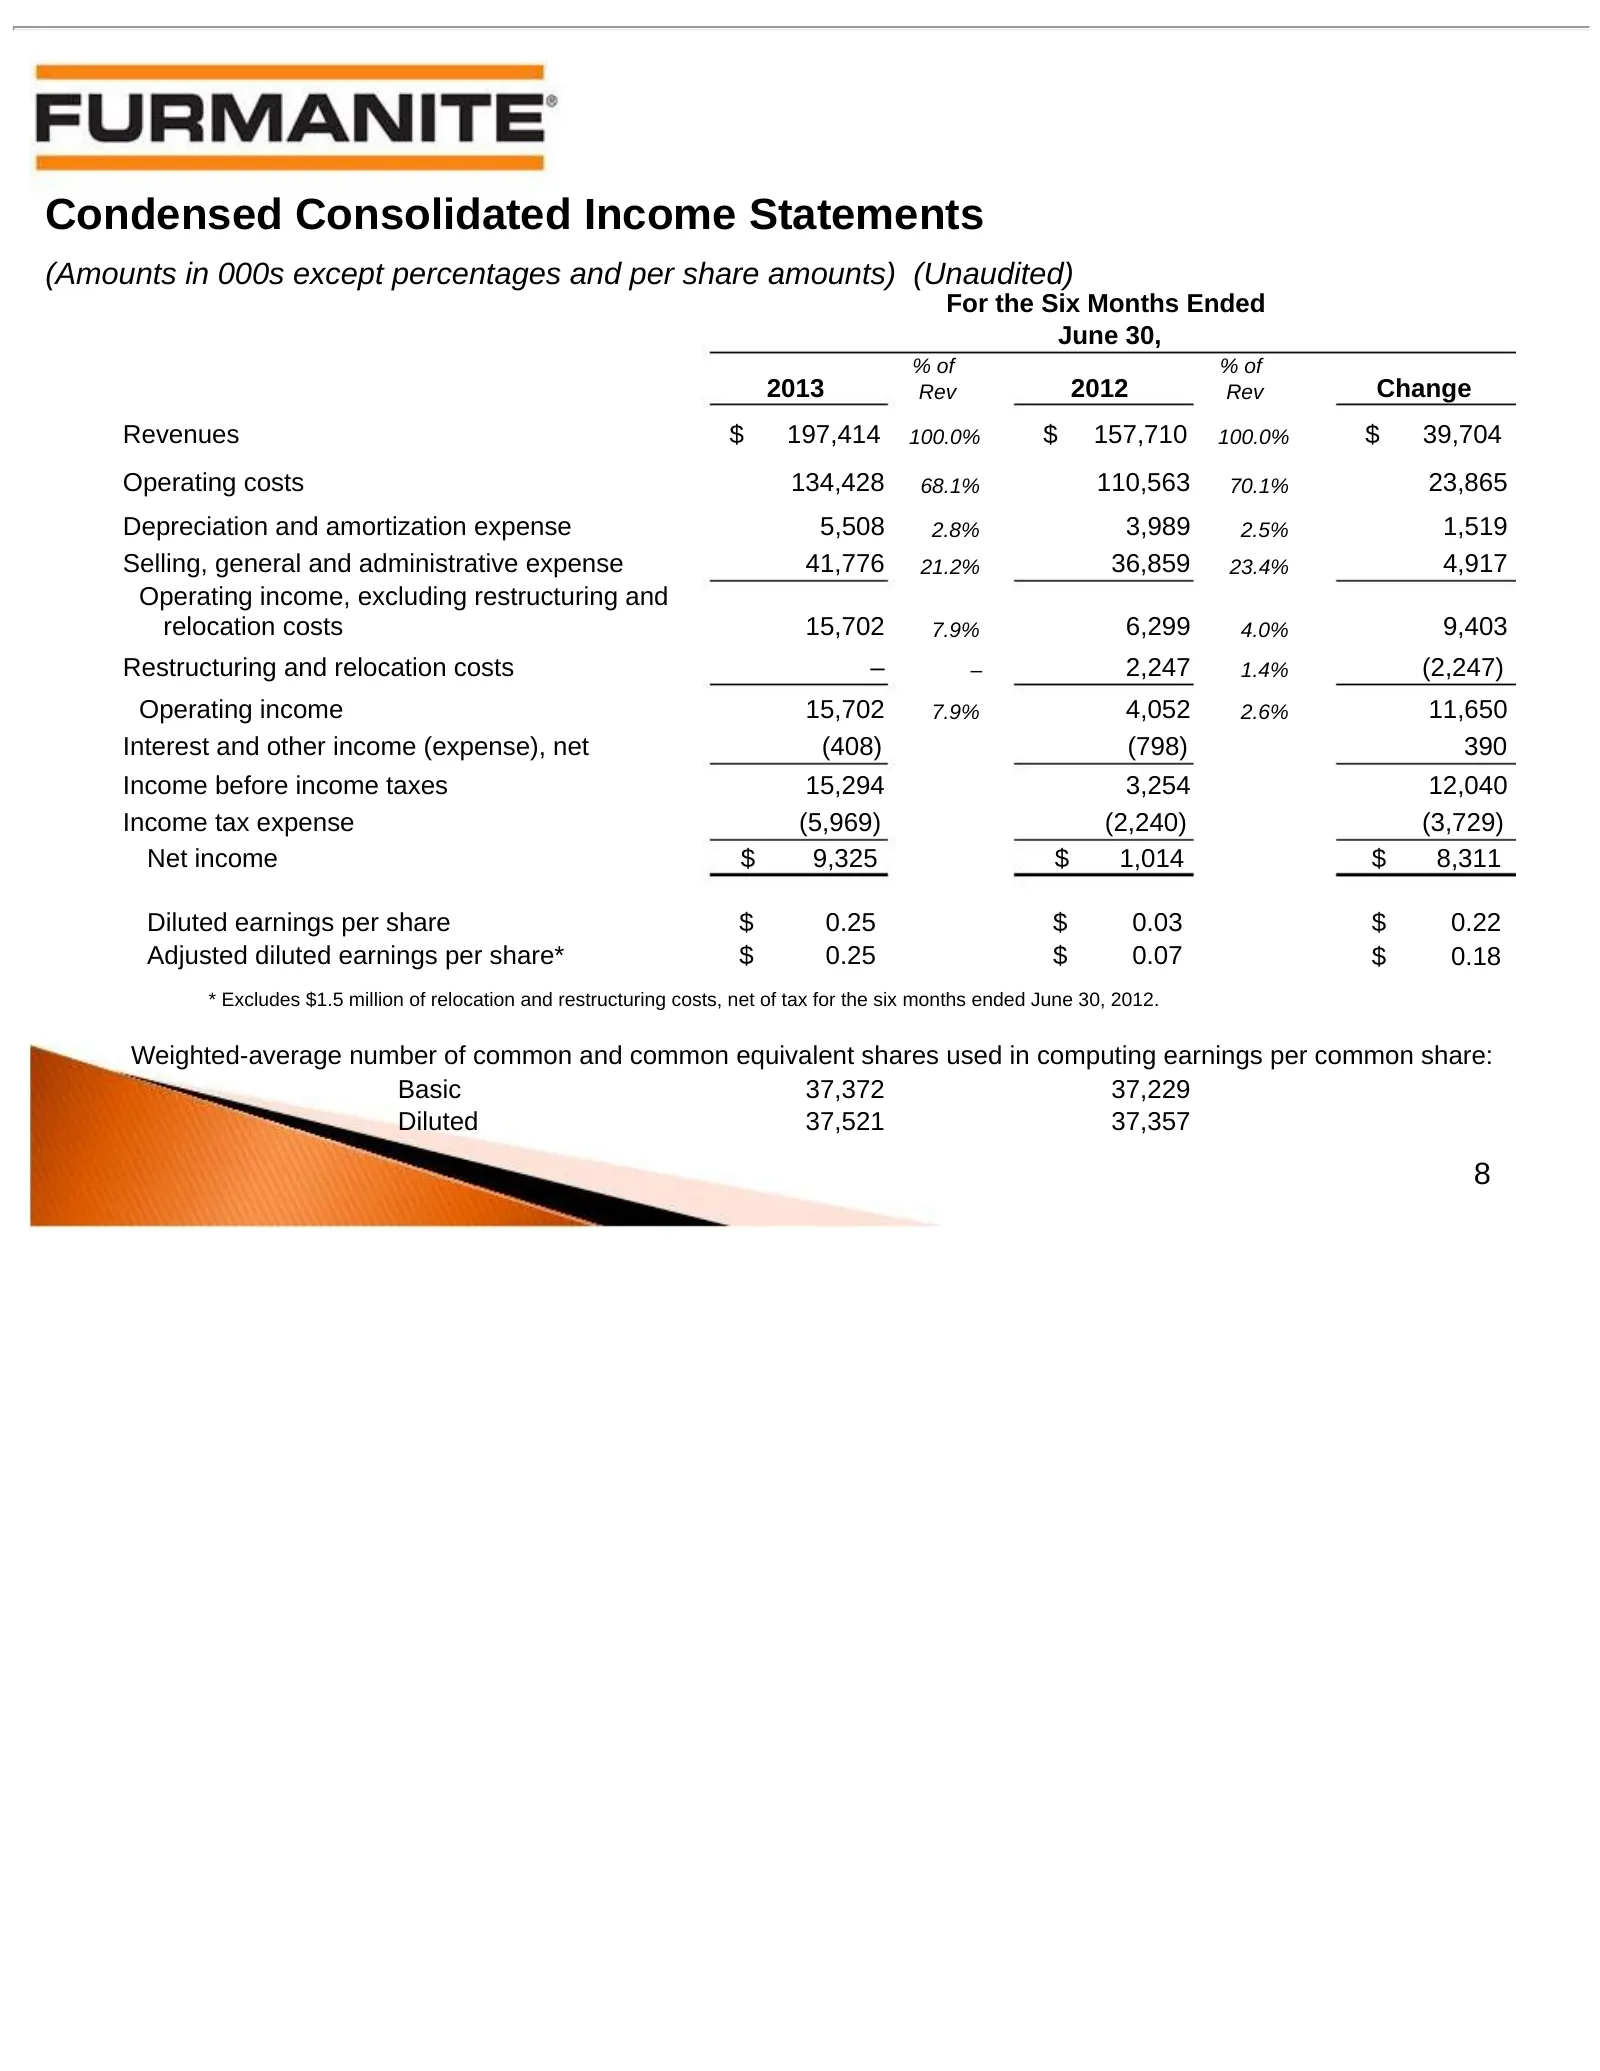
Condensed Consolidated Income Statements (Amounts in 000s except percentages and per share amounts) (Unaudited) For the Six Months Ended June 30, % of % of 2013 Rev 2012 Rev Change Revenues $ 197,414 100.0% $ 157,710 100.0% $ 39,704 Operating costs 134,428 68.1% 110,563 70.1% 23,865 Depreciation and
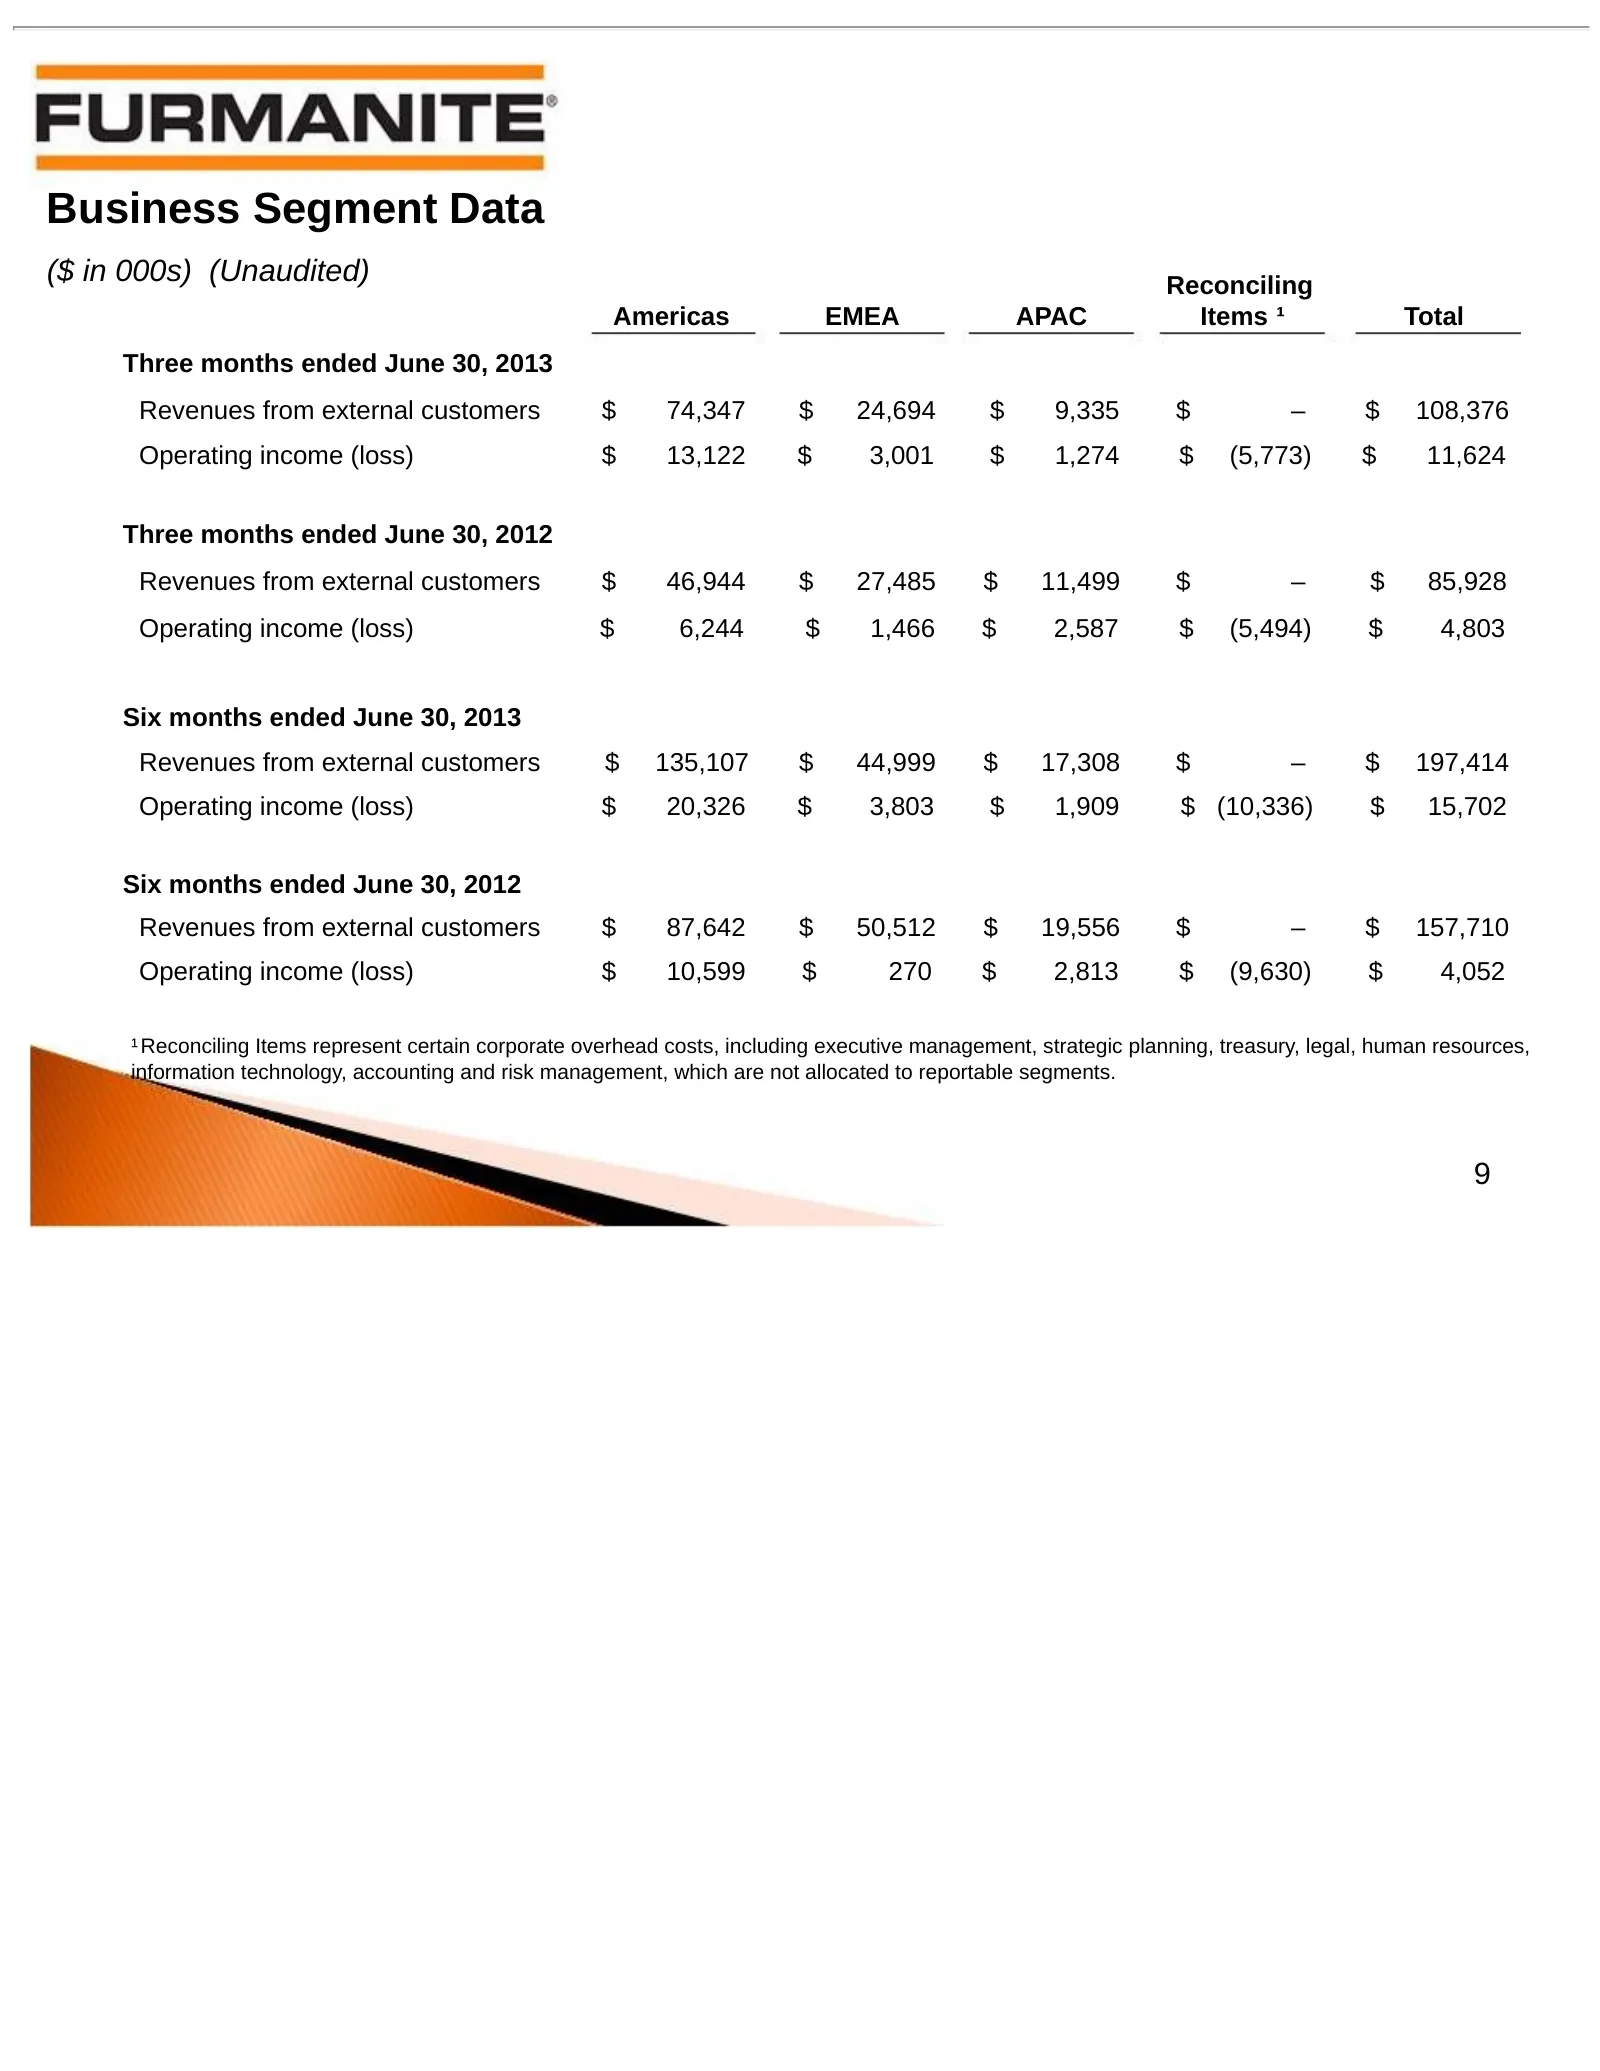
Slide 9: Business Segment Data
Business Segment Data ($ in 000s) (Unaudited) Reconciling Americas EMEA APAC Items ¹ Total Three months ended June 30, 2013 Revenues from external customers $ 74,347 $ 24,694 $ 9,335 $ – $ 108,376 Operating income (loss) $ 13,122 $ 3,001 $ 1,274 $ (5,773) $ 11,624 Three months ended June 30, 2012 Re
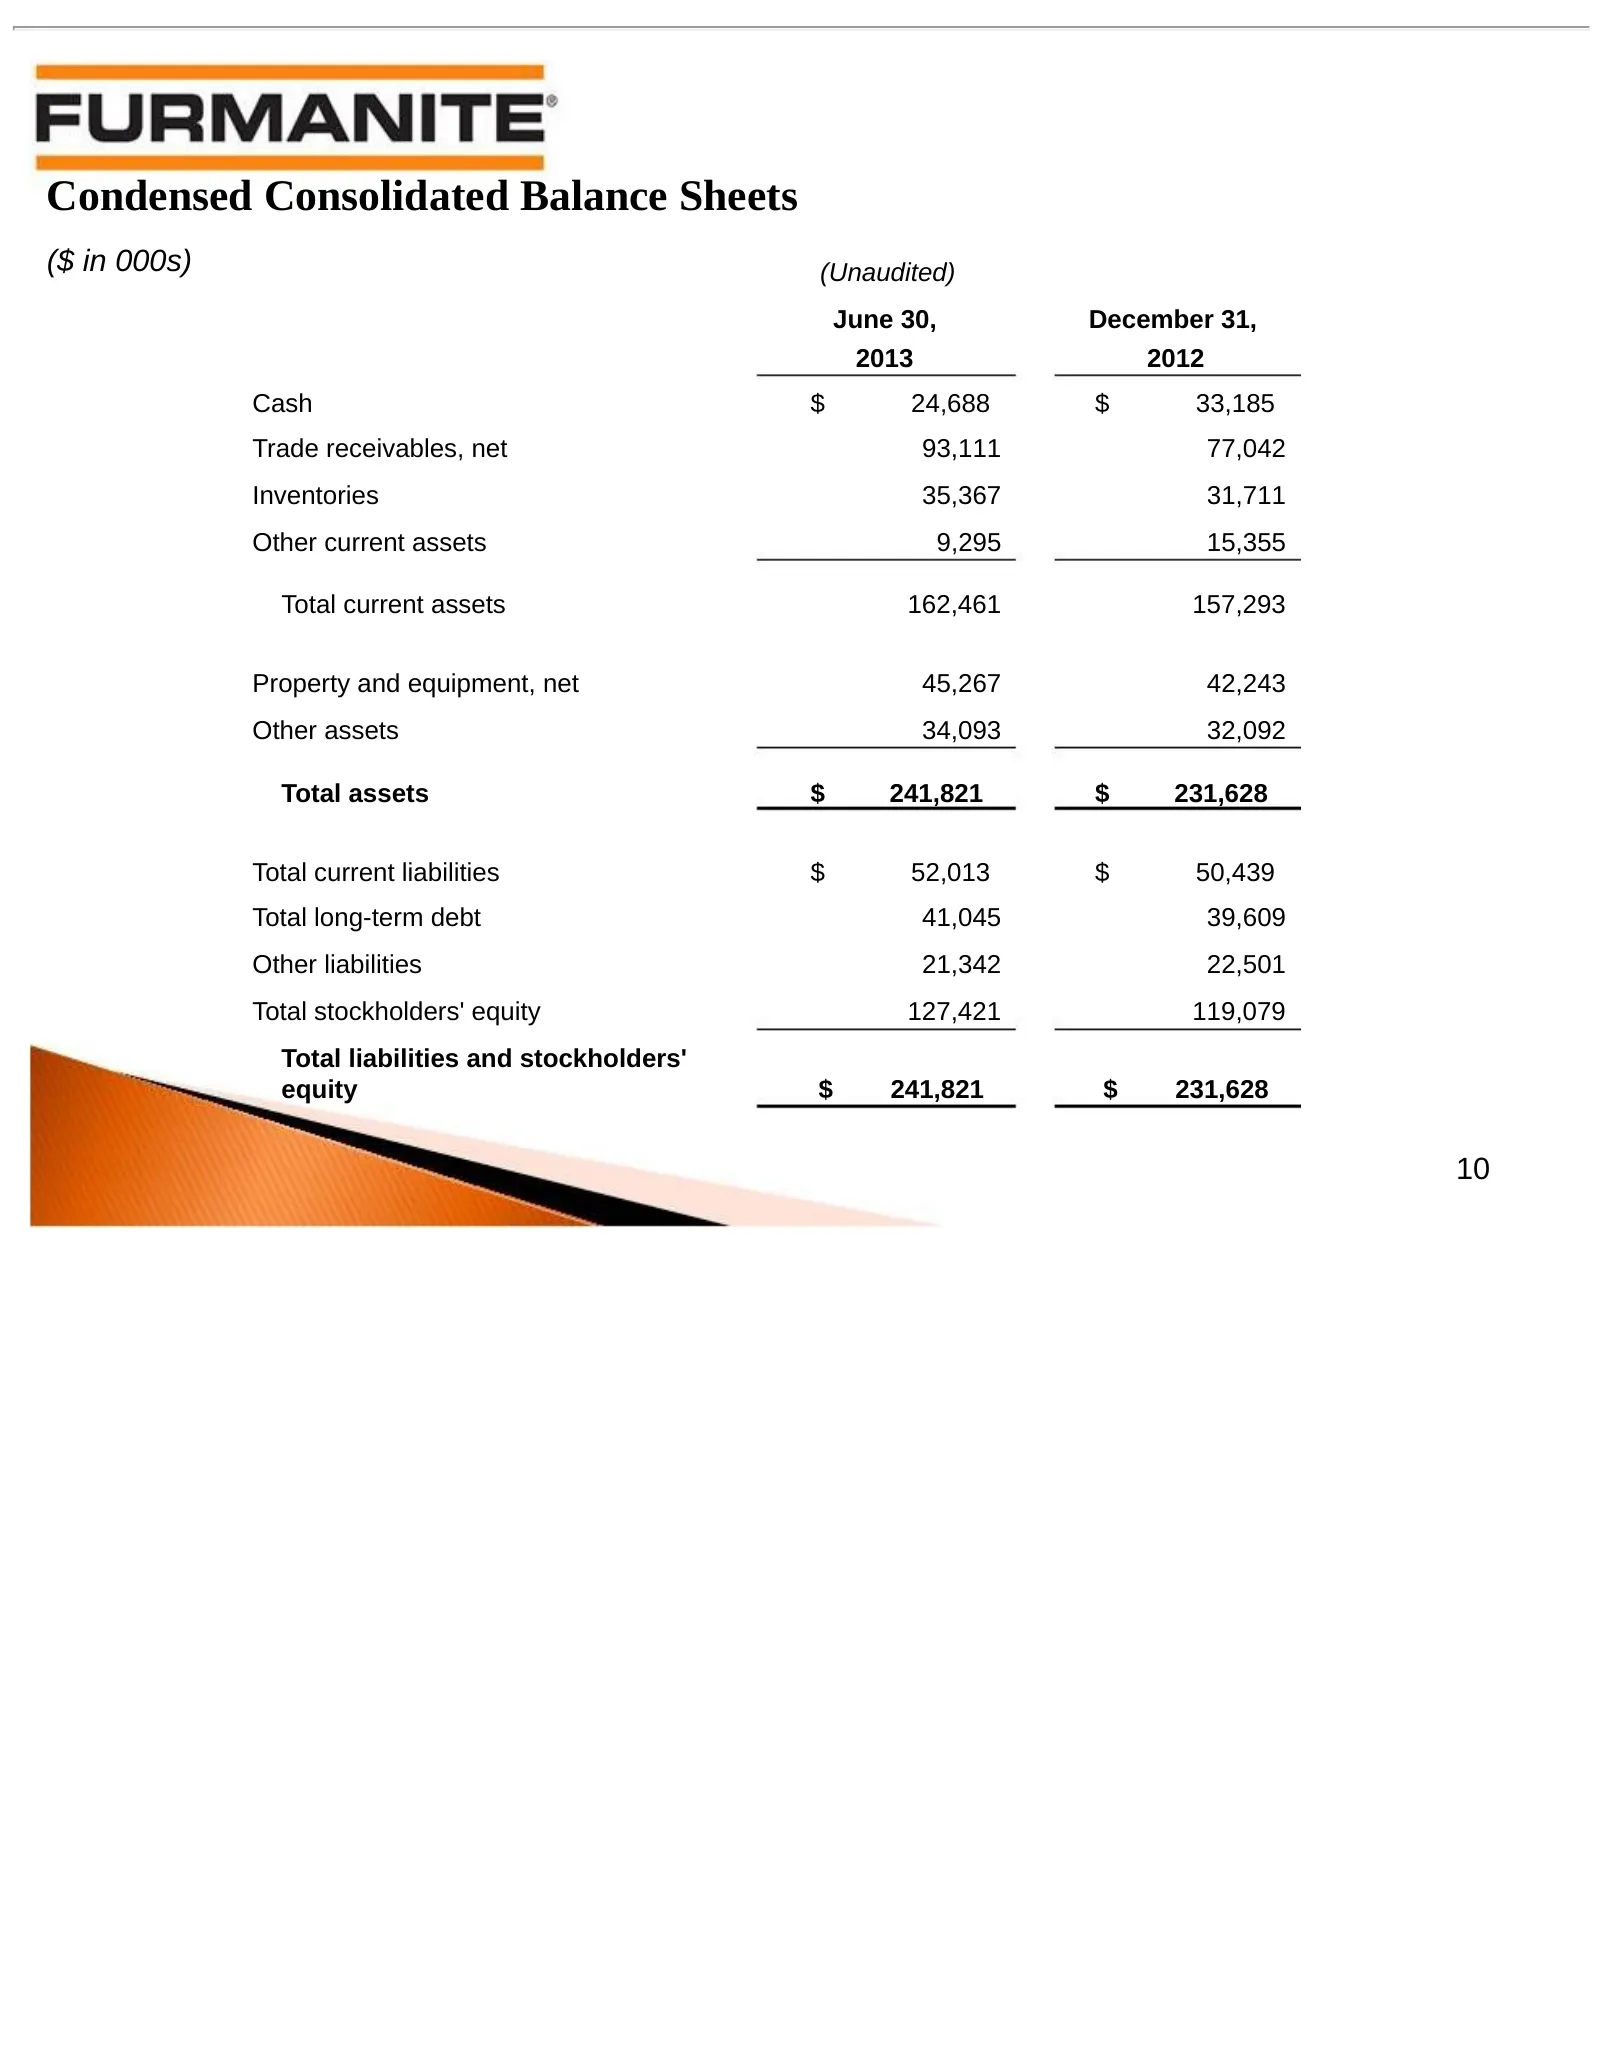
Slide 10: Condensed Consolidated Balance Sheets
Condensed Consolidated Balance Sheets ($ in 000s) (Unaudited) June 30, December 31, 2013 2012 Cash $ 24,688 $ 33,185 Trade receivables, net 93,111 77,042 Inventories 35,367 31,711 Other current assets 9,295 15,355 Total current assets 162,461 157,293 Property and equipment, net 45,267 42,243 Other a
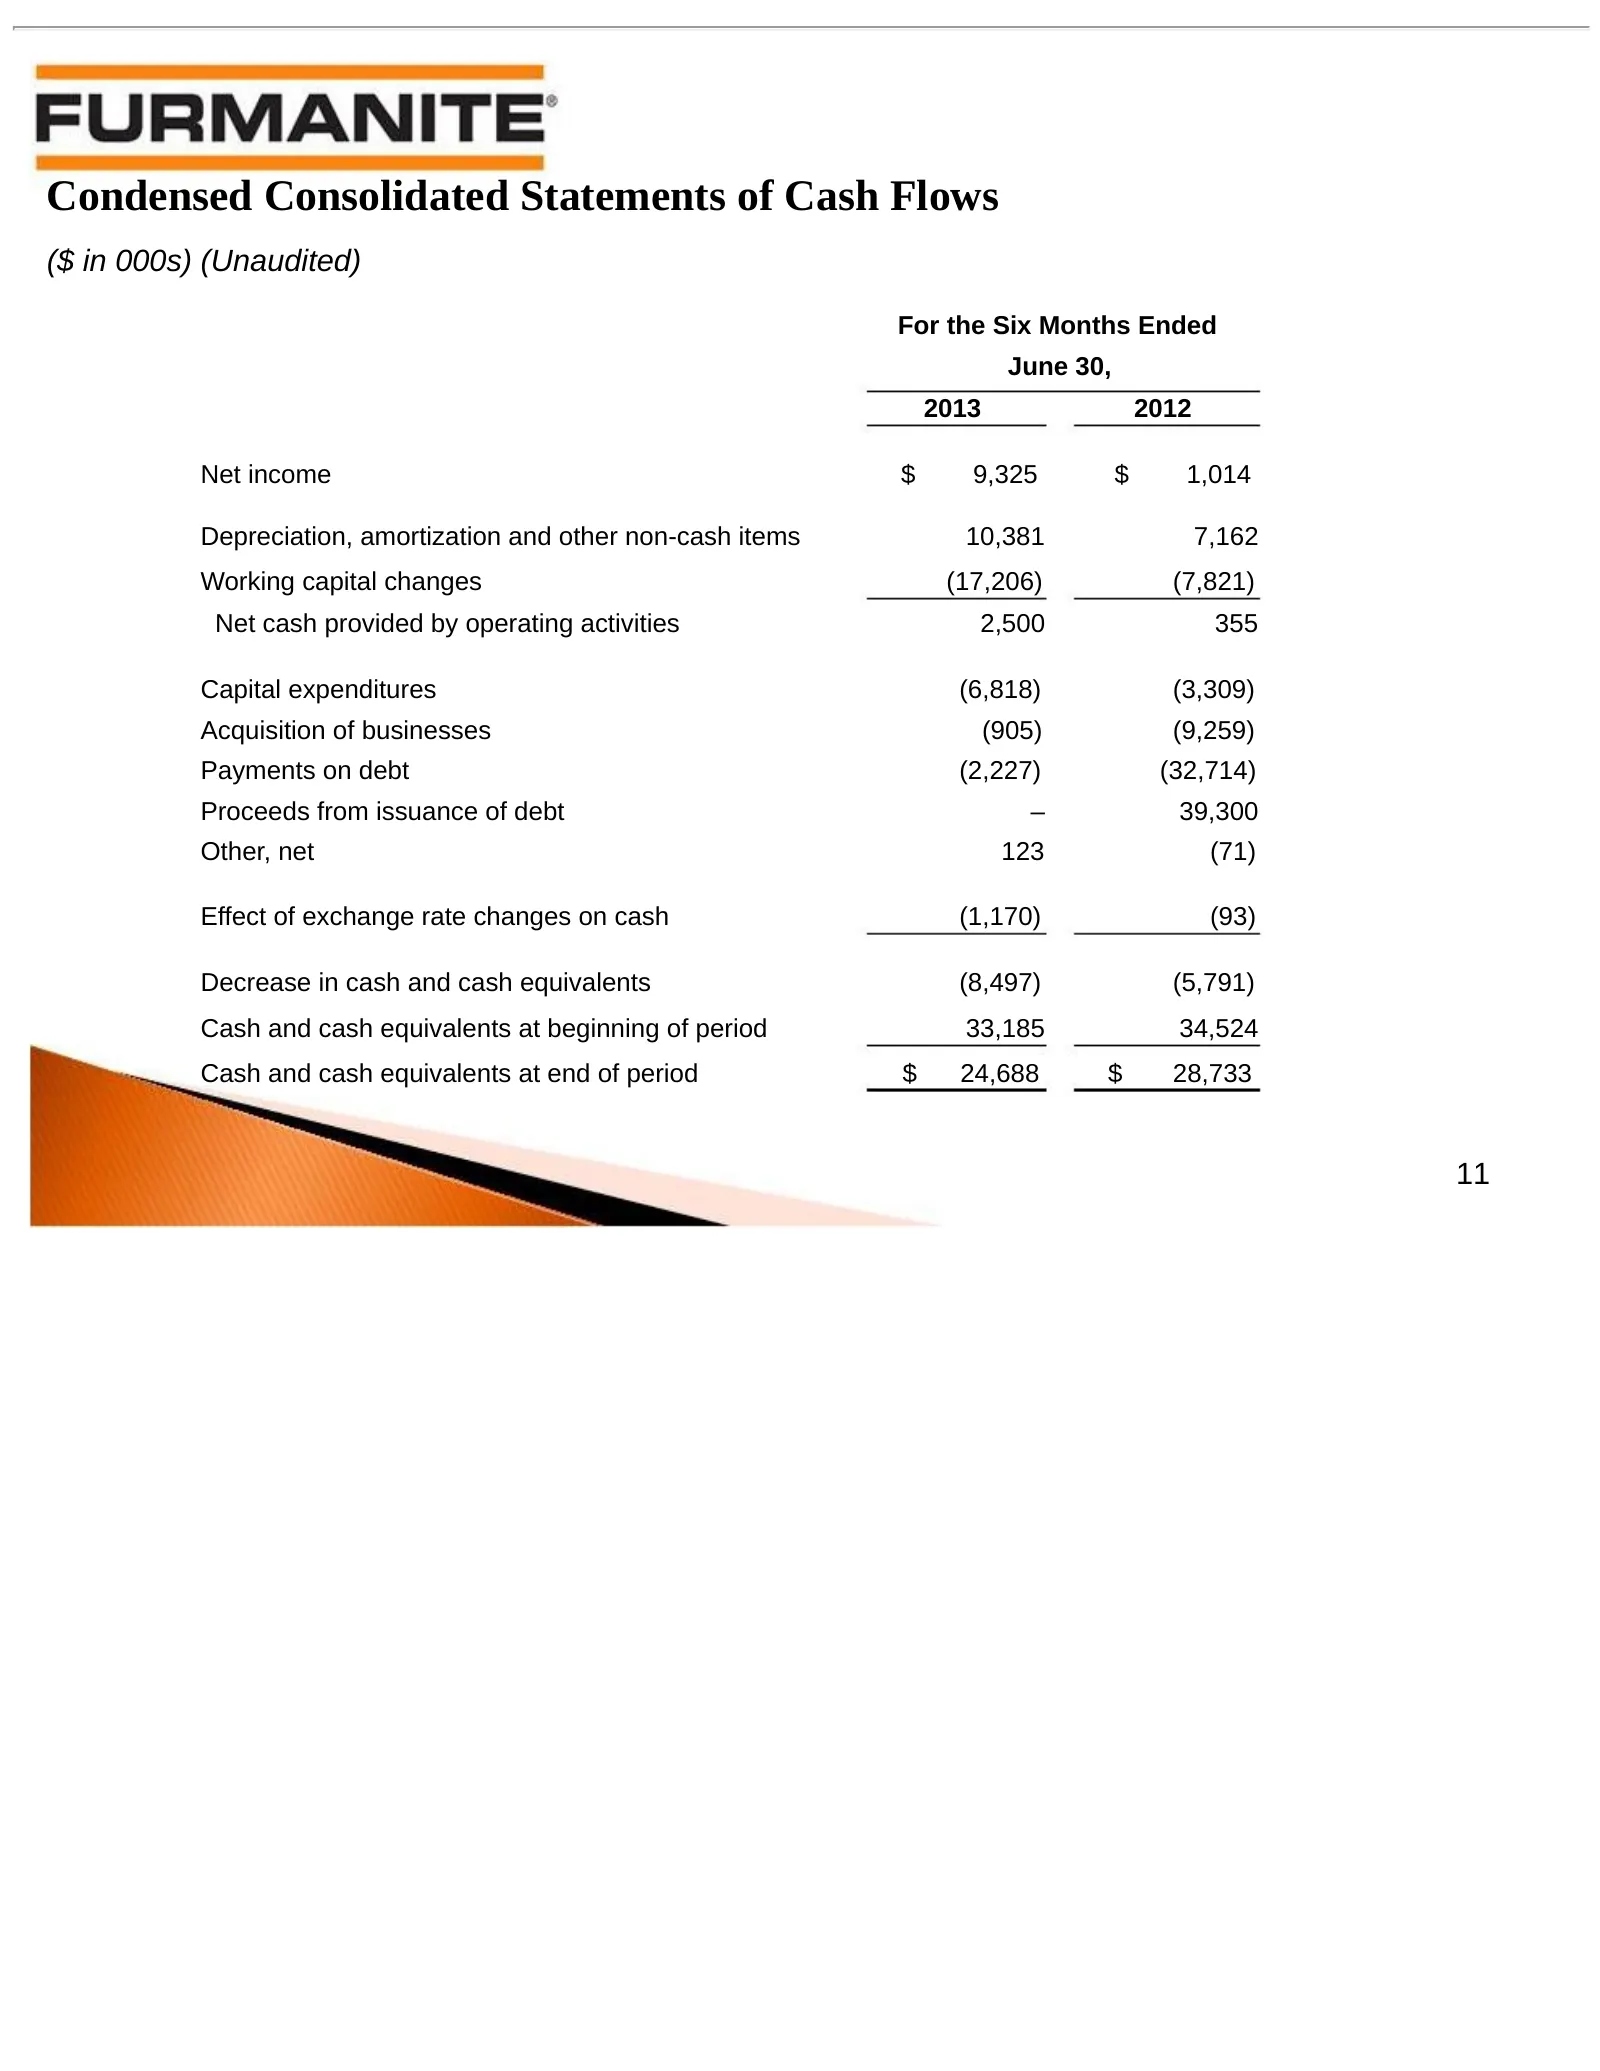
Slide 11: Condensed Consolidated Statements of Cash Flows
Condensed Consolidated Statements of Cash Flows ($ in 000s) (Unaudited) For the Six Months Ended June 30, 2013 2012 Net income $ 9,325 $ 1,014 Depreciation, amortization and other non-cash items 10,381 7,162 Working capital changes (17,206) (7,821) Net cash provided by operating activities 2,500 355
Slide 12: Operations Review
Furmanite Corporation QUARTER AND SIX MONTHS ENDED JUNE 30, 2013 Operations Review Joseph E. Milliron, President and Chief Operating Officer 12
Slide 13: Global Service Network
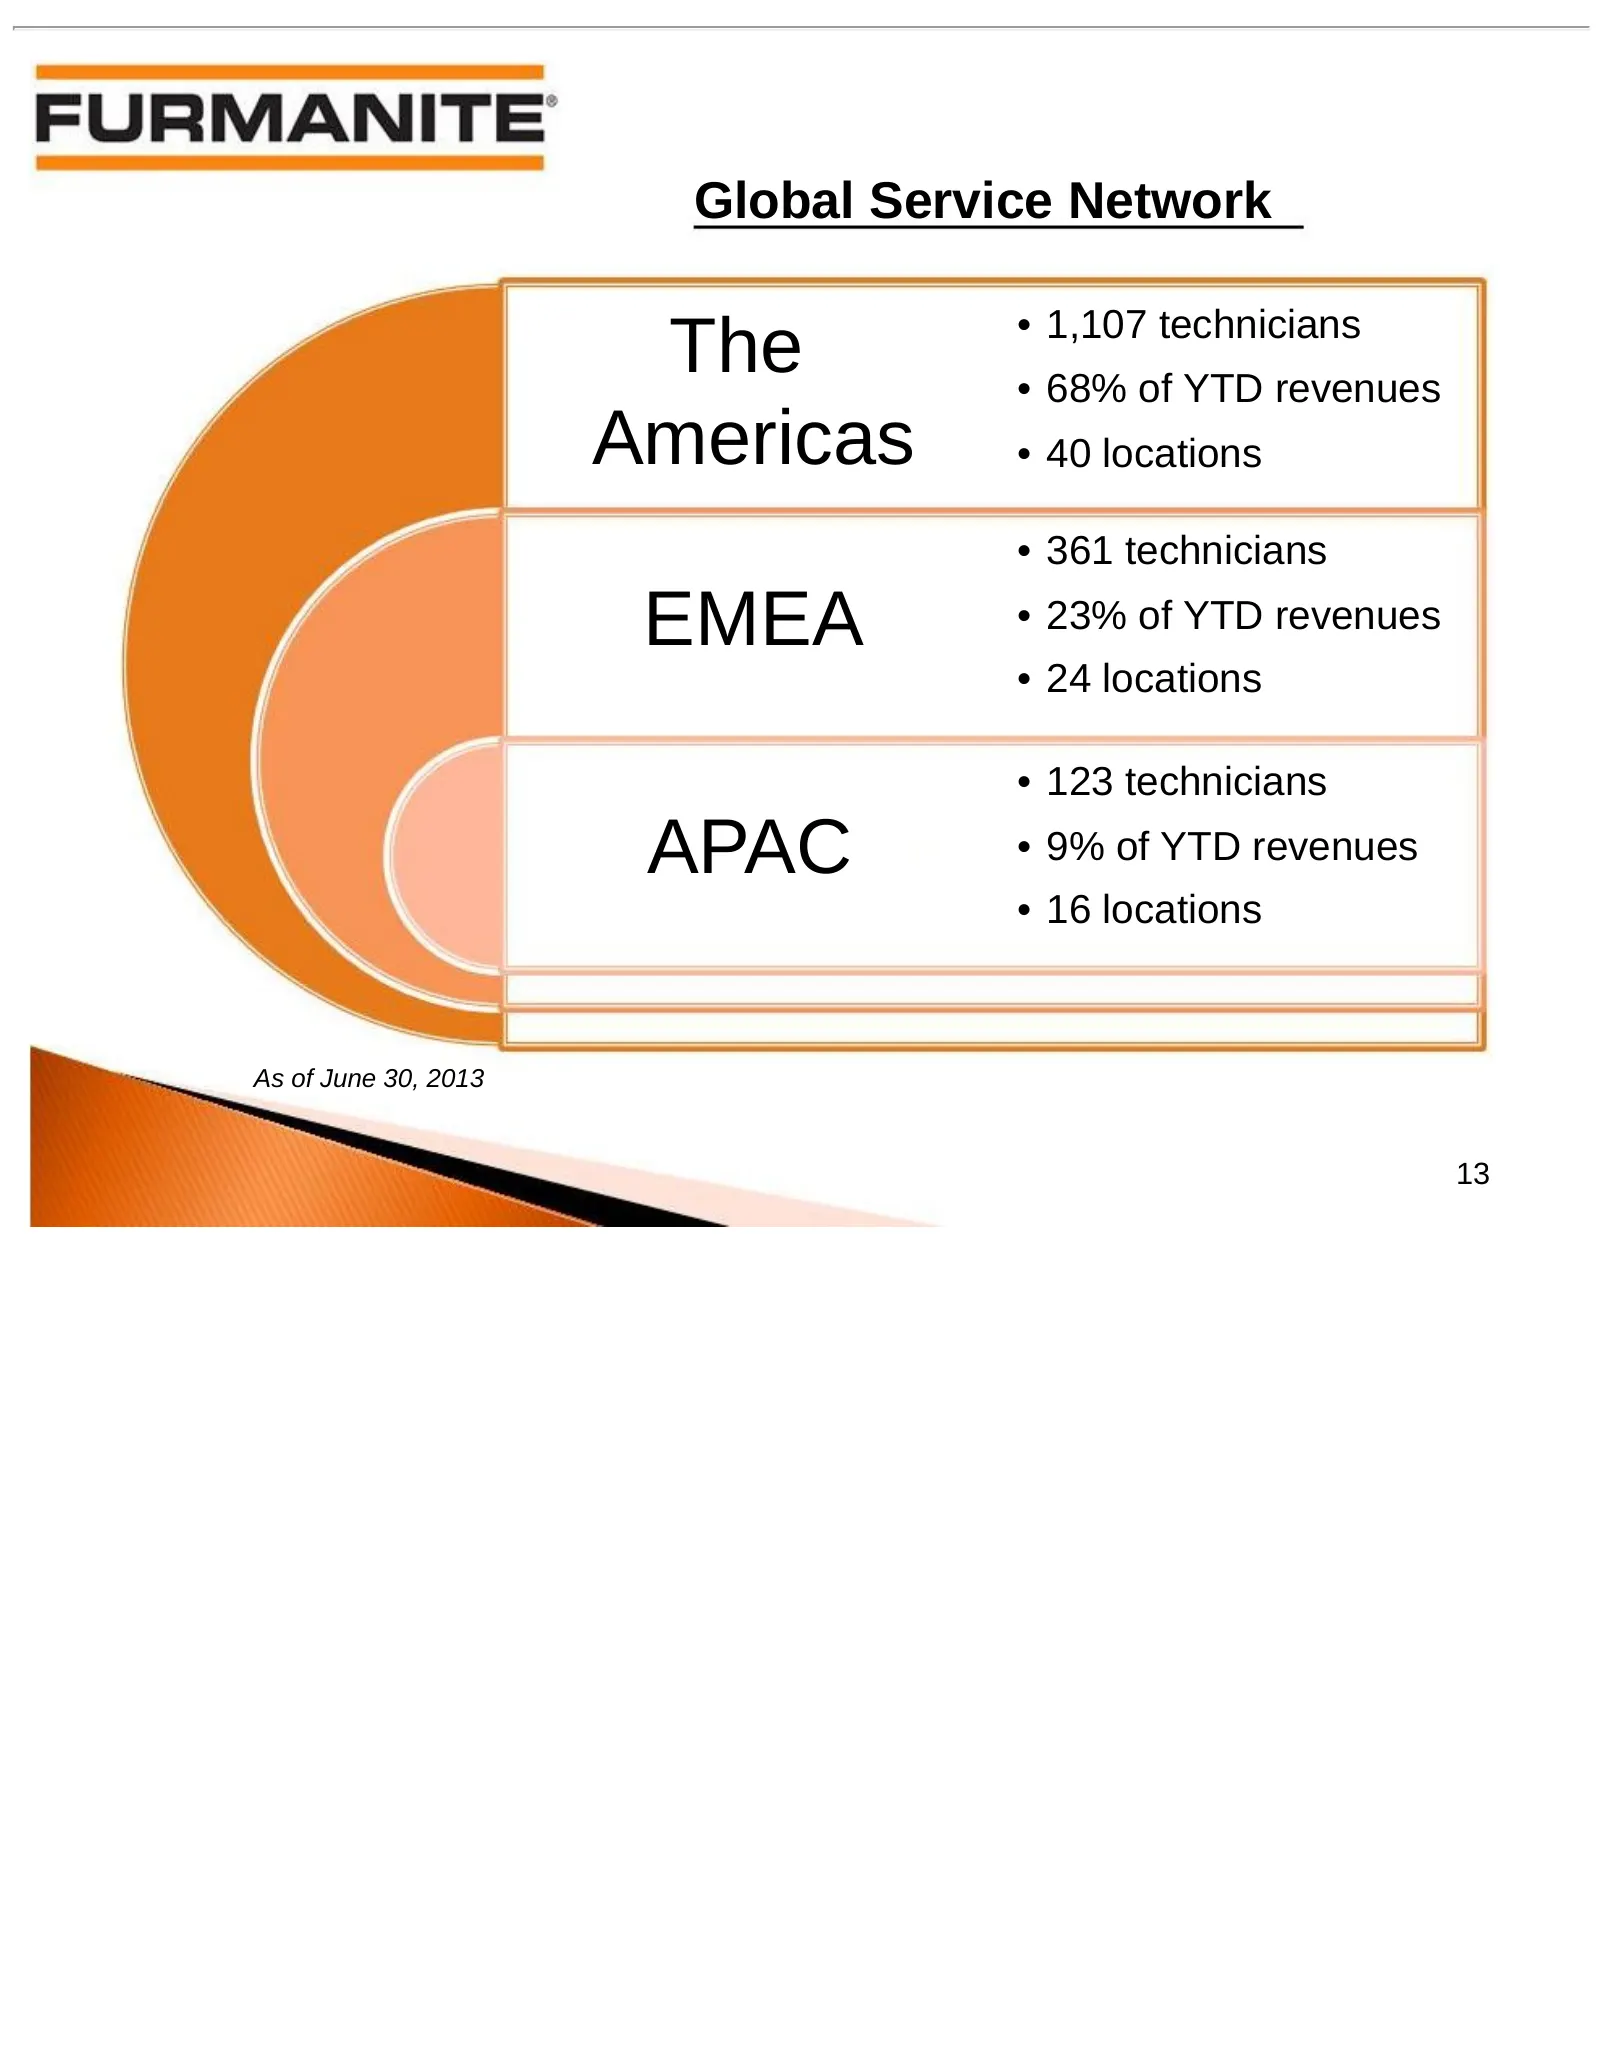
Global Service Network • 1,107 technicians The • 68% of YTD revenues Americas • 40 locations • 361 technicians EMEA • 23% of YTD revenues • 24 locations • 123 technicians APAC • 9% of YTD revenues • 16 locations As of June 30, 2013 13
Slide 14: Business and Geographic Data – On-line Services Revenues
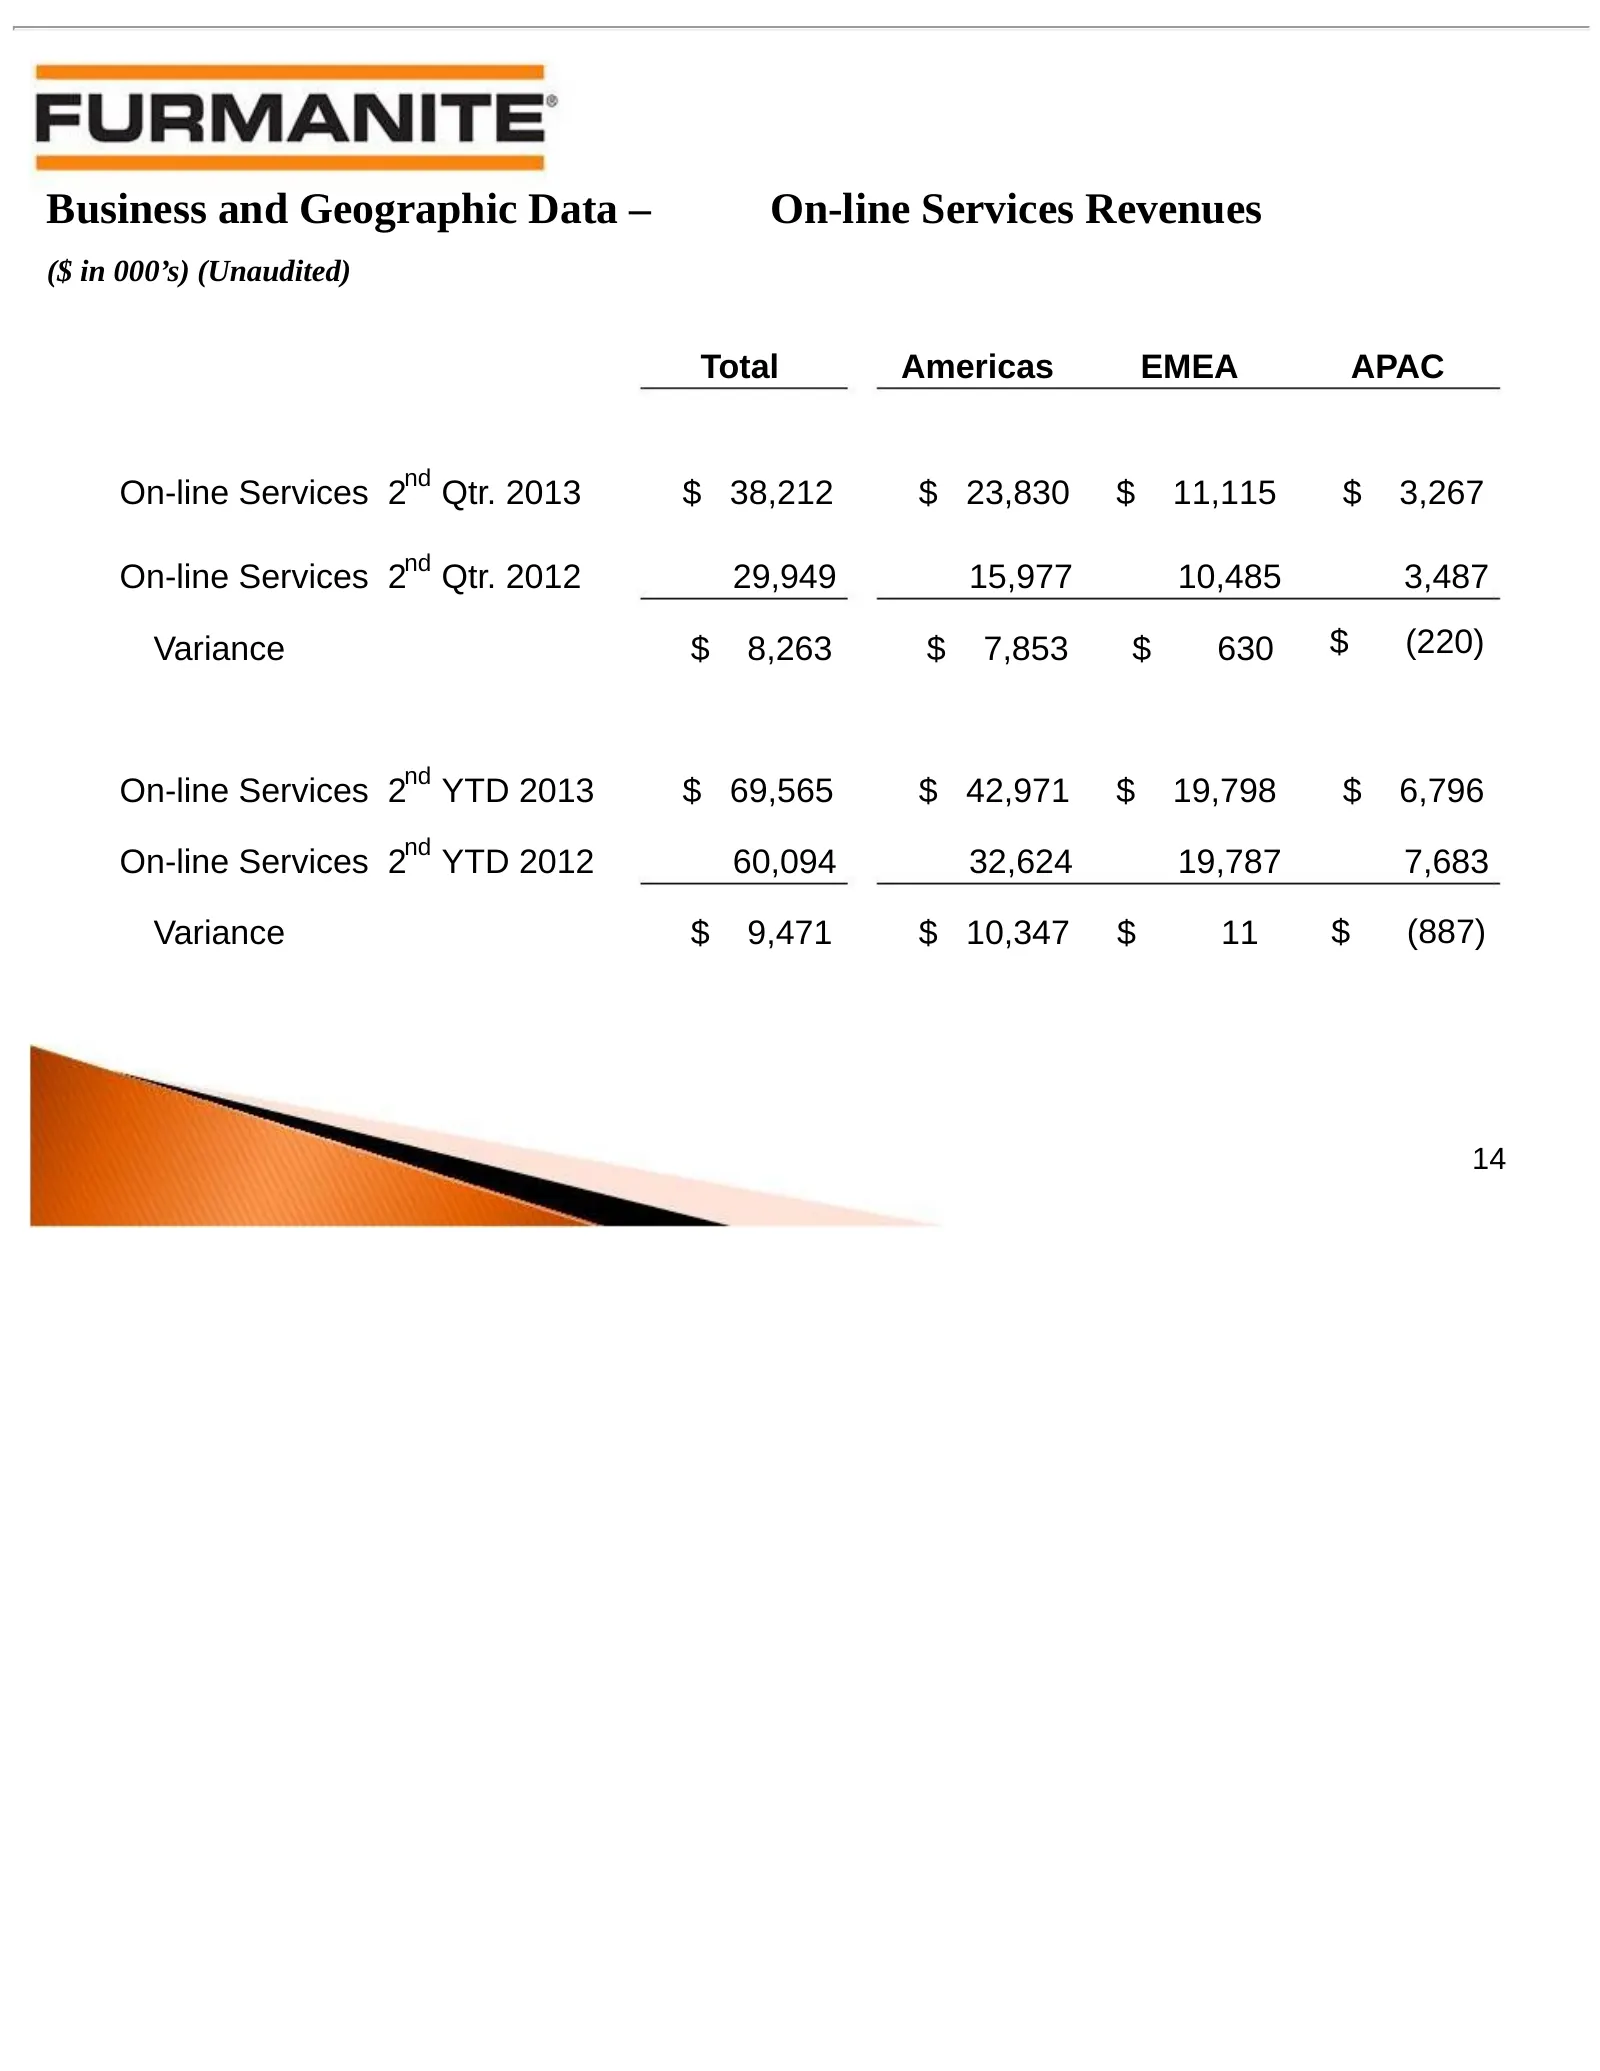
Business and Geographic Data – On-line Services Revenues ($ in 000’s) (Unaudited) Total Americas EMEA APAC nd On-line Services 2 Qtr. 2013 $ 38,212 $ 23,830 $ 11,115 $ 3,267 nd On-line Services 2 Qtr. 2012 29,949 15,977 10,485 3,487 Variance $ 8,263 $ 7,853 $ 630 $ (220) nd On-line Services 2 YTD 20
Slide 15: Business and Geographic Data – Off-line Services Revenues
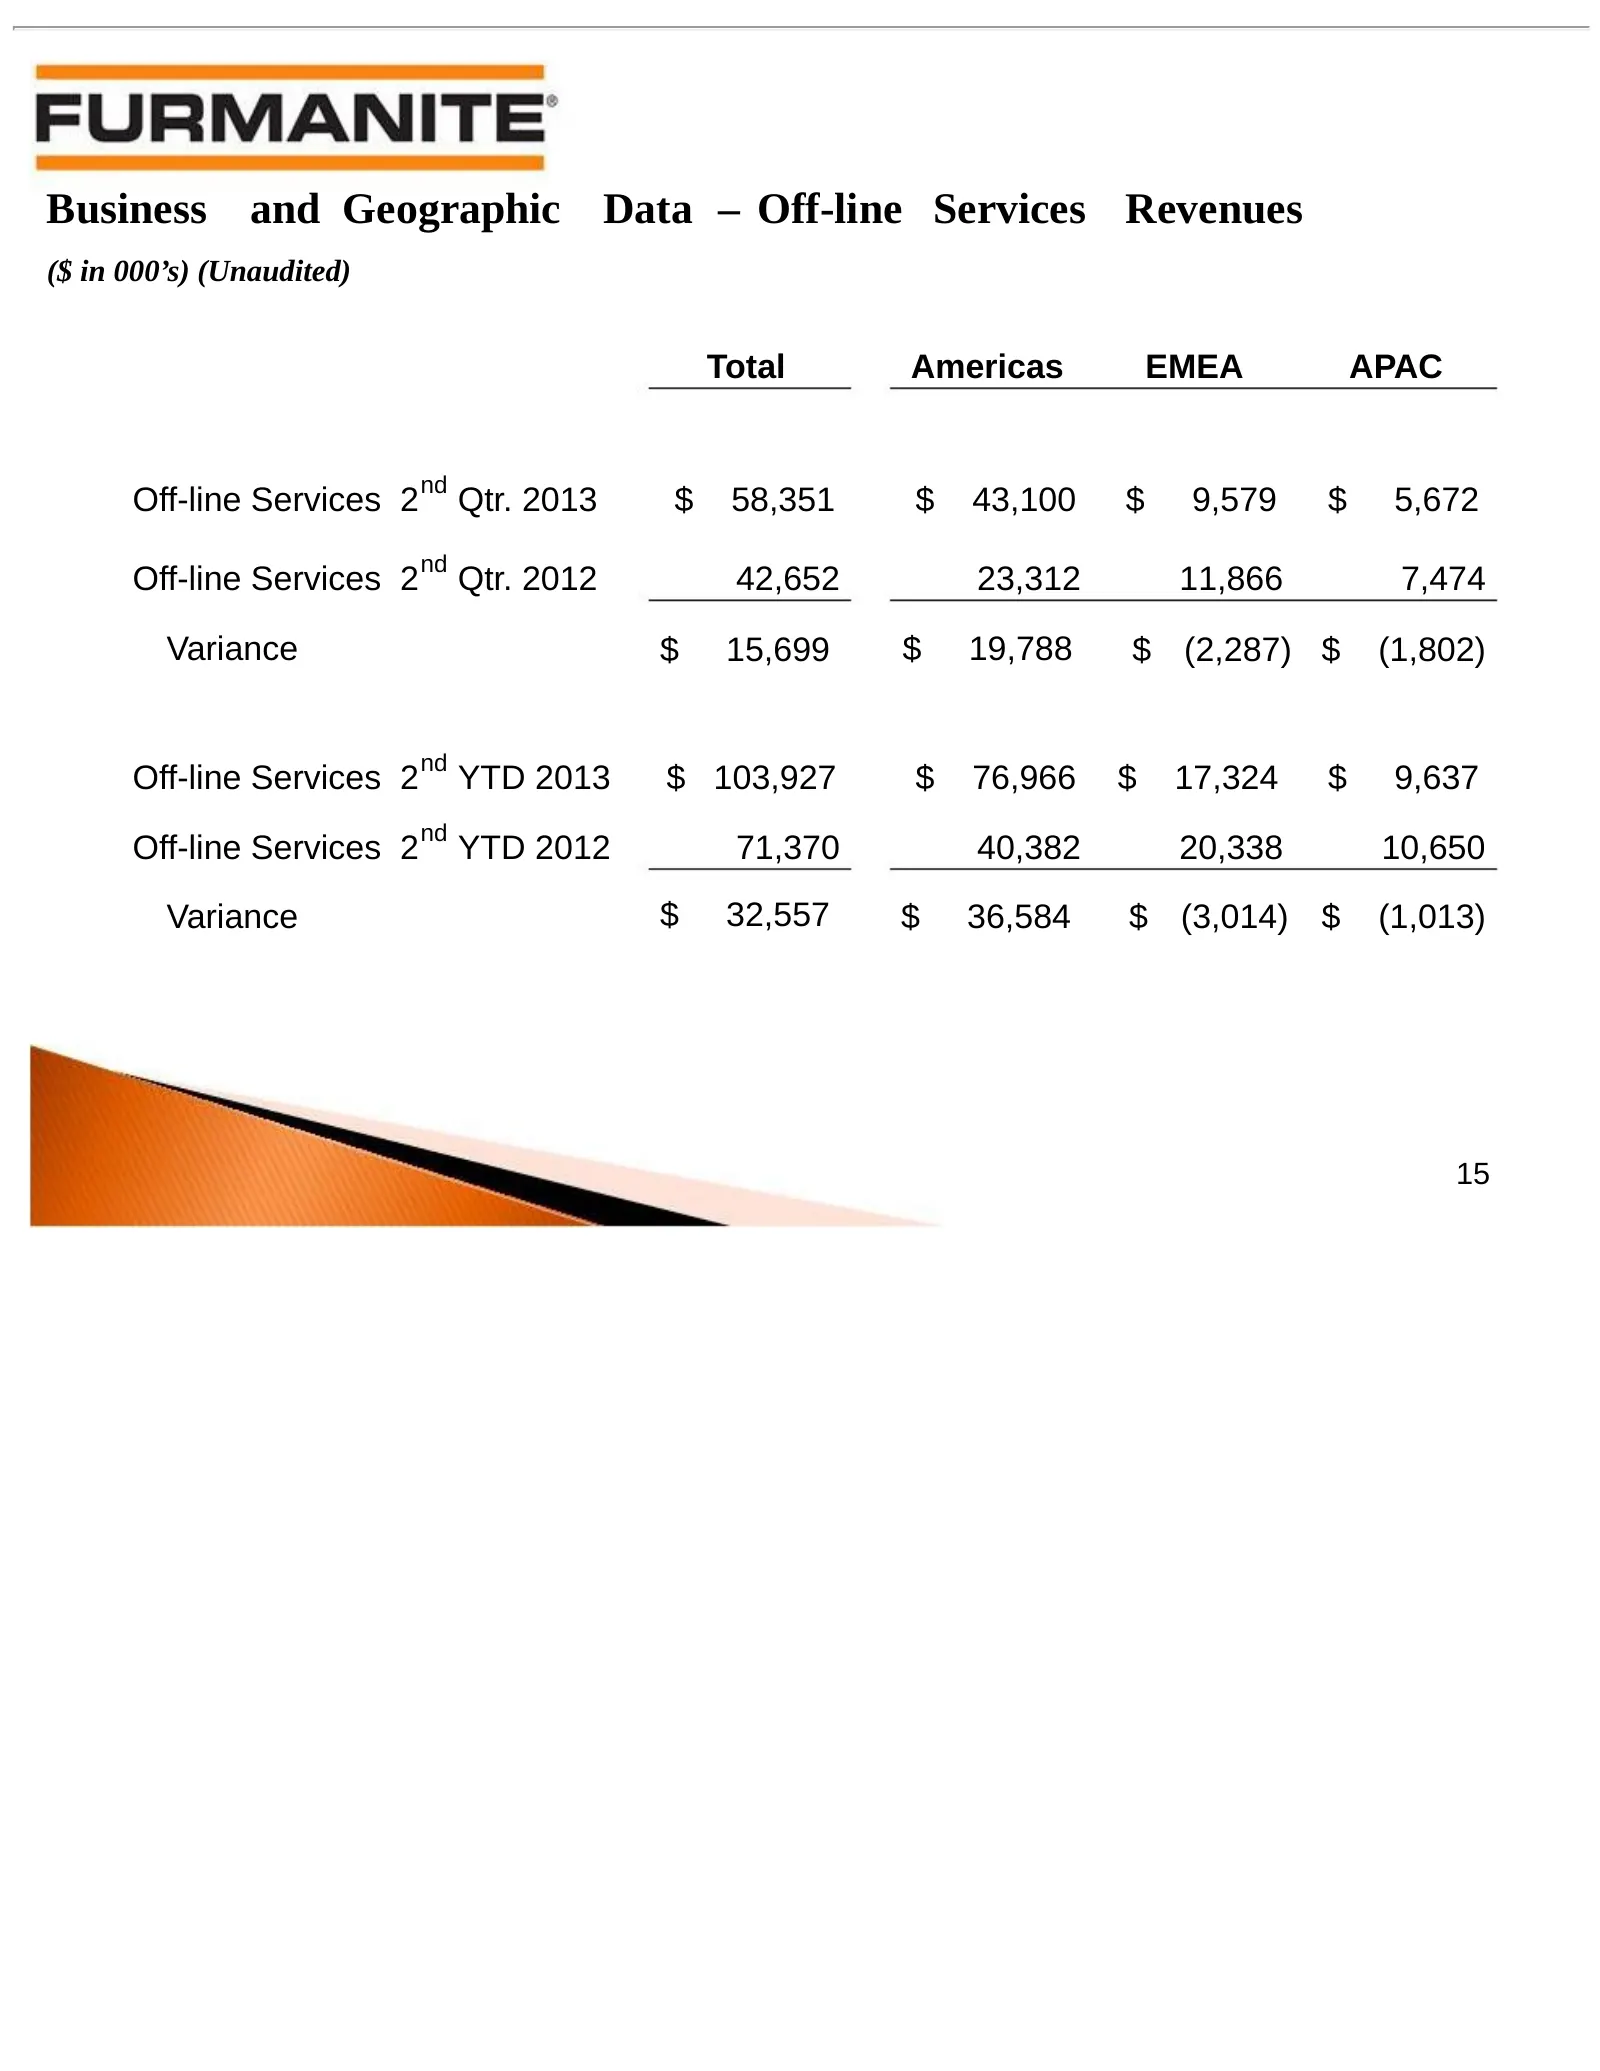
Business and Geographic Data – Off-line Services Revenues ($ in 000’s) (Unaudited) Total Americas EMEA APAC nd Off-line Services 2 Qtr. 2013 $ 58,351 $ 43,100 $ 9,579 $ 5,672 nd Off-line Services 2 Qtr. 2012 42,652 23,312 11,866 7,474 Variance $ 15,699 $ 19,788 $ (2,287) $ (1,802) nd Off-line Servic
Slide 16: Furmanite Corporation Review of 2Q 2013
Furmanite Corporation Review of 2Q 2013 August 2, 2013 www.furmanite.com 16
Source: SEC EDGAR · 8-K filed Aug 2, 2013
More decks from Furmanite Corp
 Merger or Acquisition (November 2015)13 slides · Nov 2, 2015
 Q2 2015 Earnings Presentation19 slides · Aug 4, 2015
 Q1 2015 Earnings Presentation16 slides · May 11, 2015
 Proxy Contest (April 2015)40 slides · Apr 2, 2015
 Proxy Contest (April 2015)29 slides · Apr 2, 2015
 Proxy Contest (March 2015)39 slides · Mar 30, 2015