Railamerica — Q1 2006 Earnings Presentation
15 slides from Railamerica's earnings presentation, Apr 27, 2006
Slide 1: First Quarter 2006 Financial Results
RailAmerica, Inc. First Quarter 2006 Financial Results April 27, 2006
Slide 2: Forward-Looking Statements and Forecasts
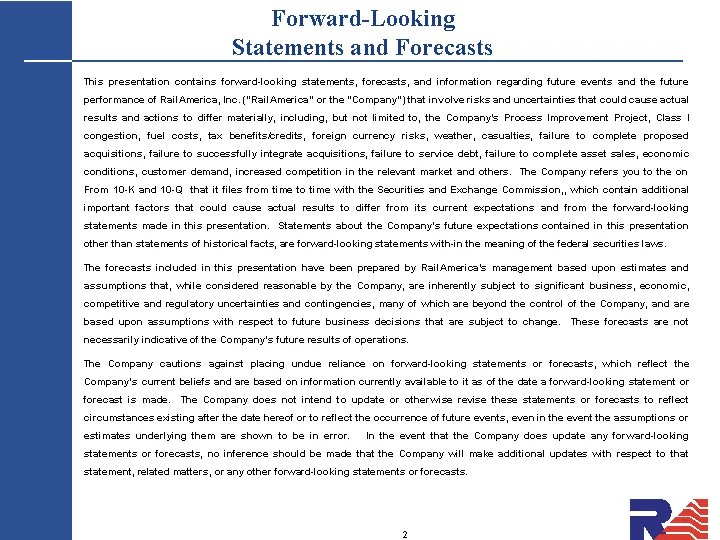
Forward-Looking Statements and Forecasts This presentation contains forward-looking statements, forecasts, and information regarding future events and the future performance of RailAmerica, Inc. ("RailAmerica" or the "Company") that involve risks and uncertainties that could cause actual results and
Slide 3: Charles Swinburn, Chief Executive Officer
Charles Swinburn Chief Executive Officer
Slide 4: First Quarter Summary
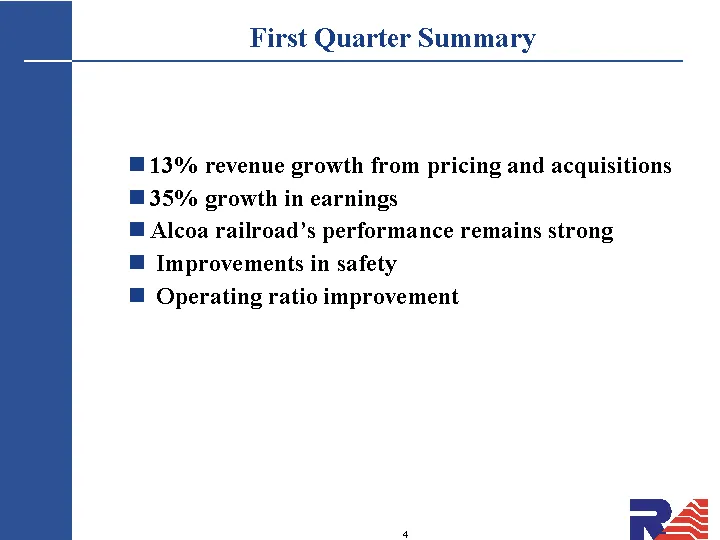
First Quarter Summary 13% revenue growth from pricing and acquisitions 35% growth in earnings Alcoa railroad's performance remains strong Improvements in safety Operating ratio improvement
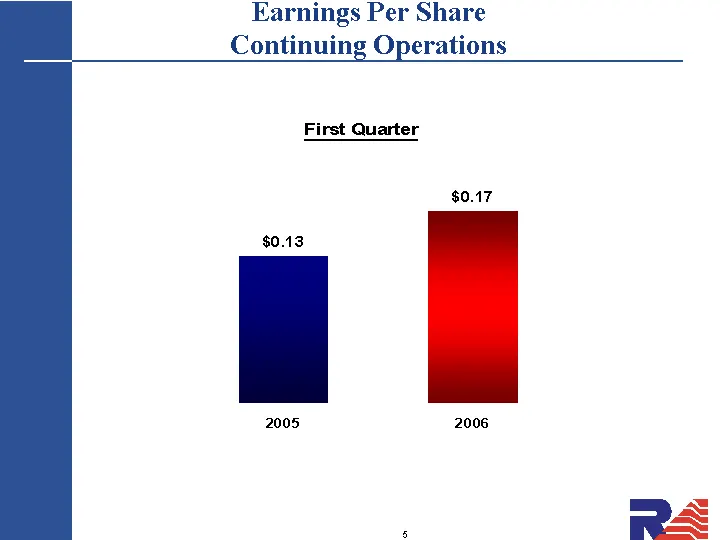
Slide 5: Earnings Per Share Continuing Operations
Earnings Per Share Continuing Operations 2005 2006 EPS 0.13 0.17
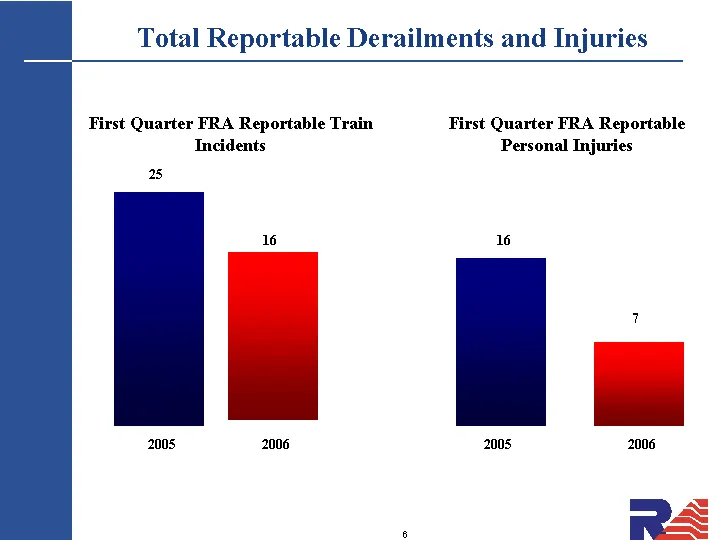
Slide 6: Total Reportable Derailments and Injuries
Total Reportable Derailments and Injuries 2005 2006 2006 2005 25 16 16 7 First Quarter FRA Reportable Train Incidents First Quarter FRA Reportable Personal Injuries
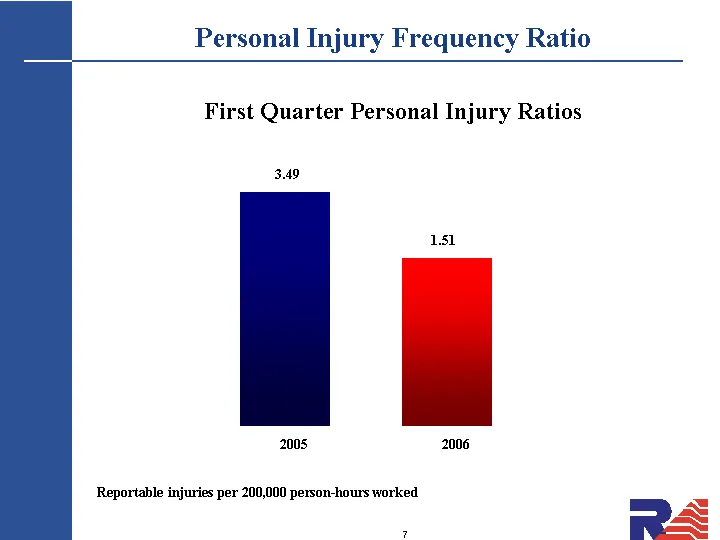
Slide 7: Personal Injury Frequency Ratio
Personal Injury Frequency Ratio First Quarter Personal Injury Ratios 2005 2006 3.49 1.51 Reportable injuries per 200,000 person-hours worked
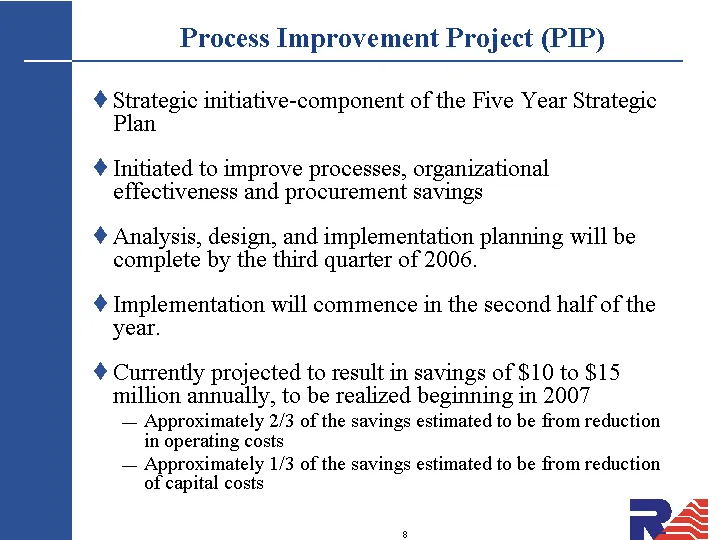
Slide 8: Process Improvement Project (PIP)
Process Improvement Project (PIP) Strategic initiative-component of the Five Year Strategic Plan Initiated to improve processes, organizational effectiveness and procurement savings Analysis, design, and implementation planning will be complete by the third quarter of 2006. Implementation will comme
Slide 9: Michael Howe, Executive Vice President and Chief Financial Officer
Michael Howe Executive Vice President and Chief Financial Officer
Slide 10: Income Statement
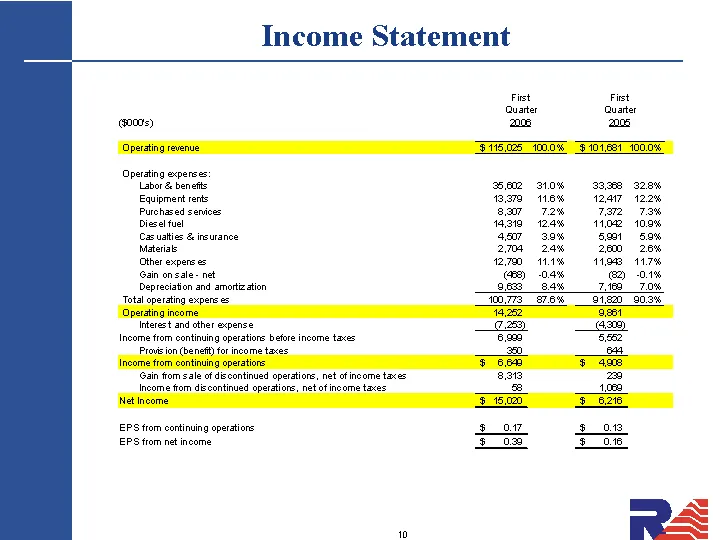
Income Statement Fist Fist Quarter Quarter 000s) 208 pos (Operatingrevenue FF. TO.O “SF AOTEST TOTO Operating expenses: Labor & benef som 910% same s28H Equipment rents wes tes zat 122% Purchared sendoee ea 72% 7372 73% Diesel fuel 1430 Ray | 140R 100% Cas uaties & neuranoe acu 39% Sam 5.0% Material
Slide 11: Operating Expenses as a Percentage of Revenue
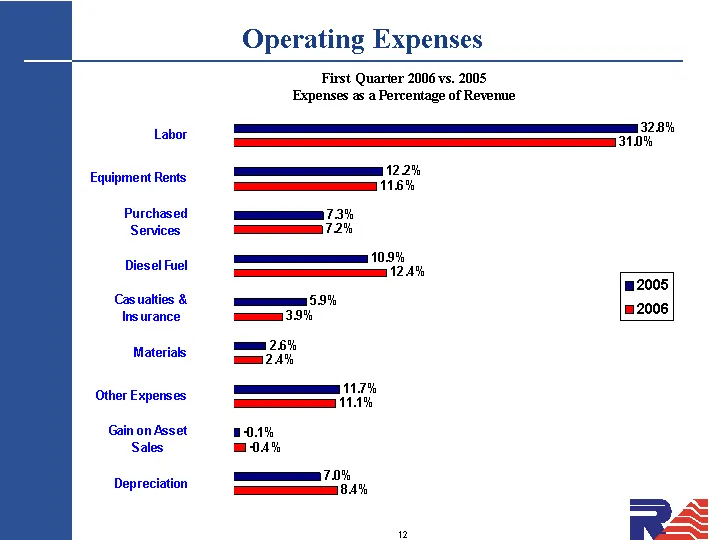
Operating Expenses Depreciation Gain on Asset Sales Other Expenses Materials Casualties & Insurance Diesel Fuel Purchased Services Equipment Rents Labor 2006 0.084 0.01 0.083 0.024 0.039 0.124 0.072 0.116 0.31 2005 0.07 0.005 0.086 0.026 0.059 0.109 0.073 0.121 0.328 First Quarter 2006 vs. 2005 Expe
Slide 12: Fuel
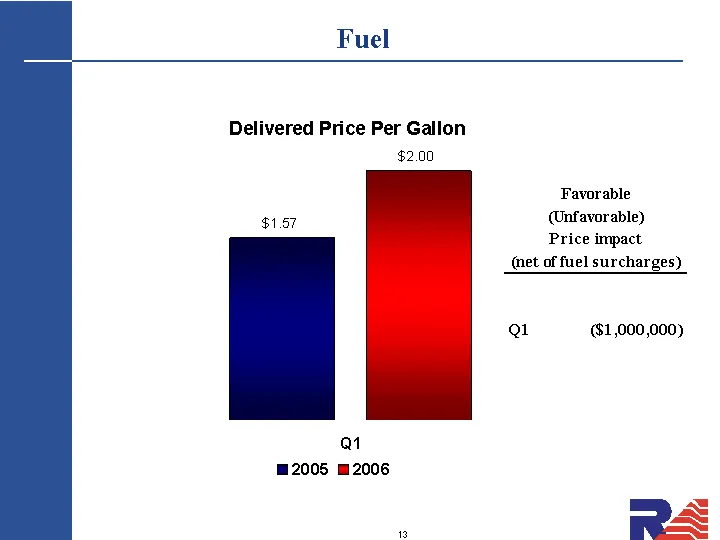
Fuel Delivered Price Per Gallon $2.00 $1.57 Qi 2005 ™ 2006 Favorable (Unfavorable) Price impact (net of fuel surcharges) a ($1,000,000) i
Slide 13: Balance Sheet Highlights
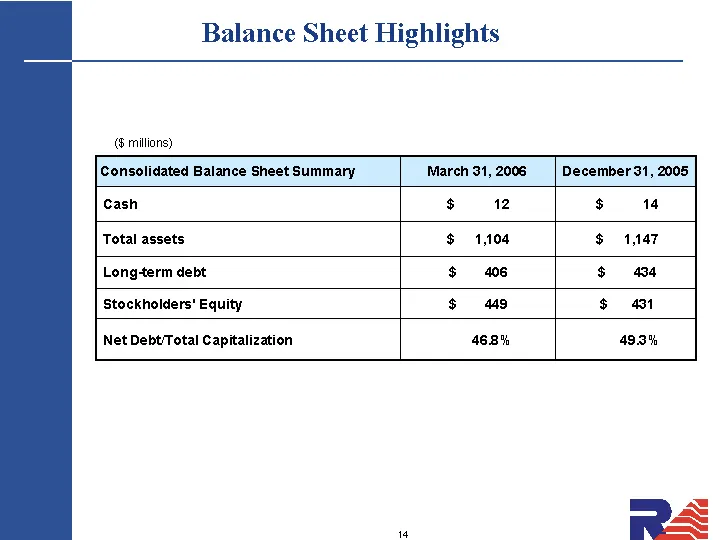
Balance Sheet Highlights ($ millions) Consolidated Balance Sheet Summary March 31, 2006 December 31, 2005 Cash $ 12 $ 14 Total assets $ 1,104 $ 1,147 Long-term debt $ 406 $ 434 Stockholders' Equity $ 449 $ 431 Net Debt/Total Capitalization 46.8% 49.3%
Slide 14: Charles Swinburn, Chief Executive Officer
Charles Swinburn Chief Executive Officer
Slide 15: Closing Comments
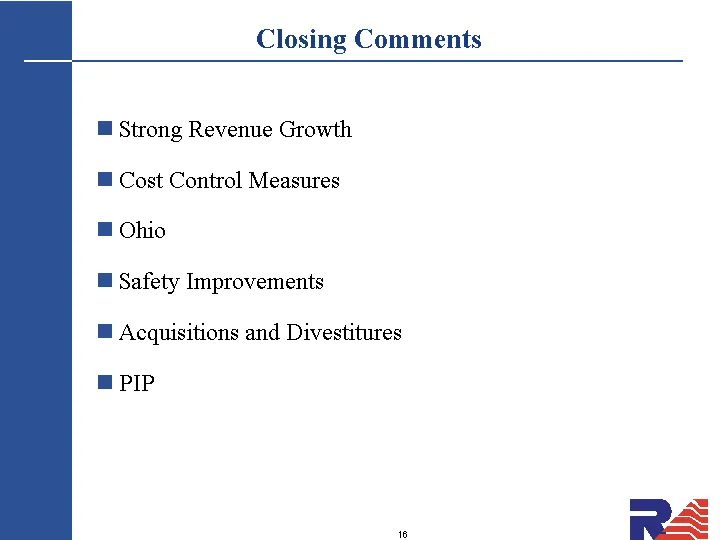
Closing Comments Strong Revenue Growth Cost Control Measures Ohio Safety Improvements Acquisitions and Divestitures PIP
Source: SEC EDGAR · 8-K filed Apr 27, 2006
More decks from Railamerica Inc
 Q2 2012 Earnings Presentation25 slides · Jul 25, 2012
 Q1 2012 Earnings Presentation29 slides · Apr 26, 2012
 Q4 2011 Earnings Presentation33 slides · Feb 9, 2012
 Q3 2011 Earnings Presentation28 slides · Oct 26, 2011
 Q2 2011 Earnings Presentation27 slides · Jul 28, 2011
 Q1 2011 Earnings Presentation28 slides · Apr 28, 2011