Furmanite — Q3 2009 Earnings Presentation
8 slides from Furmanite's earnings presentation, Nov 6, 2009
Slide 1: Furmanite Corporation Review of 3Q 2009
Furmanite Corporation Review of 3Q 2009 Michael Rose, Chairman & CEO Joseph Milliron, President & COO Miguel Desdin, Senior Vice President & CFO
Slide 2: Safe Harbor Statement
Safe Harbor Statement Certain of the Company's statements in this presentation are not purely historical, and as such are "forward-looking statements" within the meaning of the Private Securities Litigation Reform Act of 1995. These include statements regarding management's plans, beliefs, expectati
Slide 3: Consolidated Income Statements
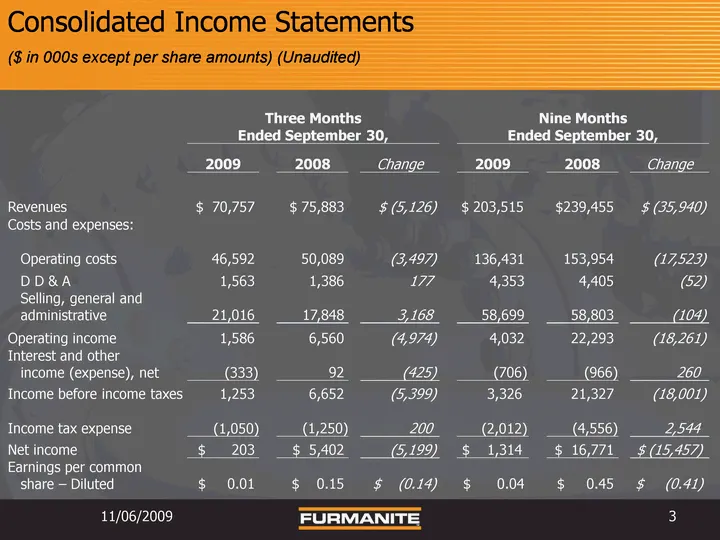
Consolidated Income Statements ($ in 000s except per share amounts) (Unaudited) 11/06/2009 3 Three Months Three Months Three Months Three Months Three Months Nine Months Nine Months Nine Months Nine Months Nine Months Ended September 30, Ended September 30, Ended September 30, Ended September 30, En
Slide 4: Adjustments for Currency Rates: Revenues
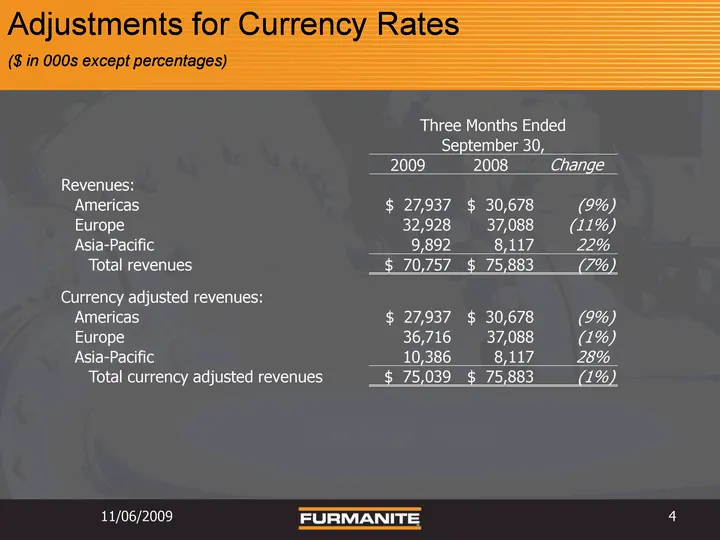
Adjustments for Currency Rates ($ in 000s except percentages) 11/06/2009 4 Three Months Ended Three Months Ended Three Months Ended September 30, September 30, September 30, 2009 2008 Change Revenues: Americas $ 27,937 $ 30,678 (9%) Europe 32,928 37,088 (11%) Asia-Pacific 9,892 8,117 22% Total reven
Slide 5: Adjustments for Currency Rates: Operating Income
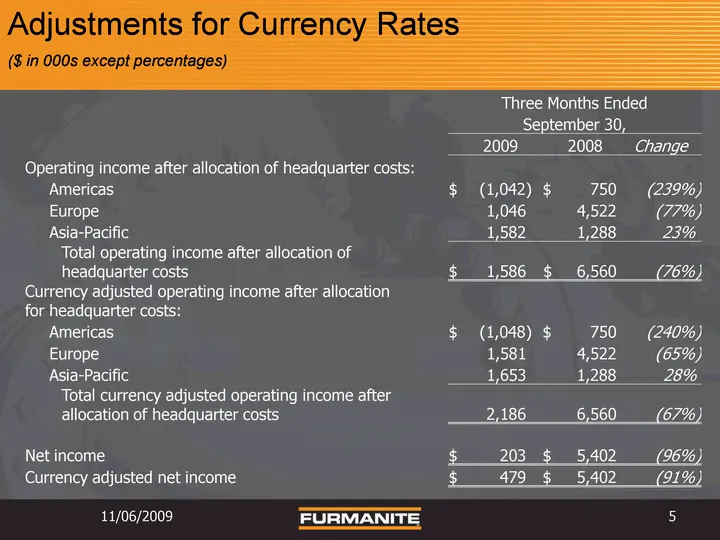
Adjustments for Currency Rates ($ in 000s except percentages) 11/06/2009 5 Three Months Ended Three Months Ended Three Months Ended September 30, September 30, September 30, 2009 2008 Change Operating income after allocation of headquarter costs: Americas $ (1,042) $ 750 (239%) Europe 1,046 4,522 (7
Slide 6: Condensed Consolidated Balance Sheets
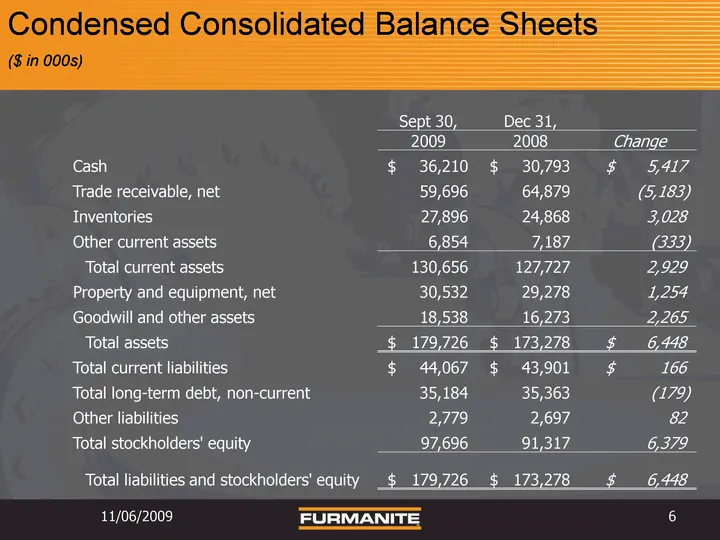
Sept 30, Dec 31, 2009 2008 Change Cash $ 36,210 $ 30,793 $ 5,417 Trade receivable, net 59,696 64,879 (5,183) Inventories 27,896 24,868 3,028 Other current assets 6,854 7,187 (333) Total current assets 130,656 127,727 2,929 Property and equipment, net 30,532 29,278 1,254 Goodwill and other assets 18,
Slide 7: Consolidated Condensed Cash Flows
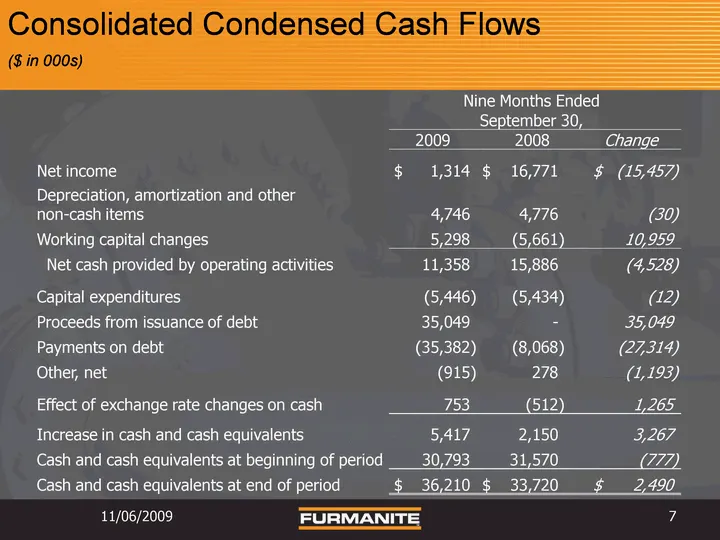
Consolidated Condensed Cash Flows ($ in 000s) 11/06/2009 7 Nine Months Ended Nine Months Ended Nine Months Ended September 30, September 30, September 30, 2009 2008 Change Net income $ 1,314 $ 16,771 $ (15,457) Depreciation, amortization and other non-cash items 4,746 4,776 (30) Working capital chan
Slide 8: Furmanite Corporation Review of Q3 2009
Furmanite Corporation Review of Q3 2009 11/06/2009 8
Source: SEC EDGAR · 8-K filed Nov 6, 2009
More decks from Furmanite Corp
 Merger or Acquisition (November 2015)13 slides · Nov 2, 2015
 Q2 2015 Earnings Presentation19 slides · Aug 4, 2015
 Q1 2015 Earnings Presentation16 slides · May 11, 2015
 Proxy Contest (April 2015)40 slides · Apr 2, 2015
 Proxy Contest (April 2015)29 slides · Apr 2, 2015
 Proxy Contest (March 2015)39 slides · Mar 30, 2015