Ubiquitel — Investor Presentation (September 2004)
23 slides from Ubiquitel's investor presentation, Sep 10, 2004

Slide 1: ded biquitet
ded biquitet
Slide 2: Forward-looking statements
Abiquitet Statements made during this presentation that are forward- looking statements are subject to various risks and uncertainties. Such forward-looking statements are made pursuant to the “safe-harbor” provisions of the Private Securities Litigation Reform Act of 1995 and are made based on mana
Slide 3: Key Investment Highlights
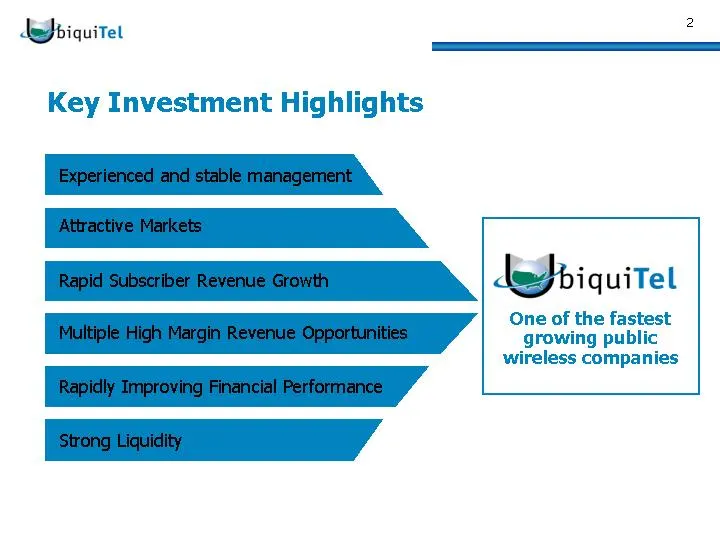
Abiquitet Key Investment Highlights deJbiquitet One of the fastest growing public wireless companies
Slide 4: Footprint Critical To Sprint PCS
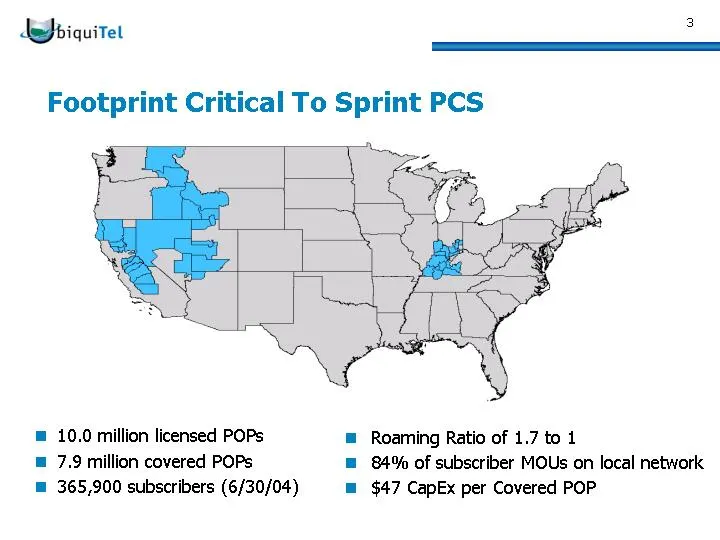
Abiquitet 3 Footprint Critical To Sprint PCS = 10.0 million licensed POPs ™ Roaming Ratio of 1.7 to 1 = 7.9 million covered POPs = 84% of subscriber MOUs on local network ™ 365,900 subscribers (6/30/04) = $47 CapEx per Covered POP
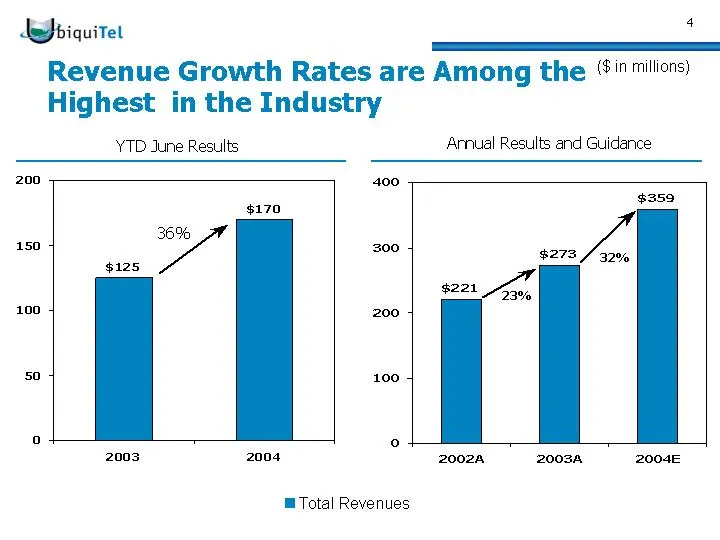
Slide 5: Revenue Growth Rates are Among the Highest in the Industry
Abiquitet E Revenue Growth Rates are Among the @"™lons) Highest in the Industry YTD June Results Arnual Results and Guidance 200 400 359 $170 AN 150 36% 300 a Coa $125 g221_ | ah te 200 50 100 9 ° 2003 2004 2002A 2002 2004E Total Revenues
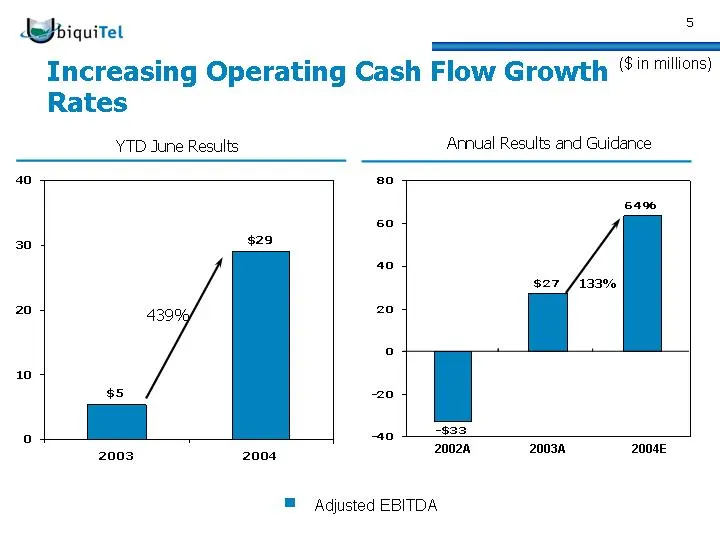
Slide 6: Increasing Operating Cash Flow Growth Rates
AM oiquitet Increasing Operating Cash Flow Growth ©!" ™llon) Rates YTD June Results 5 Arnual Results and Guidance 40 30 20 10 20 60 $29 40 $27 /133% 439! ae ect $5 20 | La sH0% Sad 20020 20038 2004 ™ Adjusted EBITDA
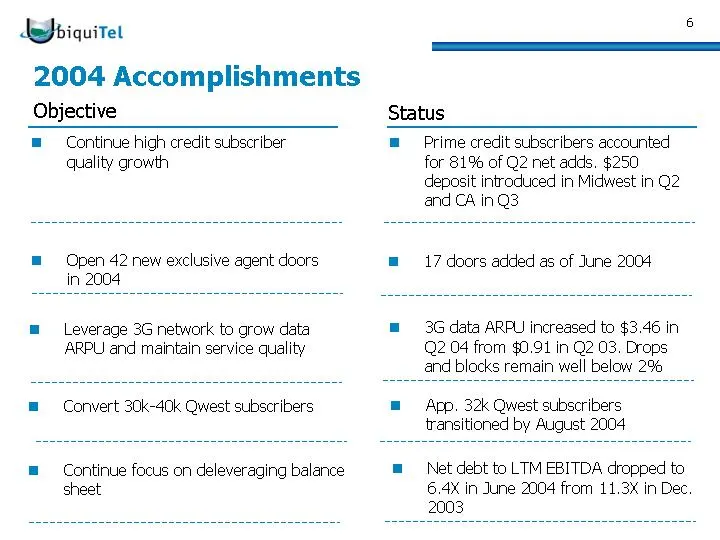
Slide 7: 2004 Accomplishments
Abiquitet Z 2004 Accomplishments Objective Status ® ~~ Continue high credit subscriber m@ = Prime credit subscribers accounted quality growth for 81% of Q2 net adds. $250 deposit introduced in Midwest in Q2 and CA inQ3 m Open 42 new exclusive agent doors = 17 doors added as of June 2004 in 2004 = Le
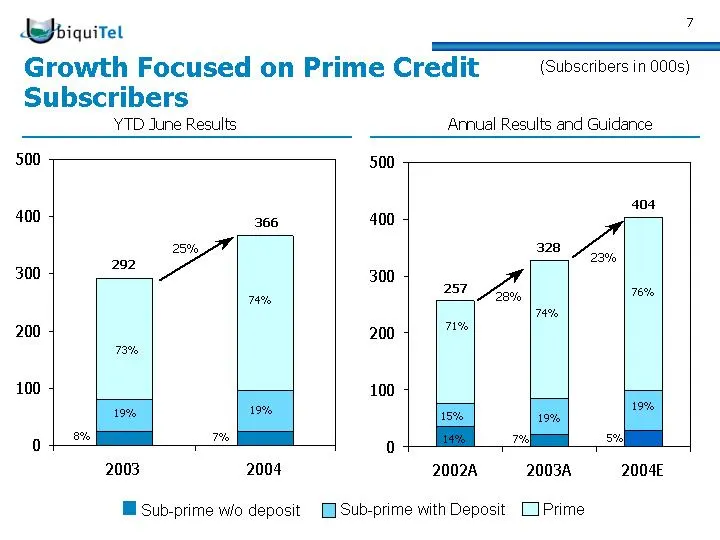
Slide 8: Growth Focused on Prime Credit
Abiquitet Growth Focused on Prime Credit (Subscribers in 000s) 7 SE Subscribers YTD June Results Arnual Results and Guidance 500 500 400 366 400 ae 300 202 300 257 74% 200 200 ae 73% 100 | 100 ol 1% 0 2003 2004 2002A 2003A 2004E Bi Sub-prime wo deposit [Sub-prime with Deposit [Prime
Slide 9: Increasing Focus on Exclusive Distribution
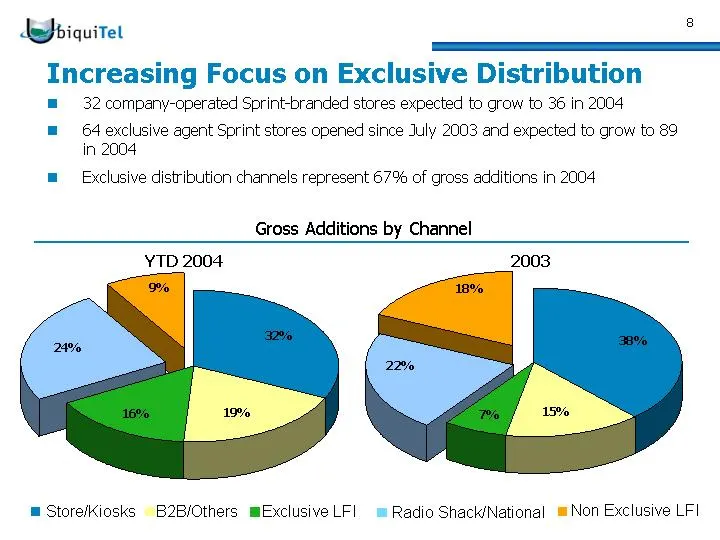
Abiquitet 8 Increasing Focus on Exclusive Distribution ™ 32. company-operated Sprint-branded stores expected to grow to 36 in 2004 = 64 exclusive agent Sprint stores opened since July 2003 and expected to grow to 89 in 2004 = Exclusive distribution channels represent 67% of gross additions in 2004 G
Slide 10: Strong PCS Vision Sales Momentum
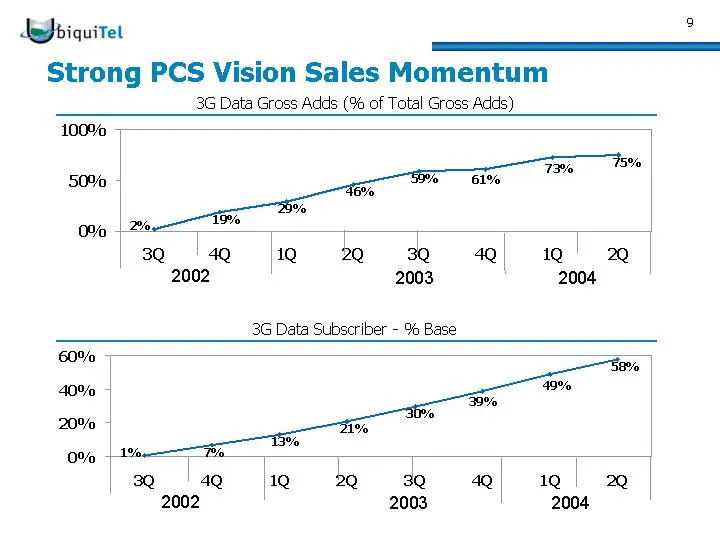
Abiquitet 2 Strong PCS Vision Sales Momentum 3G Data Gross Adds (% of Total Gross Adds) 100% 50% % 3Q 4Q lic bo 30 4Q 1Q 2Q 2002 2003 2004 3G Data Subscriber - % Base 60% 40% 20% 0%
Slide 11: 1XRTT Driving High Performing Network
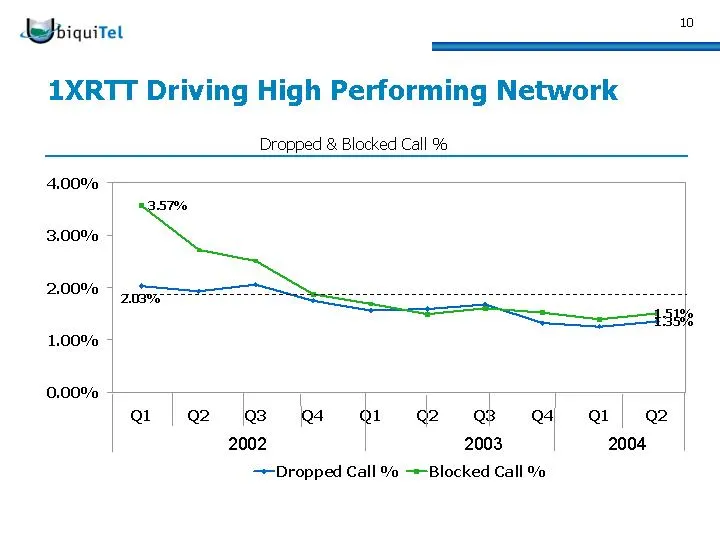
Abiquitet 10 1XRTT Driving High Performing Network Dropped & Blocked Call % 4,00% 3,00% 2.00% 1,00% 0.00% Ql | @ a @ 2004 | as a4 a @ e a4 2002 2003 ——Dropped Call % —-=-Blocked Call %
Slide 12: Rapid Subscriber Revenue Growth
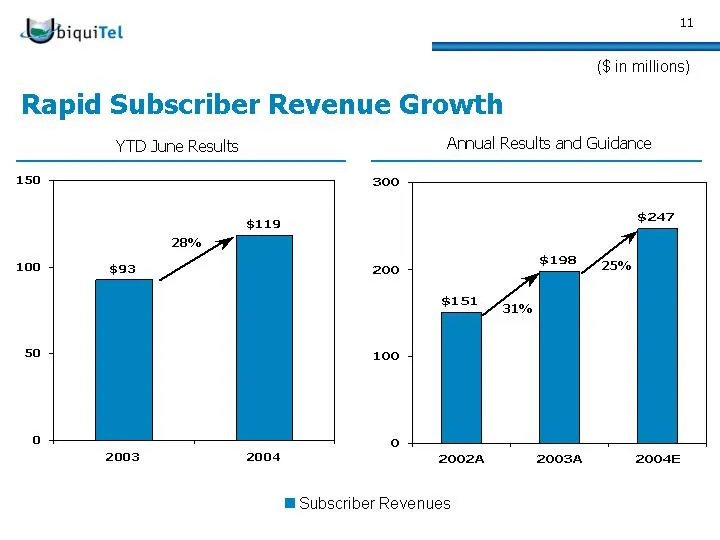
Abiquitet Bh (Gin millions) Rapid Subscriber Revenue Growth YTD June Results Arnual Results and Guidance 150 300 $119 20% 100 $93 ye 200 $198 25% $151 Aro 50 100 o oO 2003 2004 2002 —«2003A.——«200E @ Subscriber Revenues
Slide 13: 3G Data ARPU Ahead of Plan
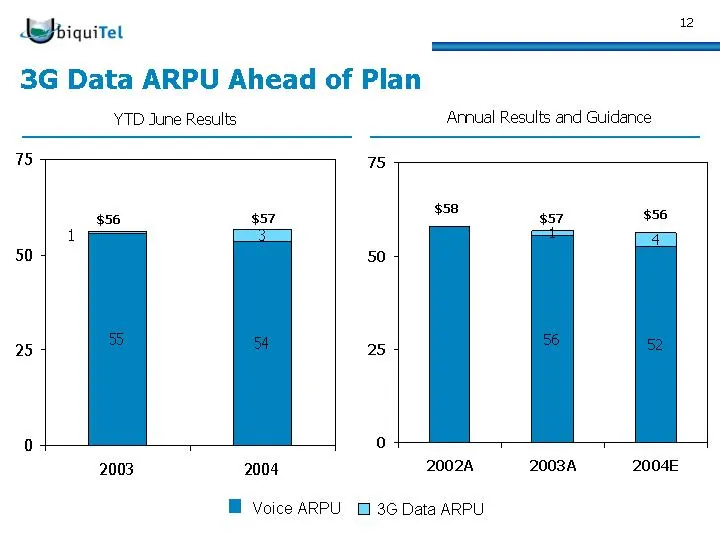
deJbiquitet Ey 3G Data ARPU Ahead of Plan YTD June Results Annual Results and Guidance 75 ¥ $56 $57 S58) $57 $56 1 poll 50 50 25 25 0 0 2003 2004 2002A 20034 2004€ B Voice ARPU 3G Data ARPU
Slide 14: High Margin Wholesale Revenue Growth
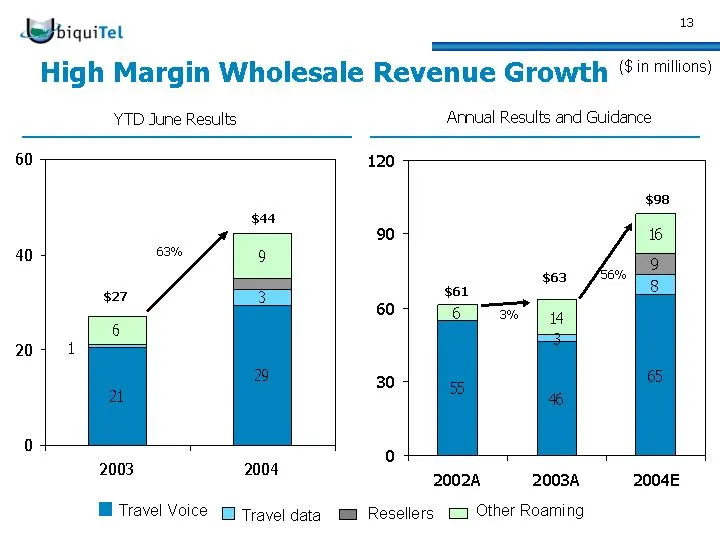
Abiquitet 8 High Margin Wholesale Revenue Growth @' millions) YTD June Results Arnual Results and Guidance 60 120 $98 90 40 63% é $63 $27 61 60 a 6 204 1 30 0 2003 2004 ° 2002A 20038 2004E HM Travel Voice travel data G& Resellers (4 Other Roaming
Slide 15: Improving Cash Cost Per User
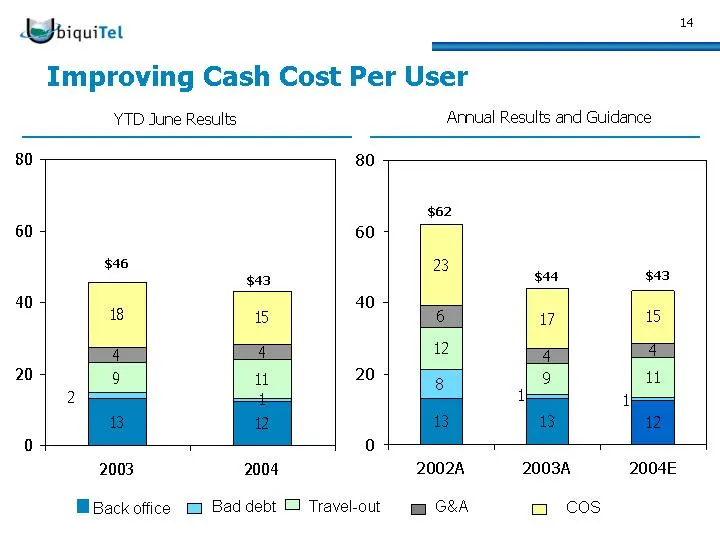
Abiquitet Improving Cash Cost Per User YTD June Results 14 SE Arnual Results and Guidance 80 60 40 20 80 60 40 20 2003 2004 BBack office Bad debt © Travel-out 20024 20034 2004E wm G&A cos
Slide 16: Strong Liquidity & Generating Free Cash Flow
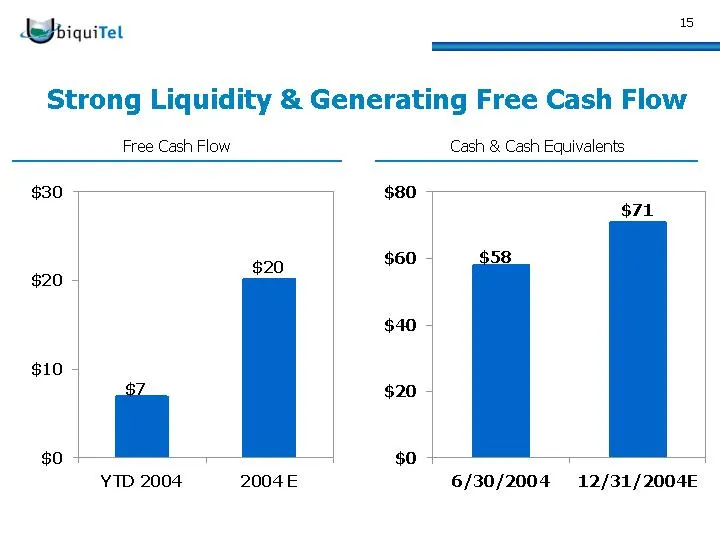
deJbiquitet 5 Strong Liquidity & Generating Free Cash Flow Free Cash Flow Cash & Cash Equivalents $30 $80. $71 $60 — 5B goo | $20 $40 | $10 - || $20 - $0 $0 YTD 2004 2004 E 6/30/2004 12/31/2004E
Slide 17: De-Levering Balance Sheet
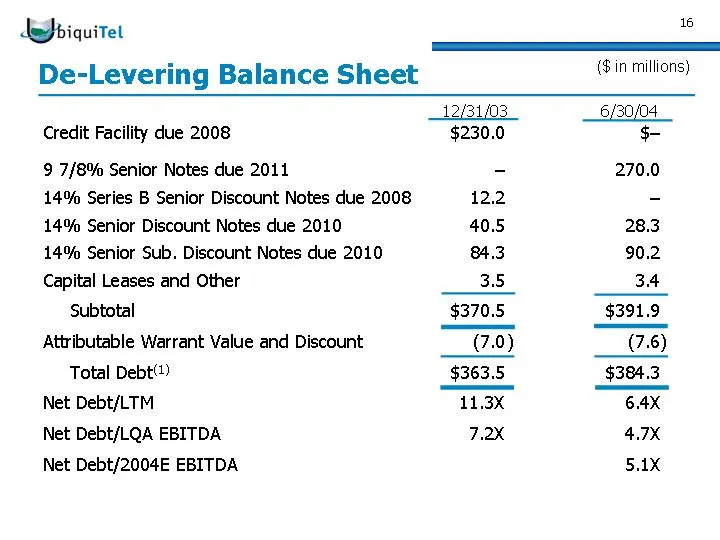
AM oiquitet ES De-Levering Balance Sheet {Sin millions) 12/31/03 6/30/04 Credit Facility due 2008 $230.0 $- 9 7/8% Senior Notes due 2011 - 270.0 14% Series B Senior Discount Notes due 2008 12.2 - 14% Senior Discount Notes due 2010 40.5 14% Senior Sub. Discount Notes due 2010 Capital Leases and Other
Slide 18: Focused on Execution and Developing New Catalysts for Growth
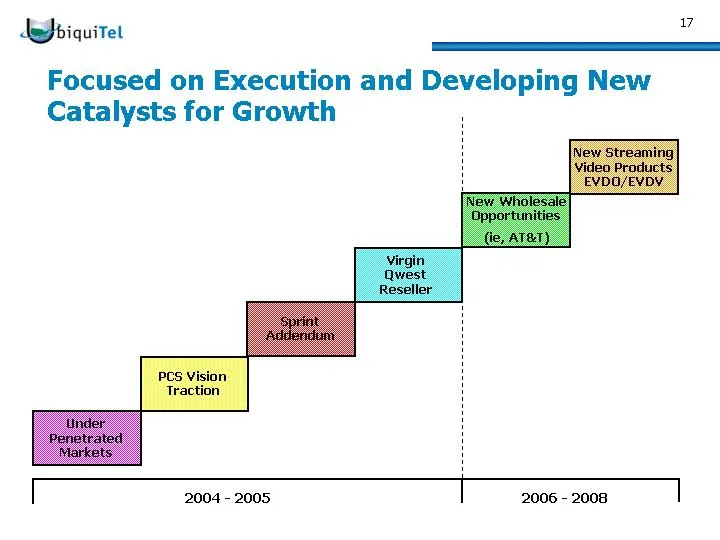
Abiquitet ¥ Focused on Execution and Developing New Catalysts for Growth 2004 - 2005 2006 - 2008
Slide 19: Grow 2006 and Beyond with Next Generation Technology
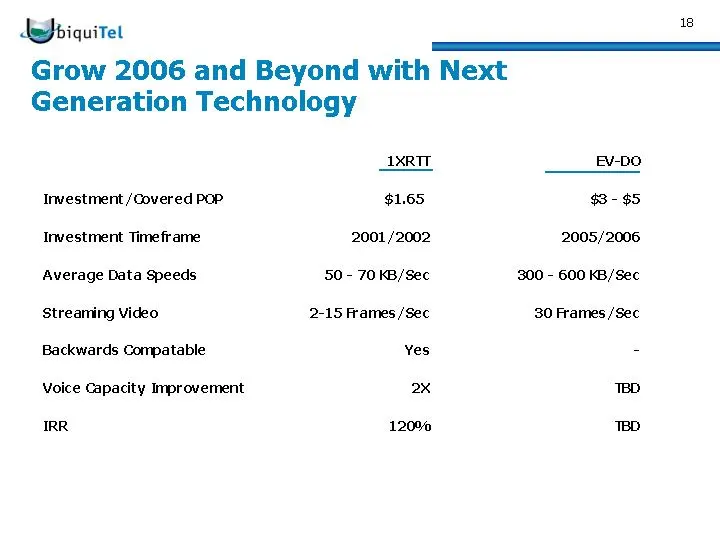
Abiquitet Grow 2006 and Beyond with Next Generation Technology Investment / Covered POP Investment Timeframe Average Data Speeds Streaming video Backwards Compatable Voice Capacity Improvement IRR 41xRTT $1.65 2001/2002 50 - 70 KB/Sec 2-15 Frames /Sec Yes 2x 120% EV-DO $3- $5 2005/2006 300 - 600 KB/
Slide 20: Key Investment Highlights
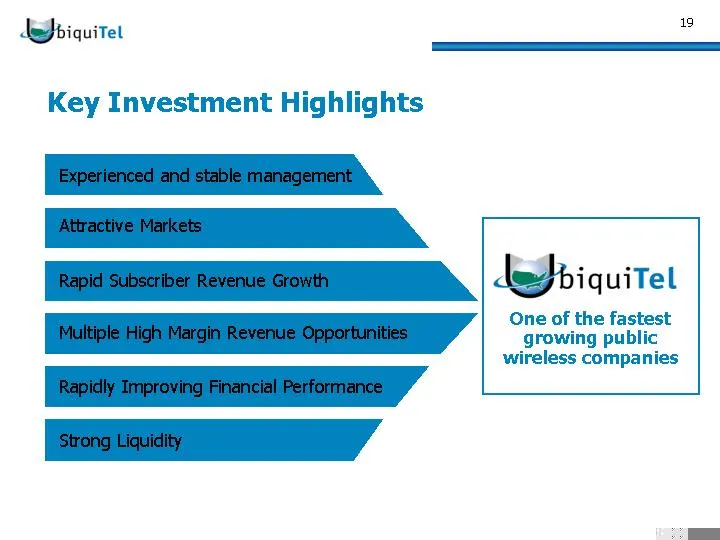
Abiquitet Key Investment Highlights 19 deJbiquitet One of the fastest growing public wireless companies
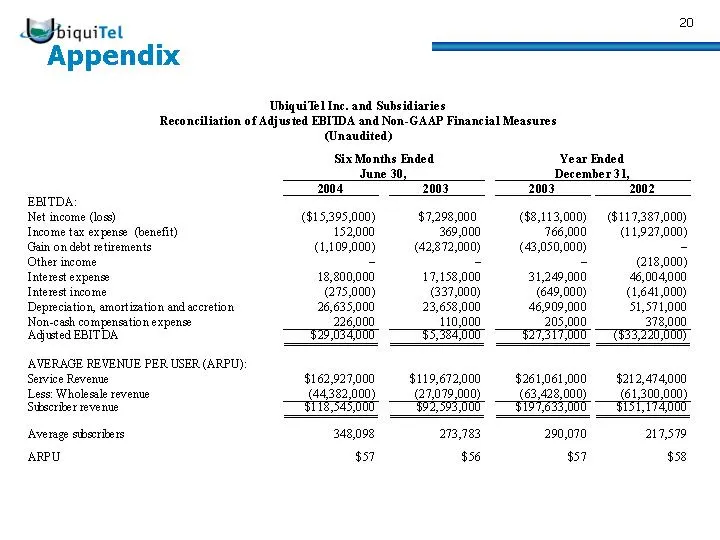
Slide 21: Appendix: Reconciliation of Adjusted EBITDA and Non-GAAP Measures
Abiquitet Appendix UbiquiTel Inc. and Subsidiaries Reconciliation of Adjusted EBITDA and Non-GAAP Financial Measures EBITDA: Net income (loss) Income tax expense (benefit) Gain on debt retirements Other income Interest expense Interest income Depreciation, amortization and accretion Non-cash compens
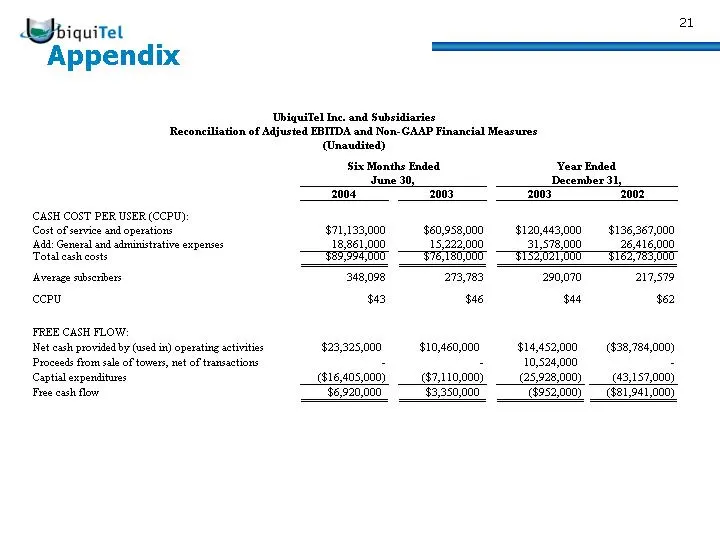
Slide 22: Appendix: Cash Cost Per User and Free Cash Flow
Abiquitet Appendix CASH COST PER USER (CCPU} Cost of service and operations ‘Add: General and administrative expenses Total eash costs Average subsevbers cory FREE CASH FLOW: Net cash provided by (used in) operating actvitis Proceeds fiom sal of towers, nat of tranwactions Captial expenditures Free
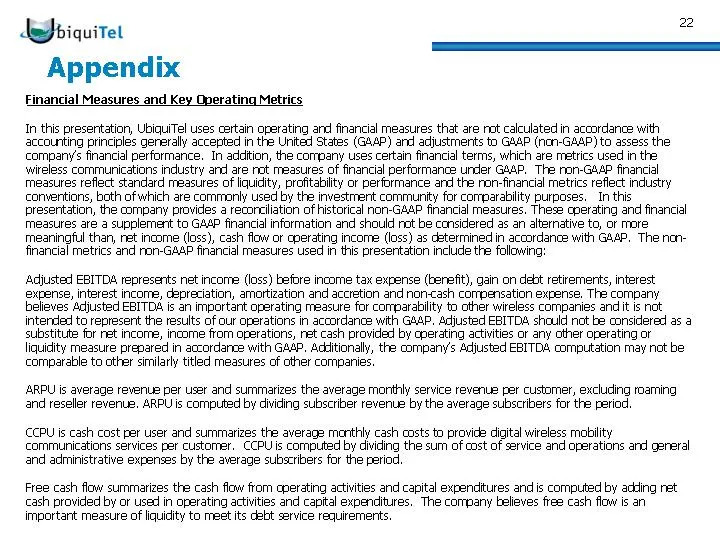
Slide 23: Searchable text section of graphics shown above
Searchable text section of graphics shown above [ LOG O] [ LOG O] Statements made during this presentation that are forward-looking statements are subject to various risks and uncertainties. Such forward-looking statements are made pursuant to the “safe-harbor” provisions of the Private Securities L
Source: SEC EDGAR · 8-K filed Sep 10, 2004