Ubiquitel — Investor Presentation (March 2004)
14 slides from Ubiquitel's investor presentation, Mar 19, 2004

Slide 1: Link to searchable text of slide shown above
Link to searchable text of slide shown above
Slide 2: Link to searchable text of slide shown above
Link to searchable text of slide shown above
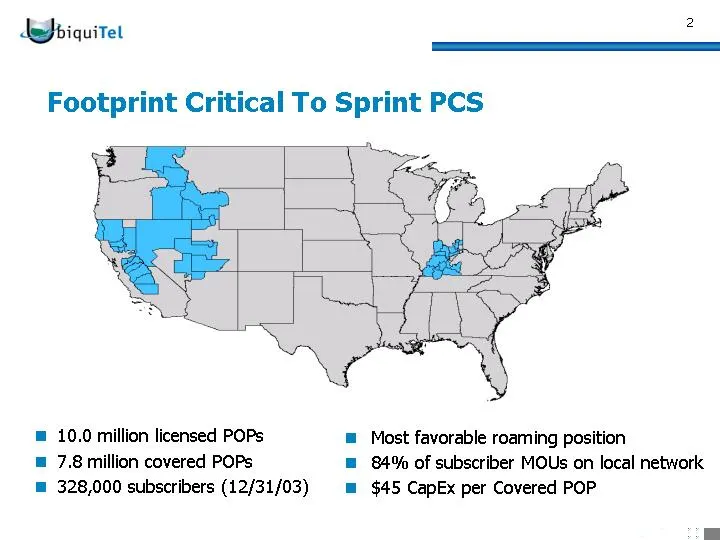
Slide 3: Footprint Critical To Sprint PCS
Abiquitet 2 Footprint Critical To Sprint PCS = 10.0 million licensed POPs = Most favorable roaming position = 7.8 million covered POPs = 84% of subscriber MOUs on local network ™ 328,000 subscribers (12/31/03) m $45 CapEx per Covered POP
Slide 4: 2004 Success based on 2003 Accomplishments
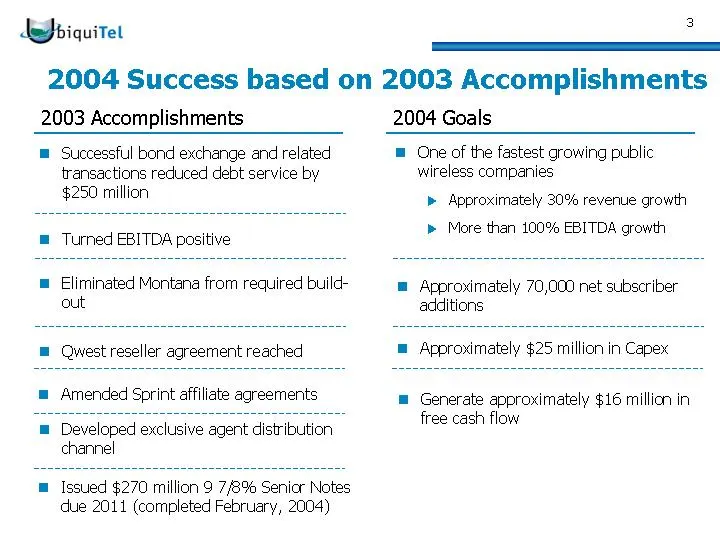
Abiquitet 2004 Success based on 2003 Accomplishments 2003 Accomplishments 2004 Goals = Successfull bond exchange and related transactions reduced debt service by $250 million ® Turned EBITDA positive Eliminated Montana from required build- out Qwest reseller agreement reached Amended Sprint affiliat
Slide 5: Benefits of New Sprint Amendment
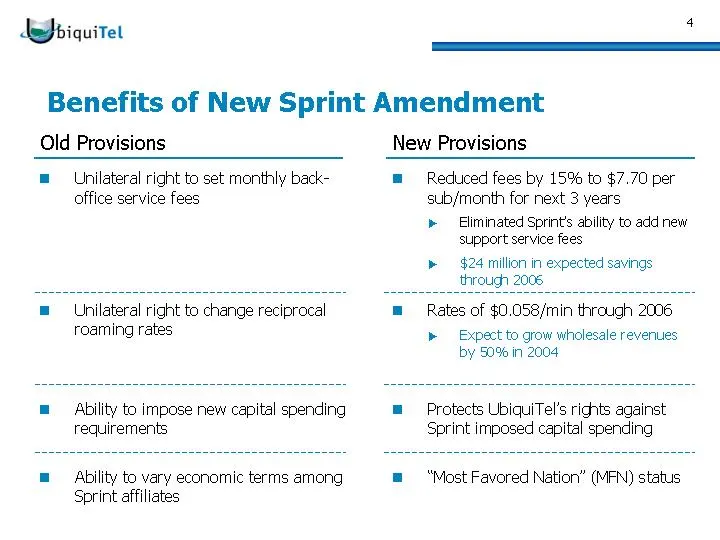
Abiquitet E Benefits of New Sprint Amendment Old Provisions New Provisions = Unillateral right to set monthly back- m Reduced fees by 15% to $7.70 per office service fees sub/month for next 3 years > Eliminated Sprint’s ability to add new support service fees » — $24 milion in expected savings throu
Slide 6: High Margin Revenue Opportunities
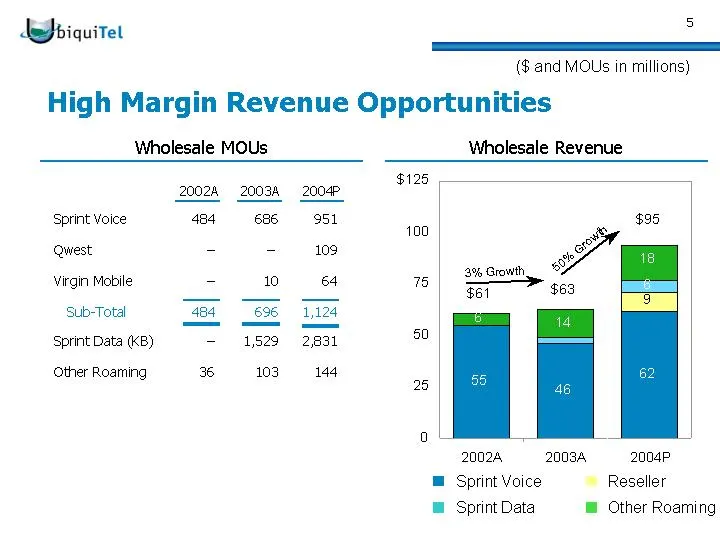
Abiquitet ($ and MOUs in millions) High Margin Revenue Opportunities Wholesale MOUs Wholesale Revenue Sprint Voice Qwest: Virgin Mobile Sub-Total Sprint Data (KB) Other Roaming 20024 484 36 20034 686 2004 981 109 $125 100 3% Growth 75 $61 50 25 0 20024 20034 2004P ™ Sprint Voice Reseller © Sprint Da
Slide 7: Significant Traction on Subscriber Growth
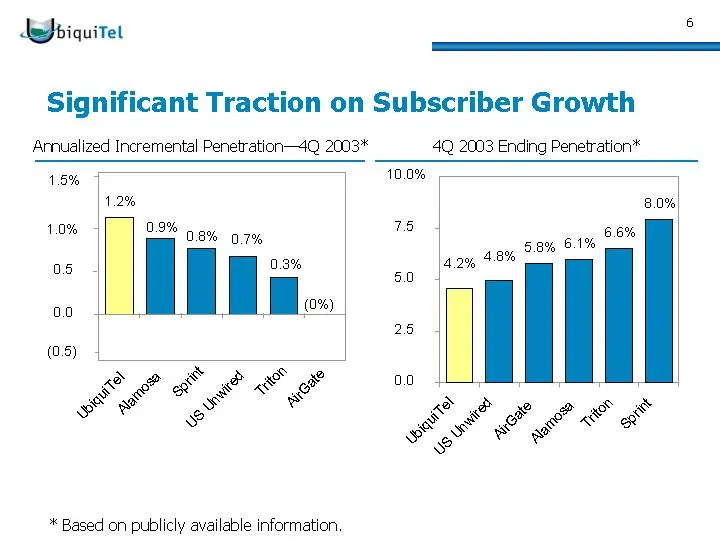
Abiquitet Sign Arnualized Incremental Penetration—4Q 2003* icant Traction on Subscriber Growth 4Q 2003 Ending Penetration* 09% nom o-7% * Based on publicly available information. 10.0% 75 25
Slide 8: Growth Focused on Prime Credit Subscribers
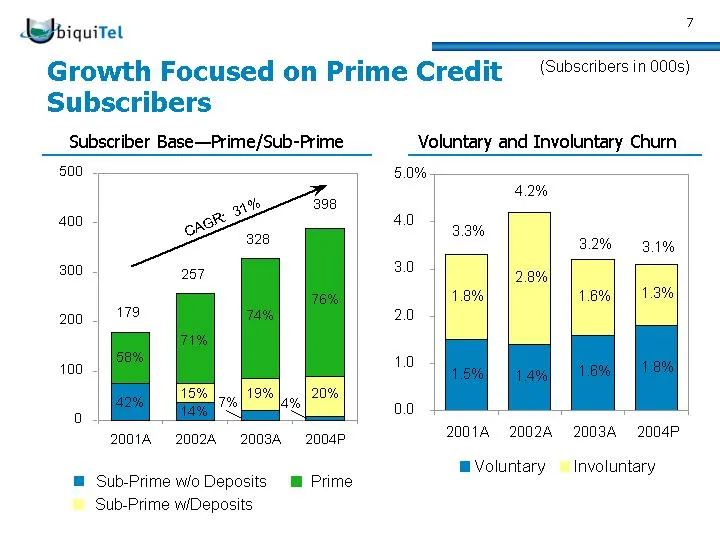
deJbiquitet 3 Growth Focused on Prime Credit = Sv?scribers in 000s) Subscribers Subscriber Base—Prime/Sub-Prime Voluntary and Involuntary Churn 500 | 5.0% 00 40 32% 3.1% 300 3.0 200 20 100 10 oo 2onve 2002 20034. 2c0aP 20014 20028 20034 2004P mVoluntary — Involuntary 1 Sub-Prime wio Deposits m™ Prim
Slide 9: 1XRTT 3G Data Network: Growing ARPU & High Performing
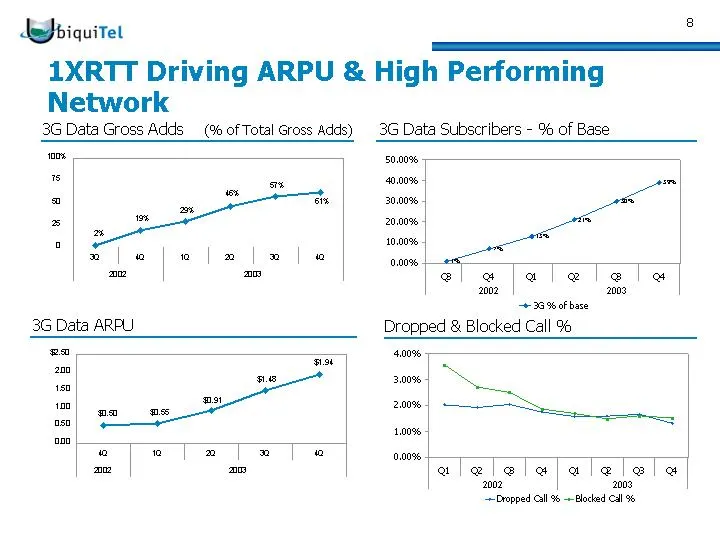
AAbiquitet 1XRTT Dr Network 3G Data Gross Adds (96 of Total Gross Adds) ing ARPU & High Performing 3G Data Subscribers - % of Base om = . vs owe pe er 30.00%, ” a : io The jelatela con | esate 3G Data ARPU Dropped & Blacked Call 96 = oe 100 pe 2.0096, oa 1.00% o oe | m | » | @ 0.00% + “= Dropped Cal
Slide 10: Improving Cost Structure and Profitability
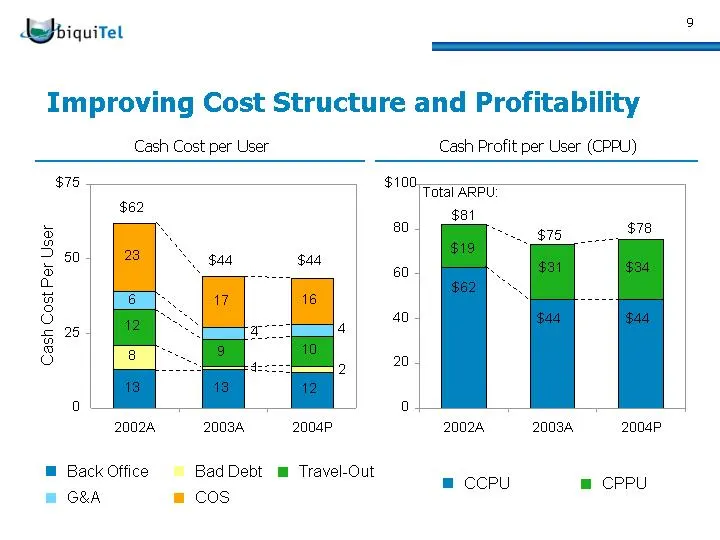
deJbiquitet Improving Cost Structure and Profitability Cash Cost per User Cash Profit per User (CPPU) $28 #100 Total ARPU: $62 $81 25 Cash Cost Per User 20024 20084 2004p 20024 20084 2004p @ Back Office BadDebt m Travel-Out m= G&A = cos a @ CCPU m CPPU
Slide 11: Fastest Growing Public Wireless Carrier
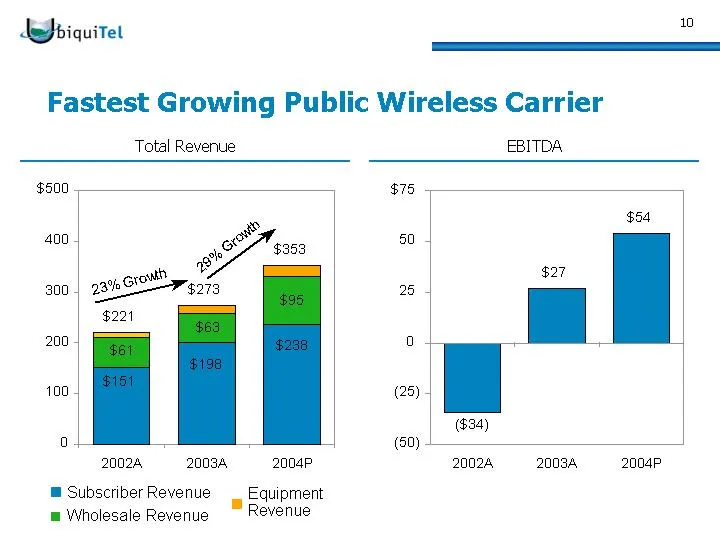
deJbiquitet Fastest Growing Public Wireless Carrier 10 Total Revenue EBITDA $500 $78 $54 400 50 $27 300 26 200 a 100 (28) (634) al (60) 20024 20034 2004P 20024 20034 2004r m Subscriber Revenue _ Equipment Revenue m Wholesale Revenue
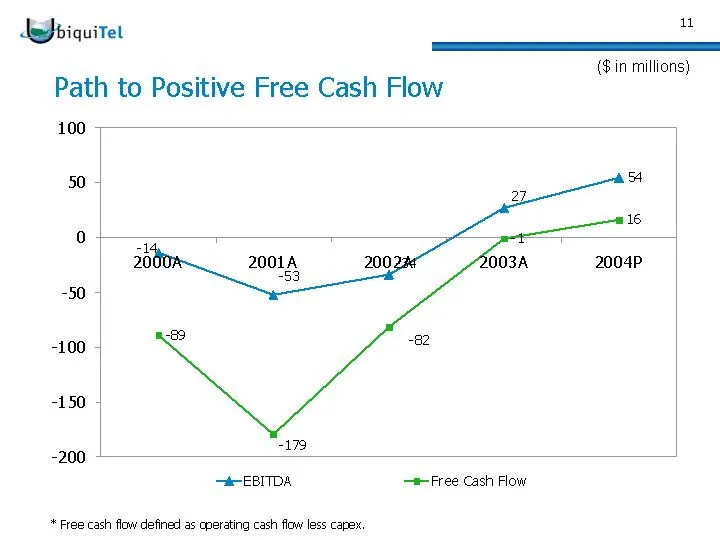
Slide 12: Path to Positive Free Cash Flow
Abiquitet Bh SS ($ in millions) Path to Positive Free Cash Flow 100 50 -100 -150 -179 -200 —t- EBITDA —=-Free Cash Flow * Free cash flow defined as cperating cash flow less capex.
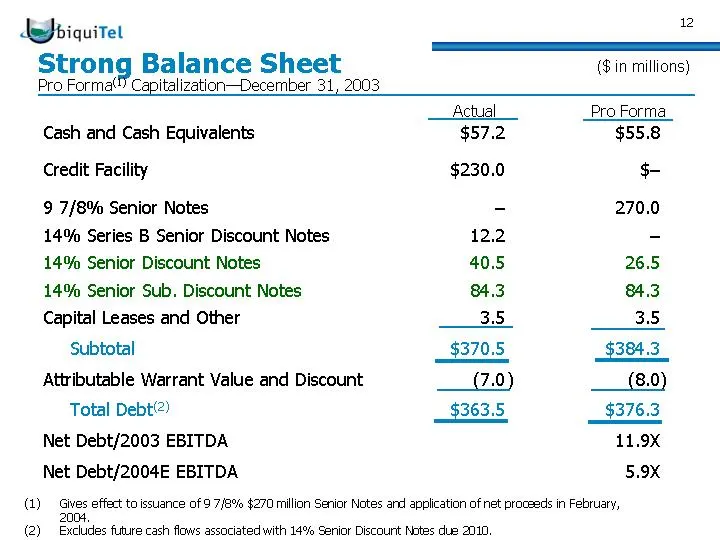
Slide 13: Strong Balance Sheet
Abiquitet 2 SE Strong Balance Sheet (6 in millions) Pro Format} Capitalization—December 31, 2003 Actual Pro Forma. Cash and Cash Equivalents $57.2 $55.8 Credit Facility $230.0 - 9 7/8% Senior Notes - 270.0 14% Series B Senior Discount Notes 12.2 - 14% Senior Discount Notes 40.5 26.5 14% Senior Sub.
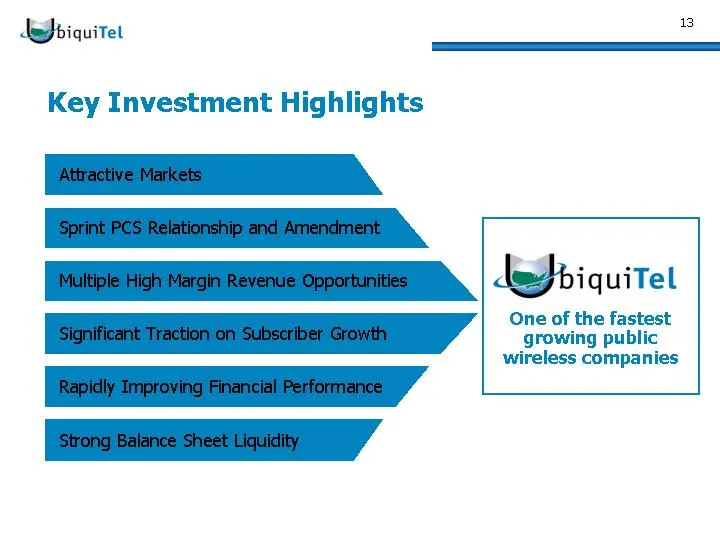
Slide 14: Link to searchable text of slide shown above
Link to searchable text of slide shown above Searchable text section of graphics shown above [LOGO] [LOG O] Statements made during this presentation that are forward-looking statements are subject to various risks and uncertainties. Such forward-looking statements are made pursuant to the “safe-harb
Source: SEC EDGAR · 8-K filed Mar 19, 2004