Quovadx — Carescience — Merger or Acquisition (August 2003)
29 slides from Quovadx's merger presentation, Aug 14, 2003
Slide 1: Web Services Anywhere
Web Services Anywhere Access Any Data Perform Any Process From Anywhere...
Slide 2: Additional Information Regarding the CareScience Acquisition
Additional Information Regarding the CareScience Acquisition In this presentation we will be discussing Quovadx's proposed anticipated acquisition of CareScience, Inc. Quovadx intends to commence an exchange offer for the outstanding shares of CareScience and to file with the Securities and Exchange
Slide 3: Forward-Looking Statements
Forward-Looking Statements Certain statements in this presentation are "forward-looking statements" within the meaning of the the Private Securities Litigation Reform Act of 1995, including statements regarding the timing and expected completion of the CareScience acquisition, the anticipated effect
Slide 4: Quovadx Announces Acquisition of CareScience
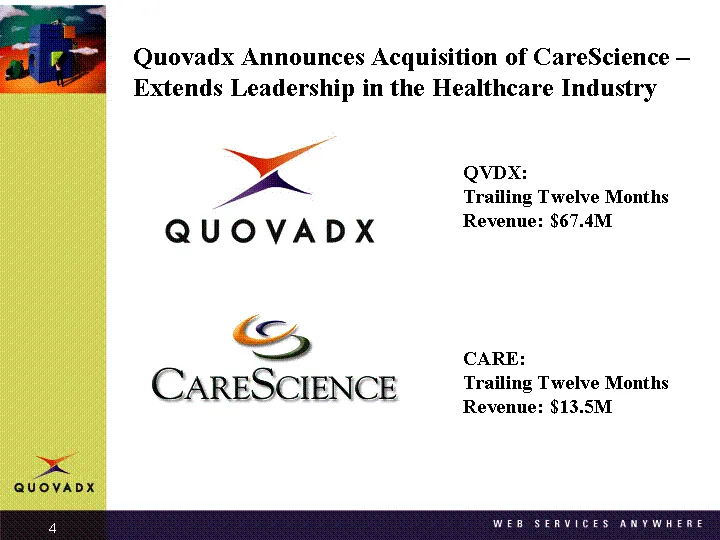
Quovadx Announces Acquisition of CareScience - Extends Leadership in the Healthcare Industry QVDX: Trailing Twelve Months Revenue: $67.4M CARE: Trailing Twelve Months Revenue: $13.5M
Slide 5: CareScience Acquisition
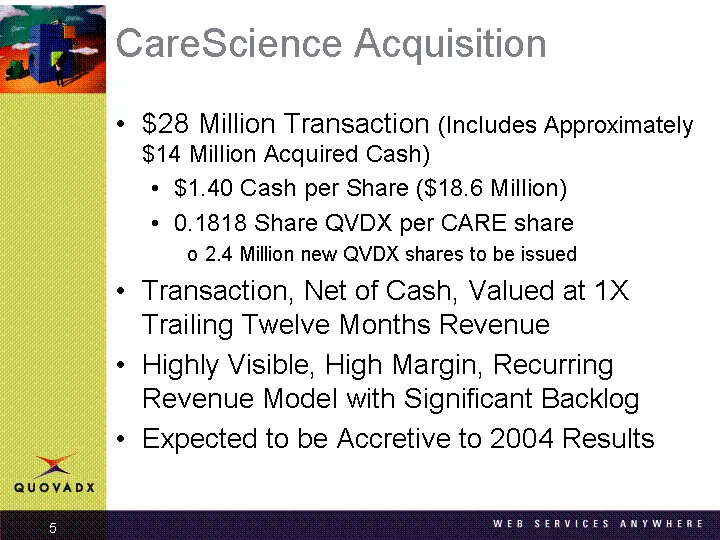
CareScience Acquisition $28 Million Transaction (Includes Approximately $14 Million Acquired Cash) $1.40 Cash per Share ($18.6 Million) 0.1818 Share QVDX per CARE share 2.4 Million new QVDX shares to be issued Transaction, Net of Cash, Valued at 1X Trailing Twelve Months Revenue Highly Visible, High
Slide 6: CareScience at a Glance
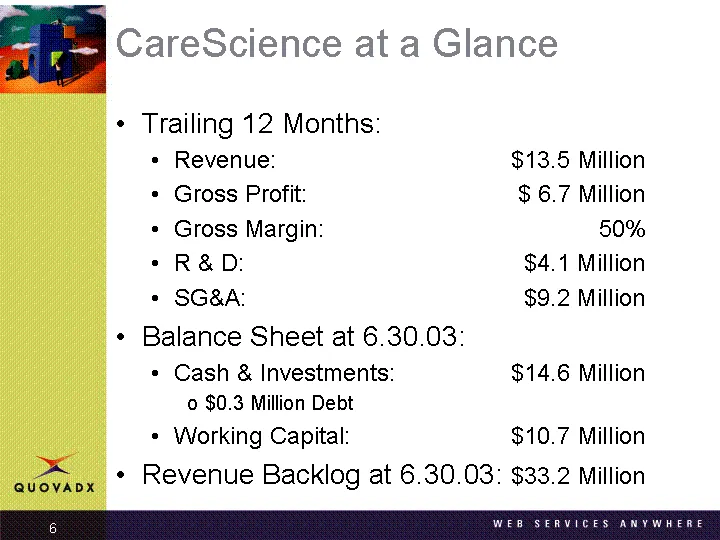
CareScience at a Glance Trailing 12 Months: Revenue: $13.5 Million Gross Profit: $ 6.7 Million Gross Margin: 50% R & D: $4.1 Million SG&A: $9.2 Million Balance Sheet at 6.30.03: Cash & Investments: $14.6 Million $0.3 Million Debt Working Capital: $10.7 Million Revenue Backlog at 6.30.03: $33.2 Milli
Slide 7: CareScience Offerings
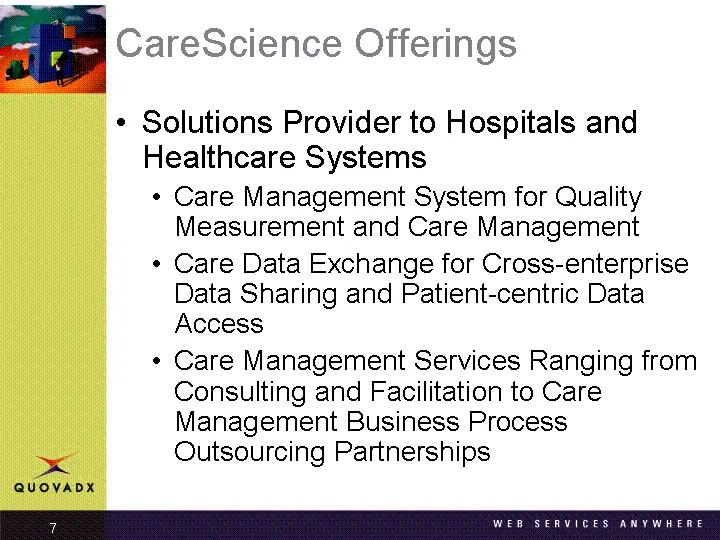
CareScience Offerings Solutions Provider to Hospitals and Healthcare Systems Care Management System for Quality Measurement and Care Management Care Data Exchange for Cross-enterprise Data Sharing and Patient-centric Data Access Care Management Services Ranging from Consulting and Facilitation to Ca
Slide 8: Identified Synergies
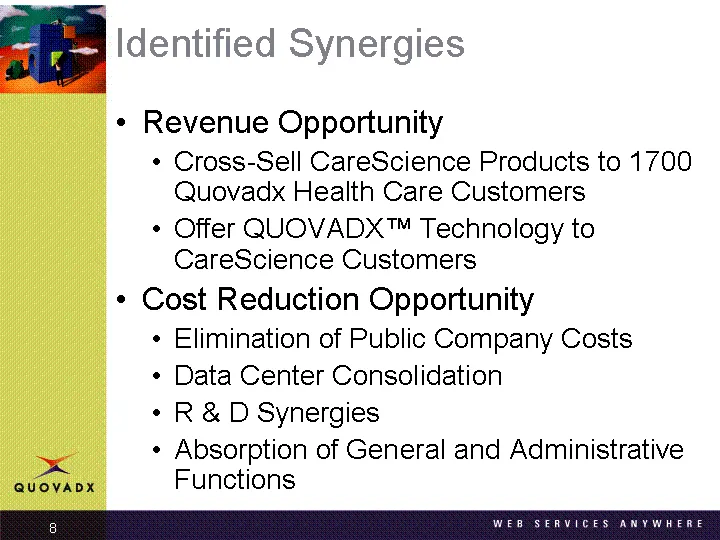
Identified Synergies Revenue Opportunity Cross-Sell CareScience Products to 1700 Quovadx Health Care Customers Offer QUOVADX(tm) Technology to CareScience Customers Cost Reduction Opportunity Elimination of Public Company Costs Data Center Consolidation R & D Synergies Absorption of General and Admi
Slide 9: CareScience Strategic Fit
CareScience Strategic Fit CARE Offers: Deep Care Management and Clinical Process Improvement Expertise Industry-leading Care Process Analysis Technology Over 170 Hospital Customers in 34 States Highly Visible, High Margin, Recurring Revenue Model with Significant Backlog QVDX Offers: Integration Pla
Slide 10: Quovadx Creates Competitive Process Advantage
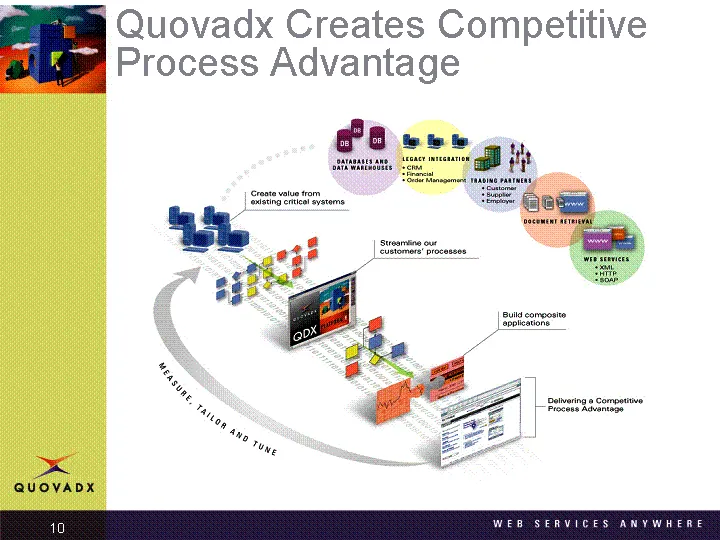
Quovadx Creates Competitive Process Advantage
Slide 11: Company Profile
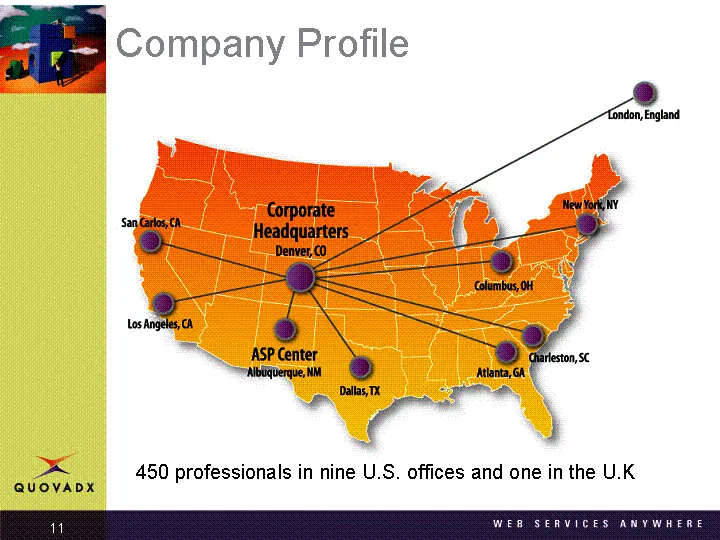
Company Profile 450 professionals in nine U.S. offices and one in the U.K
Slide 12: Quovadx Customers - 3500+
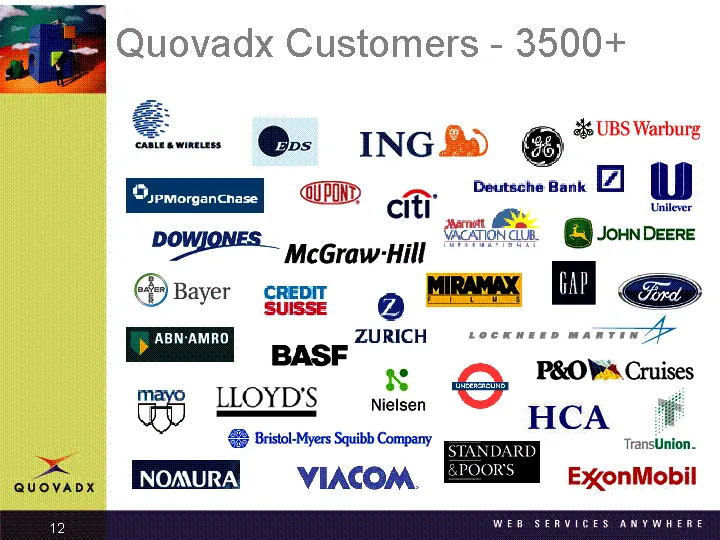
Quovadx Customers - 3500+ ee e@: ING cy @ *erre mm gq one 2 powones ee McGraw-Hill “ . 1 Drover gor gy MORN LET ee ZURICH erence F XN & P&OWA Cruises eo LLOYD'S _nieisen HCA & Besioh Myers Squibb Company STANDARD TransUnion. oe VIACOM. ExenMobil
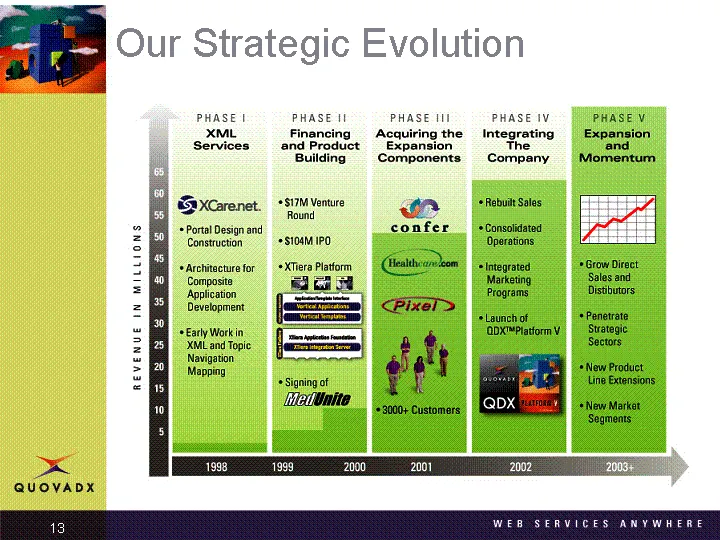
Slide 13: Company phases of growth
PHASE | XML Services &}xcarenet. + Portal Design and Construction + Architacture for Composite Application Development Rs es 8 8 se + Early Workin XMLand Topic Navigation Mapping 2 REVENUE IN MILLIONS > S QUOVADX Building *S17M Venture Round +si04M 1P0 + XTiera Platform aoe = PHASE Il PHASE IV Acqui
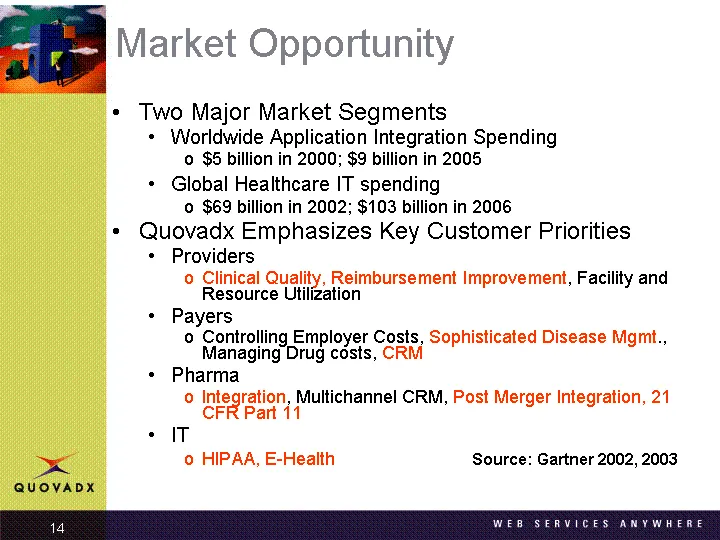
Slide 14: Market Opportunity
Market Opportunity Two Major Market Segments Worldwide Application Integration Spending $5 billion in 2000; $9 billion in 2005 Global Healthcare IT spending $69 billion in 2002; $103 billion in 2006 Quovadx Emphasizes Key Customer Priorities Providers Clinical Quality, Reimbursement Improvement, Fac
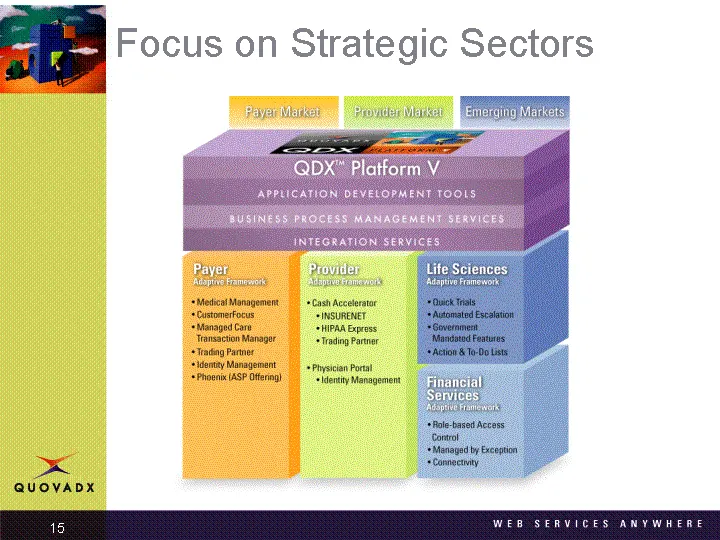
Slide 15: Focus on Strategic Sectors
Focus on Strategic Sectors | APPLICATION DEVELOPMENT TOOLS INTEGRATION SERVICES Provider ra Aehiormnanas ‘Medical Management «Cash Accteatar *oustomerfonus “INSURENET *hanaged Cre “HIPAA Excess THonsacion Manager Sang Parmer ating Pare doa Managorant *Physcan Porta *PhoenalASP Oferng) _”'sigenty Man
Slide 16: Leading the Way in Web Services
Leading the Way in Web Services Quovadx Core Competency is XML Tremendous Advantage Avoid Translation, Complexity, etc. WS-I Leadership - Demonstrating Supply Chain Application on WS-I Test Site Major Advantage to Healthcare Organizations Reuse of Laboratory and Radiology Results
Slide 17: Software License Fee Multiplier
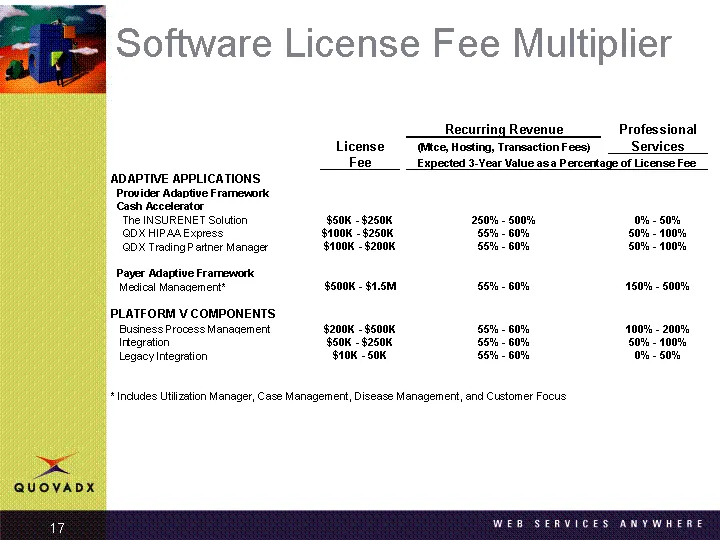
Software License Fee Multiplier
Slide 18: Vendor Comparison
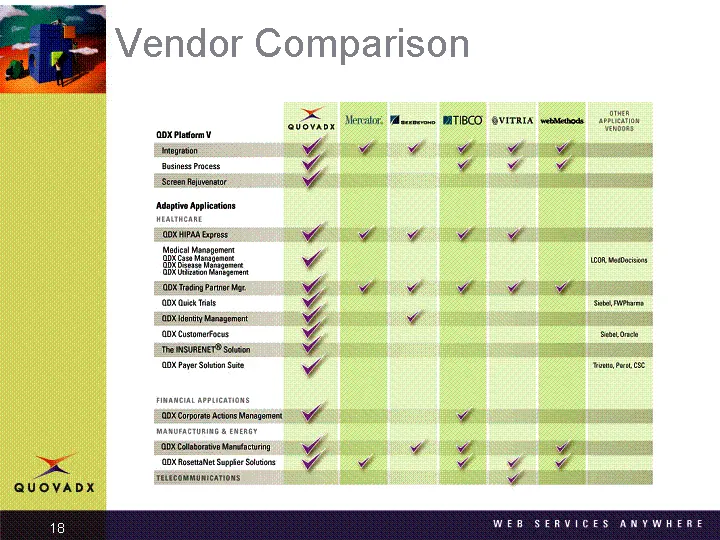
mee Vendor Comparison QUOVADX nx Ptadsonv pron Seen ejenaor Adaptive hyplicoons (OK doy Manserert anxcusumefect TaINSURENET® Seon (0X Payer Soa Suite DK uiporate Acton Menogemere XCalabome Monae (Ux octane Spper Sons LARK CCK w VA Mens: eure FATIBCO OVITRIA wtnieote —29o0 va W ¢ ¥ « Y ¢ ¢ «
Slide 19: Quarterly License Revenue - Sequential Growth
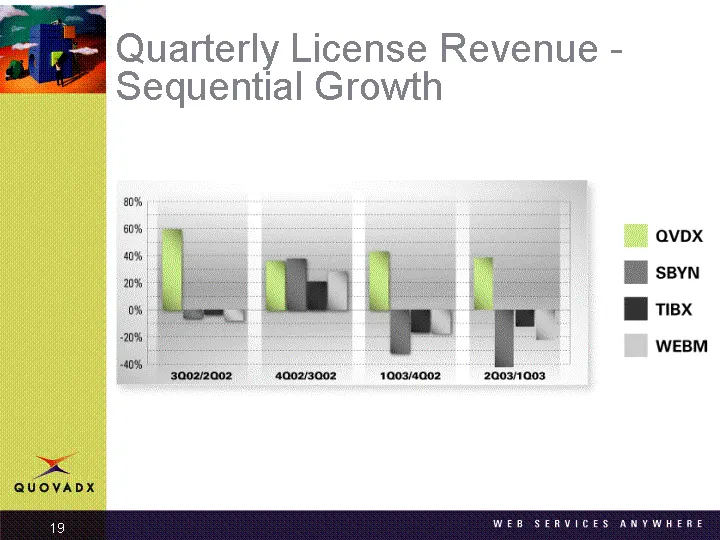
Quarterly License Revenue - Sequential Growth
Slide 20: Market Share No Clear Winners
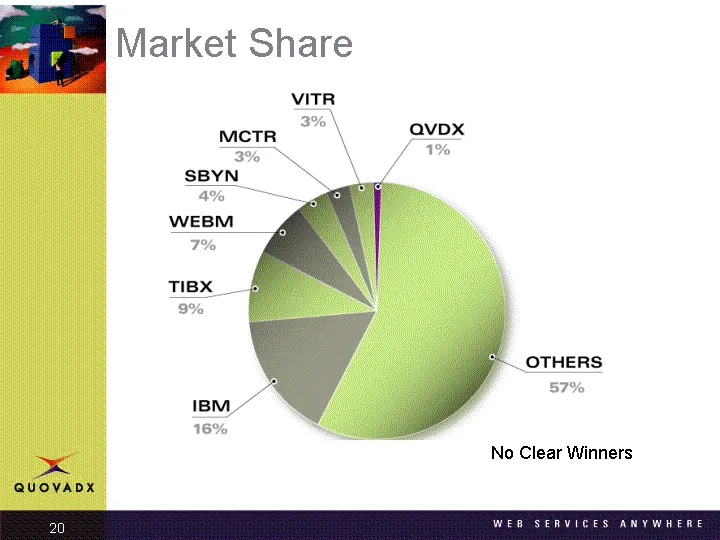
Market Share No Clear Winners
Slide 21: Quarterly License Revenue
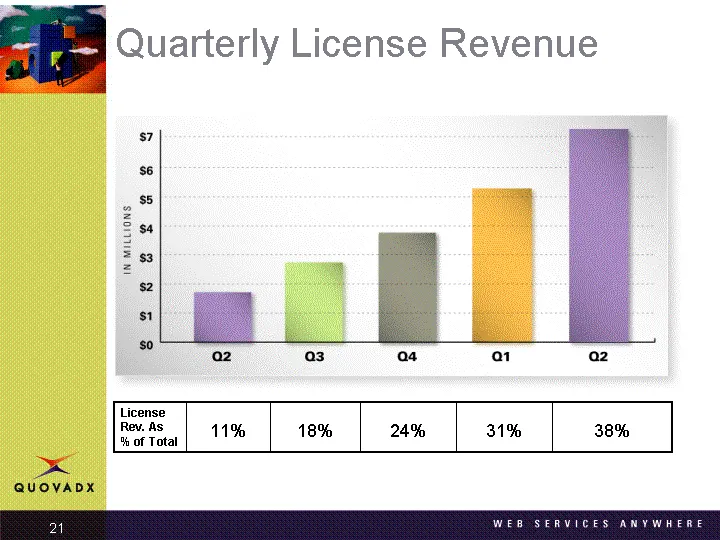
Quarterly License Revenue License Rev. As % of Total 11% 18% 24% 31% 38%
Slide 22: Revenue Mix
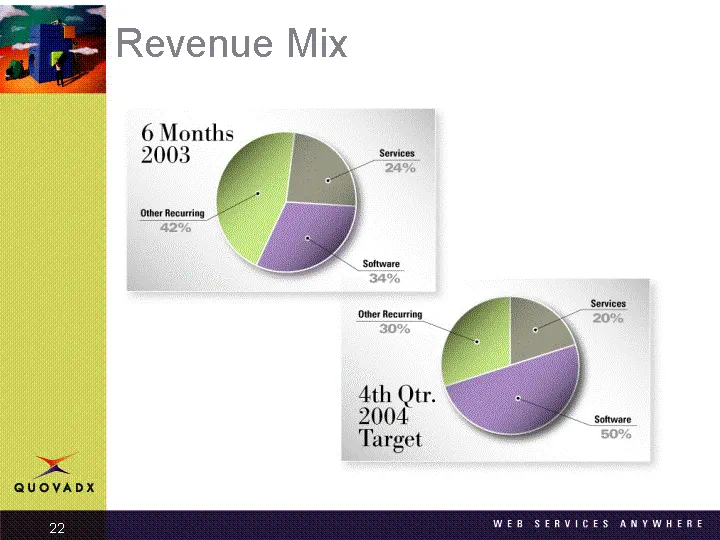
Revenue Mix 6 Months 2003 Other Rocuring
Slide 23: Target Operating Model
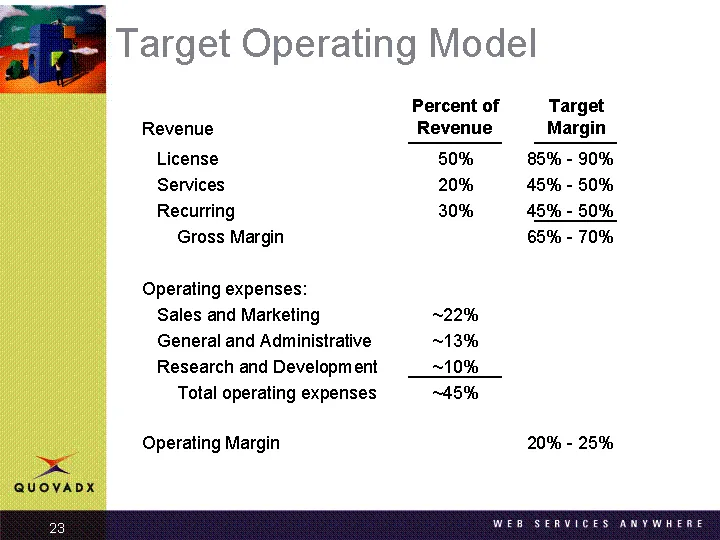
eae | arget Operating Model Percent of Target Revenue Revenue Margin License 50% 85% - 90% Services 20% 45% - 50% Recurring 30% 45% - 50% Gross Margin 65% - 70% Operating expenses: Sales and Marketing ~22% General and Administrative ~13% Research and Development ~10% Total operating expenses. ~A5N O
Slide 24: Margin Comparisons: 2Q03 vs 1Q03
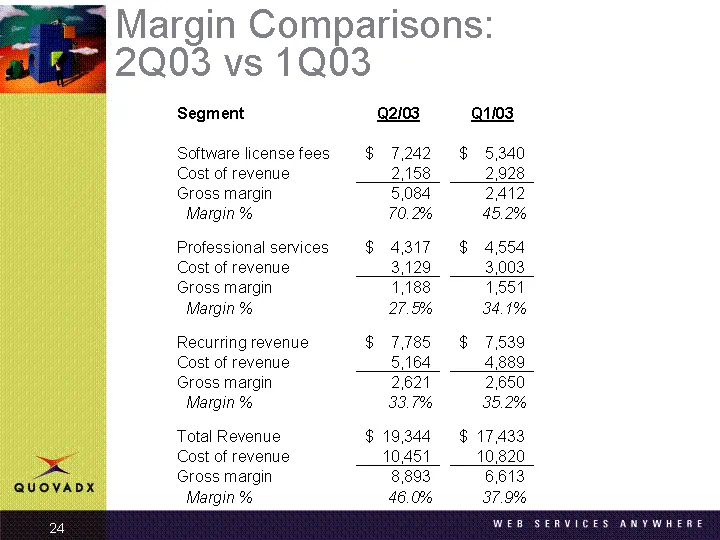
Margin Comparisons: 2Q03 vs 1Q03
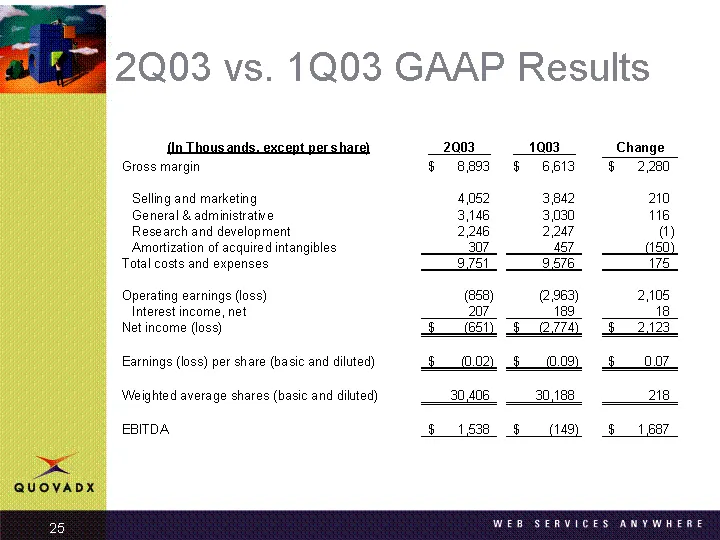
Slide 25: 2Q03 vs. 1Q03 GAAP Results
2Q03 vs. 1Q03 GAAP Results Gross margin Selling and marketing General & administrative Research and development Amortization of acquired intangibles Total costs and expenses Operating earnings (loss) Interest income, net Net income (loss) Earnings (loss) per share (basic and diluted) Weighted averag
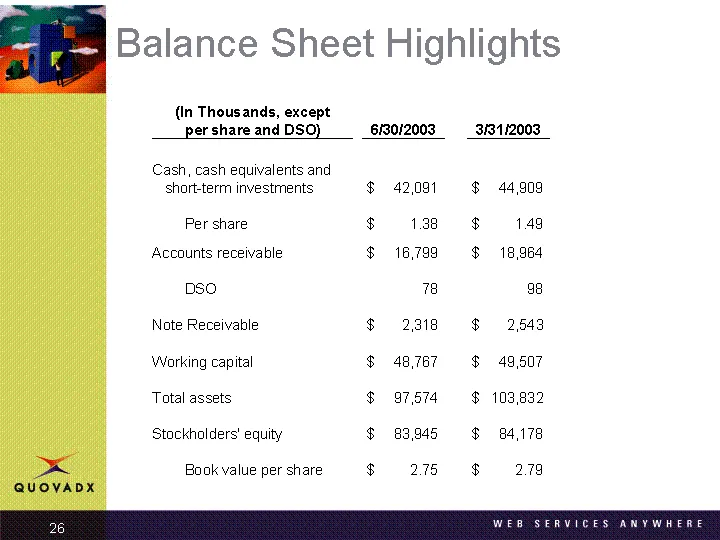
Slide 26: Balance Sheet Highlights
ma Balance Sheet Highlights (in Thousands, except per share and DSO) 6730/2003 _3/3112003 Cash, cash equivalents and short-term investments $ 42091 $ 44,909 Per share $138 $149 Accounts receivable $ 16,799 $ 18,984 so 78 96 Nate Receivable $ 2318 $ 2,643 Working capital $ 48,767 $ 49,507 Total asset
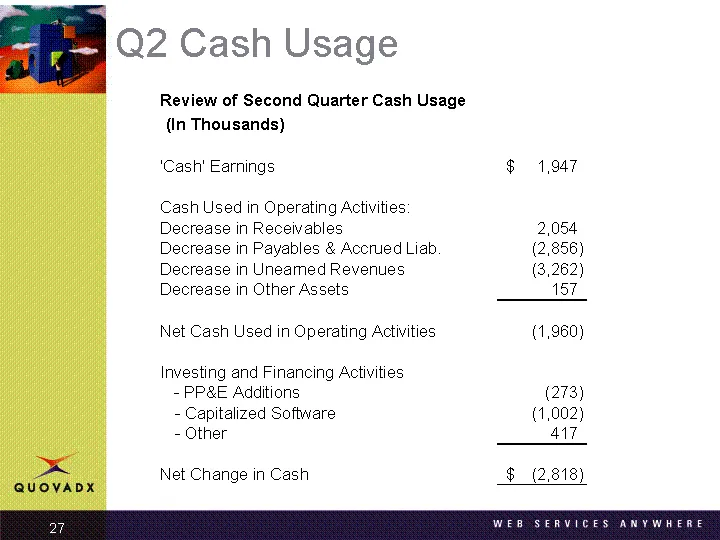
Slide 27: Cash Usage
eee 2 Cash Usage Review of Second Quarter Cash Usage (In Thousands) ‘Cash’ Earnings $ 1,947 Cash Used in Operating Activities Decrease in Receivables 2,054 Decrease in Payables & Accrued Liab: (2,856) Decrease in Uneamed Revenues (3,262) Decrease in Other Assets 157 Net Cash Used in Operating Activi
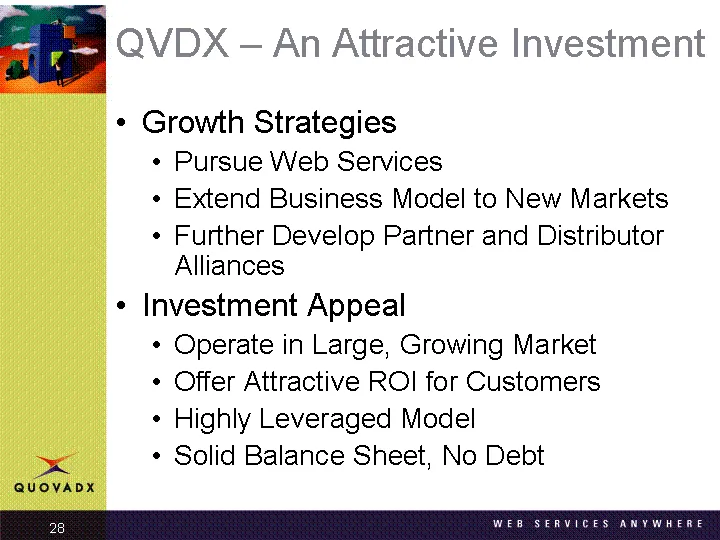
Slide 28: QVDX - An Attractive Investment
QVDX - An Attractive Investment Growth Strategies Pursue Web Services Extend Business Model to New Markets Further Develop Partner and Distributor Alliances Investment Appeal Operate in Large, Growing Market Offer Attractive ROI for Customers Highly Leveraged Model Solid Balance Sheet, No Debt
Slide 29: Web Services Anywhere
Web Services Anywhere Access Any Data Perform Any Process From Anywhere...
Source: SEC EDGAR · 425 filed Aug 14, 2003
More decks from Quovadx Inc
 Merger or Acquisition (June 2007)12 slides · Jun 25, 2007
 Merger or Acquisition (April 2007)11 slides · Apr 2, 2007
 Investor Presentation (March 2007)42 slides · Mar 13, 2007
 Q1 2006 Earnings Presentation29 slides · May 8, 2006
 Investor Presentation (March 2006)39 slides · Mar 10, 2006
 Rogue Wave Software — Merger or Acquisition (November 2003)30 slides · Nov 13, 2003