Quovadx — Investor Presentation (March 2007)
42 slides from Quovadx's investor presentation, Mar 13, 2007
Slide 1: 1Q 2007 Investor Presentation
1Q 2007 Investor Presentation: Solutions to transform data-driven processes in healthcare, financial services, telecommunications and more Exhibit 99.1
Slide 2: Forward-looking statements
Certain forward-looking statements are included in this presentation, including statements relating to Company goals, growth strategy and future business opportunities. These statements are made pursuant to the safe harbor provisions of the Private Securities Litigation Reform Act of 1995. These for
Slide 3: Quovadx Overview
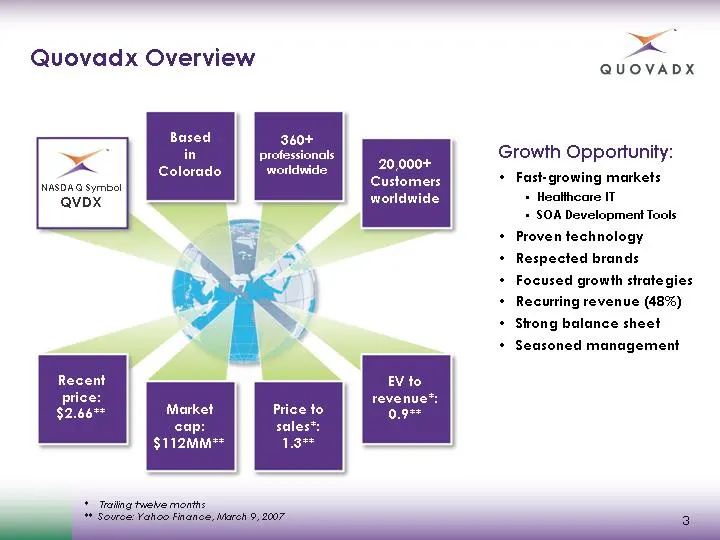
Quovadx Overview Fast-growing markets Healthcare IT SOA Development Tools Proven technology Respected brands Focused growth strategies Recurring revenue (48%) Strong balance sheet Seasoned management Market cap: $112MM** Price to sales*: 1.3** EV to revenue*: 0.9** Recent price: $2.66** Growth Oppor
Slide 4: Three business divisions enabling critical, data-driven processes
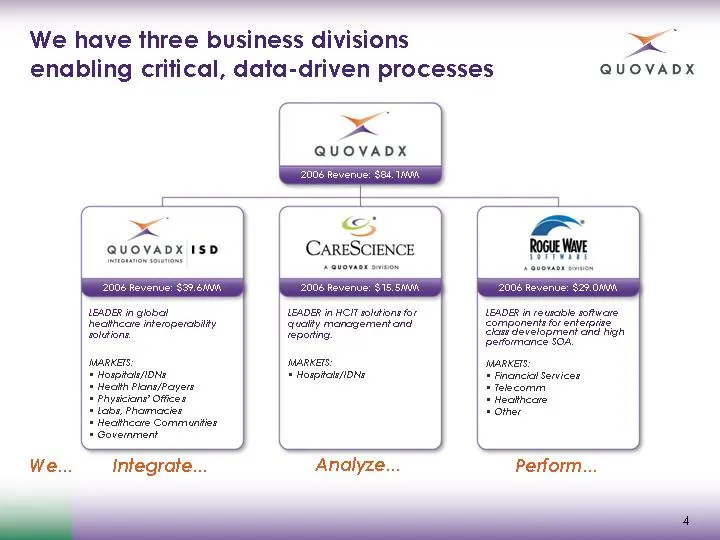
We have three business divisions enabling critical, data-driven processes LEADER in reusable software components for enterprise class development and high performance SOA. We... Integrate... Analyze... Perform... LEADER in global healthcare interoperability solutions. MARKETS: Hospitals/IDNs Health
Slide 5: Focus primarily on healthcare IT and software development tools
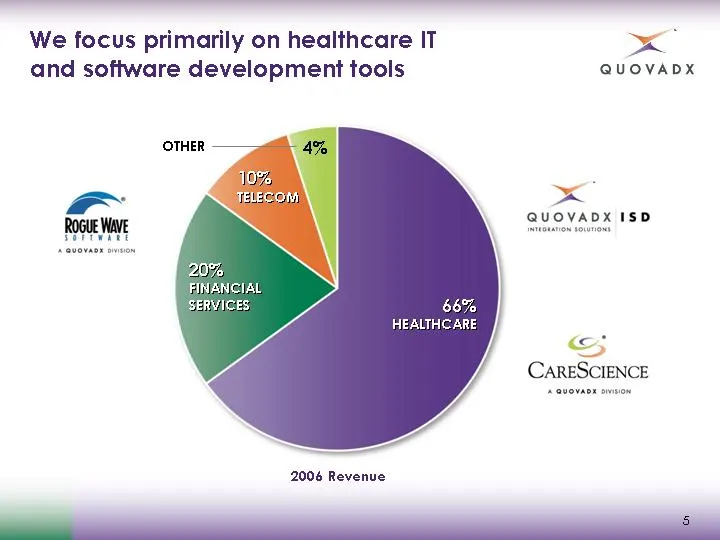
We focus primarily on healthcare IT and software development tools 66% HEALTHCARE 20% FINANCIAL SERVICES 10% TELECOM 4% OTHER 5 2006 Revenue
Slide 6: We operate in fast-growing markets
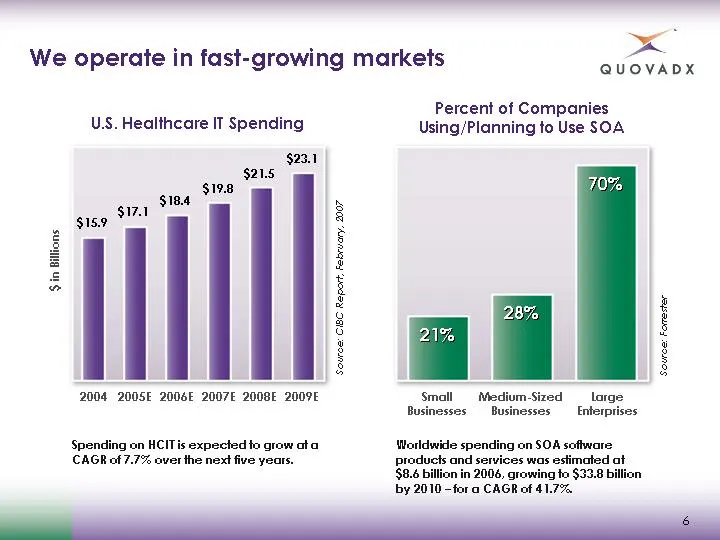
We operate in fast-growing markets U.S. Healthcare IT Spending 2004 Percent of Companies Using/Planning to Use SOA Small Businesses 21% 28% 2006E 2007E 2008E 2009E 2005E $15.9 $18.4 $17.1 $19.8 $21.5 $23.1 Source: CIBC Report, February, 2007 70% Medium-Sized Businesses Large Enterprises $ in Billion
Slide 7: Our customers and partners are the Who's Who in their markets
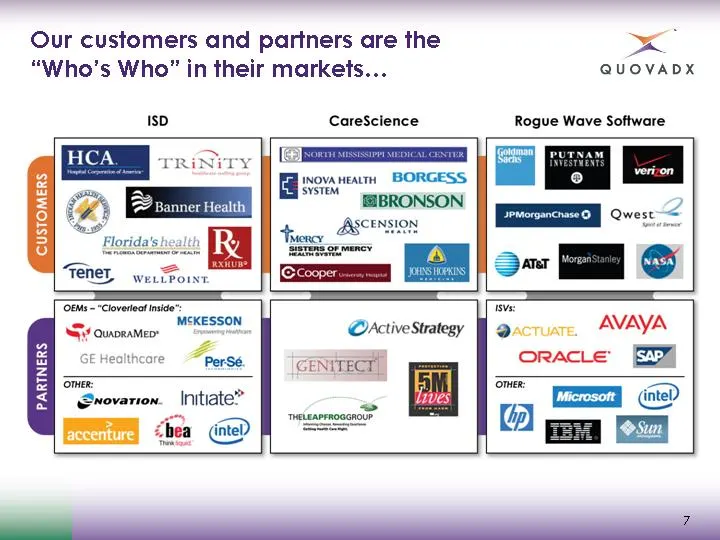
Our customers and partners are the "Who's Who" in their markets... 7
Slide 8: Track record of improving results
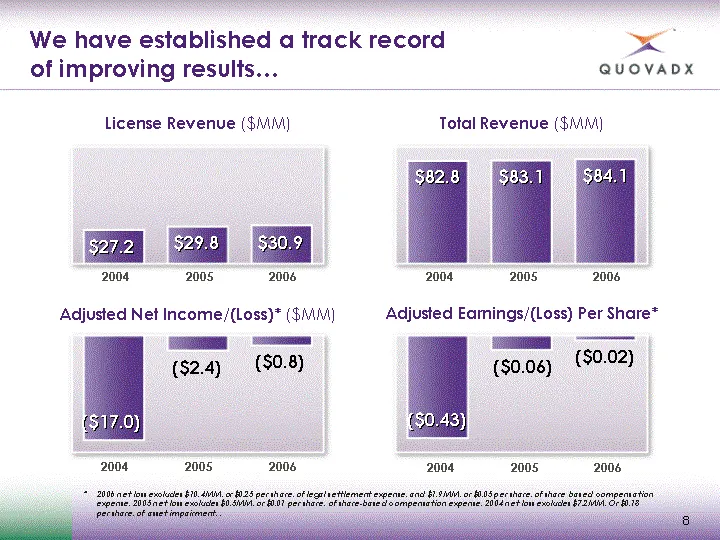
We have established a track record of improving results... License Revenue ($MM) Total Revenue ($MM) $83.1 Adjusted Earnings/(Loss) Per Share* $82.8 Adjusted Net Income/(Loss)* ($MM) 2004 2005 2006 $84.1 2004 2005 2006 2004 2005 2006 2004 2005 2006 $29.8 $27.2 $30.9 ($2.4) ($17.0) ($1.6) ($0.06) ($0
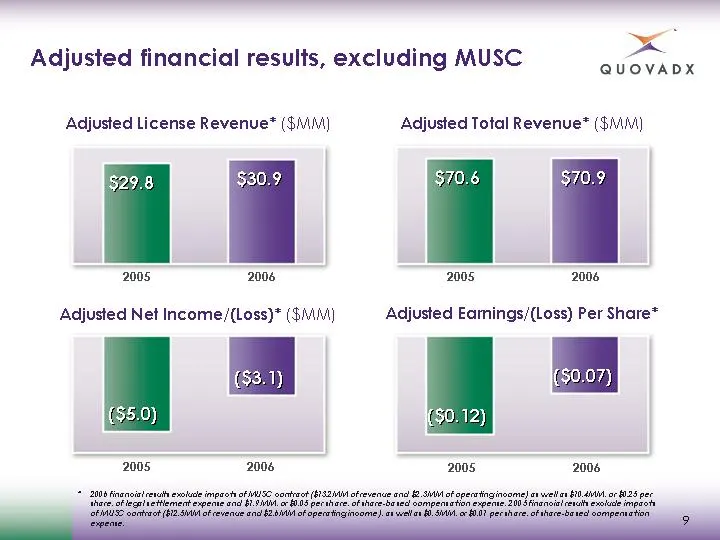
Slide 9: Adjusted financial results, excluding MUSC
Adjusted financial results, excluding MUSC Adjusted License Revenue* ($MM) Adjusted Total Revenue* ($MM) Adjusted Earnings/(Loss) Per Share* $70.6 Adjusted Net Income/(Loss)* ($MM) 2005 2006 $70.9 2005 2006 2005 2006 2005 2006 $29.8 $30.9 ($5.0) ($3.1) ($0.12) ($0.07) * 2006 financial results exclud
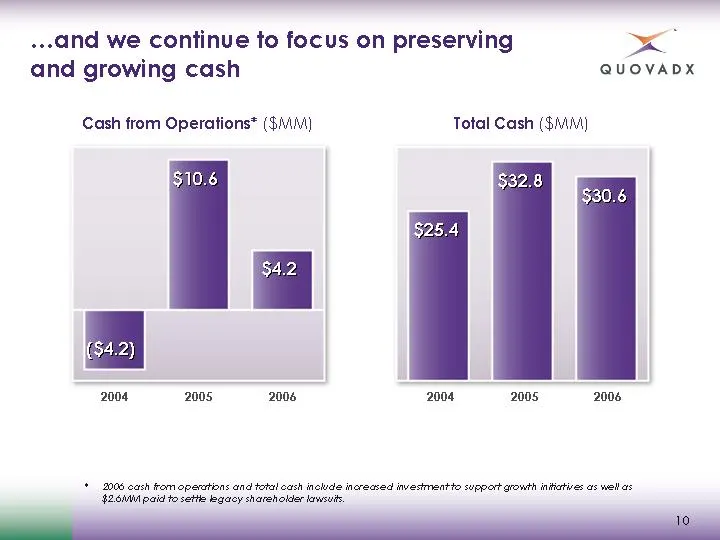
Slide 10: Focus on preserving and growing cash
....and we continue to focus on preserving and growing cash Cash from Operations* ($MM) Total Cash ($MM) 2004 2005 2006 2004 2005 2006 $32.8 $25.4 $30.6 $10.6 ($4.2) $4.2 * 2006 cash from operations and total cash include increased investment to support growth initiatives as well as $2.6MM paid to s
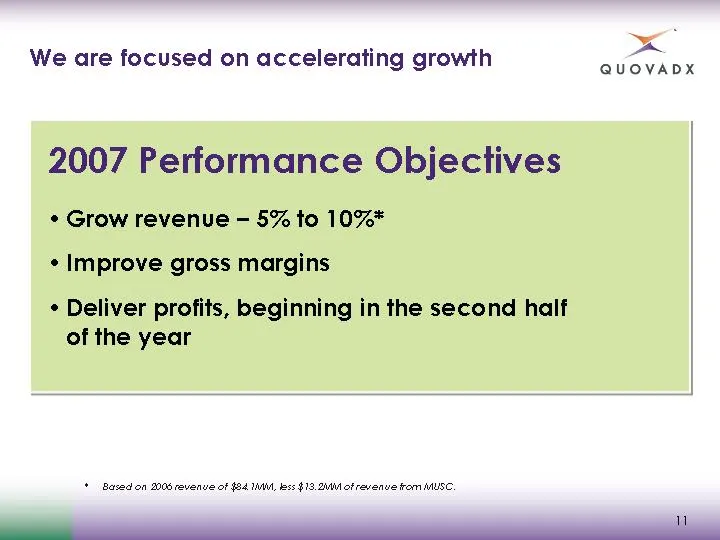
Slide 11: 2007 Performance Objectives
2007 Performance Objectives Grow revenue - 5% to 10%* Improve gross margins Deliver profits, beginning in the second half of the year 11 We are focused on accelerating growth * Based on 2006 revenue of $84.1MM, less $13.2MM of revenue from MUSC.
Slide 12: Addressing critical issues in healthcare
Addressing critical issues in healthcare
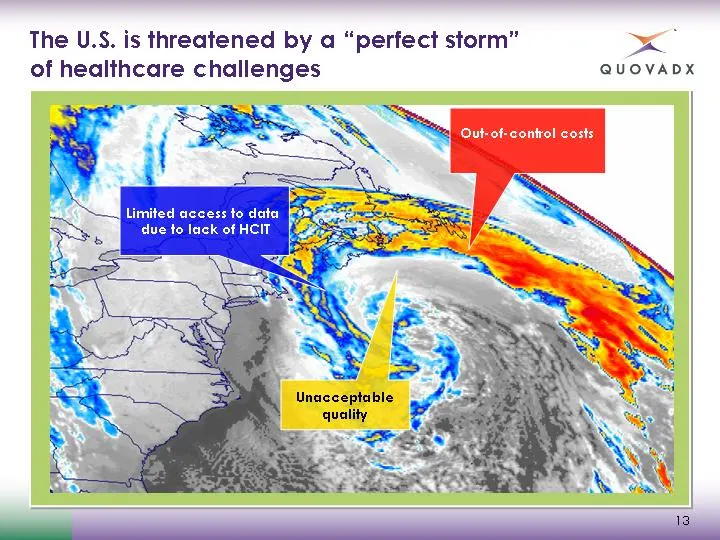
Slide 13: Perfect storm of healthcare challenges
The U.S. is threatened by a "perfect storm" of healthcare challenges Out-of-control costs Unacceptable quality Limited access to data due to lack of HCIT 13
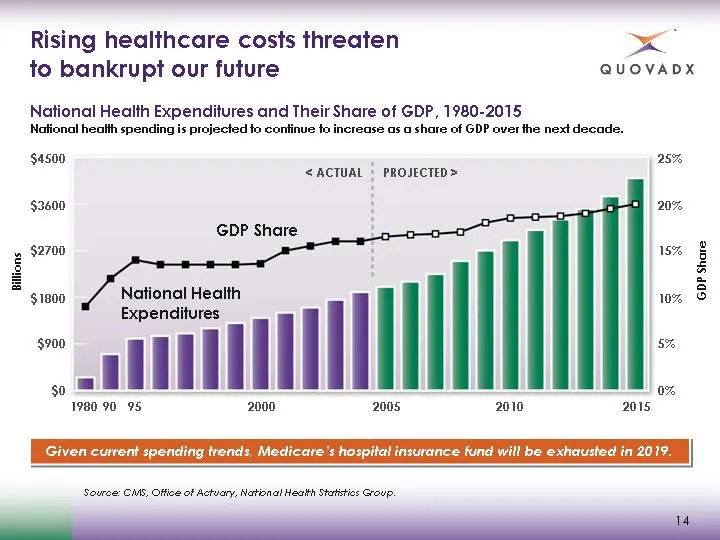
Slide 14: Rising healthcare costs threaten to bankrupt our future
Rising healthcare costs threaten to bankrupt our future Given current spending trends, Medicare's hospital insurance fund will be exhausted in 2019. Source: CMS, Office of Actuary, National Health Statistics Group. National Health Expenditures and Their Share of GDP, 1980-2015 National health spendi
Slide 15: HHS and others taking aggressive action
HHS and others are taking aggressive action to address this issue HHS Secretary Leavitt's 4-Point Program: Promote interoperability - Adopt standards and Health IT Systems that are compatible and connected Measure quality - Adopt benchmark standards to measure the quality of care provided Compare co
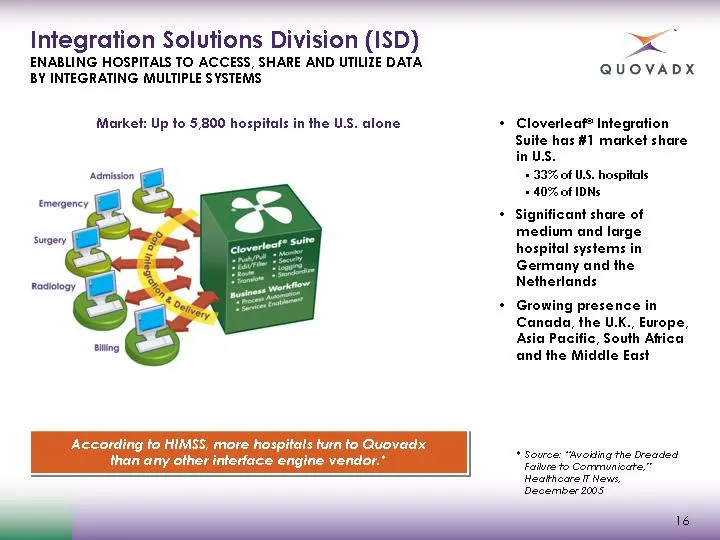
Slide 16: Integration Solutions Division (ISD)
Integration Solutions Division (ISD) ENABLING HOSPITALS TO ACCESS, SHARE AND UTILIZE DATA BY INTEGRATING MULTIPLE SYSTEMS Cloverleaf(r) Integration Suite has #1 market share in U.S. 33% of U.S. hospitals 40% of IDNs Significant share of medium and large hospital systems in Germany and the Netherland
Slide 17: ISD: Growth Opportunity
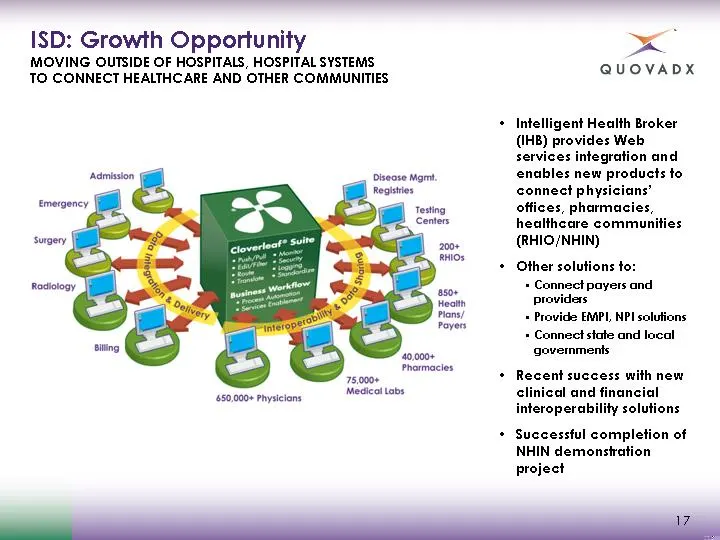
ISD: Growth Opportunity MOVING OUTSIDE OF HOSPITALS, HOSPITAL SYSTEMS TO CONNECT HEALTHCARE AND OTHER COMMUNITIES Intelligent Health Broker (IHB) provides Web services integration and enables new products to connect physicians' offices, pharmacies, healthcare communities (RHIO/NHIN) Other solutions
Slide 18: Growth Drivers and Strategies (ISD)
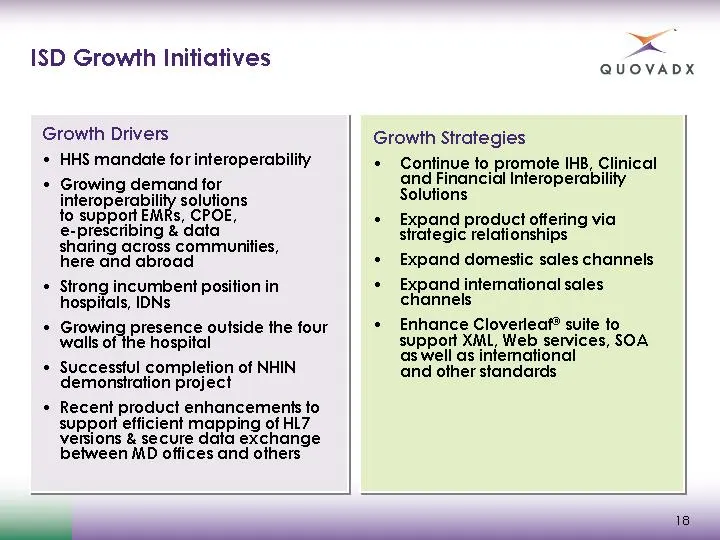
Growth Drivers HHS mandate for interoperability Growing demand for interoperability solutions to support EMRs, CPOE, e-prescribing & data sharing across communities, here and abroad Strong incumbent position in hospitals, IDNs Growing presence outside the four walls of the hospital Successful comple
Slide 19: CareScience Division
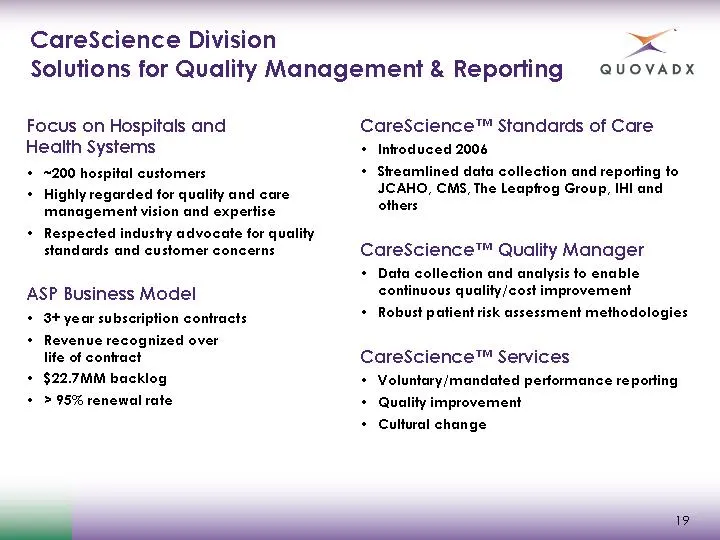
CareScience Division Solutions for Quality Management & Reporting ~200 hospital customers Highly regarded for quality and care management vision and expertise Respected industry advocate for quality standards and customer concerns ASP Business Model 3+ year subscription contracts Revenue recognized
Slide 20: CareScience Growth Initiatives
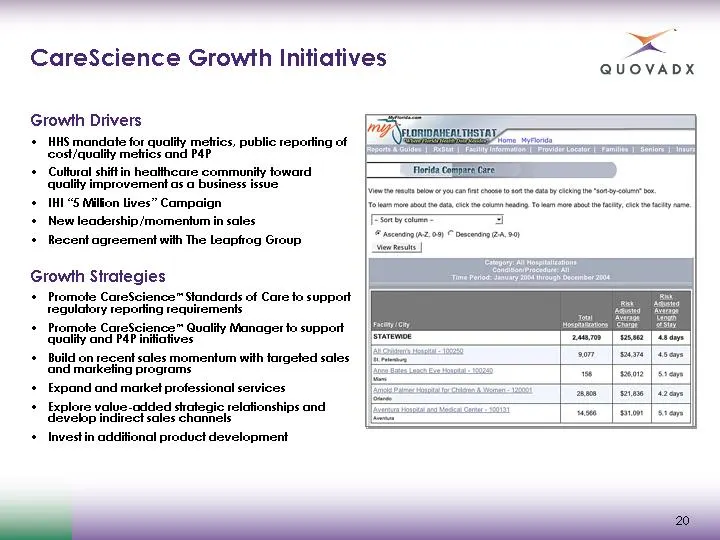
CareScience Growth Initiatives Growth Drivers HHS mandate for quality metrics, public reporting of cost/quality metrics and P4P Cultural shift in healthcare community toward quality improvement as a business issue IHI "5 Million Lives" Campaign New leadership/momentum in sales Recent agreement with

Slide 21: Addressing mission-critical software development challenges
Addressing mission-critical software development challenges
Slide 22: Rogue Wave Software
Rogue Wave Software LEADER IN THE PROVISION OF REUSABLE HIGH-PERFORMANCE SOFTWARE COMPONENTS Focus on professional developers with high-performance requirements in financial services, telecommunications, healthcare and more Leading provider of C++ development tools >300,000 developer seats deployed
Slide 23: High-performance applications: Three critical trends
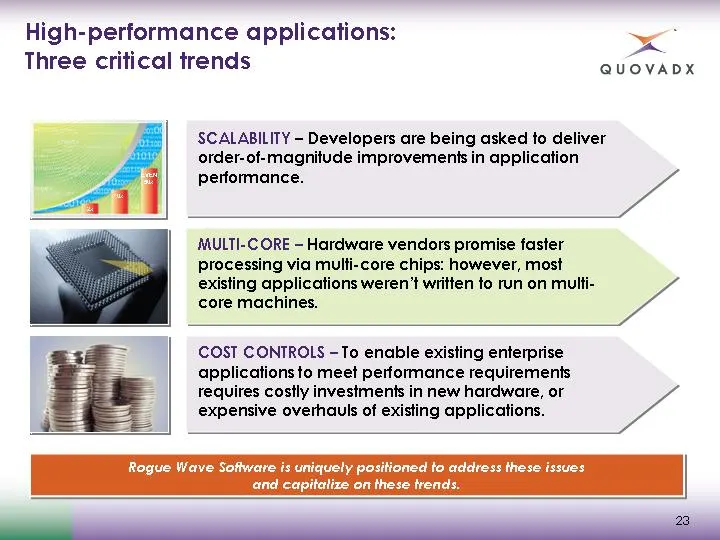
High-performance applications: Three critical trends 2x 10x EVEN 50x SCALABILITY - Developers are being asked to deliver order-of-magnitude improvements in application performance. MULTI-CORE - Hardware vendors promise faster processing via multi-core chips: however, most existing applications weren
Slide 24: Rogue Wave Software: Growth Opportunity
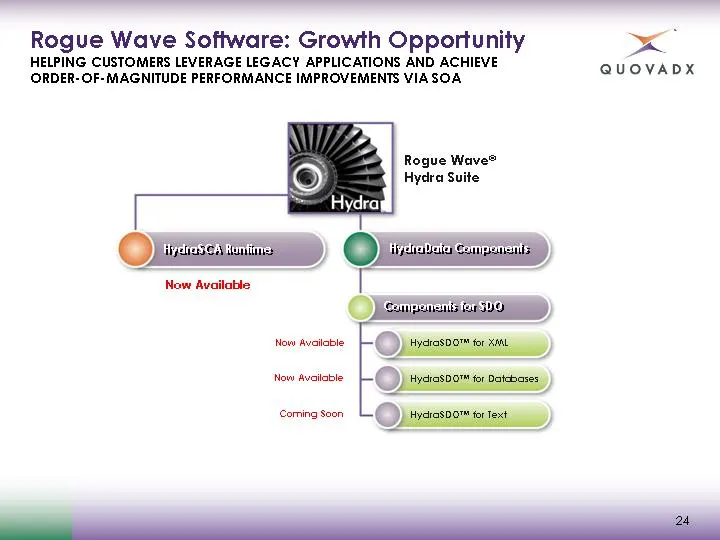
Rogue Wave Software: Growth Opportunity HELPING CUSTOMERS LEVERAGE LEGACY APPLICATIONS AND ACHIEVE ORDER-OF-MAGNITUDE PERFORMANCE IMPROVEMENTS VIA SOA Rogue Wave(r) Hydra Suite HydraSCA Runtime HydraData Components Components for SDO HydraSDO(tm) for XML HydraSDO(tm) for Databases HydraSDO(tm) for T
Slide 25: Rogue Wave Hydra
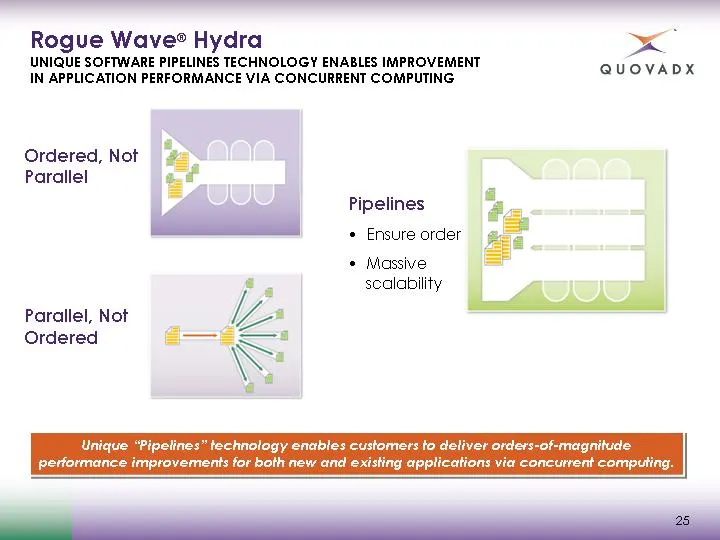
Rogue Wave(r) Hydra UNIQUE SOFTWARE PIPELINES TECHNOLOGY ENABLES IMPROVEMENT IN APPLICATION PERFORMANCE VIA CONCURRENT COMPUTING Unique "Pipelines" technology enables customers to deliver orders-of-magnitude performance improvements for both new and existing applications via concurrent computing. Pa
Slide 26: Rogue Wave Software Growth Initiatives
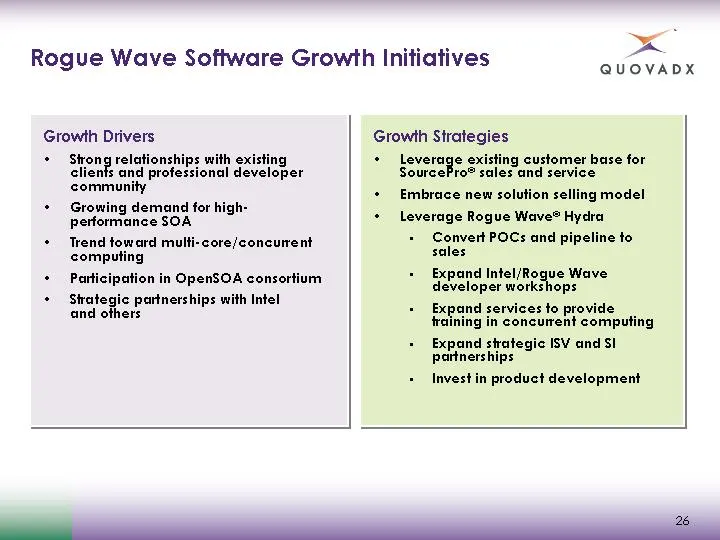
Rogue Wave Software Growth Initiatives 26 Growth Strategies Leverage existing customer base for SourcePro(r) sales and service Embrace new solution selling model Leverage Rogue Wave(r) Hydra Convert POCs and pipeline to sales Expand Intel/Rogue Wave developer workshops Expand services to provide tra
Slide 27: Summary
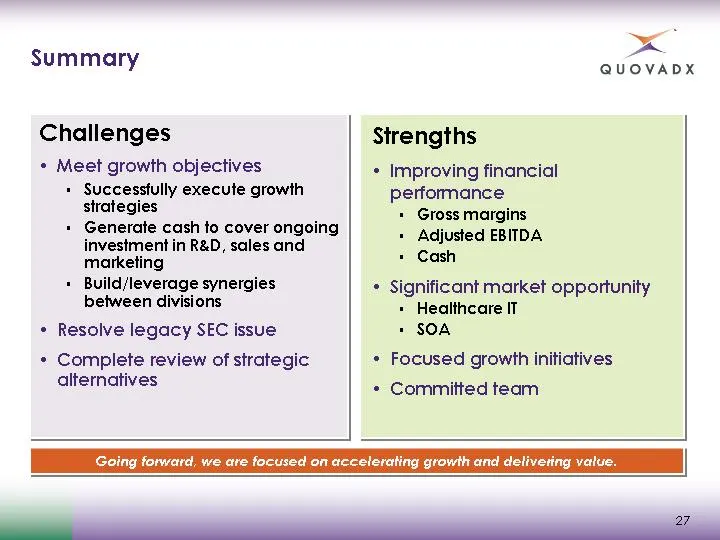
Summary Challenges Meet growth objectives Successfully execute growth strategies Generate cash to cover ongoing investment in R&D, sales and marketing Build/leverage synergies between divisions Resolve legacy SEC issue Complete review of strategic alternatives Strengths Improving financial performan
Slide 28: Detailed financial results
OO a QUOVADX Detailed financial results
Slide 29: 2006 Revenue Breakout by Division
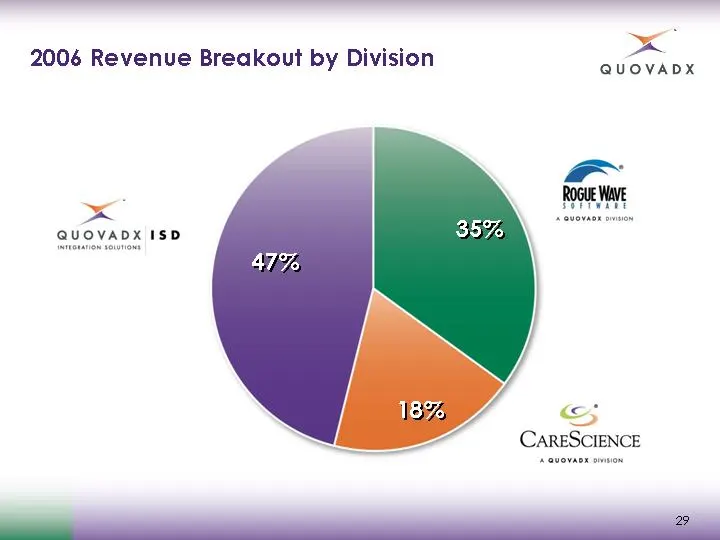
2006 Revenue Breakout by Division 29 35% 18% 47%
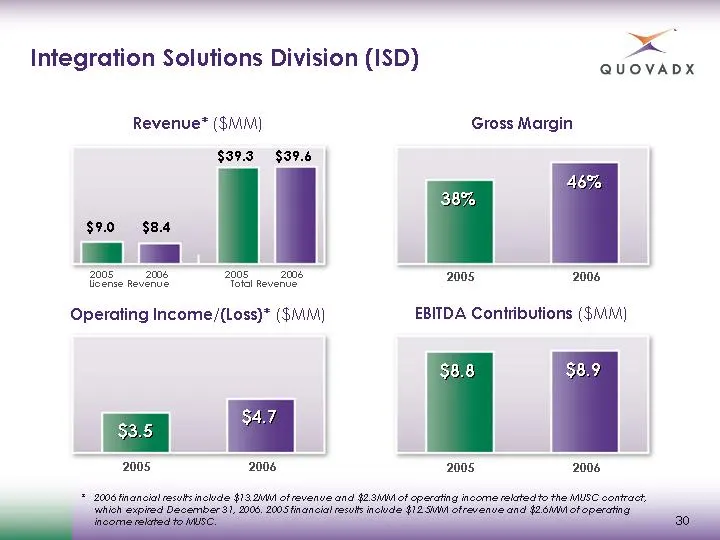
Slide 30: Integration Solutions Division (ISD)
Integration Solutions Division (ISD) 30 Revenue* ($MM) $3.5 $4.7 Gross Margin 38% 46% EBITDA Contributions ($MM) $8.8 $8.9 2005 2006 2005 2006 2005 2006 2005 2006 License Revenue $9.0 $8.4 $39.3 $39.6 2005 2006 Total Revenue Operating Income/(Loss)* ($MM) * 2006 financial results include $13.2MM of
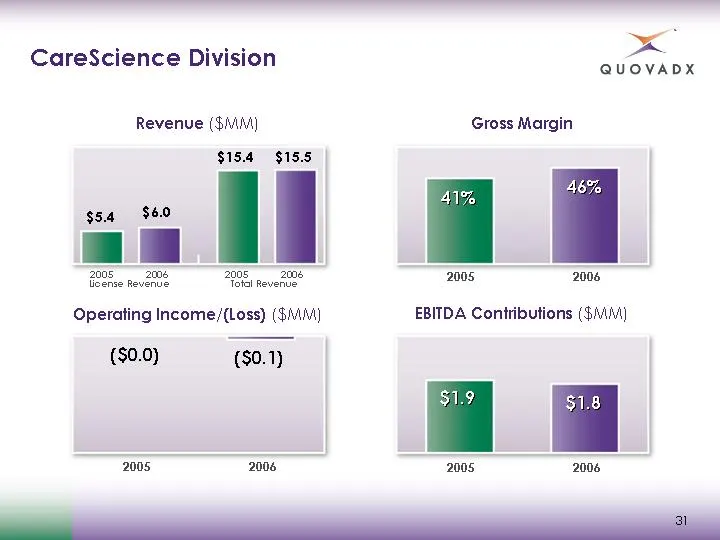
Slide 31: CareScience Division
CareScience Division 31 Revenue ($MM) ($0.0) ($0.1) Gross Margin 41% 46% EBITDA Contributions ($MM) $1.9 $1.8 2005 2006 2005 2006 2005 2006 2005 2006 License Revenue $5.4 $6.0 $15.4 $15.5 2005 2006 Total Revenue Operating Income/(Loss) ($MM)
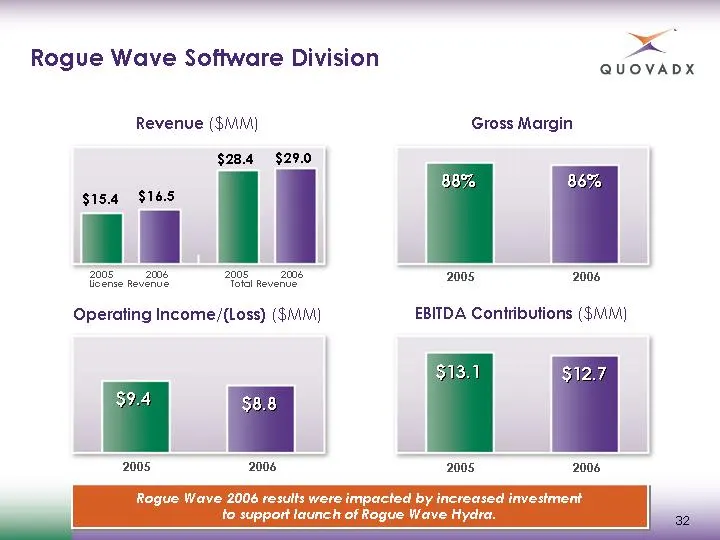
Slide 32: Rogue Wave Software Division
Rogue Wave Software Division Revenue ($MM) $9.4 $8.8 Gross Margin 88% 86% EBITDA Contributions ($MM) $13.1 $12.7 32 2005 2006 2005 2006 2005 2006 2005 2006 License Revenue $15.4 $16.5 $28.4 $29.0 2005 2006 Total Revenue Operating Income/(Loss) ($MM) Rogue Wave 2006 results were impacted by increased
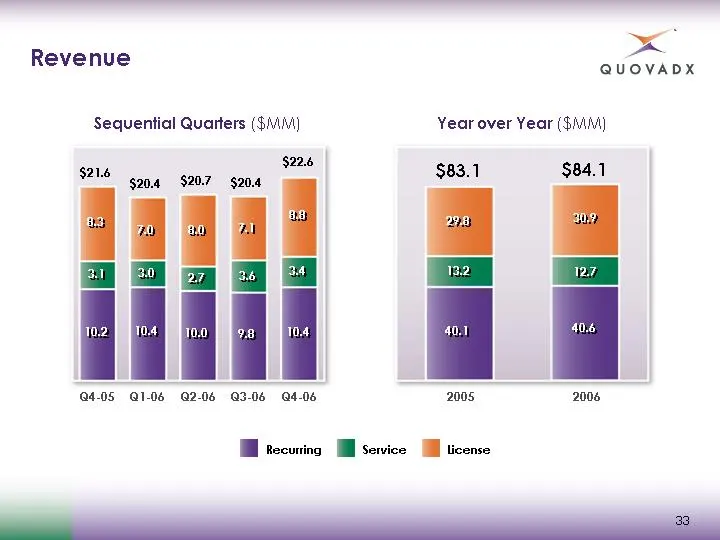
Slide 33: Revenue
Revenue 33 Sequential Quarters ($MM) Year over Year ($MM) 2005 2006 $83.1 $84.1 Q4-05 Q1-06 Q2-06 Q3-06 $21.6 $20.4 $20.7 $20.4 8.3 7.0 8.0 7.1 3.1 3.0 2.7 3.6 10.2 10.4 10.0 9.8 29.8 13.2 40.1 30.9 12.7 40.6 Recurring Service License $22.6 8.8 3.4 10.4 Q4-06
Slide 34: Gross Margin
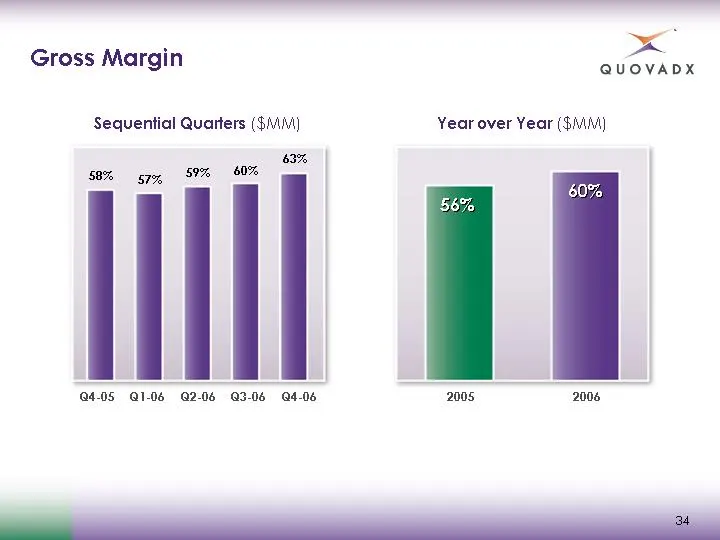
Gross Margin 34 Sequential Quarters ($MM) Year over Year ($MM) 2005 2006 Q4-05 Q1-06 Q2-06 Q3-06 58% 57% 59% 60% 63% Q4-06 56% 60%
Slide 35: Net Income/(Loss)
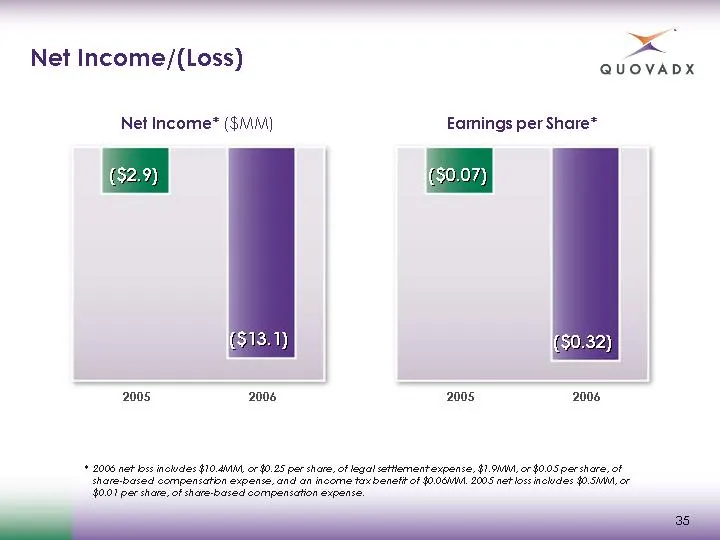
Net Income/(Loss) 35 Net Income* ($MM) Earnings per Share* 2005 2006 ($0.07) ($0.32) * 2006 net loss includes $10.4MM, or $0.25 per share, of legal settlement expense, $1.9MM, or $0.05 per share, of share-based compensation expense, and an income tax benefit of $0.06MM. 2005 net loss includes $0.5MM
Slide 36: EBITDA
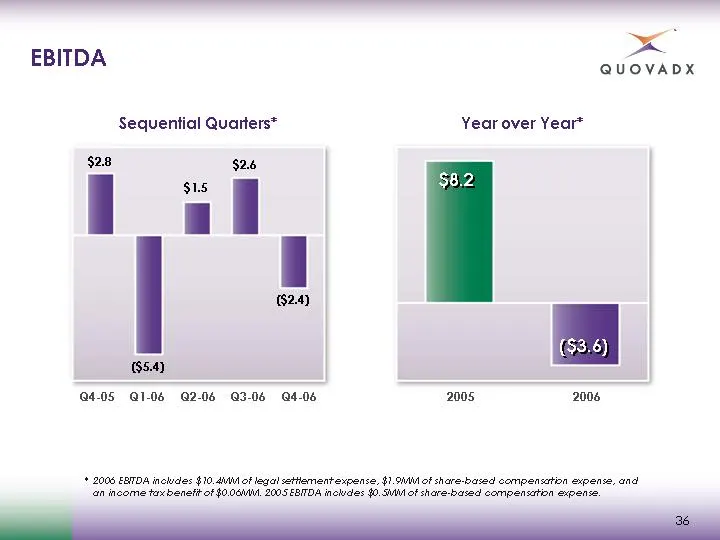
EBITDA 36 Sequential Quarters* Year over Year* 2005 2006 $8.2 ($3.6) $2.8 $1.5 $2.6 ($2.4) ($5.4) Q4-05 Q1-06 Q2-06 Q3-06 Q4-06 * 2006 EBITDA includes $10.4MM of legal settlement expense, $1.9MM of share-based compensation expense, and an income tax benefit of $0.06MM. 2005 EBITDA includes $0.5MM of
Slide 37: Cash
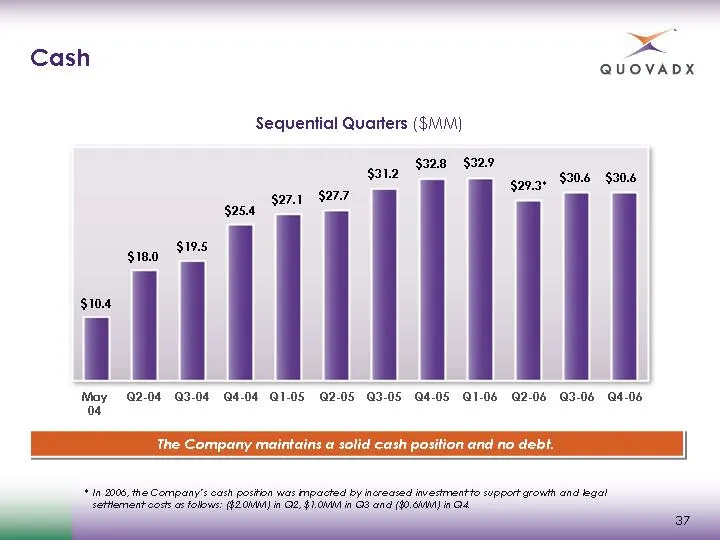
Cash 37 The Company maintains a solid cash position and no debt. Sequential Quarters ($MM) May 04 Q2-04 Q3-04 Q4-04 Q1-05 Q2-05 Q3-05 Q4-05 Q1-06 $10.4 $18.0 $19.5 $25.4 $27.1 $27.7 $31.2 $32.8 $32.9 * In 2006, the Company's cash position was impacted by increased investment to support growth and le
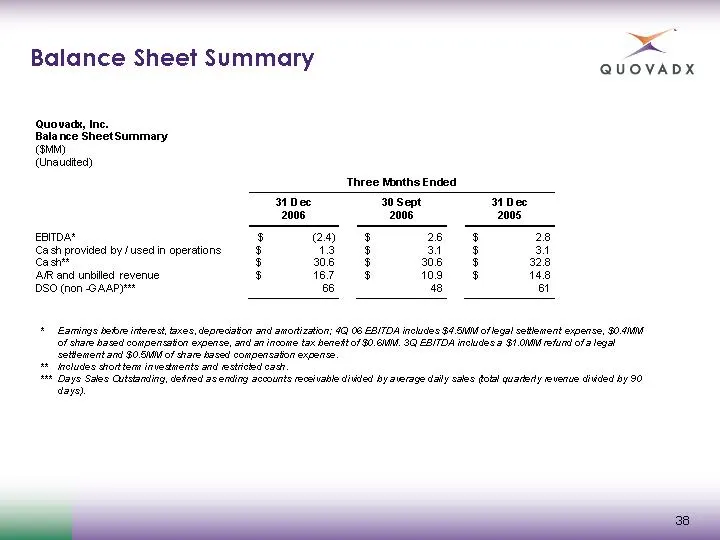
Slide 38: Balance Sheet Summary
Balance Sheet Summary 38 * Earnings before interest, taxes, depreciation and amortization; 4Q 06 EBITDA includes $4.5MM of legal settlement expense, $0.4MM of share based compensation expense, and an income tax benefit of $0.6MM. 3Q EBITDA includes a $1.0MM refund of a legal settlement and $0.5MM of
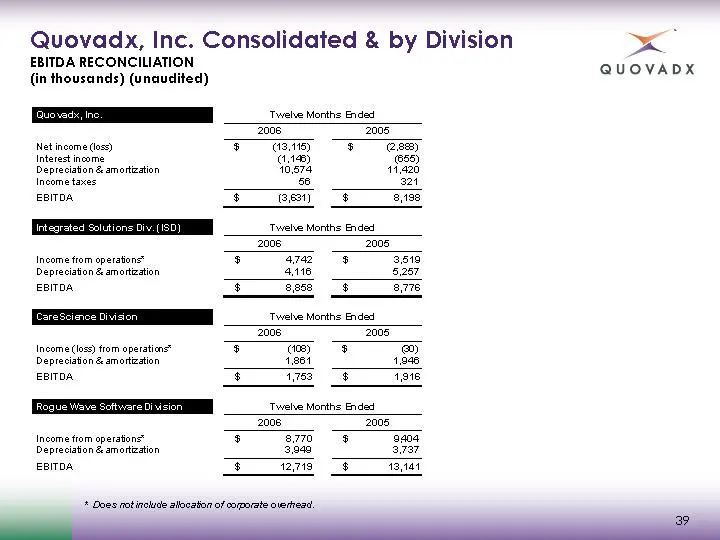
Slide 39: EBITDA Reconciliation, Consolidated & by Division
Quovadx, Inc. Consolidated & by Division EBITDA RECONCILIATION (in thousands) (unaudited) 39 * Does not include allocation of corporate overhead.
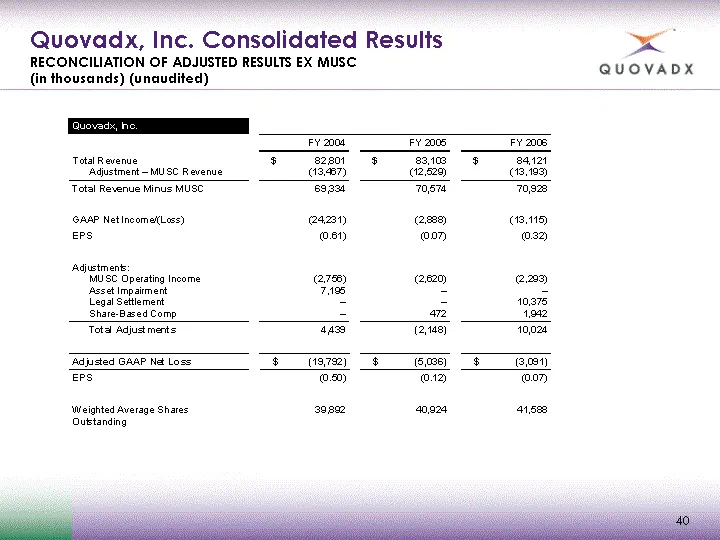
Slide 40: Reconciliation of Adjusted Results Ex MUSC
Quovadx, Inc. Consolidated Results RECONCILIATION OF ADJUSTED RESULTS EX MUSC (in thousands) (unaudited) 40

Slide 41: For additional information
For additional information: Rebecca Winning, VP Investor Relations 720-554-1346 rebecca.winning@quovadx.com www.quovadx.com
Slide 42: Thank You
“a QUOVADX Thank You
Source: SEC EDGAR · 8-K filed Mar 13, 2007
More decks from Quovadx Inc
 Merger or Acquisition (June 2007)12 slides · Jun 25, 2007
 Merger or Acquisition (April 2007)11 slides · Apr 2, 2007
 Q1 2006 Earnings Presentation29 slides · May 8, 2006
 Investor Presentation (March 2006)39 slides · Mar 10, 2006
 Rogue Wave Software — Merger or Acquisition (November 2003)30 slides · Nov 13, 2003
 Rogue Wave Software — Merger or Acquisition (November 2003)32 slides · Nov 7, 2003