Quovadx — Q1 2006 Earnings Presentation
29 slides from Quovadx's earnings presentation, May 8, 2006
Slide 1: Second Quarter 2006 Investor Presentation
SECOND QUARTER 2006 INVESTOR PRESENTATION Copyright (c) 2006 Quovadx, Inc. All rights reserved.
Slide 2: Forward-Looking Statements
Forward-Looking Statements Certain forward-looking statements are included in this presentation, including statements relating to goals and future business opportunities. These statements are made pursuant to the safe harbor provisions of the Private Securities Litigation Reform Act of 1995. These s
Slide 3: Quovadx: Past, present and future
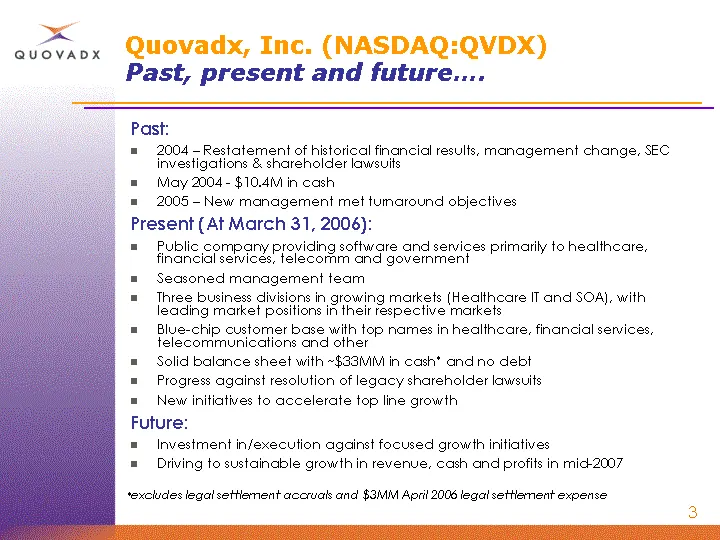
Quovadx, Inc. (NASDAQ:QVDX) Past, present and future.... Past: 2004 - Restatement of historical financial results, management change, SEC investigations & shareholder lawsuits May 2004 - $10.4M in cash 2005 - New management met turnaround objectives Present (At March 31, 2006): Public company provid
Slide 4: Quovadx: Financial Snapshot
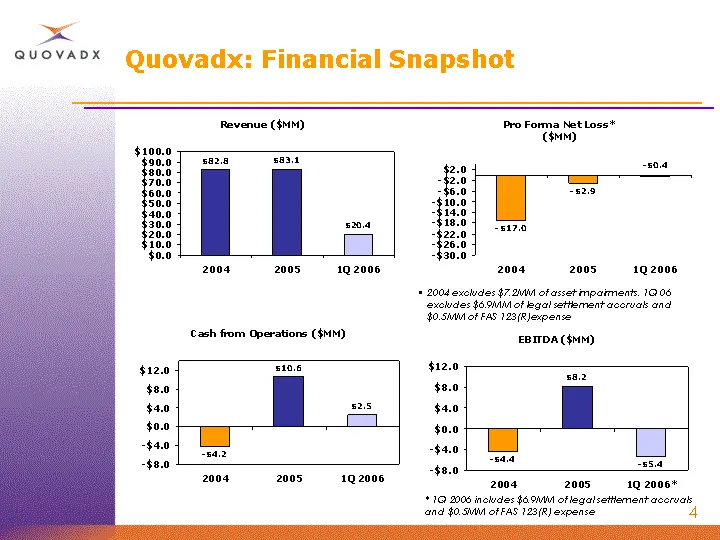
Quovadx: Financial Snapshot 2004 2005 1Q 2006 82.8 83.1 20.4 2004 2005 1Q 2006 -17 -2.9 -0.4 2004 2005 1Q 2006* -4.4 8.2 -5.4 * 1Q 2006 includes $6.9MM of legal settlement accruals and $0.5MM of FAS 123(R) expense 2004 2005 1Q 2006 -4.2 10.6 2.5 2004 excludes $7.2MM of asset impairments. 1Q 06 exclu
Slide 5: 2006-2008 Plan Objectives
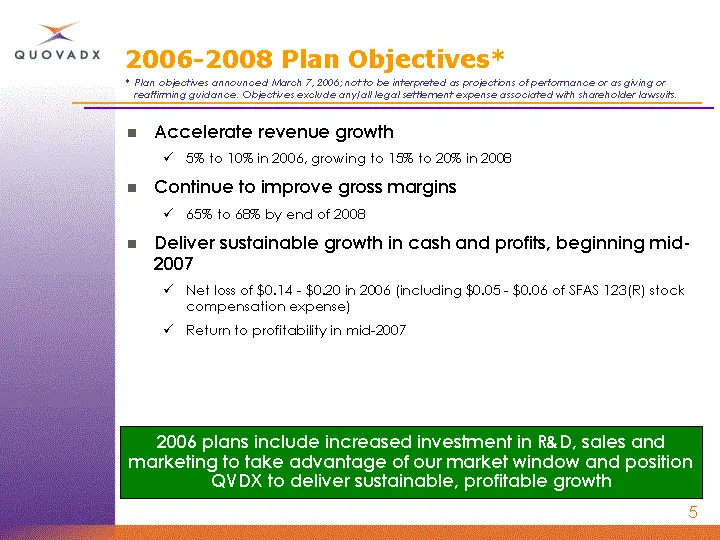
2006-2008 Plan Objectives* Accelerate revenue growth 5% to 10% in 2006, growing to 15% to 20% in 2008 Continue to improve gross margins 65% to 68% by end of 2008 Deliver sustainable growth in cash and profits, beginning mid- 2007 Net loss of $0.14 - $0.20 in 2006 (including $0.05 - $0.06 of SFAS 123
Slide 6: Three divisions enabling critical data-driven processes
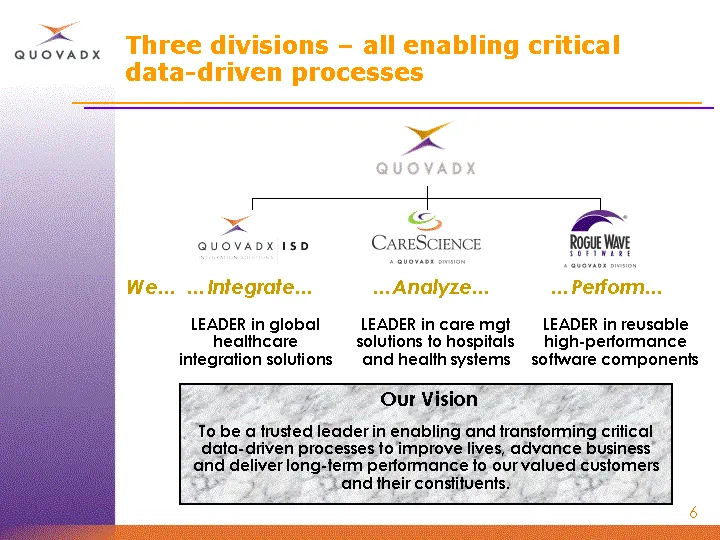
Three divisions - all enabling critical data-driven processes We... ....Integrate... ....Analyze... ....Perform... LEADER in reusable high-performance software components LEADER in global healthcare integration solutions LEADER in care mgt solutions to hospitals and health systems Our Vision To be a
Slide 7: Revenue Breakout by Market
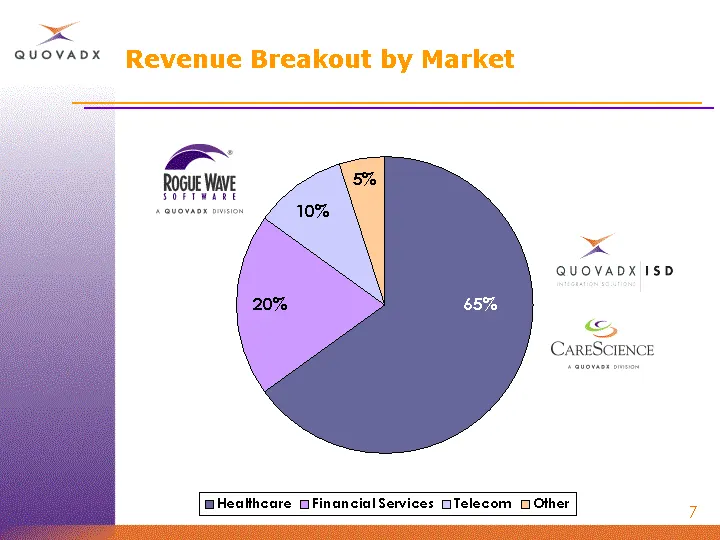
Revenue Breakout by Market Healthcare Financial Services Telecom Other 0.65 0.2 0.1 0.05 MSGraph.Chart.8 MSGraph.Chart.8 MSGraph.Chart.8
Slide 8: Markets are moving in our direction, in healthcare
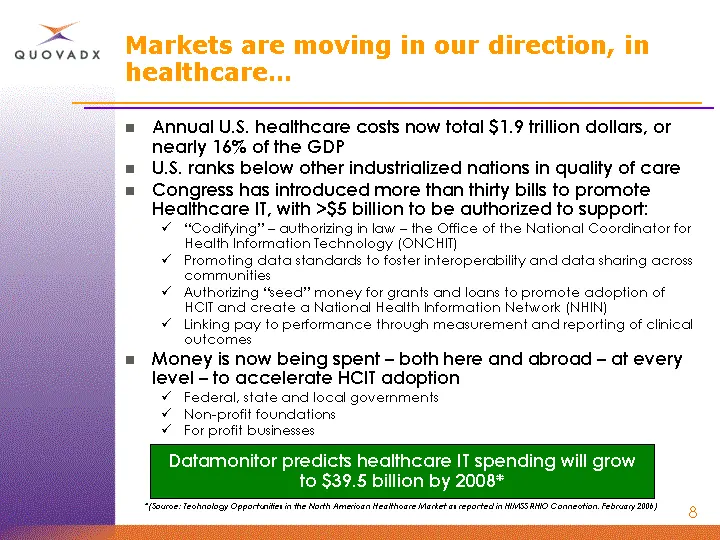
Markets are moving in our direction, in healthcare... Annual U.S. healthcare costs now total $1.9 trillion dollars, or nearly 16% of the GDP U.S. ranks below other industrialized nations in quality of care Congress has introduced more than thirty bills to promote Healthcare IT, with >$5 billion to b
Slide 9: ...and in software development
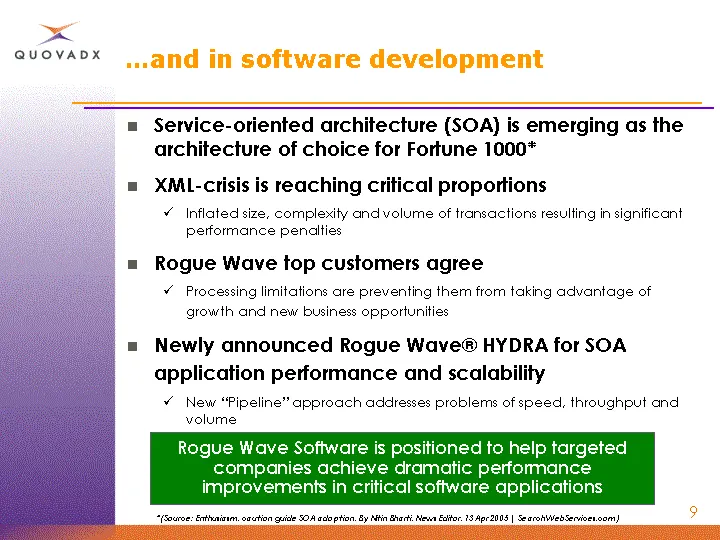
....and in software development Service-oriented architecture (SOA) is emerging as the architecture of choice for Fortune 1000* XML-crisis is reaching critical proportions Inflated size, complexity and volume of transactions resulting in significant performance penalties Rogue Wave top customers agr
Slide 10: Integration Solutions Division Addressable Market
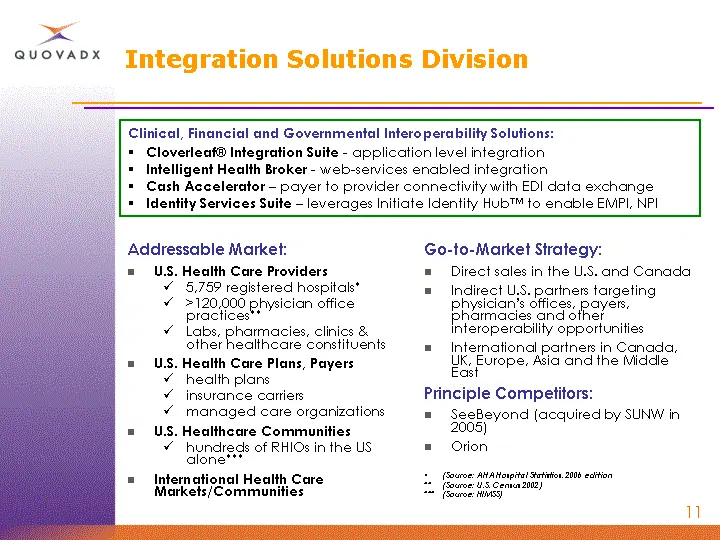
Integration Solutions Division Addressable Market: U.S. Health Care Providers 5,759 registered hospitals* >120,000 physician office practices** Labs, pharmacies, clinics & other healthcare constituents U.S. Health Care Plans, Payers health plans insurance carriers managed care organizations U.S. Hea
Slide 11: ISD Growth Initiatives
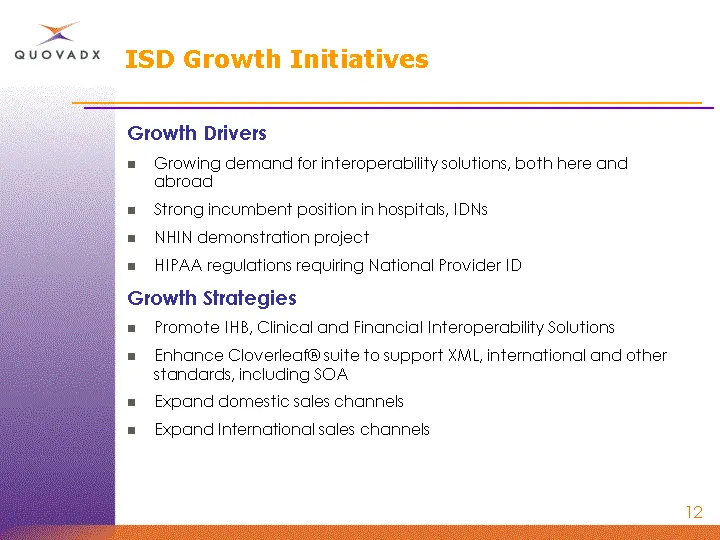
ISD Growth Initiatives Growth Drivers Growing demand for interoperability solutions, both here and abroad Strong incumbent position in hospitals, IDNs NHIN demonstration project HIPAA regulations requiring National Provider ID Growth Strategies Promote IHB, Clinical and Financial Interoperability So
Slide 12: CareScience Division
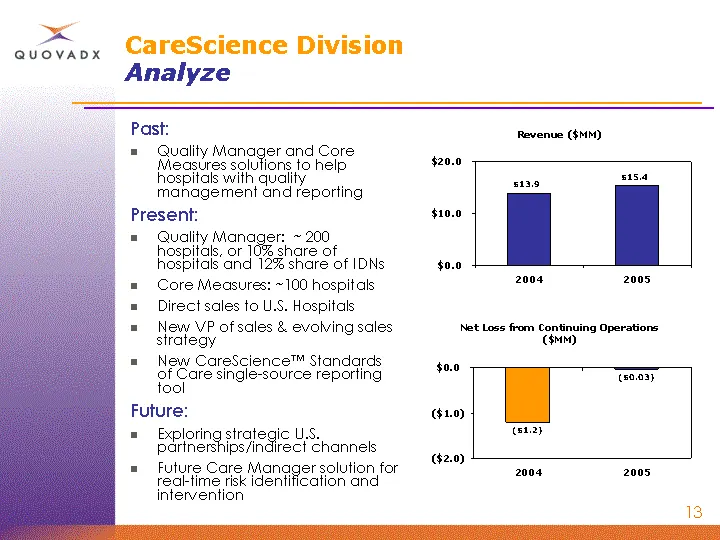
CareScience Division Analyze 2004 2005 Revenue 13.9 15.4 Past: Quality Manager and Core Measures solutions to help hospitals with quality management and reporting Present: Quality Manager: ~ 200 hospitals, or 10% share of hospitals and 12% share of IDNs Core Measures: ~100 hospitals Direct sales to
Slide 13: CareScience Division Addressable Market
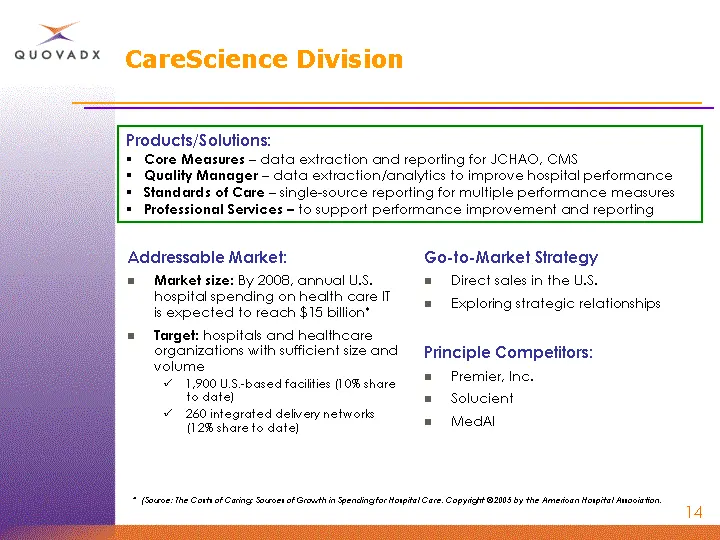
CareScience Division Addressable Market: Market size: By 2008, annual U.S. hospital spending on health care IT is expected to reach $15 billion* Target: hospitals and healthcare organizations with sufficient size and volume 1,900 U.S.-based facilities (10% share to date) 260 integrated delivery netw
Slide 14: CareScience Growth Initiatives
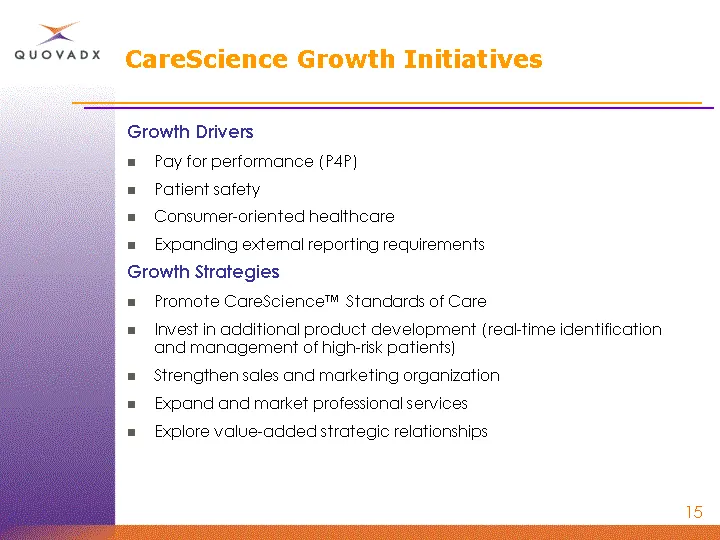
CareScience Growth Initiatives Growth Drivers Pay for performance (P4P) Patient safety Consumer-oriented healthcare Expanding external reporting requirements Growth Strategies Promote CareScience(tm) Standards of Care Invest in additional product development (real-time identification and management
Slide 15: Rogue Wave Software Division
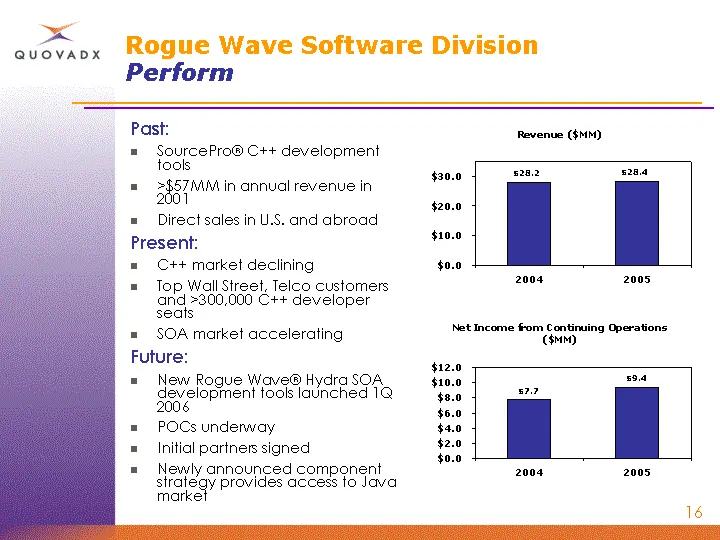
Rogue Wave Software Division Perform 2004 2005 Revenue 28.2 28.4 Past: SourcePro(r) C++ development tools >$57MM in annual revenue in 2001 Direct sales in U.S. and abroad Present: C++ market declining Top Wall Street, Telco customers and >300,000 C++ developer seats SOA market accelerating Future: N
Slide 16: Rogue Wave Software Division Addressable Market
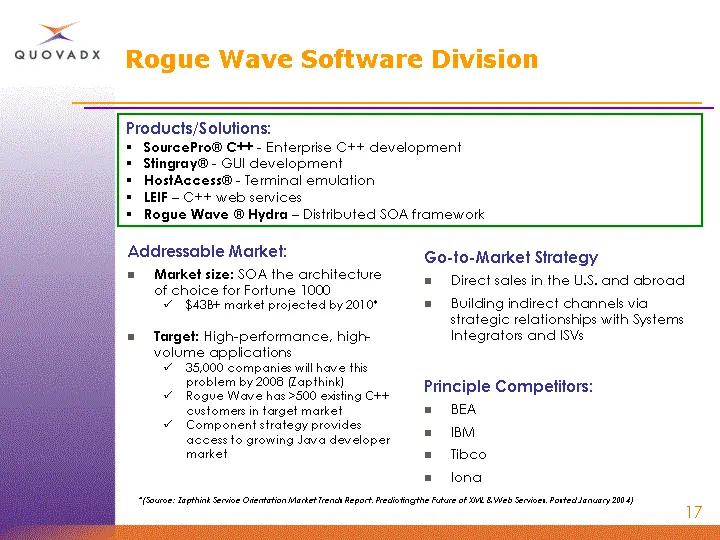
Rogue Wave Software Division Addressable Market: Market size: SOA the architecture of choice for Fortune 1000 $43B+ market projected by 2010* Target: High-performance, high- volume applications 35,000 companies will have this problem by 2008 (Zapthink) Rogue Wave has >500 existing C++ customers in t
Slide 17: Rogue Wave Software Growth Initiatives
Rogue Wave Software Growth Initiatives Growth Drivers Growing demand for SOA Strong incumbent position with professional developers High performance requirements of current and prospective customers Growth Strategies Leverage customer base for expanded professional service offerings Focus on high pe
Slide 18: We expect to leverage synergies as we go forward
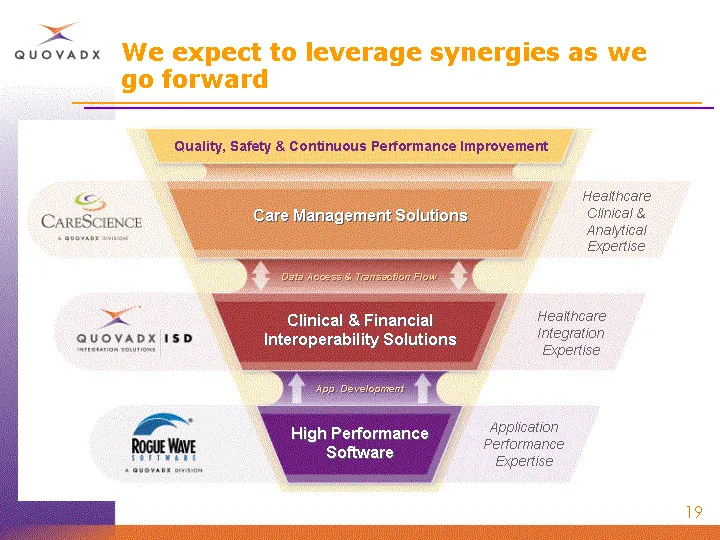
High Performance Software Clinical & Financial Interoperability Solutions Care Management Solutions Quality, Safety & Continuous Performance Improvement Data Access & Transaction Flow App. Development Healthcare Clinical & Analytical Expertise Healthcare Integration Expertise Application Performance
Slide 19: QVDX 1Q 2006 Financial Highlights
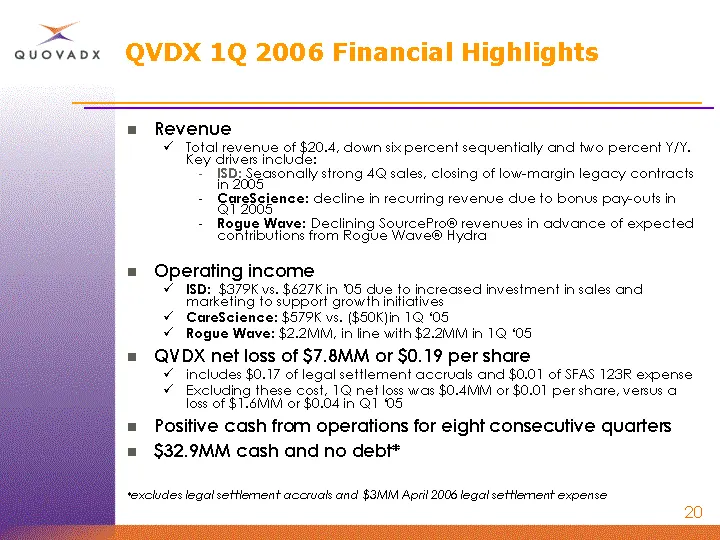
QVDX 1Q 2006 Financial Highlights Revenue Total revenue of $20.4, down six percent sequentially and two percent Y/Y. Key drivers include: ISD: Seasonally strong 4Q sales, closing of low-margin legacy contracts in 2005 CareScience: decline in recurring revenue due to bonus pay-outs in Q1 2005 Rogue W
Slide 20: Summary
Summary Challenges Grow revenue Successfully execute growth strategies Replace MUSC revenue Build/leverage synergies between divisions Grow cash and profits Increase investment in R&D, sales and marketing to accelerate growth Use internally generated cash Drive to sustainable growth in cash and prof
Slide 21: Detailed 1Q 2006 Financial Results
Detailed 1Q 2006 Financial Results
Slide 22: Revenue
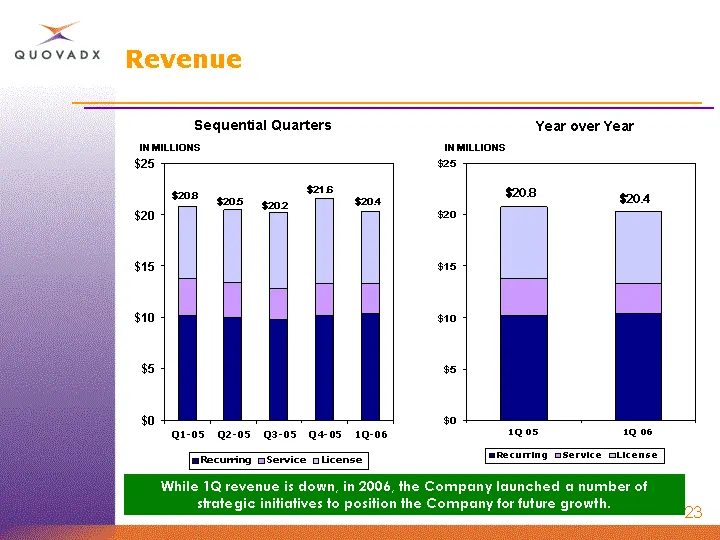
Revenue Q1-05 Q2-05 Q3-05 Q4-05 1Q-06 Recurring 10.2 10 9.8 10.2 10.4 Service 3.6 3.4 3 3.1 2.9 License 7 7.1 7.4 8.3 7 1Q 05 1Q 06 Recurring 10.2 10.4 Service 3.6 2.9 License 7 7 $20.8 $20.4 $20.8 $20.5 $20.2 IN MILLIONS IN MILLIONS $21.6 Year over Year $20.4 While 1Q revenue is down, in 2006, the
Slide 23: Gross Margin
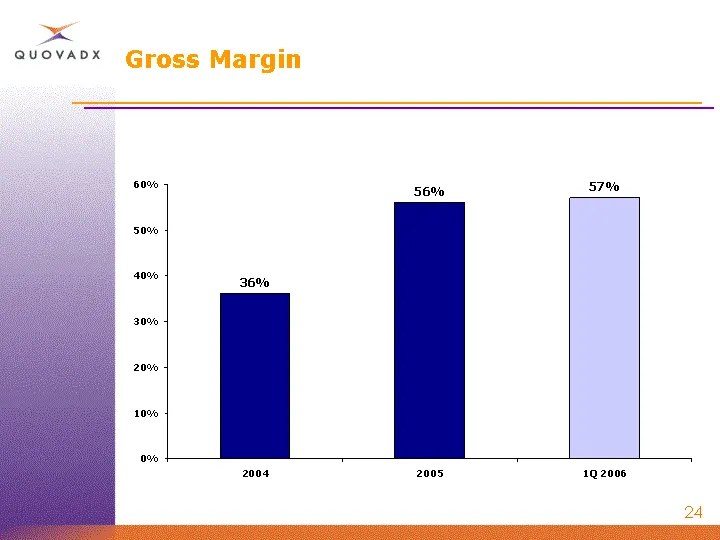
Gross Margin 2004 2005 1Q 2006 East 0.36 0.56 0.57
Slide 24: Earnings Per Share
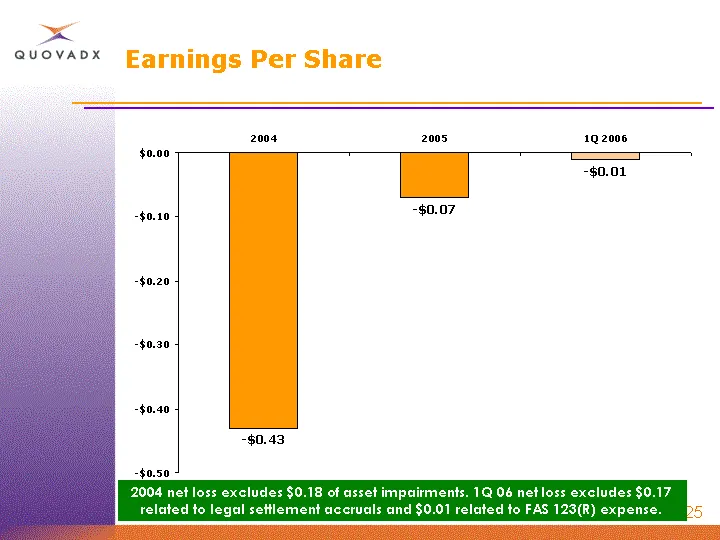
Earnings Per Share 2004 2005 1Q 2006 East -0.43 -0.07 -0.01 2004 net loss excludes $0.18 of asset impairments. 1Q 06 net loss excludes $0.17 related to legal settlement accruals and $0.01 related to FAS 123(R) expense.
Slide 25: EBITDA
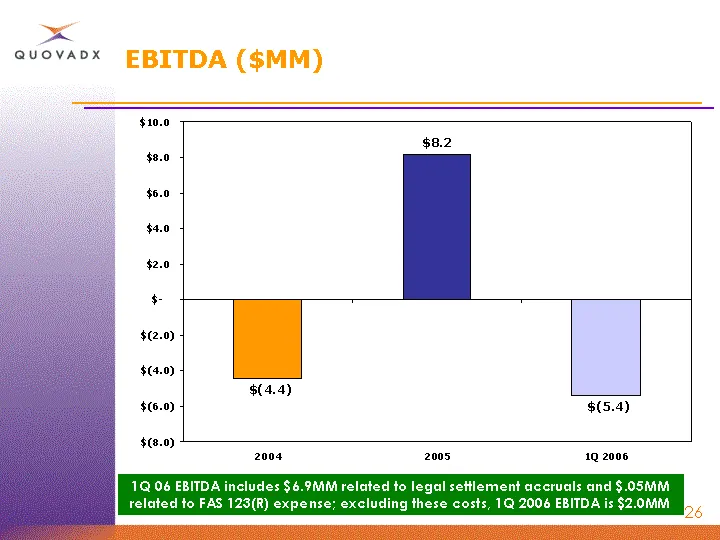
EBITDA ($MM) 2004 2005 1Q 2006 -4.4 8.2 -5.4 1Q 06 EBITDA includes $6.9MM related to legal settlement accruals and $.05MM related to FAS 123(R) expense; excluding these costs, 1Q 2006 EBITDA is $2.0MM
Slide 26: Cash
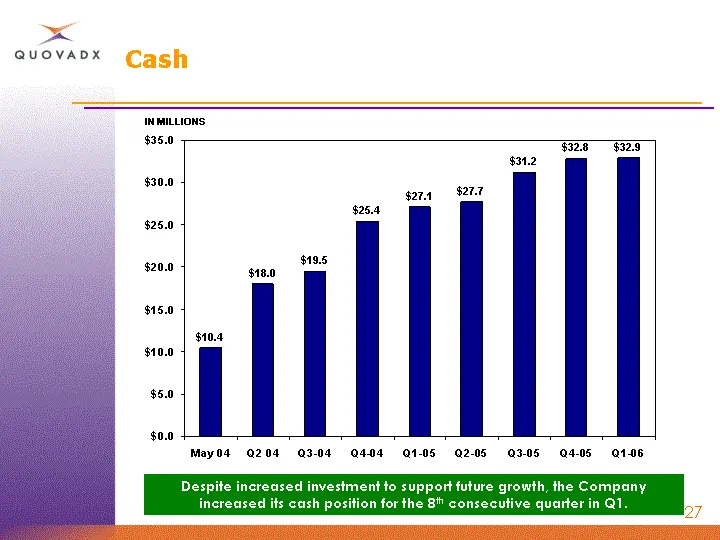
Cash May 04 Q2 04 Q3-04 Q4-04 Q1-05 Q2-05 Q3-05 Q4-05 Q1-06 Cash 10.4 18 19.5 25.4 27.1 27.7 31.2 32.8 32.9 IN MILLIONS Despite increased investment to support future growth, the Company increased its cash position for the 8th consecutive quarter in Q1.
Slide 27: Balance Sheet Summary
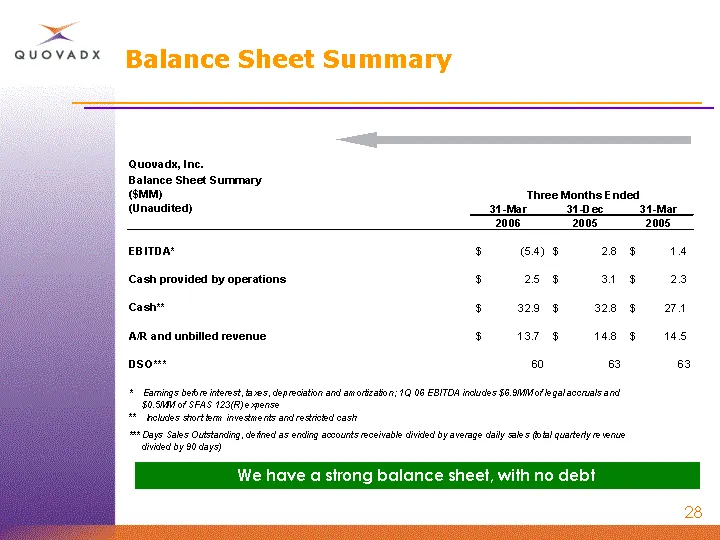
Balance Sheet Summary We have a strong balance sheet, with no debt
Slide 28: EBITDA Reconciliation
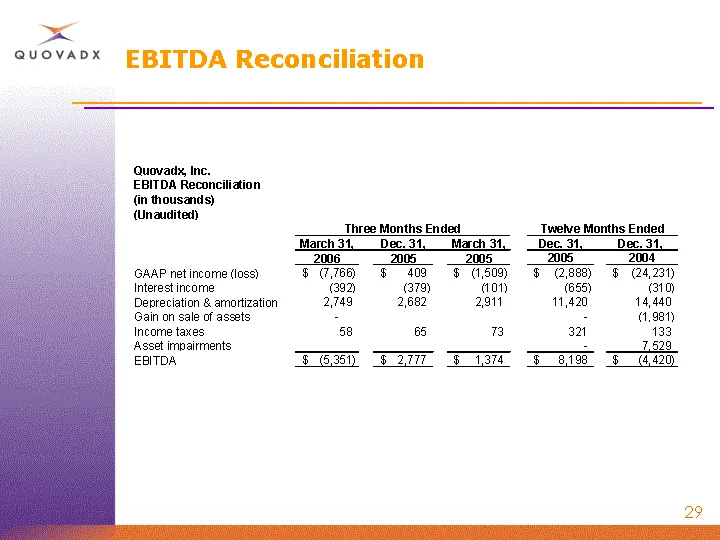
< evovacx EBITDA Reconciliation Quovadx, Inc. EBITDA Reconciliation (Gin thousands) (Wnaudited) Three Months Ended Twelve Months Ended March 31, Dec.34, March 31, Dec. 31, Der. 31, 2006 2005 __2005 2005 2004 GAAP net income (loss) B (7,766) 409° (1,80) SF 2,888) $F (24,231) Interest income er) (379)

Slide 29: Q&A
Q&A For additional information: Rebecca Winning, VP Investor Relations 720-554-1346 Rebecca.winning@quovadx.com www.quovadx.com
Source: SEC EDGAR · 8-K filed May 8, 2006
More decks from Quovadx Inc
 Merger or Acquisition (June 2007)12 slides · Jun 25, 2007
 Merger or Acquisition (April 2007)11 slides · Apr 2, 2007
 Investor Presentation (March 2007)42 slides · Mar 13, 2007
 Investor Presentation (March 2006)39 slides · Mar 10, 2006
 Rogue Wave Software — Merger or Acquisition (November 2003)30 slides · Nov 13, 2003
 Rogue Wave Software — Merger or Acquisition (November 2003)32 slides · Nov 7, 2003