Matrix Service Company · NASDAQ:MTRX
Matrix Service — Q1 2025 Earnings Presentation
17 slides from Matrix Service's earnings presentation, Nov 7, 2024
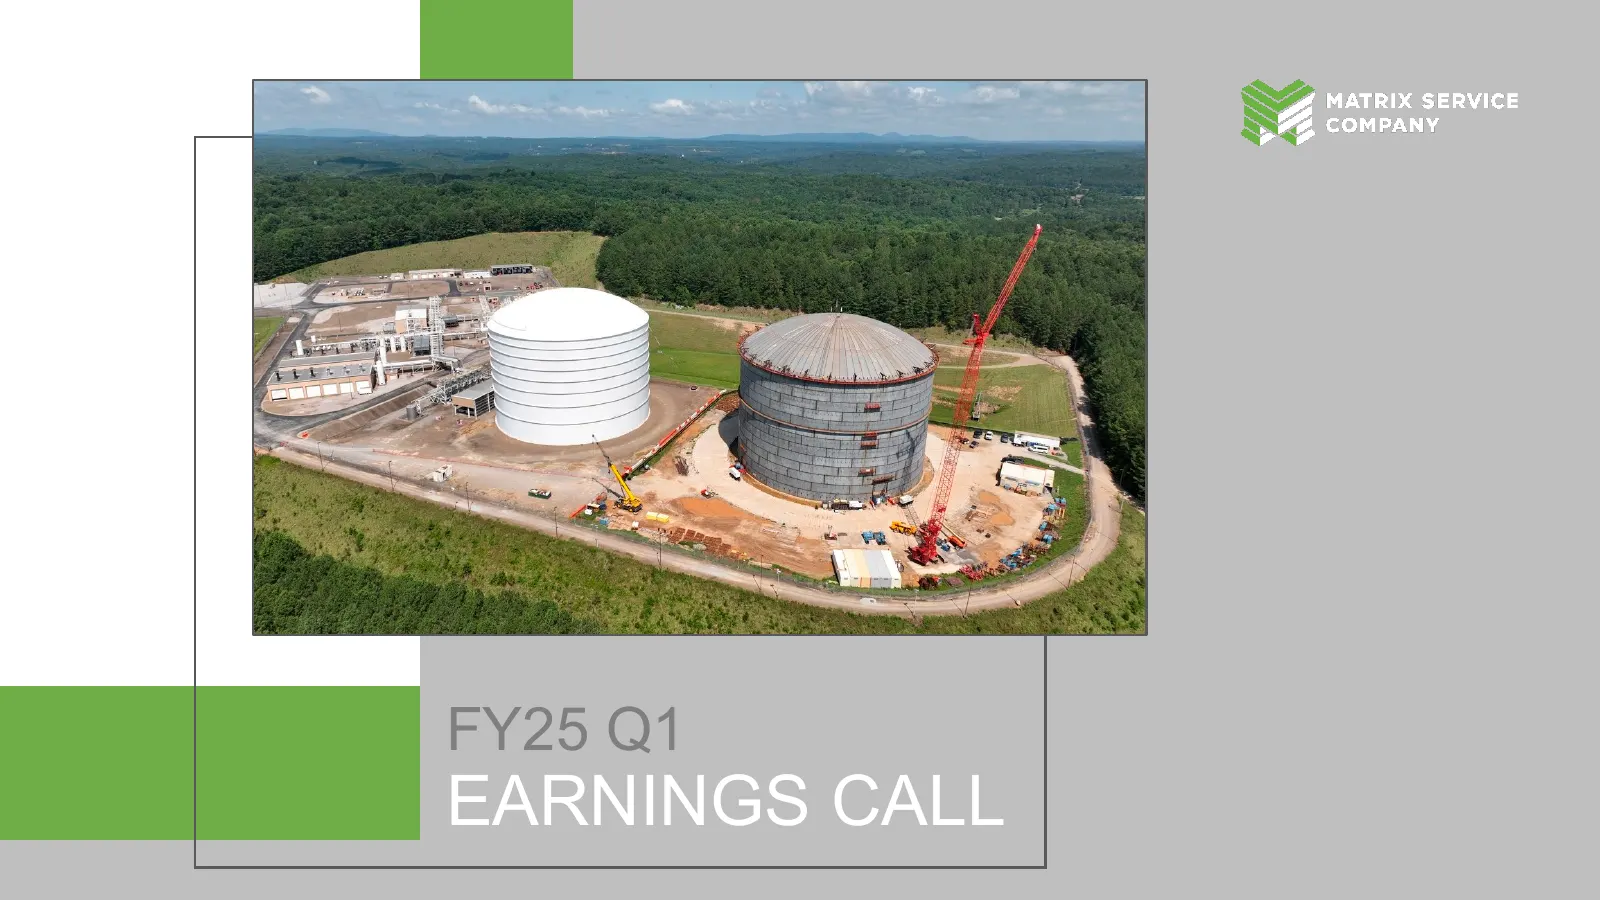
Slide 1: FY25 Q1 Earnings Call
FY25 Q1 EARNINGS CALL 1
Slide 2: Safe Harbor
SAFE HARBOR This presentation contains certain forward-looking statements concerning Matrix Service Company’s operations, economic performance and management’s best judgment as to what may occur in the future. The actual results for the current and future periods and other corporate developments wil
Slide 3: Investor Corporate Access
INVESTOR CORPORATE ACCESS CONTACT Kellie Smythe Senior Director of Investor Relations T • 918 838 8822 E • ir@matrixservicecompany.com 3

Slide 4: Safety Moment
SAFETY MOMENT 4
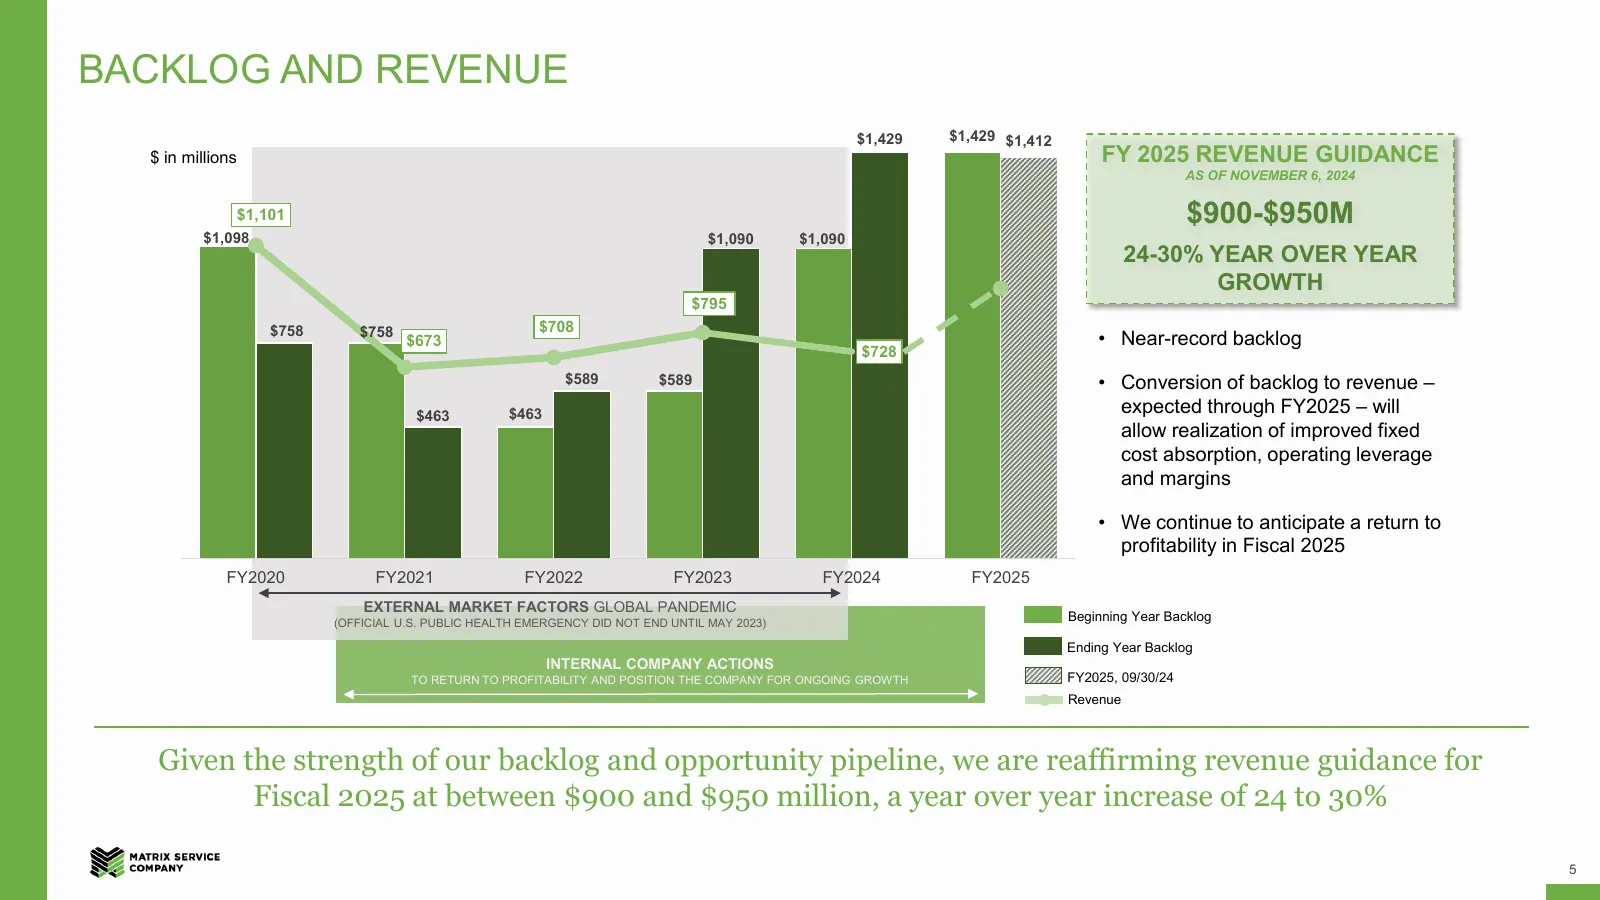
Slide 5: Backlog and Revenue
BACKLOG AND REVENUE $1,429 $1,429 $1,412 $ in millions FY 2025 REVENUE GUIDANCE AS OF NOVEMBER 6, 2024 $1,101 $900-$950M $1,098 $1,090 $1,090 24-30% YEAR OVER YEAR GROWTH $795 $758 $758 $708 $673 • Near-record backlog $728 $589 $589 • Conversion of backlog to revenue – $463 $463 expected through FY2
Slide 6: Global Megatrends Are Driving Significant Infrastructure Demand
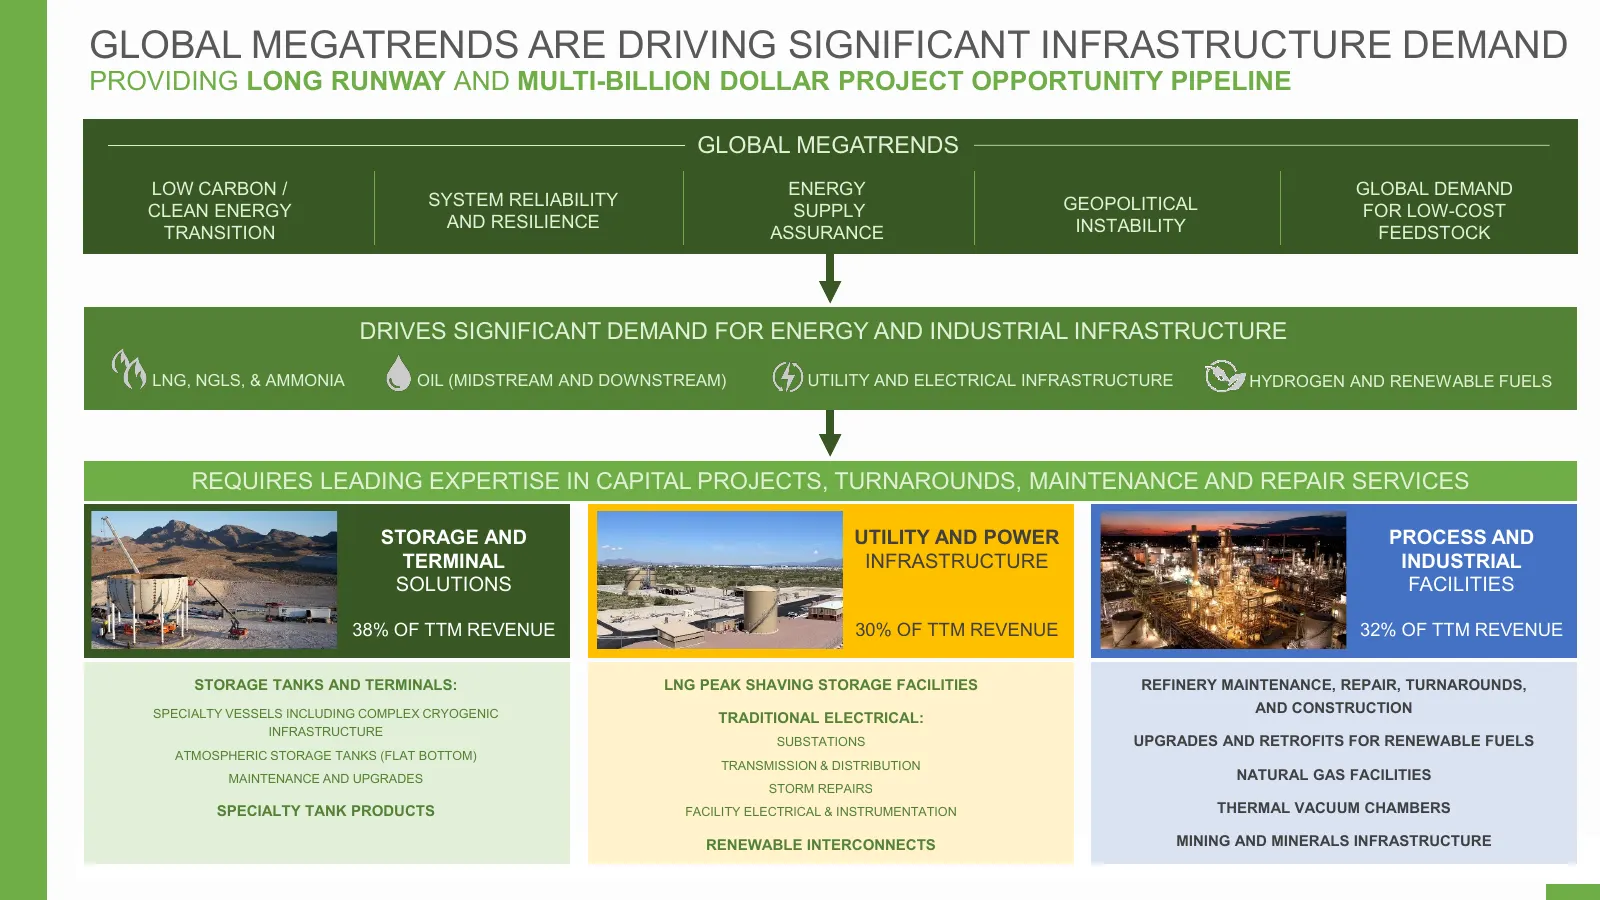
GLOBAL MEGATRENDS ARE DRIVING SIGNIFICANT INFRASTRUCTURE DEMAND PROVIDING LONG RUNWAY AND MULTI-BILLION DOLLAR PROJECT OPPORTUNITY PIPELINE GLOBAL MEGATRENDS LOW CARBON / ENERGY GLOBAL DEMAND SYSTEM RELIABILITY GEOPOLITICAL CLEAN ENERGY SUPPLY FOR LOW-COST AND RESILIENCE INSTABILITY TRANSITION ASSUR
Slide 7: Opportunity Pipeline $5.8B
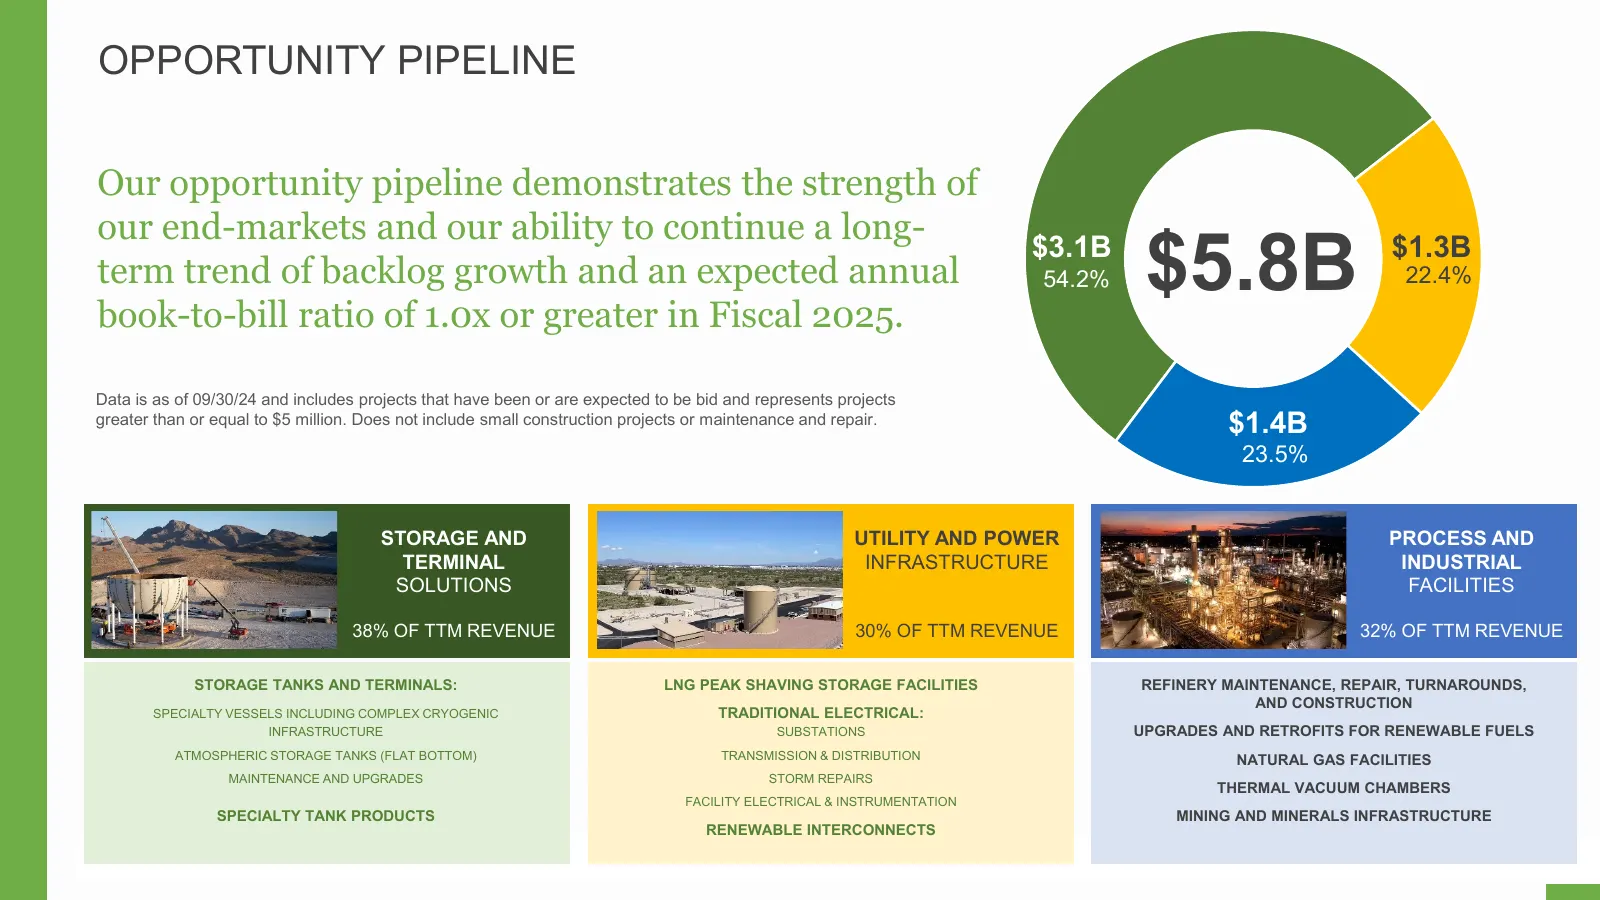
OPPORTUNITY PIPELINE Our opportunity pipeline demonstrates the strength of our end-markets and our ability to continue a long- term trend of backlog growth and an expected annual book-to-bill ratio of 1.0x or greater in Fiscal 2025. $3.1B 54.2% $5.8B $1.3B 22.4% Data is as of 09/30/24 and includes p
Slide 8: The Matrix Opportunity
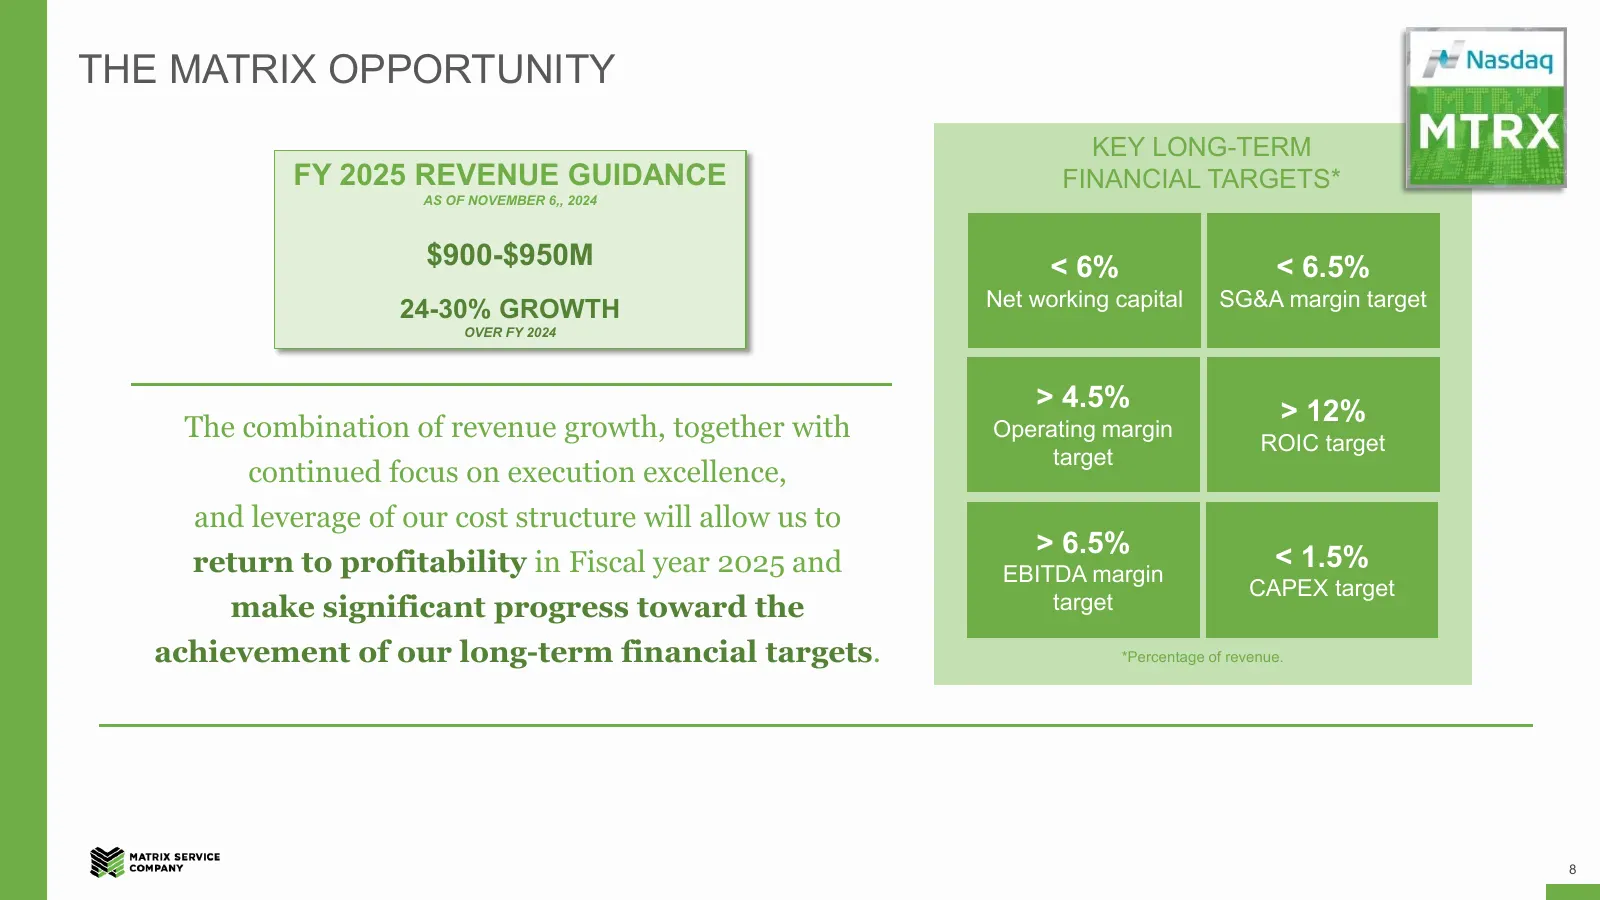
THE MATRIX OPPORTUNITY KEY LONG-TERM FY 2025 REVENUE GUIDANCE FINANCIAL TARGETS* AS OF NOVEMBER 6,, 2024 $900-$950M < 6% < 6.5% 24-30% GROWTH Net working capital SG&A margin target OVER FY 2024 > 4.5% > 12% The combination of revenue growth, together with Operating margin ROIC target target continue
Slide 9: Quarterly Results | Consolidated
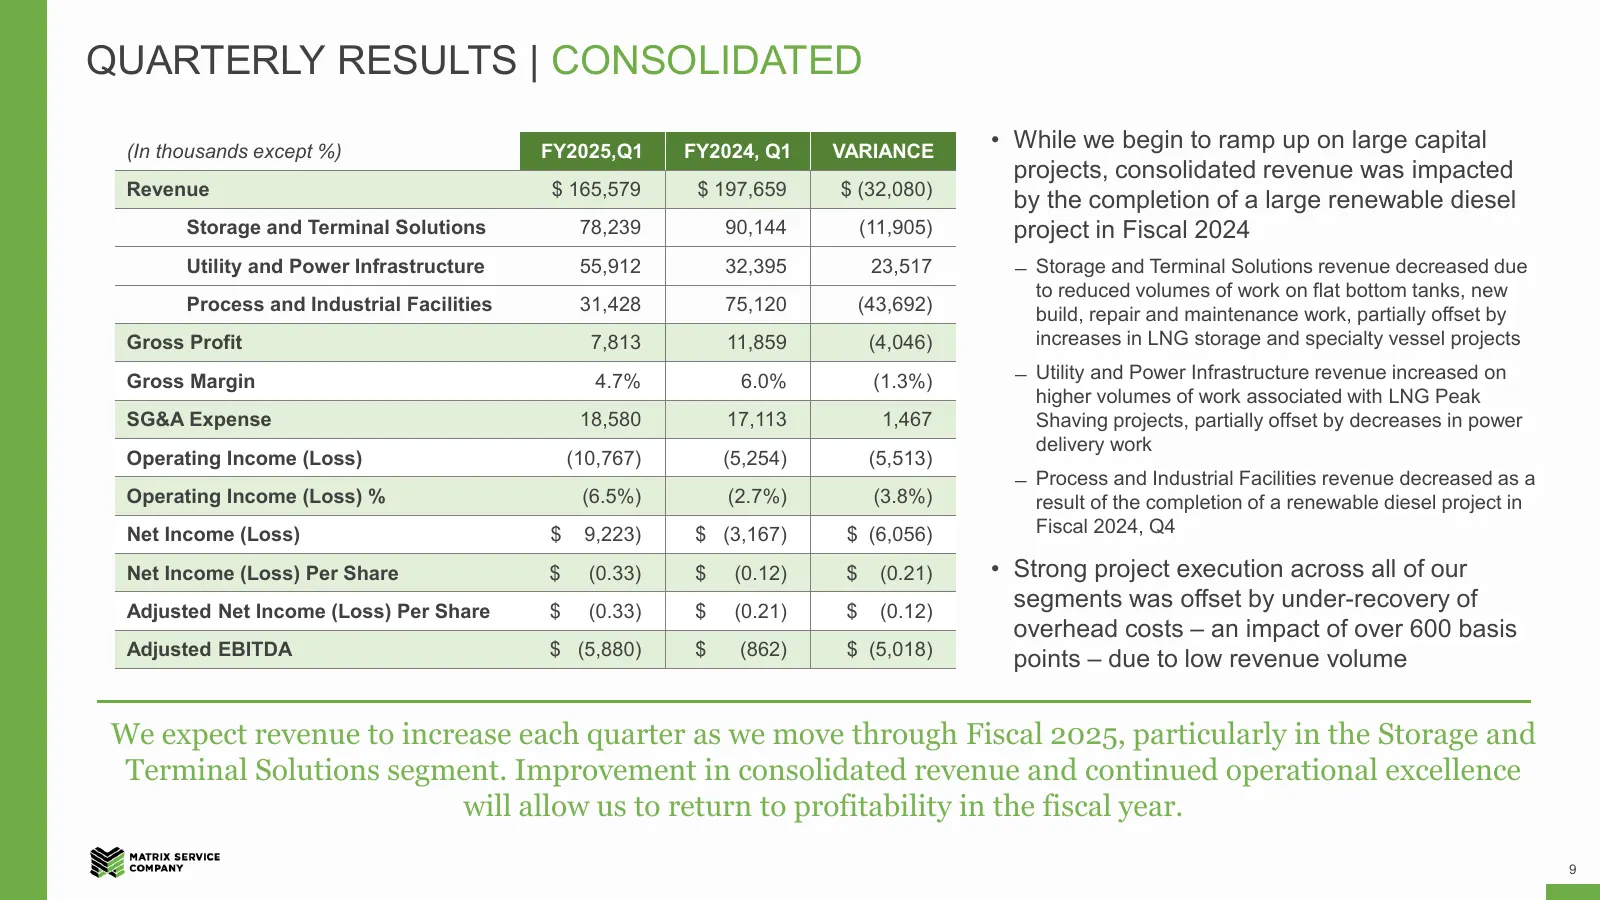
QUARTERLY RESULTS | CONSOLIDATED (In thousands except %) FY2025,Q1 FY2024, Q1 VARIANCE • While we begin to ramp up on large capital projects, consolidated revenue was impacted Revenue $ 165,579 $ 197,659 $ (32,080) by the completion of a large renewable diesel Storage and Terminal Solutions 78,239 9
Slide 10: FY 2025 Q1 Backlog, Project Awards, Opportunity Pipeline
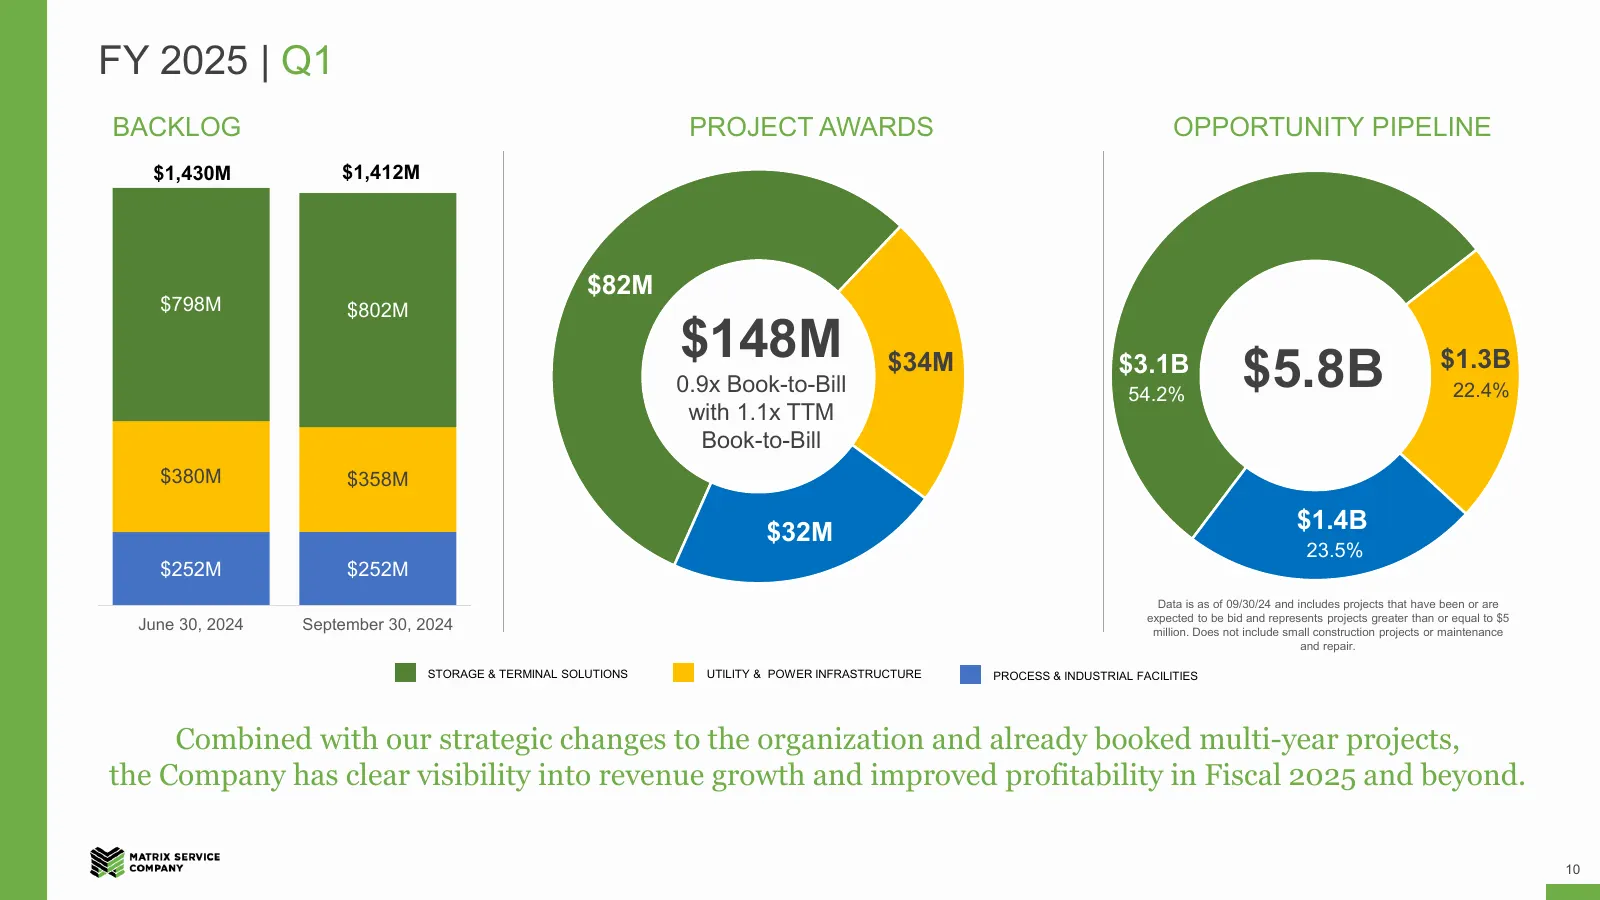
FY 2025 | Q1 BACKLOG PROJECT AWARDS OPPORTUNITY PIPELINE $1,430M $1,412M $82M $798M $802M $148M 0.9x Book-to-Bill $34M $3.1B $3.2B 54.2% $5.8B $1.3B 22.4% with 1.1x TTM Book-to-Bill $380M $358M $32M $1.4B $1.7B 23.5% $252M $252M Data is as of 09/30/24 and includes projects that have been or are expe
Slide 11: Fiscal Year 2025, Q1 Cash Bridge and Liquidity
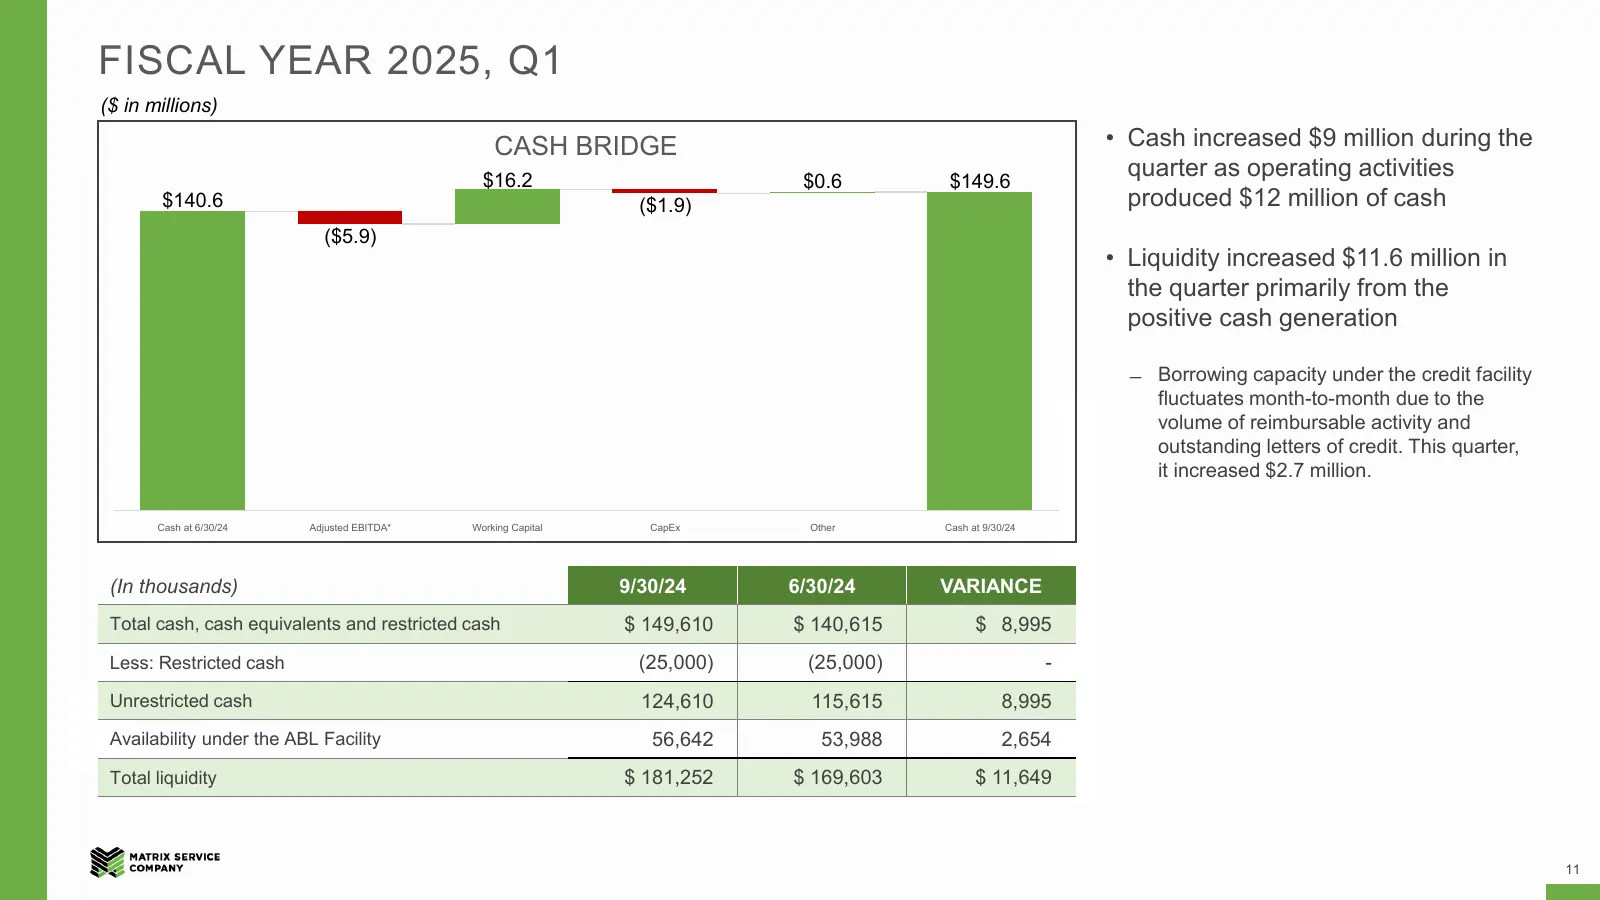
FISCAL YEAR 2025, Q1 ($ in millions) CASH BRIDGE • Cash increased $9 million during the $16.2 $0.6 $149.6 quarter as operating activities $140.6 ($1.9) produced $12 million of cash ($5.9) • Liquidity increased $11.6 million in the quarter primarily from the positive cash generation ̶ Borrowing capac
Slide 12: The Matrix Opportunity
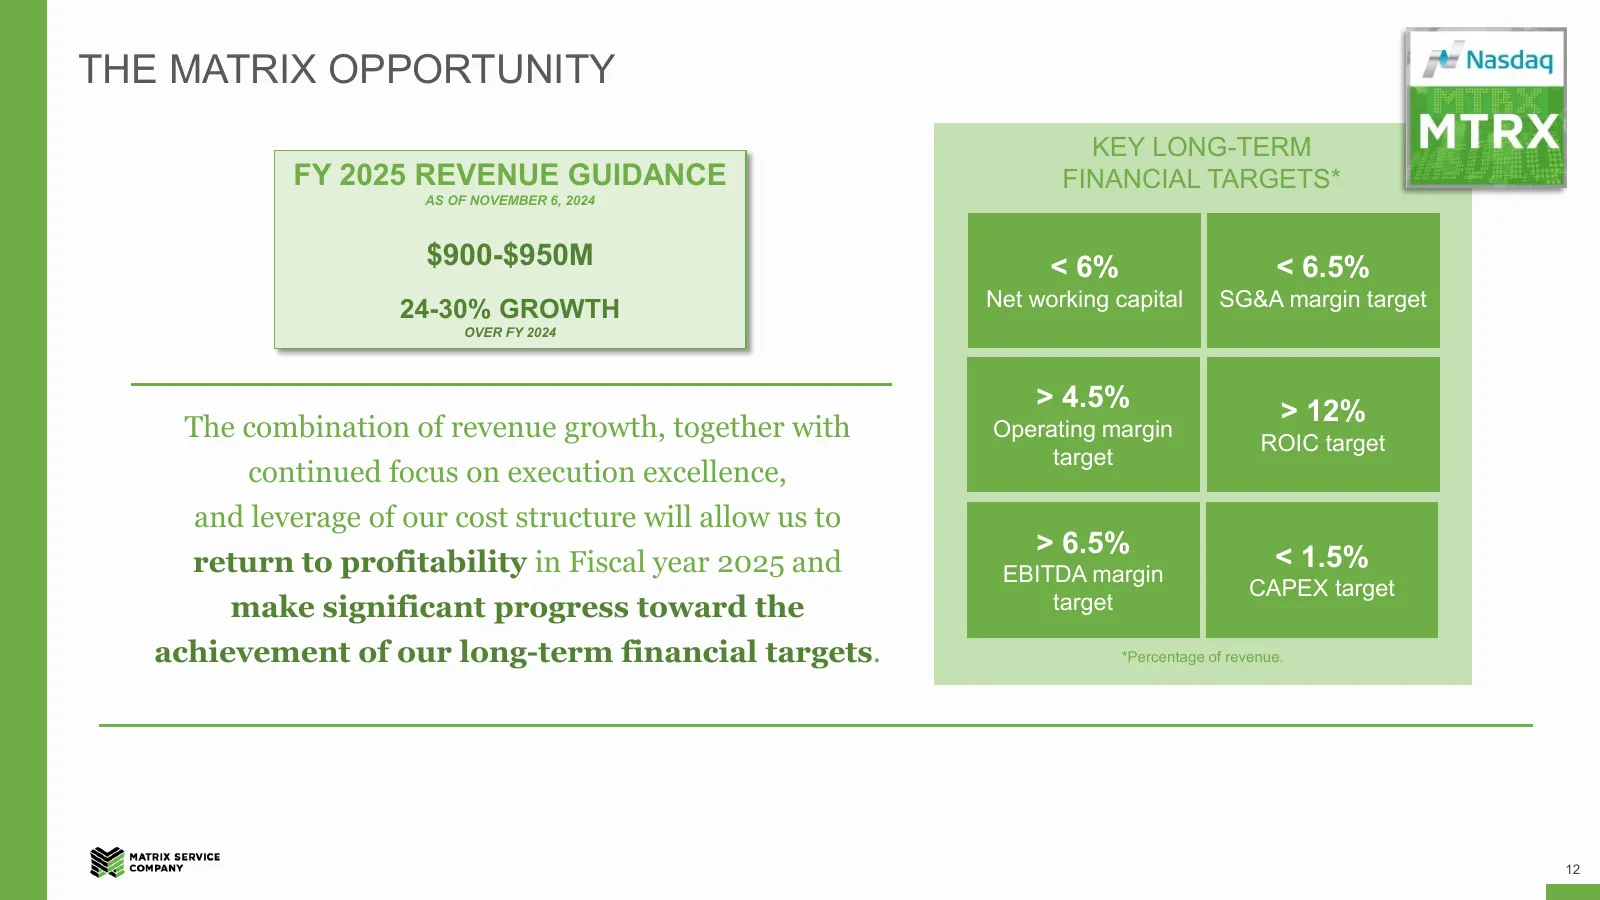
THE MATRIX OPPORTUNITY KEY LONG-TERM FY 2025 REVENUE GUIDANCE FINANCIAL TARGETS* AS OF NOVEMBER 6, 2024 $900-$950M < 6% < 6.5% 24-30% GROWTH Net working capital SG&A margin target OVER FY 2024 > 4.5% > 12% The combination of revenue growth, together with Operating margin ROIC target target continued

Slide 13: Q&A
Q&A 13
Slide 14: Investor Corporate Access
INVESTOR CORPORATE ACCESS CONTACT Kellie Smythe Senior Director of Investor Relations T • 918 838 8822 E • ir@matrixservicecompany.com 14

Slide 15: Appendix
APPENDIX 15
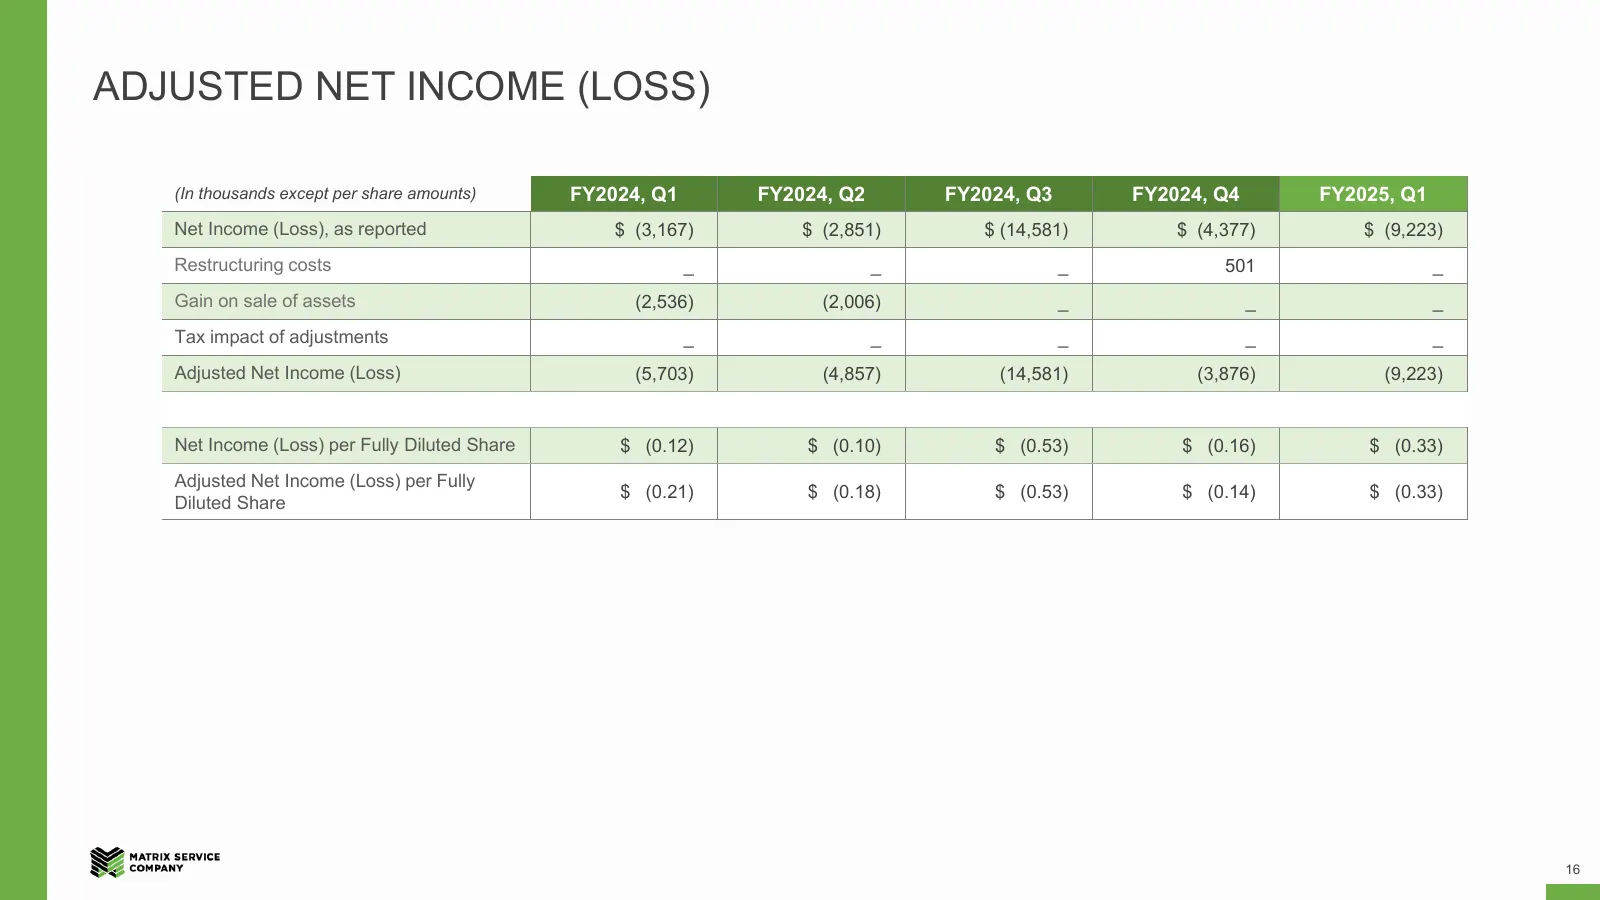
Slide 16: Adjusted Net Income (Loss)
ADJUSTED NET INCOME (LOSS) (In thousands except per share amounts) FY2024, Q1 FY2024, Q2 FY2024, Q3 FY2024, Q4 FY2025, Q1 Net Income (Loss), as reported $ (3,167) $ (2,851) $ (14,581) $ (4,377) $ (9,223) Restructuring costs _ _ _ 501 _ Gain on sale of assets (2,536) (2,006) _ _ _ Tax impact of adjus
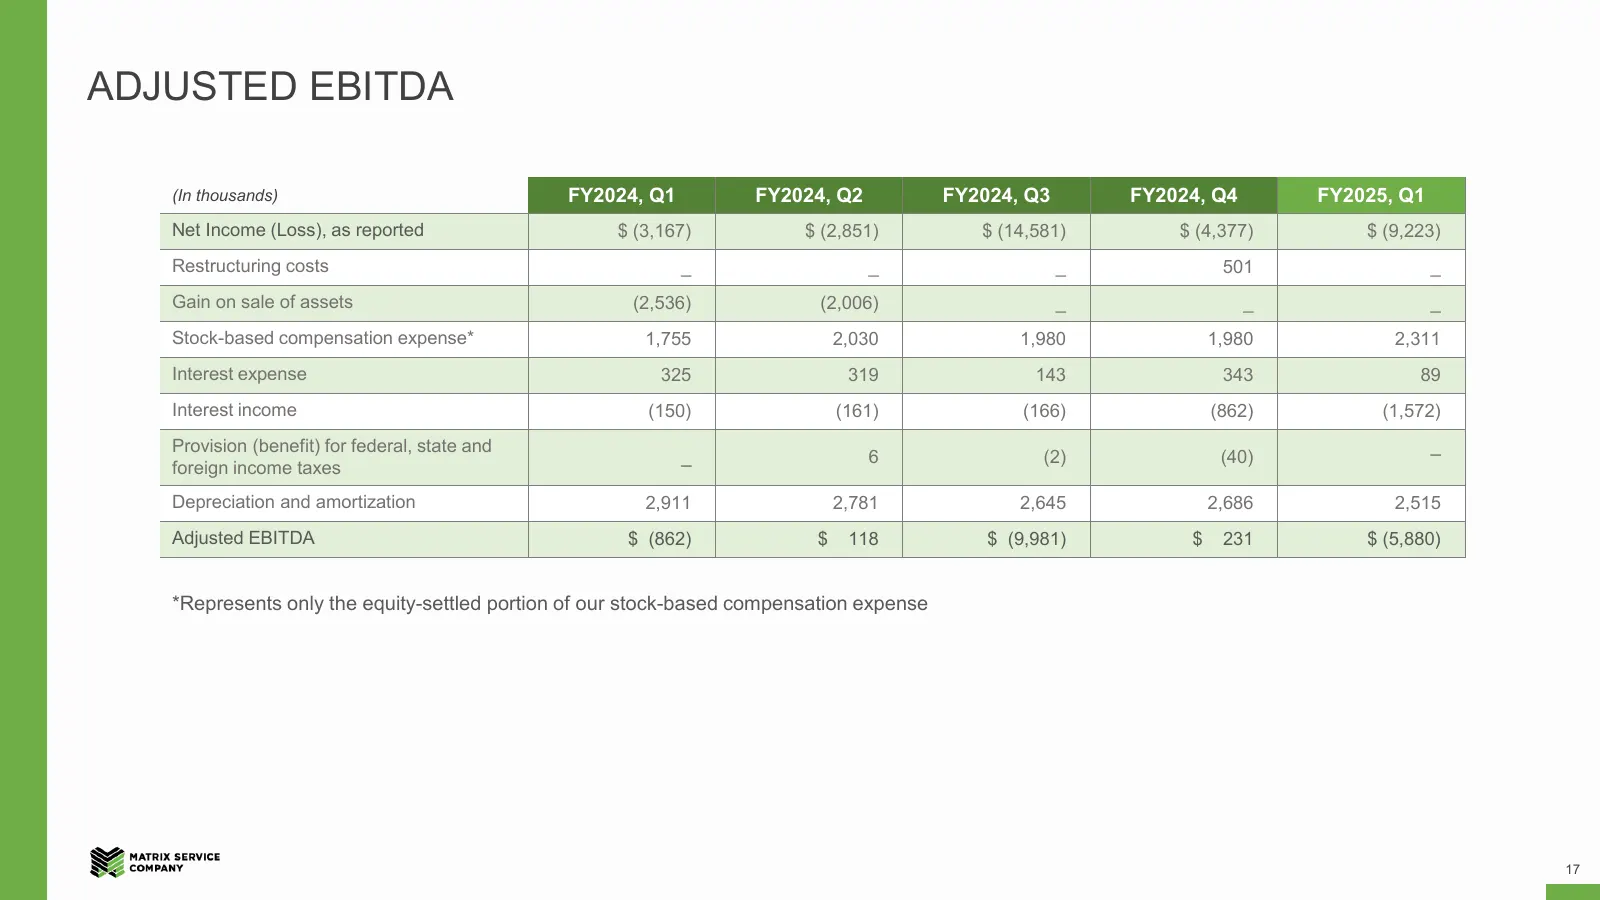
Slide 17: Adjusted EBITDA
ADJUSTED EBITDA (In thousands) FY2024, Q1 FY2024, Q2 FY2024, Q3 FY2024, Q4 FY2025, Q1 Net Income (Loss), as reported $ (3,167) $ (2,851) $ (14,581) $ (4,377) $ (9,223) Restructuring costs _ _ _ 501 _ Gain on sale of assets (2,536) (2,006) _ _ _ Stock-based compensation expense* 1,755 2,030 1,980 1,9
Source: 6ix earnings call
More decks from Matrix Service Company
 Q4 FY2026 Earnings Presentation21 slides · September 2026
 Q3 2026 Earnings Presentation22 slides · May 7, 2026
 Q2 2026 Earnings Presentation24 slides · Feb 5, 2026
 Q1 2026 Earnings Presentation25 slides · Nov 6, 2025
 Q4 2025 Earnings Presentation25 slides · Sep 10, 2025
 Q3 2025 Earnings Presentation23 slides · May 8, 2025