Matrix Service Company · NASDAQ:MTRX
Matrix Service — Q4 FY2026 Earnings Presentation
21 slides from Matrix Service's earnings presentation, September 2026
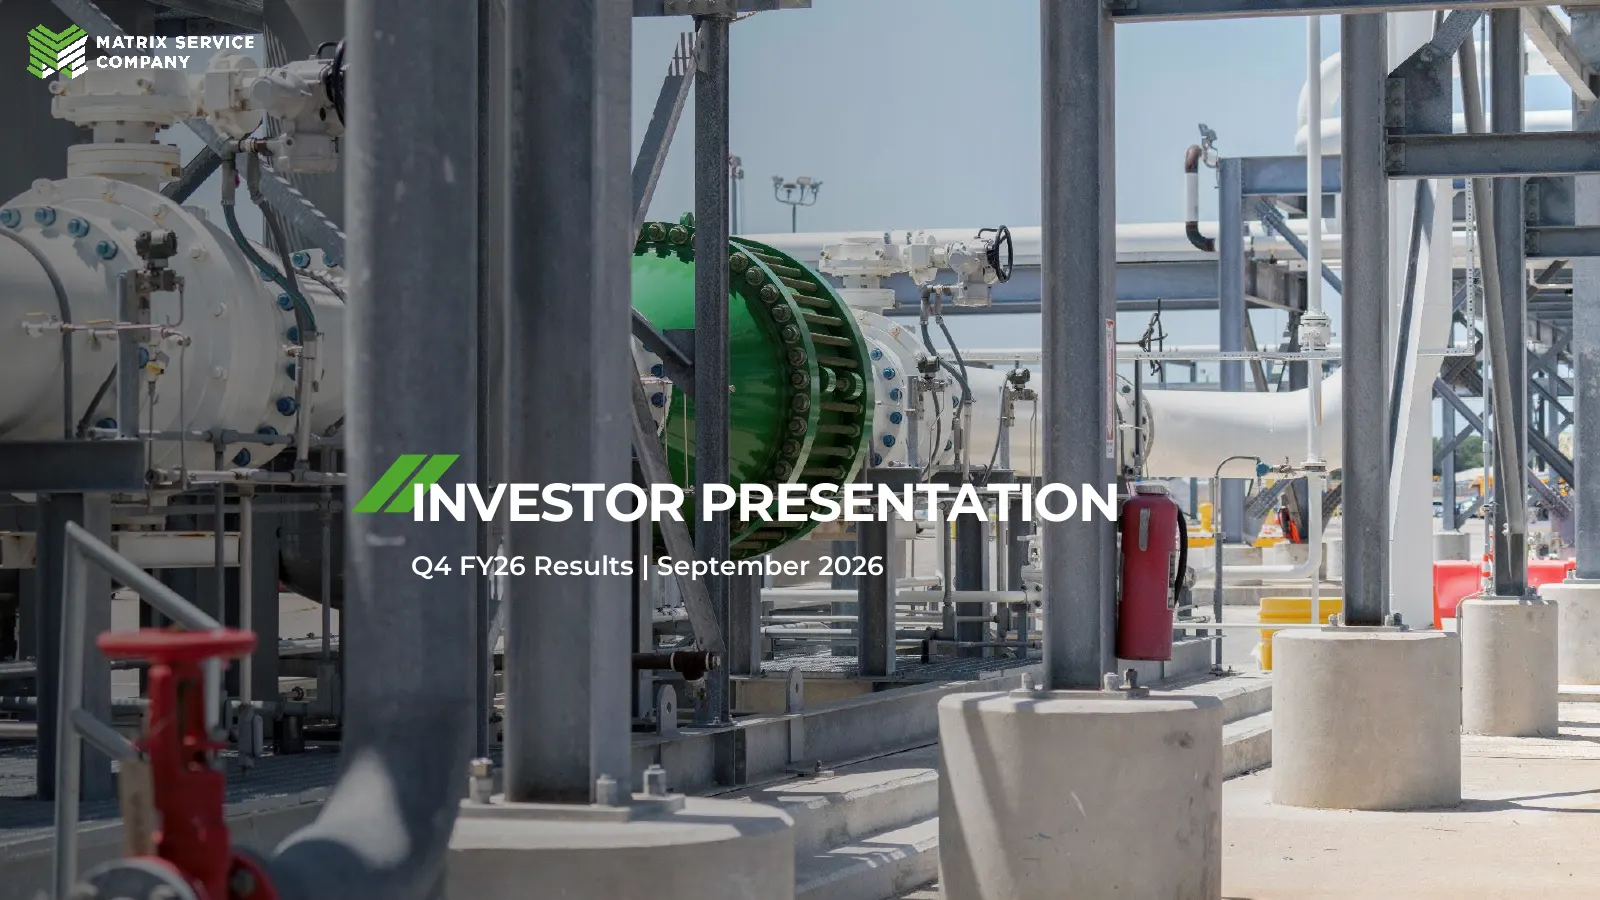
Slide 1: Investor Presentation Q4 FY26 Results
INVESTOR PRESENTATION Q4 FY26 Results | September 2026
Slide 2: Safe Harbor Statement
Safe Harbor Statement This presentation contains forward-looking statements that are made in reliance upon the safe harbor provisions of the Private Securities Litigation Reform Act of 1995. These statements are generally accompanied by words such as “anticipate,” “continues,” “expect,” “forecast,”
Slide 3: Investor Conference and Investor Corporate Access
Investor Conference Investor Corporate Access September 23-25, 2026 Patrick Roberts, Director of Corporate Development and Investor Relations 25th Annual Diversified T • 918 359-8249 Industrials & Services E • ir@matrixservicecompany.com Conference Nashville, Tennessee SCAN QR CODE TO SIGN UP FOR MT
Slide 4: Investing in MTRX
Investing in MTRX • Leading EPC contractor with a 40+ year history serving critical energy and industrial infrastructure markets • Unique cryogenic storage, terminal, and specialty fabrication capabilities supporting both traditional and emerging energy markets • Significant exposure to attractive l
Slide 5: Business Overview
> FA a = 9 oO MATRIX S " cA a
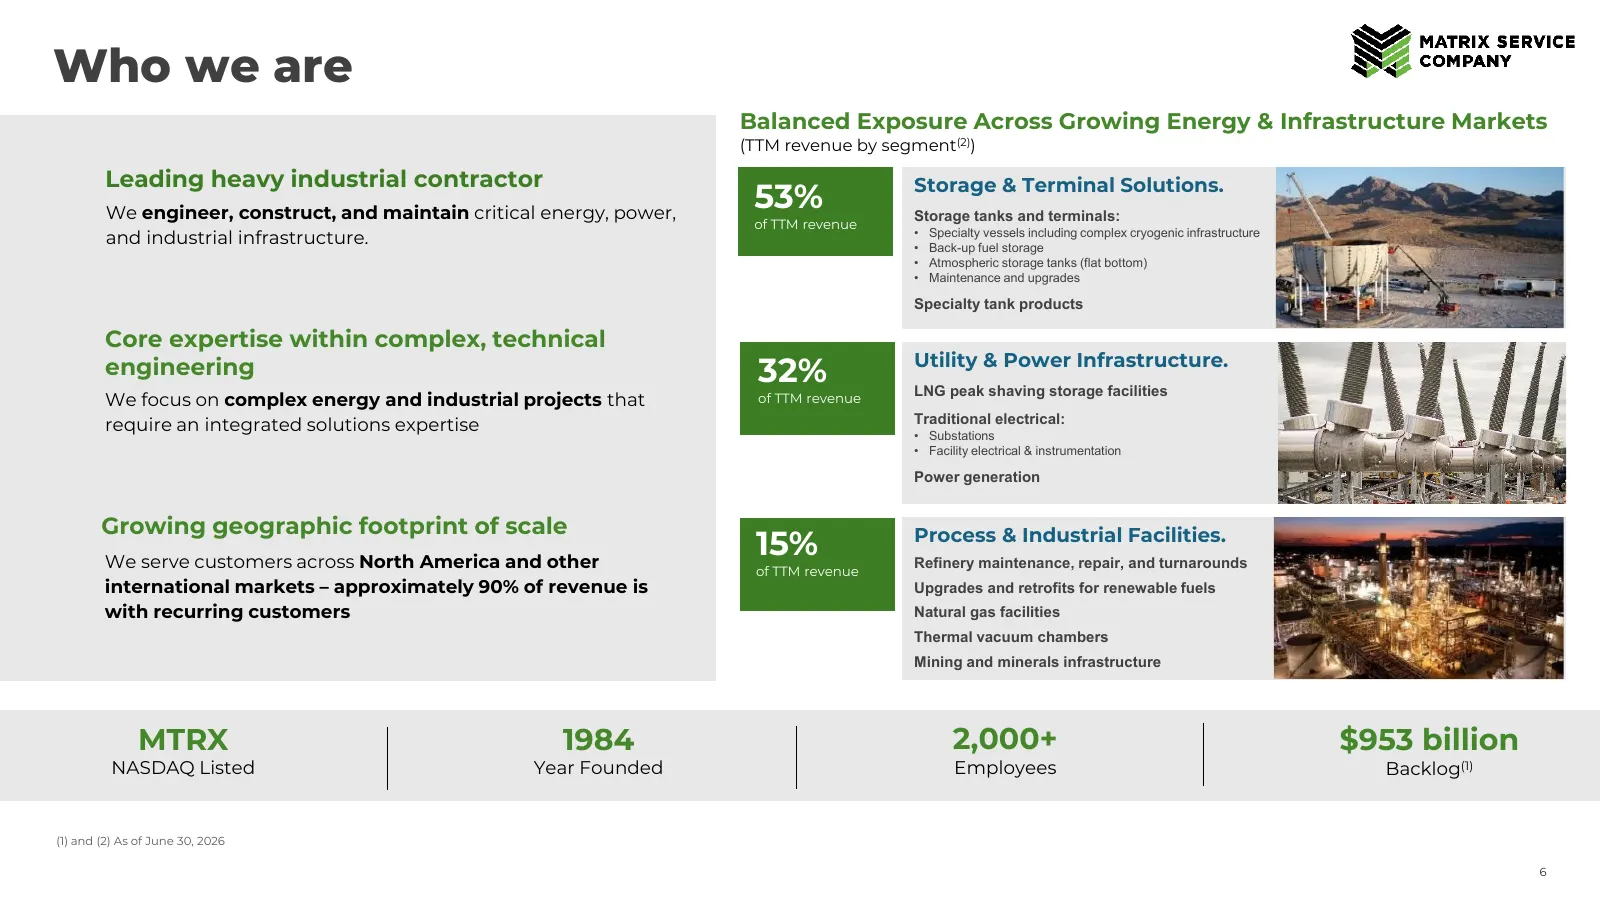
Slide 6: Who we are
Who we are Balanced Exposure Across Growing Energy & Infrastructure Markets (TTM revenue by segment(2)) Leading heavy industrial contractor Storage & Terminal Solutions. We engineer, construct, and maintain critical energy, power, 53% Storage tanks and terminals: of TTM revenue • Specialty vessels i
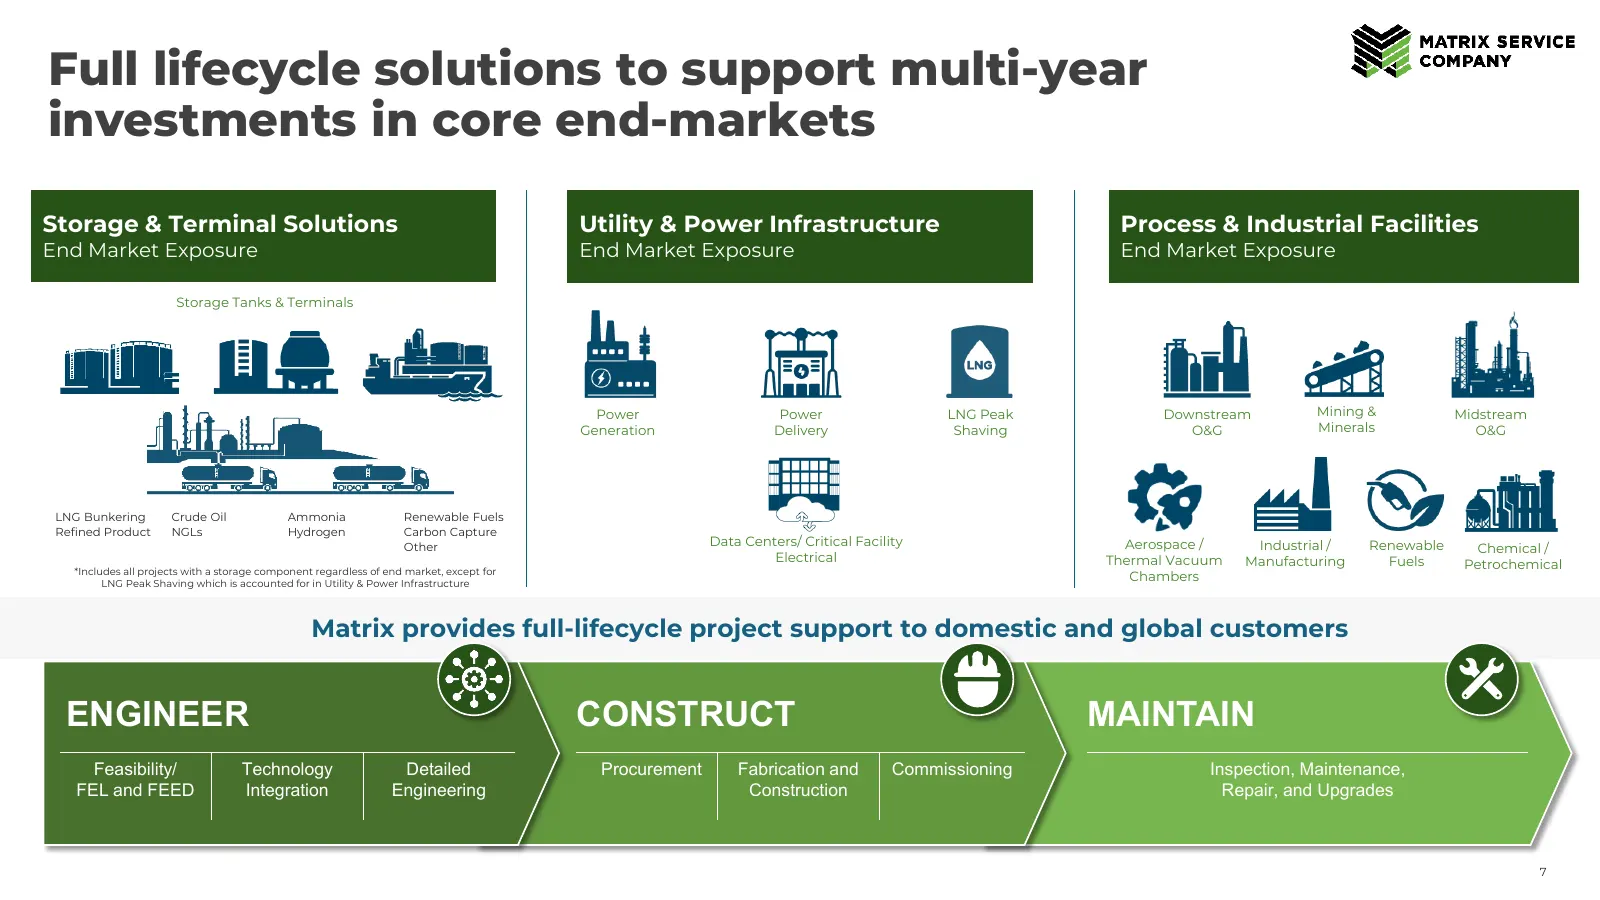
Slide 7: Full lifecycle solutions to support multi-year investments in core end-markets
Full lifecycle solutions to support multi-year investments in core end-markets Storage & Terminal Solutions Utility & Power Infrastructure Process & Industrial Facilities End Market Exposure End Market Exposure End Market Exposure Storage Tanks & Terminals Power Power LNG Peak Downstream Mining & Mi
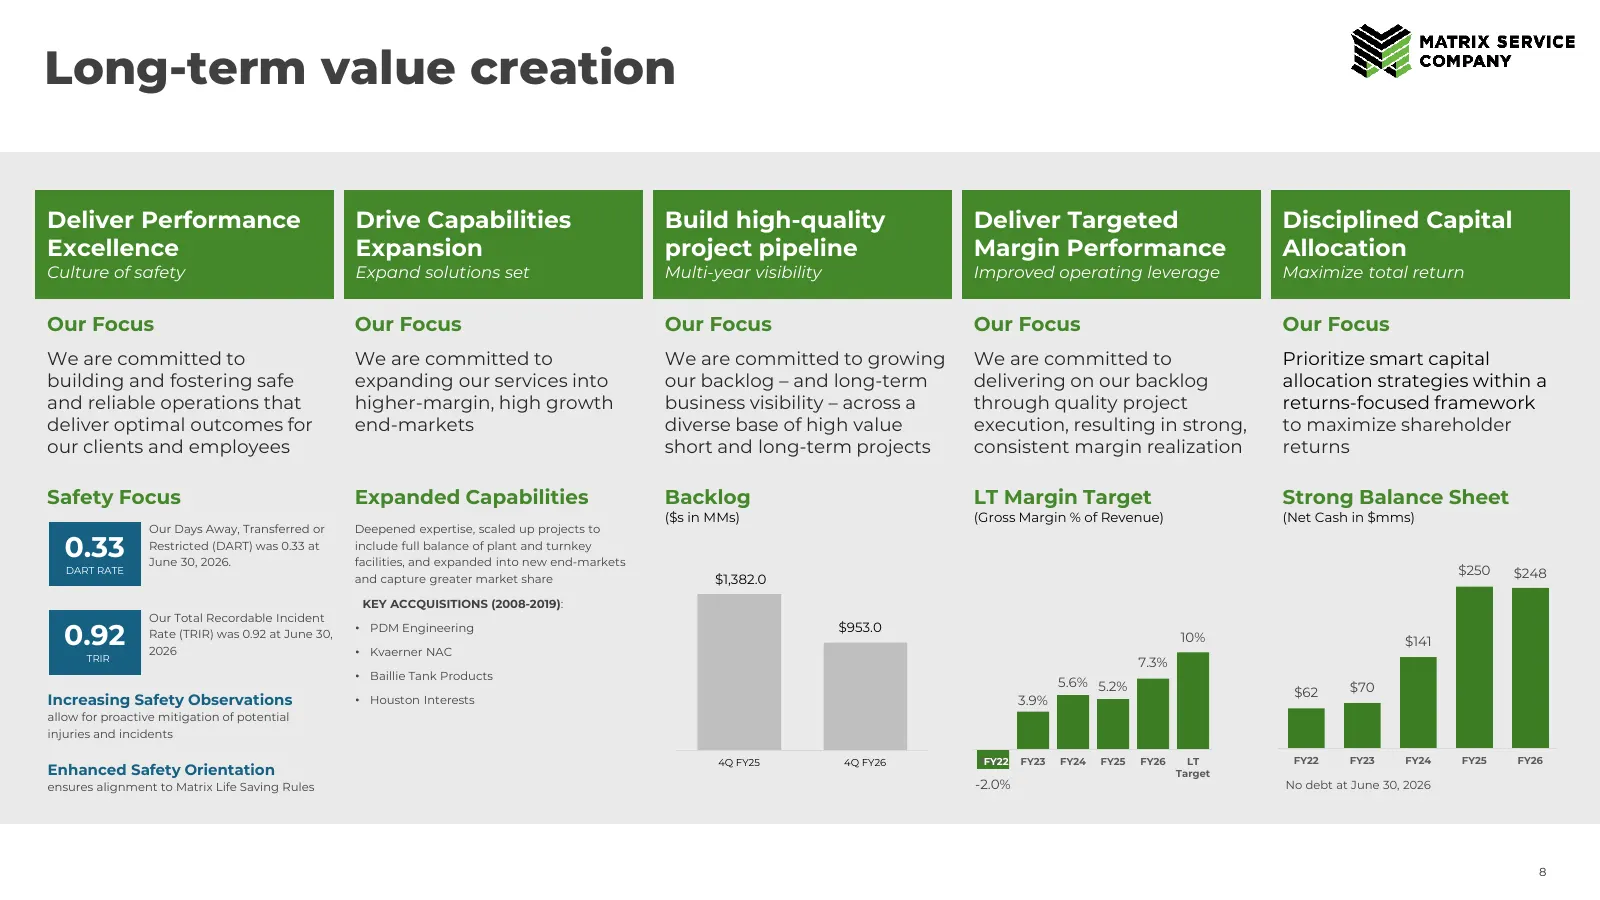
Slide 8: Long-term value creation
Long-term value creation Deliver Performance Drive Capabilities Build high-quality Deliver Targeted Disciplined Capital Excellence Expansion project pipeline Margin Performance Allocation Culture of safety Expand solutions set Multi-year visibility Improved operating leverage Maximize total return O
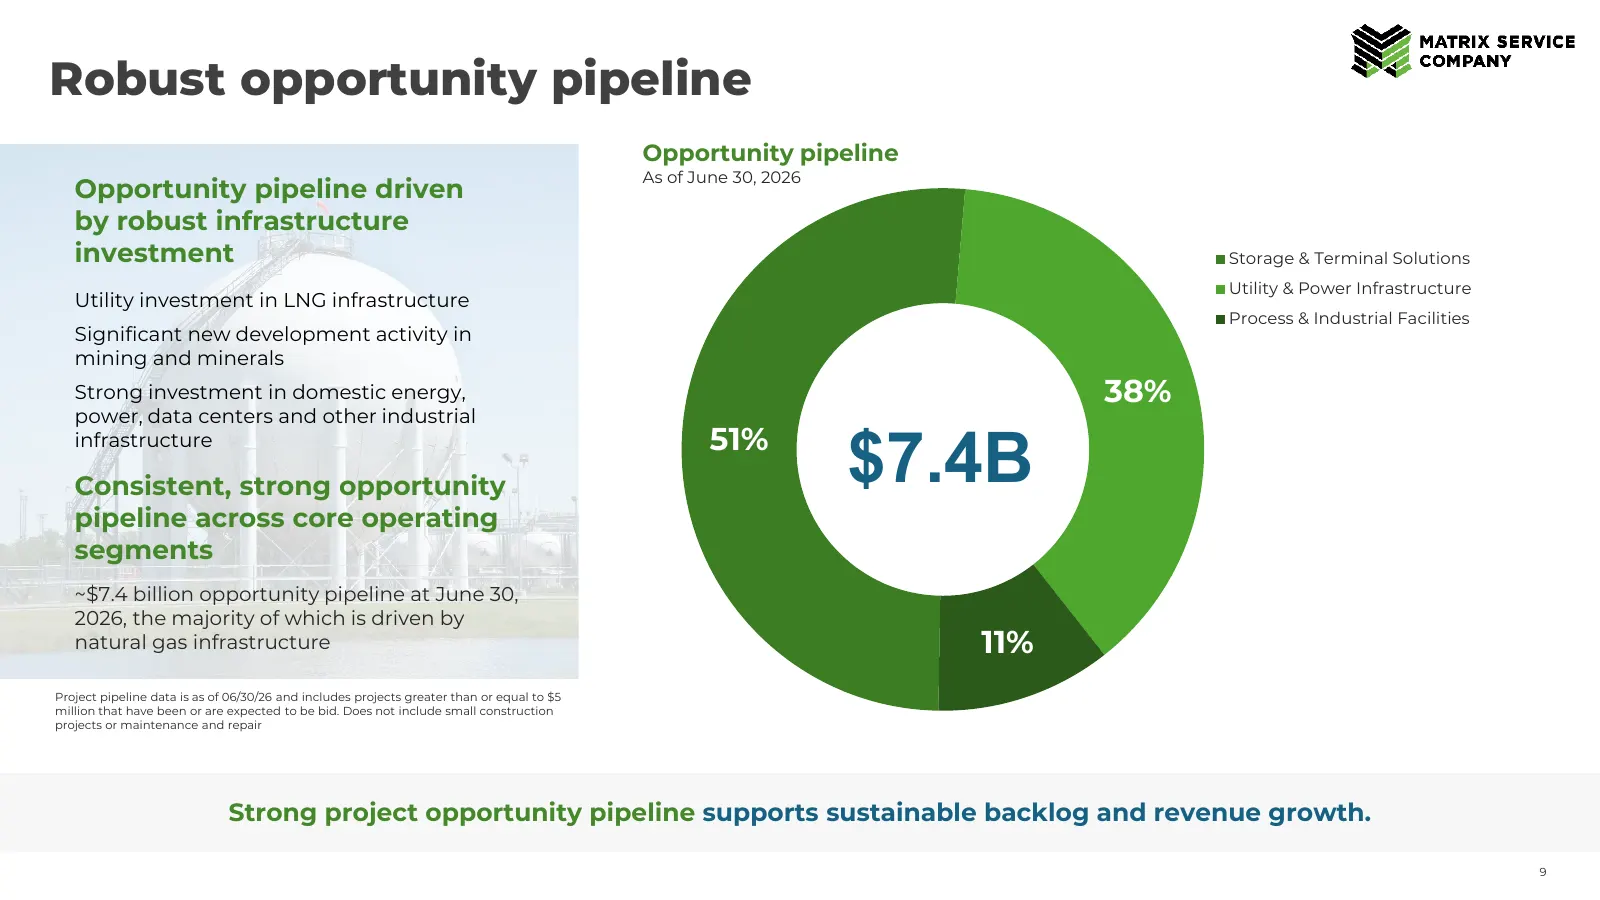
Slide 9: Robust opportunity pipeline
Robust opportunity pipeline Opportunity pipeline As of June 30, 2026 Opportunity pipeline driven by robust infrastructure investment Storage & Terminal Solutions Utility & Power Infrastructure Utility investment in LNG infrastructure Process & Industrial Facilities Significant new development activi
Slide 10: Strategic Roadmap
MATRIX SERVICE COMPANY = AX 7 STRAT GIC ROADMAP ~~ Fo
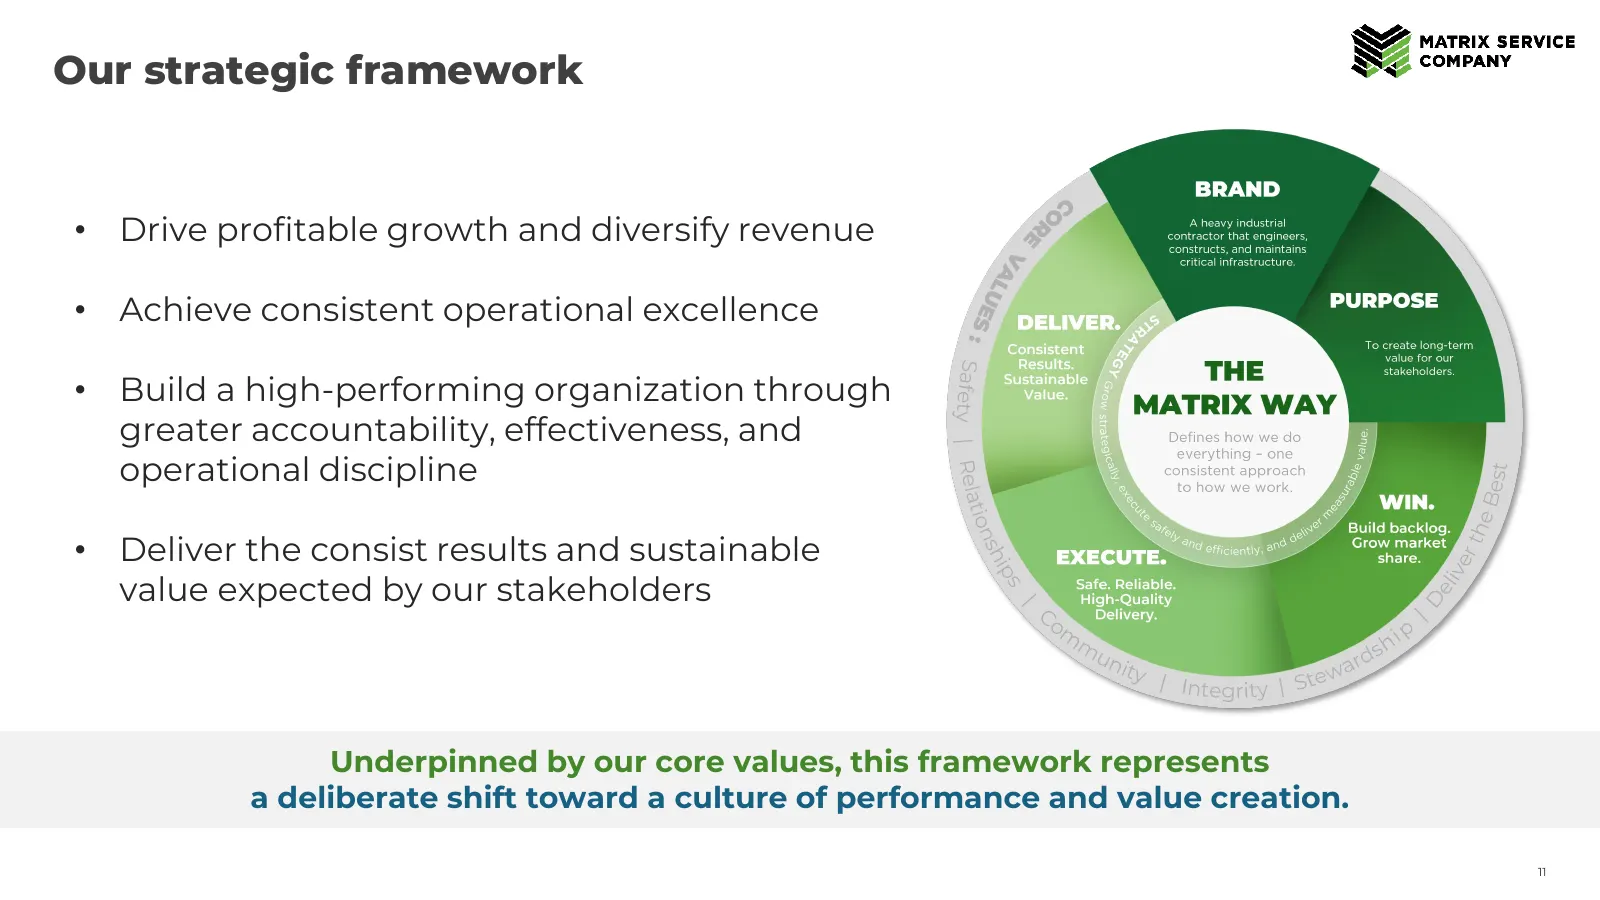
Slide 11: Our strategic framework
Our strategic framework • Drive profitable growth and diversify revenue • Achieve consistent operational excellence • Build a high-performing organization through greater accountability, effectiveness, and operational discipline • Deliver the consist results and sustainable value expected by our sta
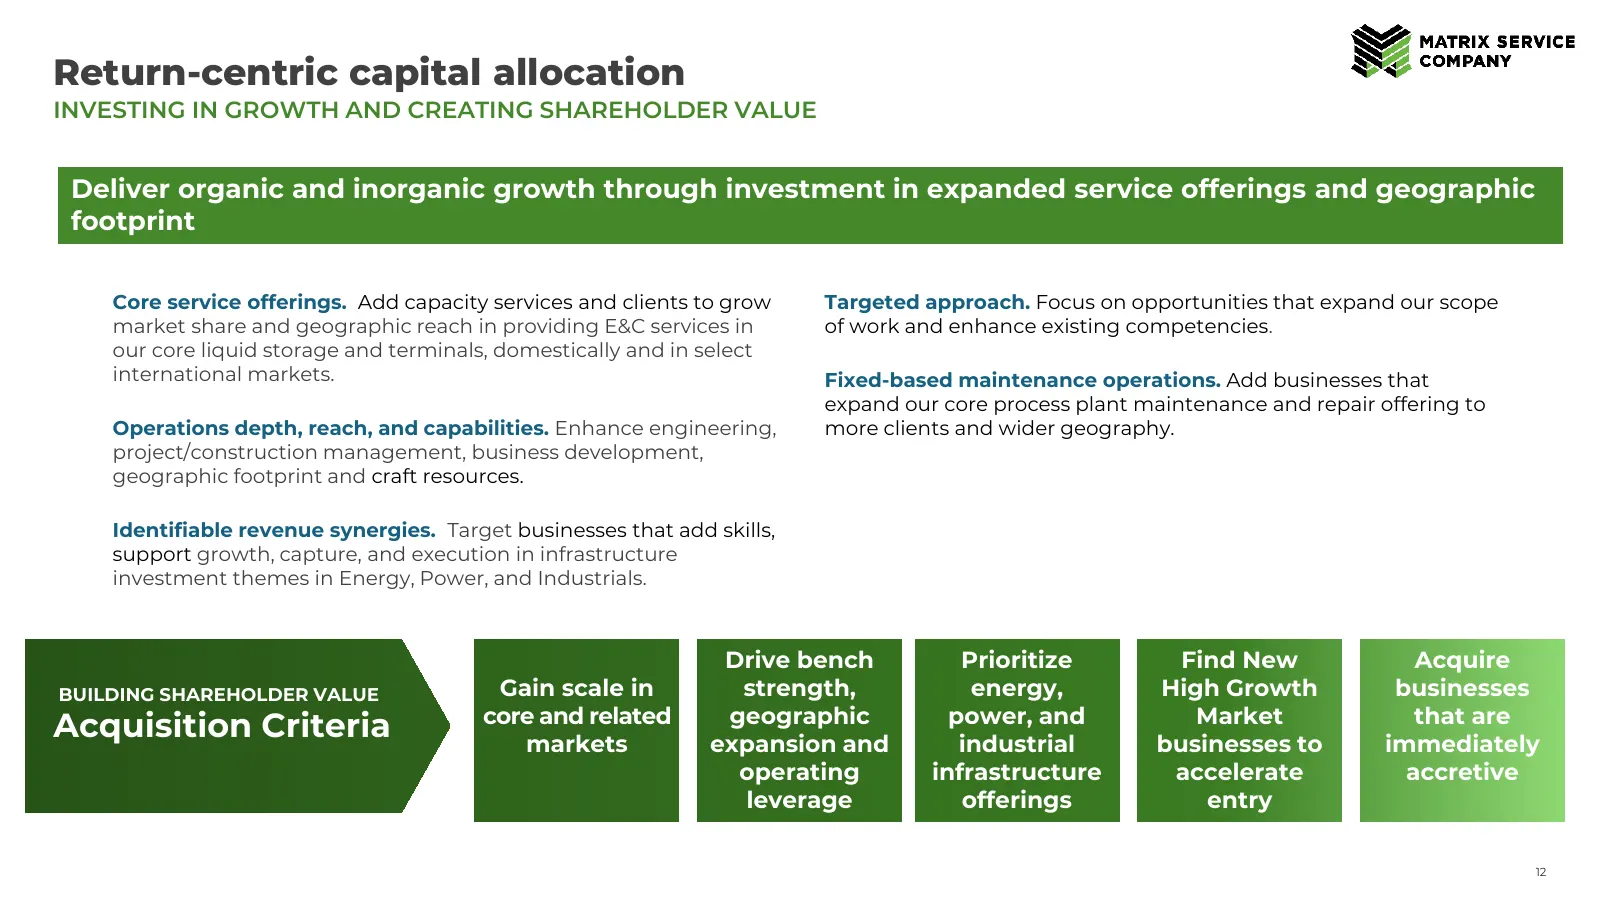
Slide 12: Return-centric capital allocation and acquisition criteria
Return-centric capital allocation INVESTING IN GROWTH AND CREATING SHAREHOLDER VALUE Deliver organic and inorganic growth through investment in expanded service offerings and geographic footprint Core service offerings. Add capacity services and clients to grow Targeted approach. Focus on opportunit
Slide 13: Q4 FY26 Performance
Q4 FY26 PERFORMANCE
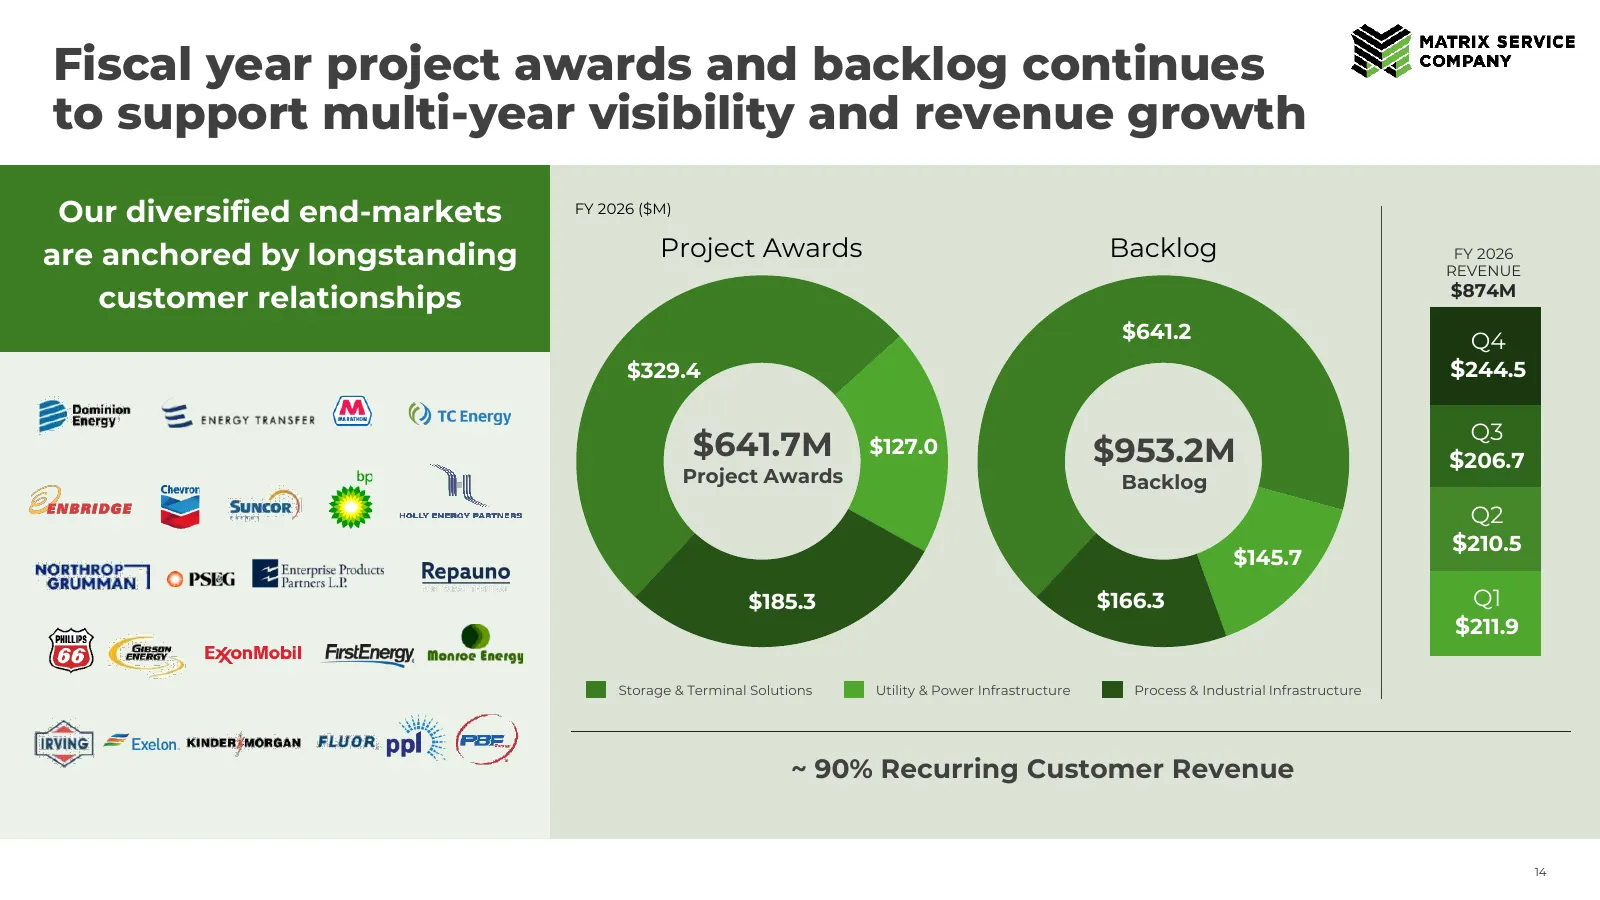
Slide 14: Fiscal year project awards and backlog support multi-year visibility and revenue growth
Fiscal year project awards and backlog continues to support multi-year visibility and revenue growth Our diversified end-markets FY 2026 ($M) are anchored by longstanding Project Awards Backlog FY 2026 REVENUE customer relationships $874M $641.2 Q4 $329.4 $244.5 Q3 $641.7M $127.0 $953.2M $206.7 Proj
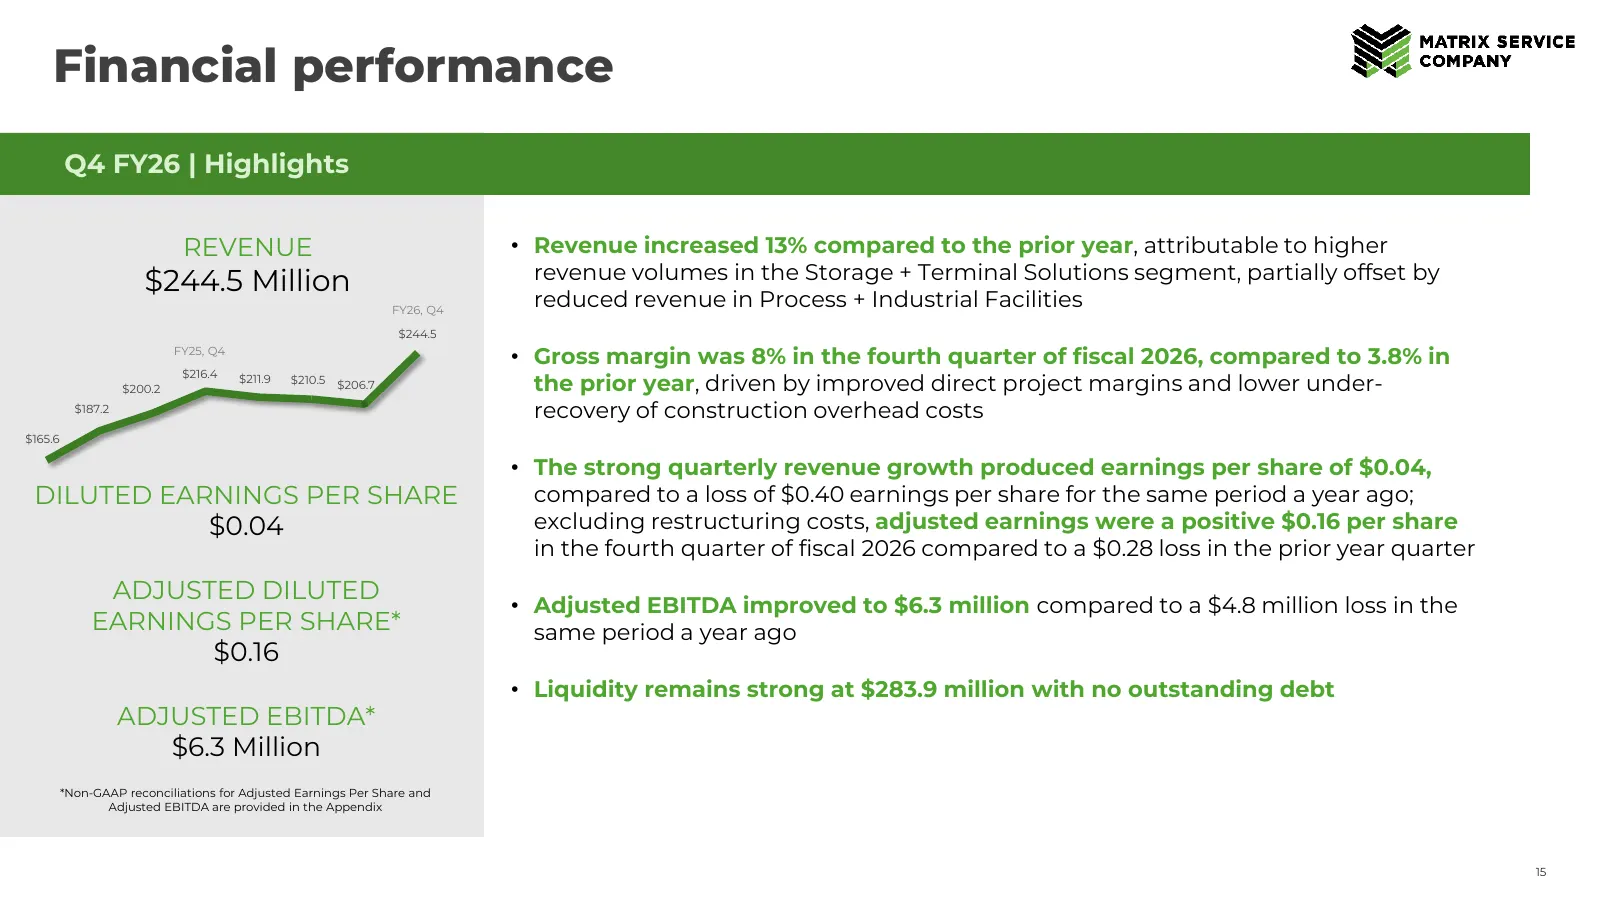
Slide 15: Financial performance
Financial performance Q4 FY26 | Highlights Q2 FY26 HIGHLIGHTS REVENUE • Revenue increased 13% compared to the prior year, attributable to higher $244.5 Million revenue volumes in the Storage + Terminal Solutions segment, partially offset by FY26, Q4 reduced revenue in Process + Industrial Facilities
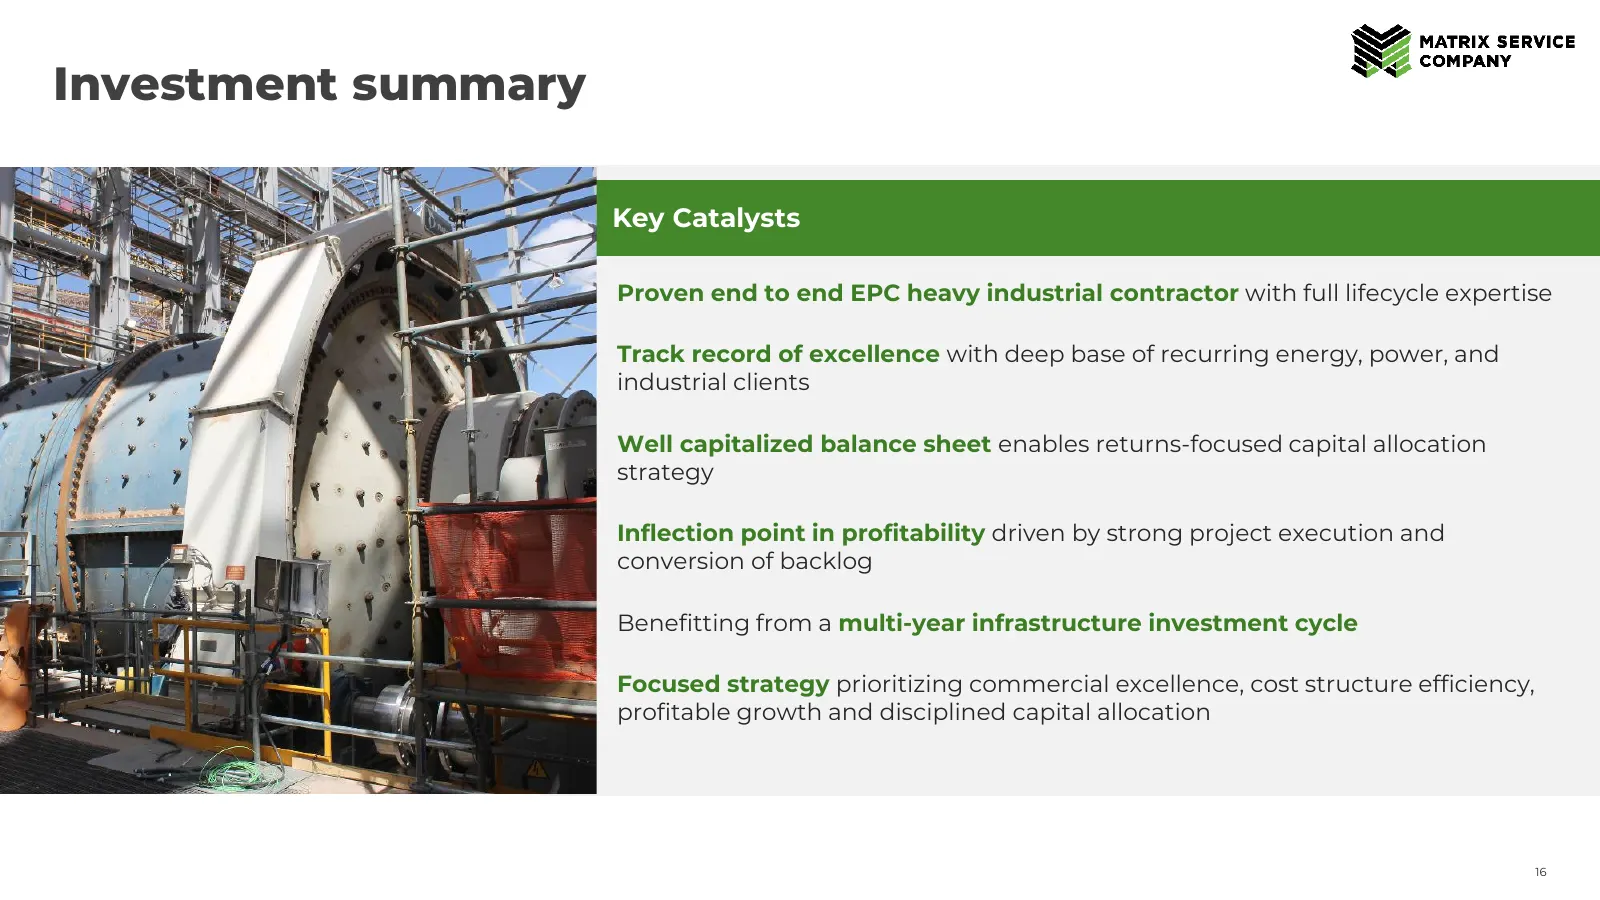
Slide 16: Investment summary
Investment summary Key Catalysts Proven end to end EPC heavy industrial contractor with full lifecycle expertise Track record of excellence with deep base of recurring energy, power, and industrial clients Well capitalized balance sheet enables returns-focused capital allocation strategy Inflection
Slide 17: Disciplined balance sheet management
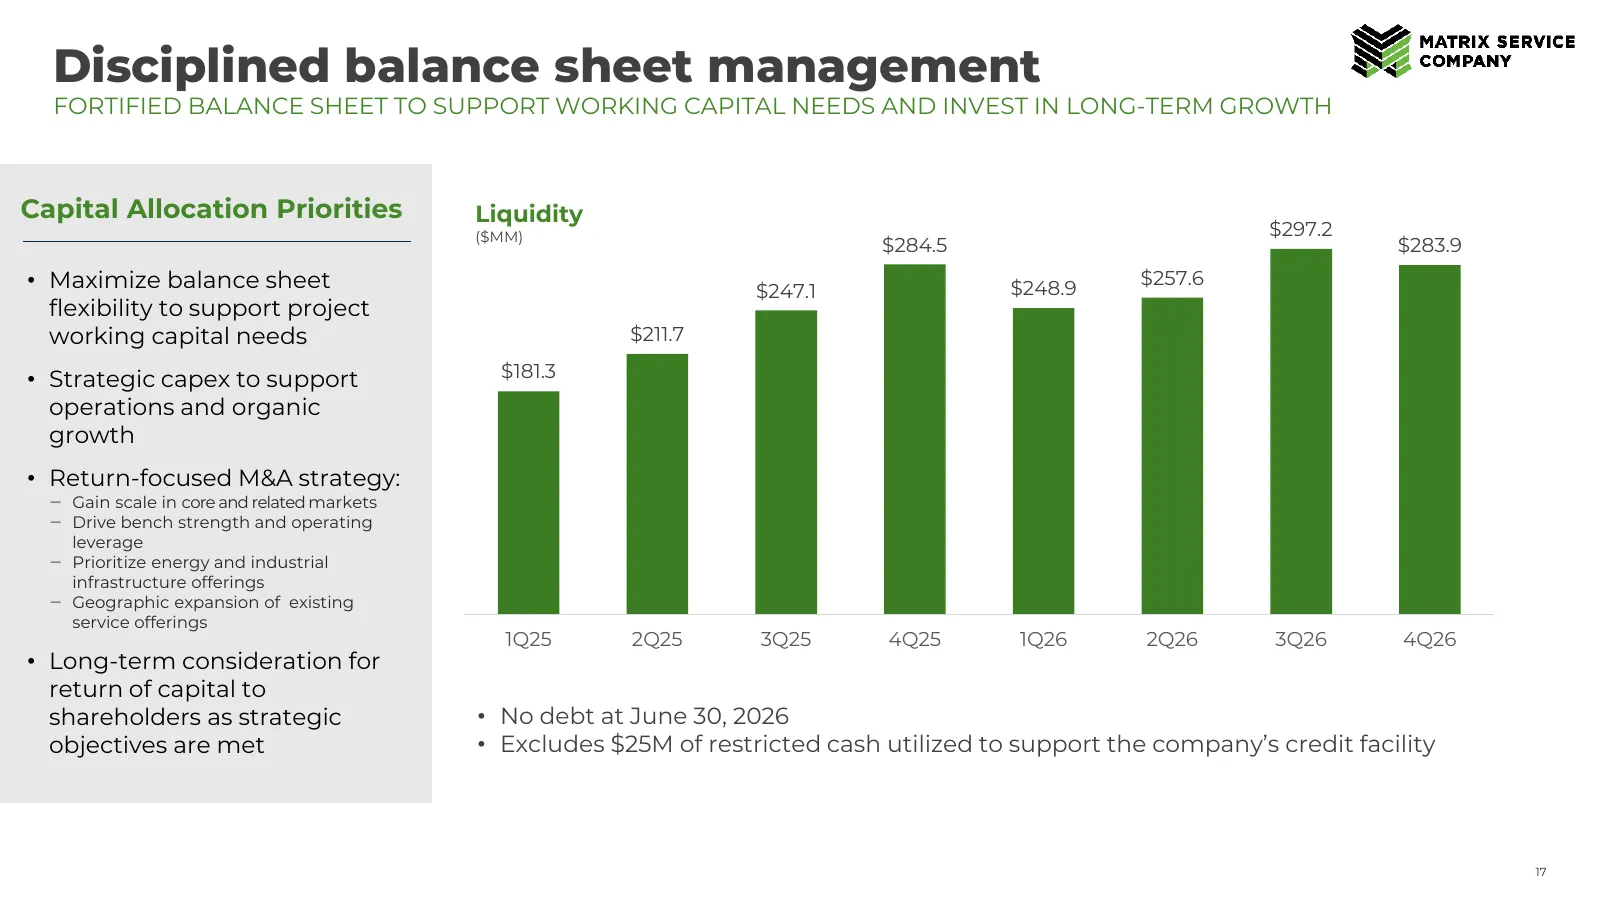
Disciplined balance sheet management FORTIFIED BALANCE SHEET TO SUPPORT WORKING CAPITAL NEEDS AND INVEST IN LONG-TERM GROWTH Capital Allocation Priorities Liquidity ($MM) $297.2 $284.5 $283.9 • Maximize balance sheet $257.6 $247.1 $248.9 flexibility to support project working capital needs $211.7 •
Slide 18: Appendix
APPENDIX
Slide 19: Quarterly results | Consolidated
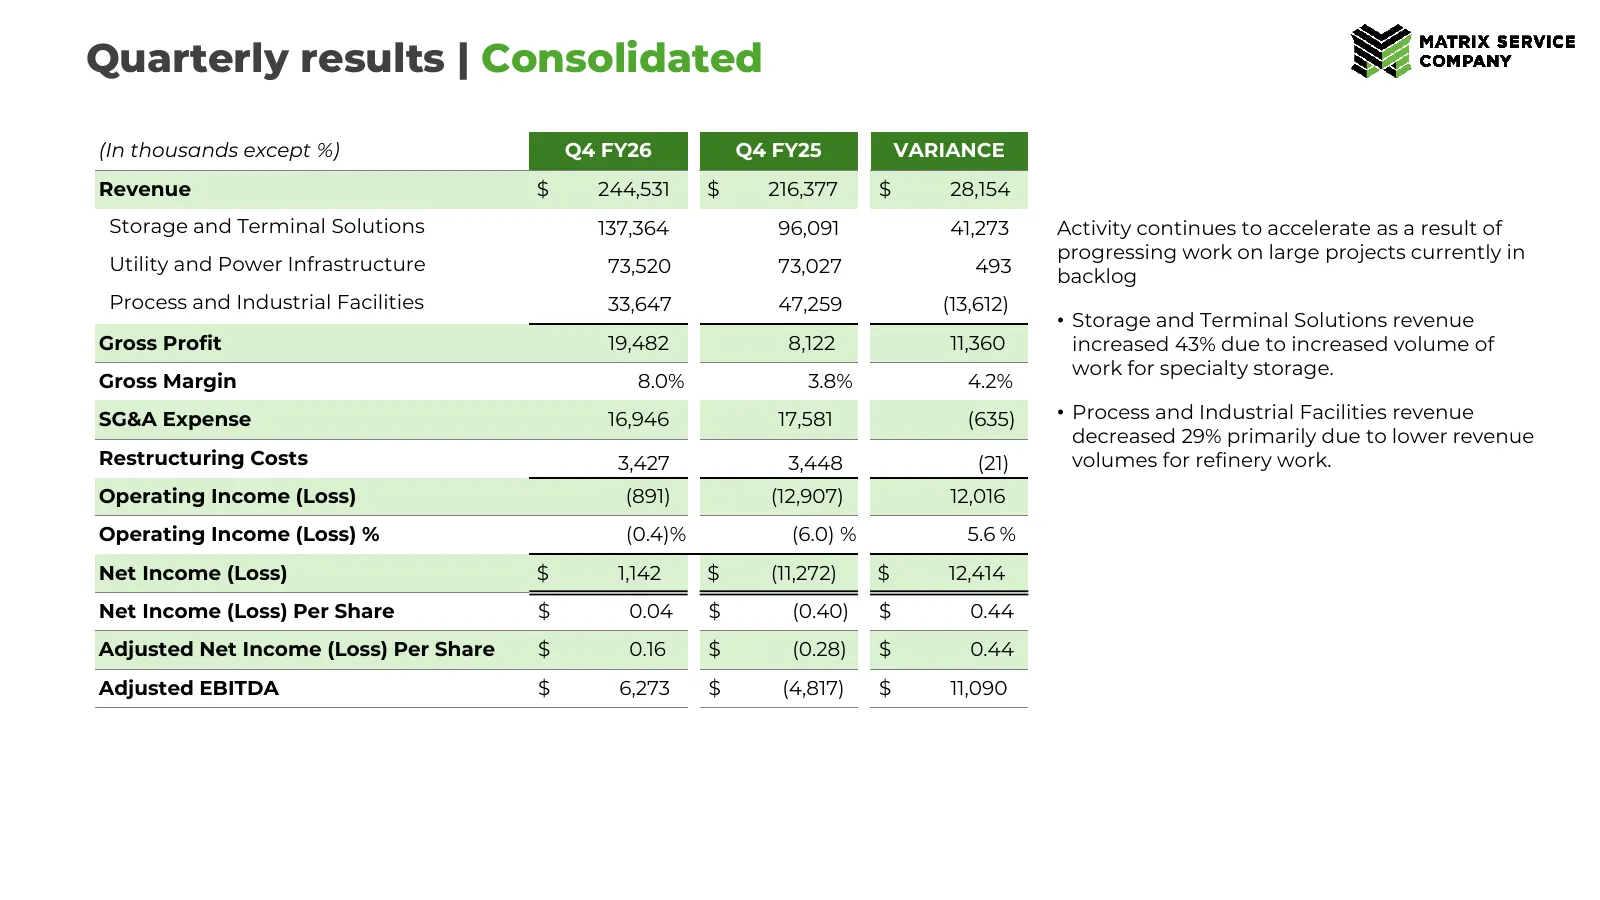
Quarterly results | Consolidated (In thousands except %) Q4 FY26 Q4 FY25 VARIANCE Revenue $ 244,531 $ 216,377 $ 28,154 Storage and Terminal Solutions 137,364 96,091 41,273 Activity continues to accelerate as a result of progressing work on large projects currently in Utility and Power Infrastructure
Slide 20: Adjusted net income (loss)
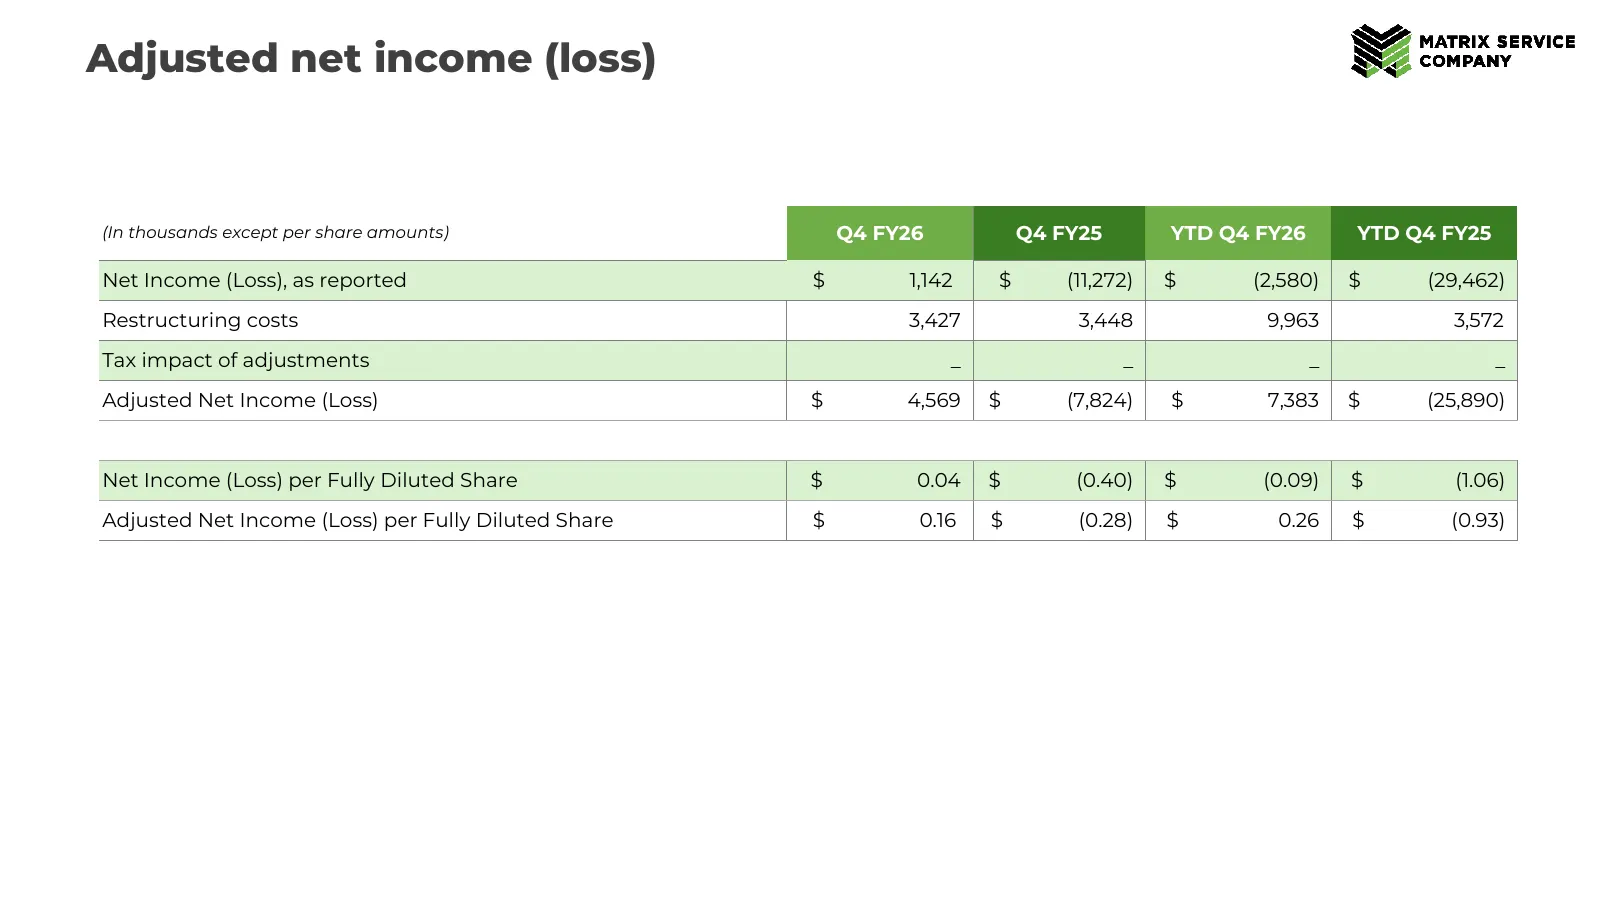
Adjusted net income (loss) (In thousands except per share amounts) Q4 FY26 Q4 FY25 YTD Q4 FY26 YTD Q4 FY25 Net Income (Loss), as reported $ 1,142 $ (11,272) $ (2,580) $ (29,462) Restructuring costs 3,427 3,448 9,963 3,572 Tax impact of adjustments _ _ _ _ Adjusted Net Income (Loss) $ 4,569 $ (7,824)
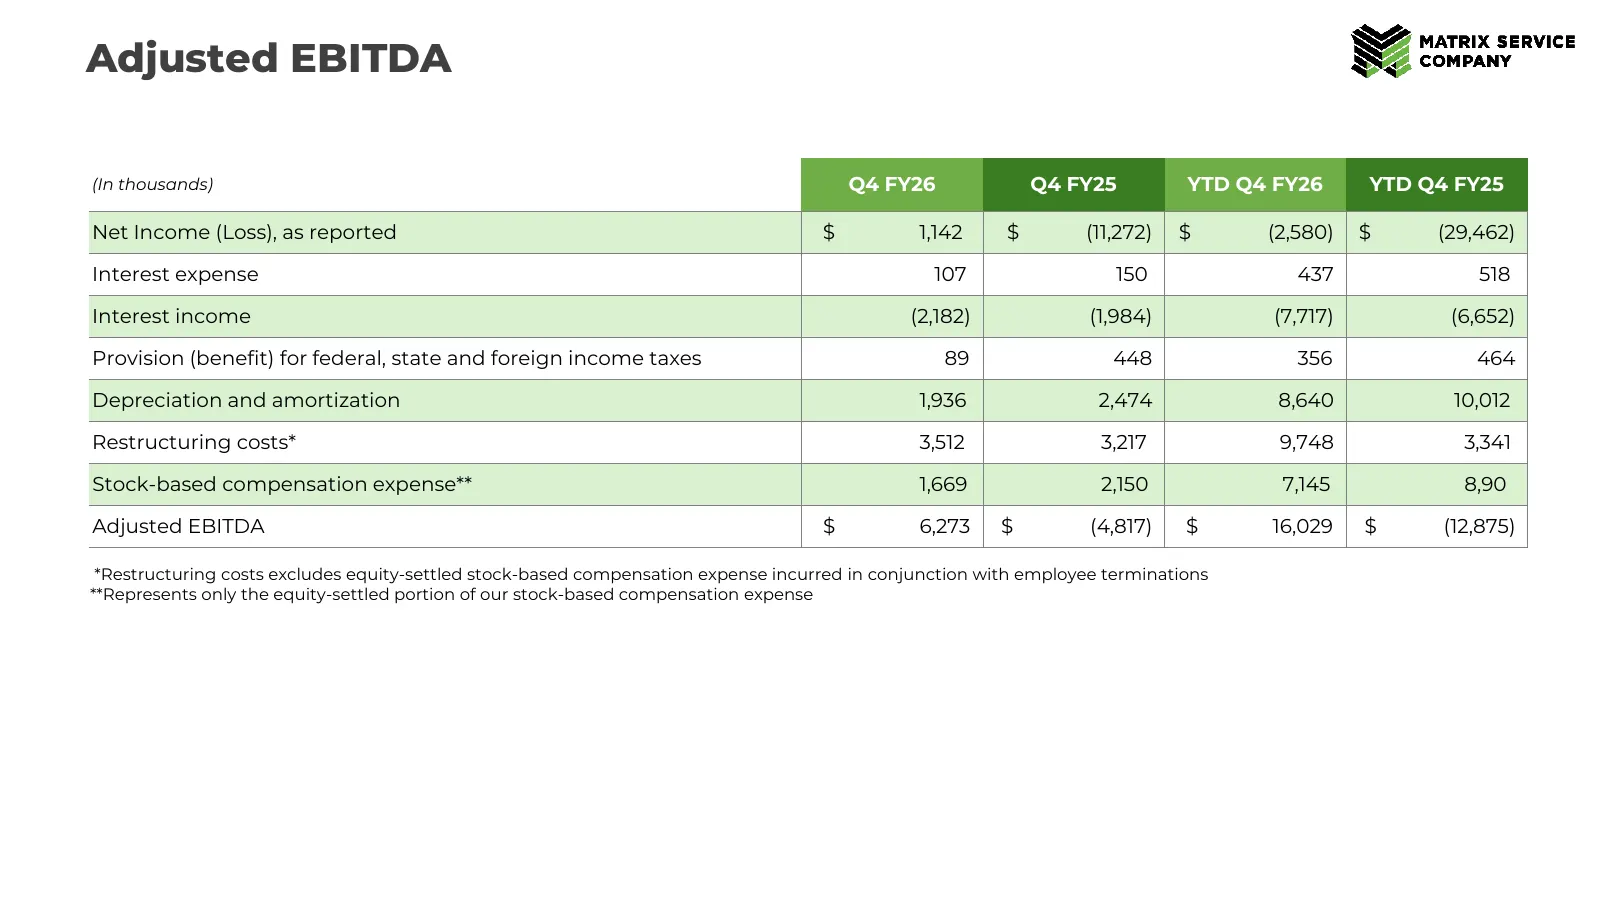
Slide 21: Adjusted EBITDA
Adjusted EBITDA (In thousands) Q4 FY26 Q4 FY25 YTD Q4 FY26 YTD Q4 FY25 Net Income (Loss), as reported $ 1,142 $ (11,272) $ (2,580) $ (29,462) Interest expense 107 150 437 518 Interest income (2,182) (1,984) (7,717) (6,652) Provision (benefit) for federal, state and foreign income taxes 89 448 356 46
Source: company website
More decks from Matrix Service Company
 Q3 2026 Earnings Presentation22 slides · May 7, 2026
 Q2 2026 Earnings Presentation24 slides · Feb 5, 2026
 Q1 2026 Earnings Presentation25 slides · Nov 6, 2025
 Q4 2025 Earnings Presentation25 slides · Sep 10, 2025
 Q3 2025 Earnings Presentation23 slides · May 8, 2025
 Q2 2025 Earnings Presentation23 slides · Feb 6, 2025