Matrix Service Company · NASDAQ:MTRX
Matrix Service — Q2 2026 Earnings Presentation
24 slides from Matrix Service's earnings presentation, Feb 5, 2026
Slide 1: Investor Presentation Q2 FY26 Results
INVESTOR PRESENTATION Q2 FY26 Results | February 2026
Slide 2: Safe Harbor Statement
Safe Harbor Statement This presentation contains certain forward-looking statements concerning Matrix Service Company’s operations, economic performance and management’s best judgment as to what may occur in the future. The actual results for the current and future periods and other corporate develo
Slide 3: Investing in MTRX
Investing in MTRX • Experienced EPC general industrial contractor of scale with a 40+ year track record supporting energy, power, and industrial infrastructure customers • Provider of end-to-end services across entire asset life-cycle with niche capabilities in cryogenic storage for LNG, NGLs, and c
Slide 4: Business Overview
> FA a = 9 oO MATRIX S " cA a
Slide 5: Who we are
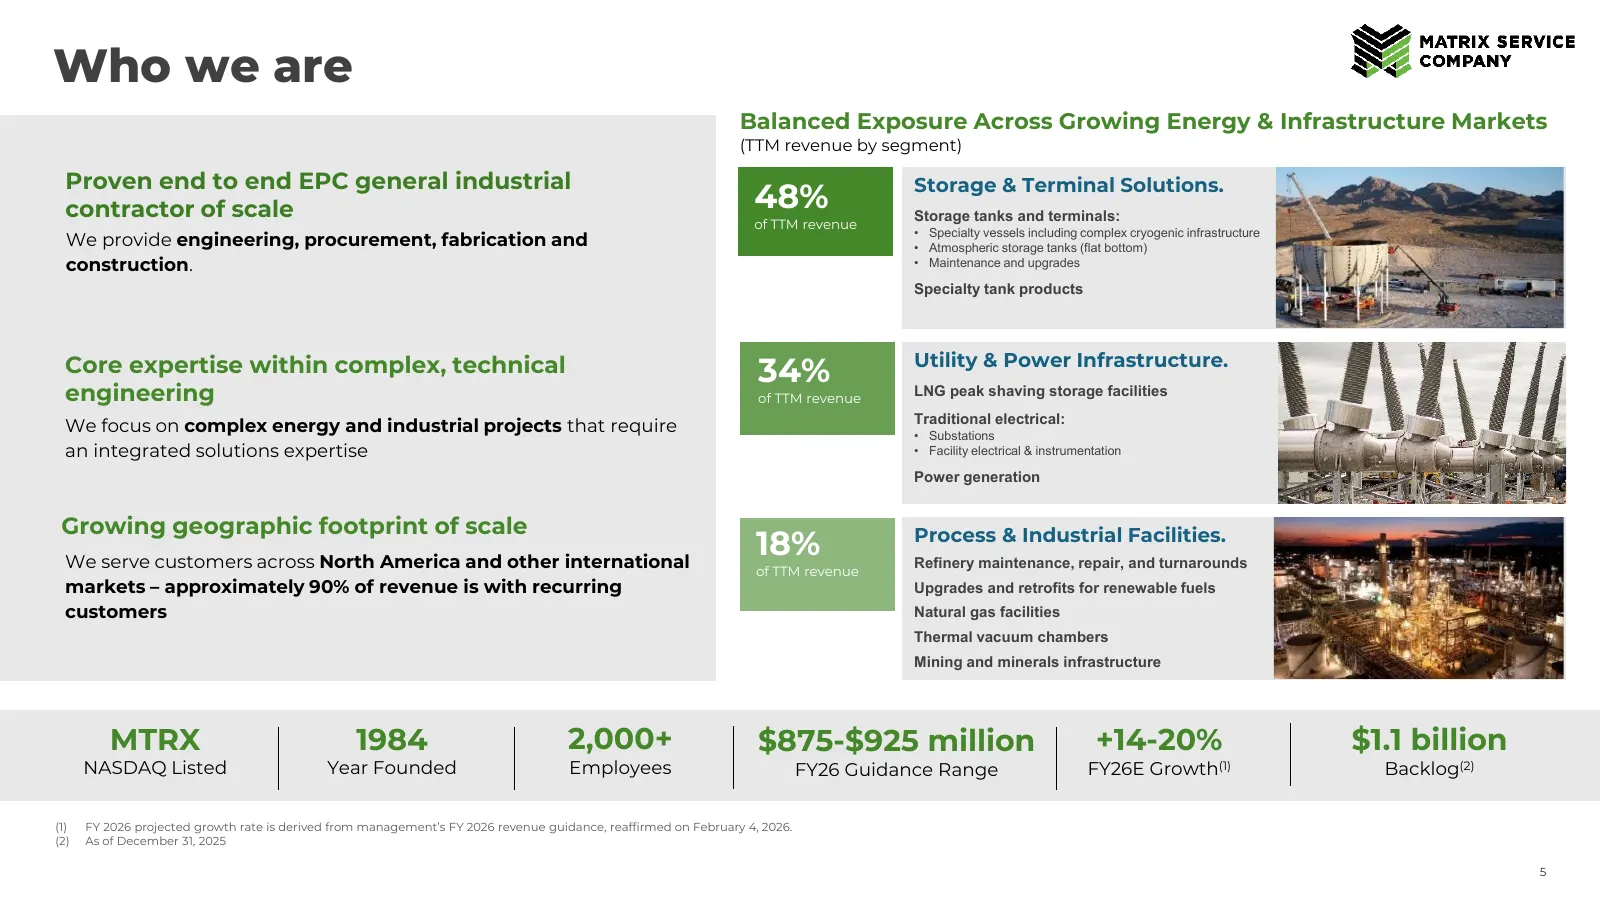
Who we are Balanced Exposure Across Growing Energy & Infrastructure Markets (TTM revenue by segment) Proven end to end EPC general industrial Storage & Terminal Solutions. contractor of scale 48% Storage tanks and terminals: of TTM revenue • Specialty vessels including complex cryogenic infrastructu
Slide 6: Matrix Service Company announces CEO transition
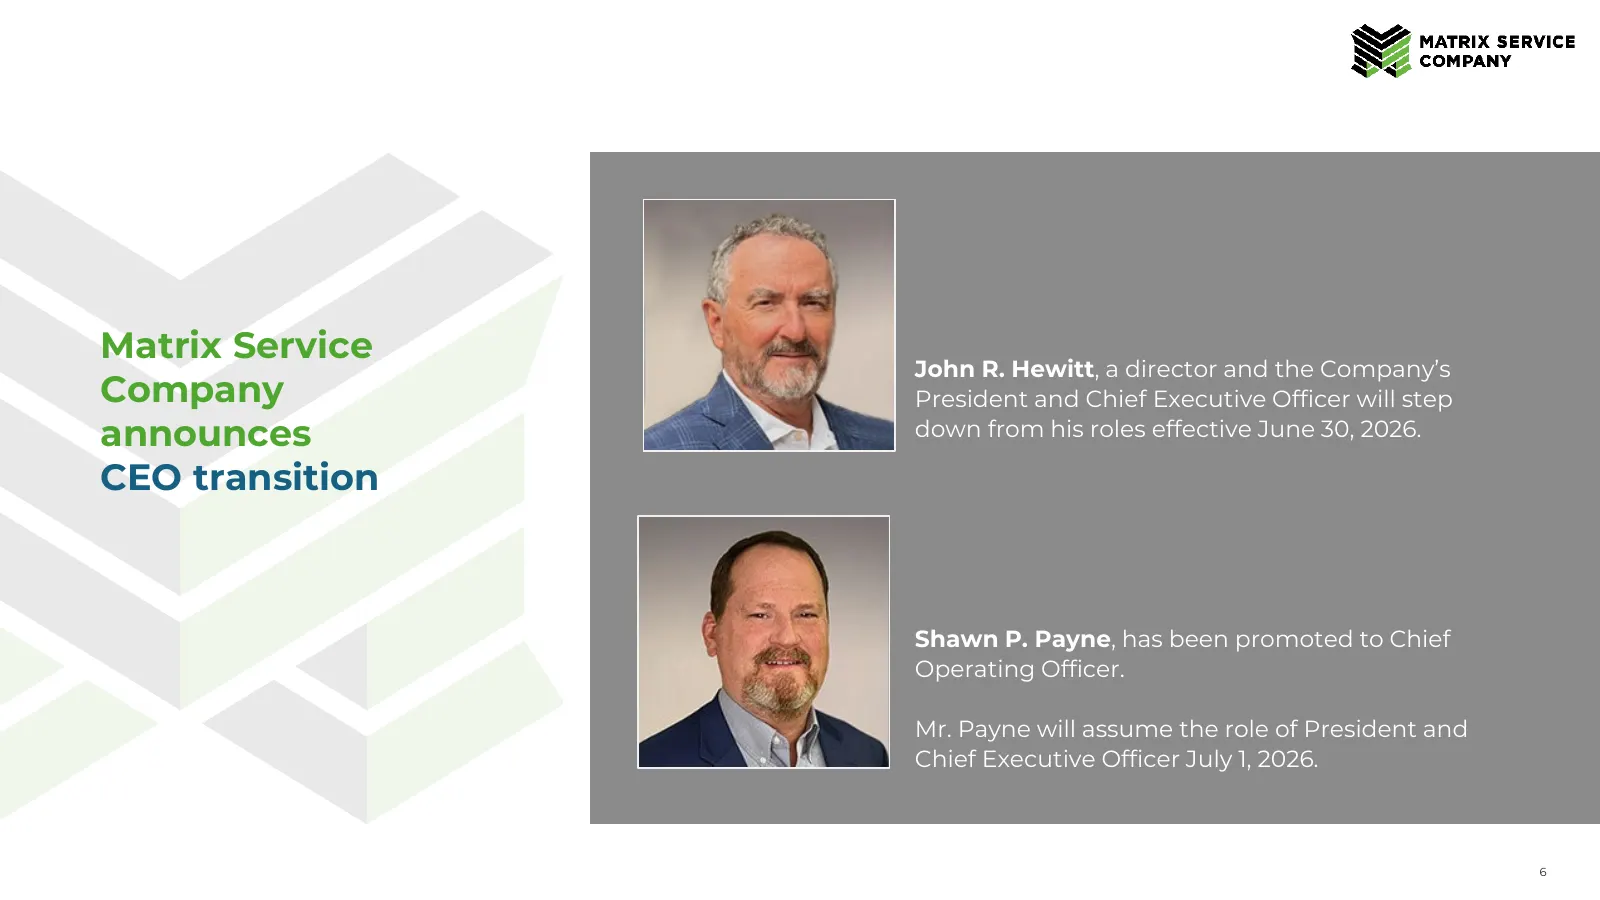
Matrix Service John R. Hewitt, a director and the Company’s Company President and Chief Executive Officer will step announces down from his roles effective June 30, 2026. CEO transition Shawn P. Payne, has been promoted to Chief Operating Officer. Mr. Payne will assume the role of President and Chie
Slide 7: Full lifecycle solutions to support multi-year investments in core end-markets
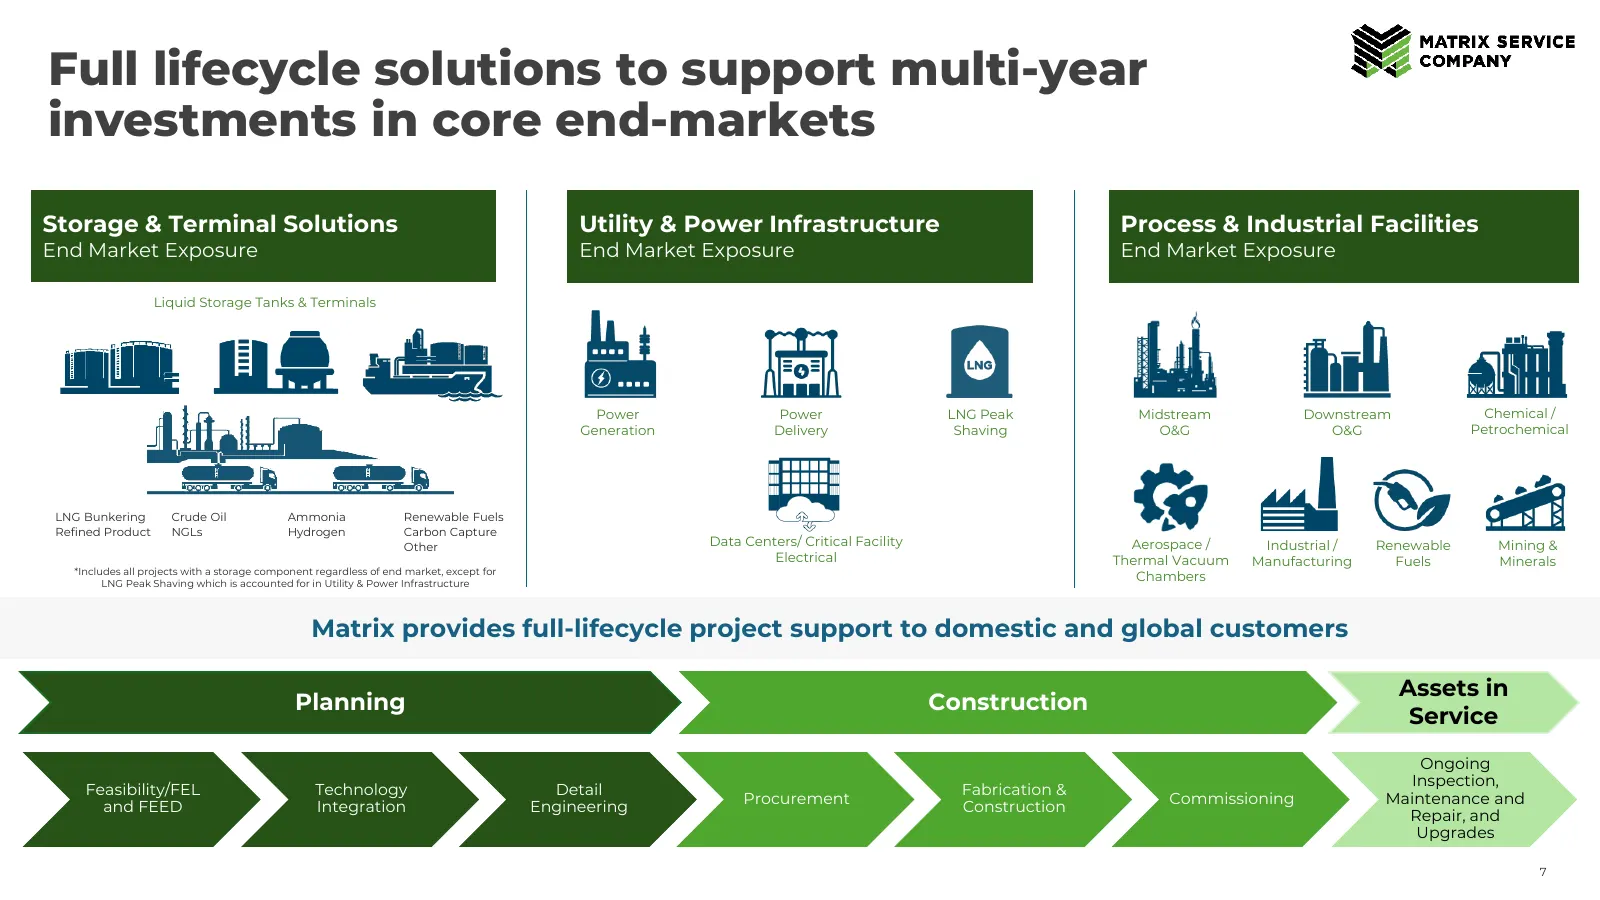
Full lifecycle solutions to support multi-year investments in core end-markets Storage & Terminal Solutions Utility & Power Infrastructure Process & Industrial Facilities End Market Exposure End Market Exposure End Market Exposure Liquid Storage Tanks & Terminals Power Power LNG Peak Midstream Downs
Slide 8: Long-term value creation
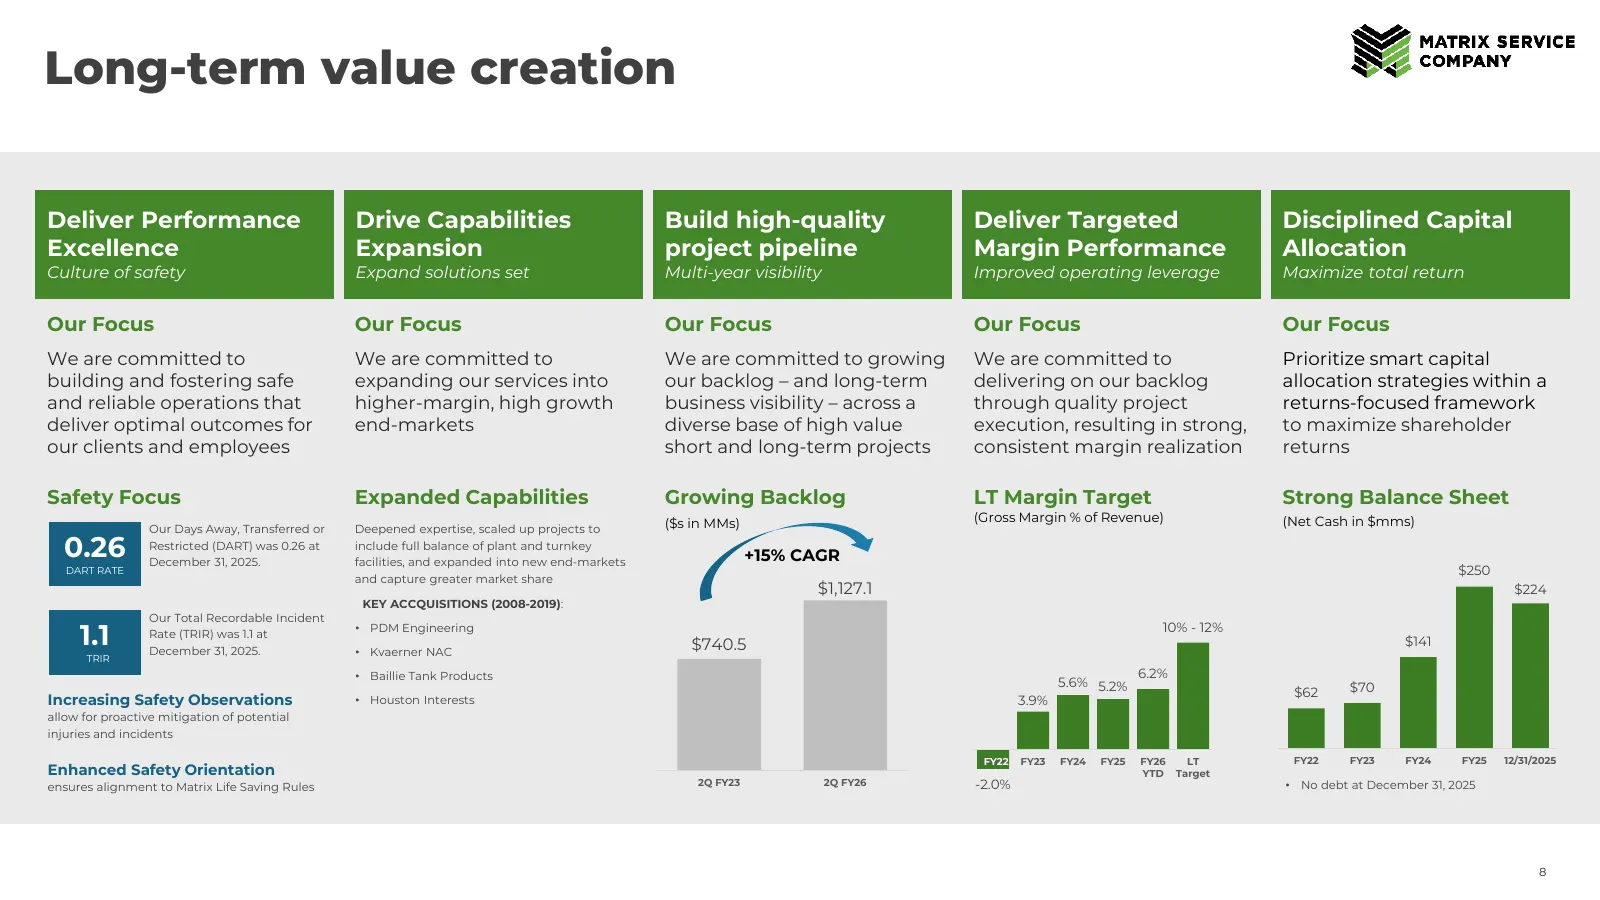
Long-term value creation Deliver Performance Drive Capabilities Build high-quality Deliver Targeted Disciplined Capital Excellence Expansion project pipeline Margin Performance Allocation Culture of safety Expand solutions set Multi-year visibility Improved operating leverage Maximize total return O
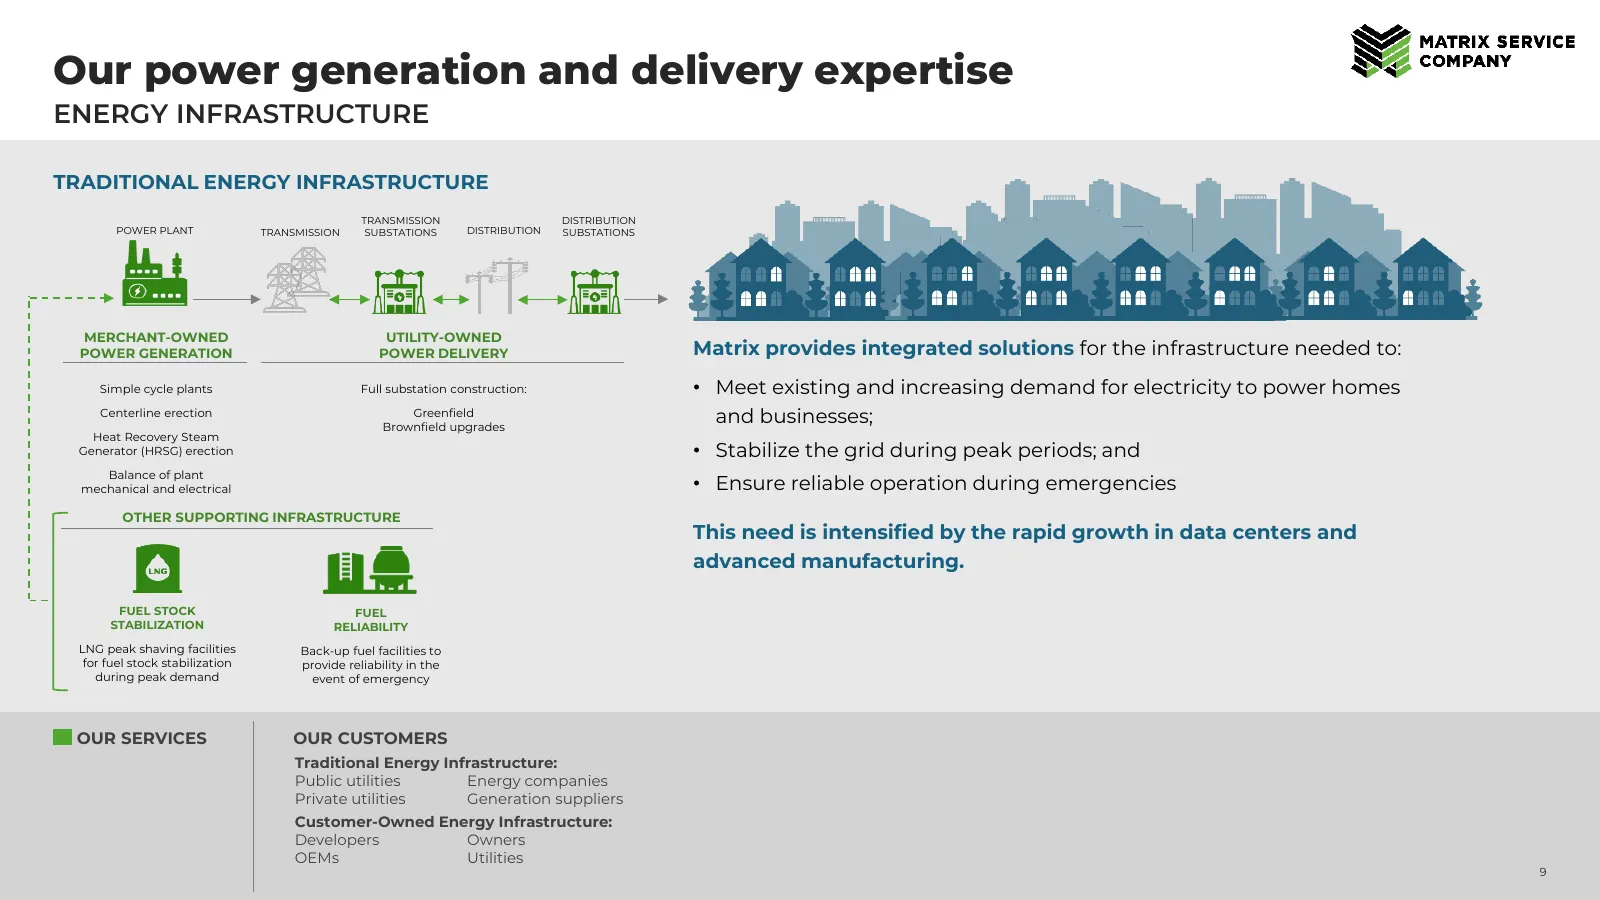
Slide 9: Our power generation and delivery expertise
Our power generation and delivery expertise ENERGY INFRASTRUCTURE TRADITIONAL ENERGY INFRASTRUCTURE TRANSMISSION DISTRIBUTION POWER PLANT TRANSMISSION SUBSTATIONS DISTRIBUTION SUBSTATIONS MERCHANT-OWNED UTILITY-OWNED POWER GENERATION POWER DELIVERY Matrix provides integrated solutions for the infras
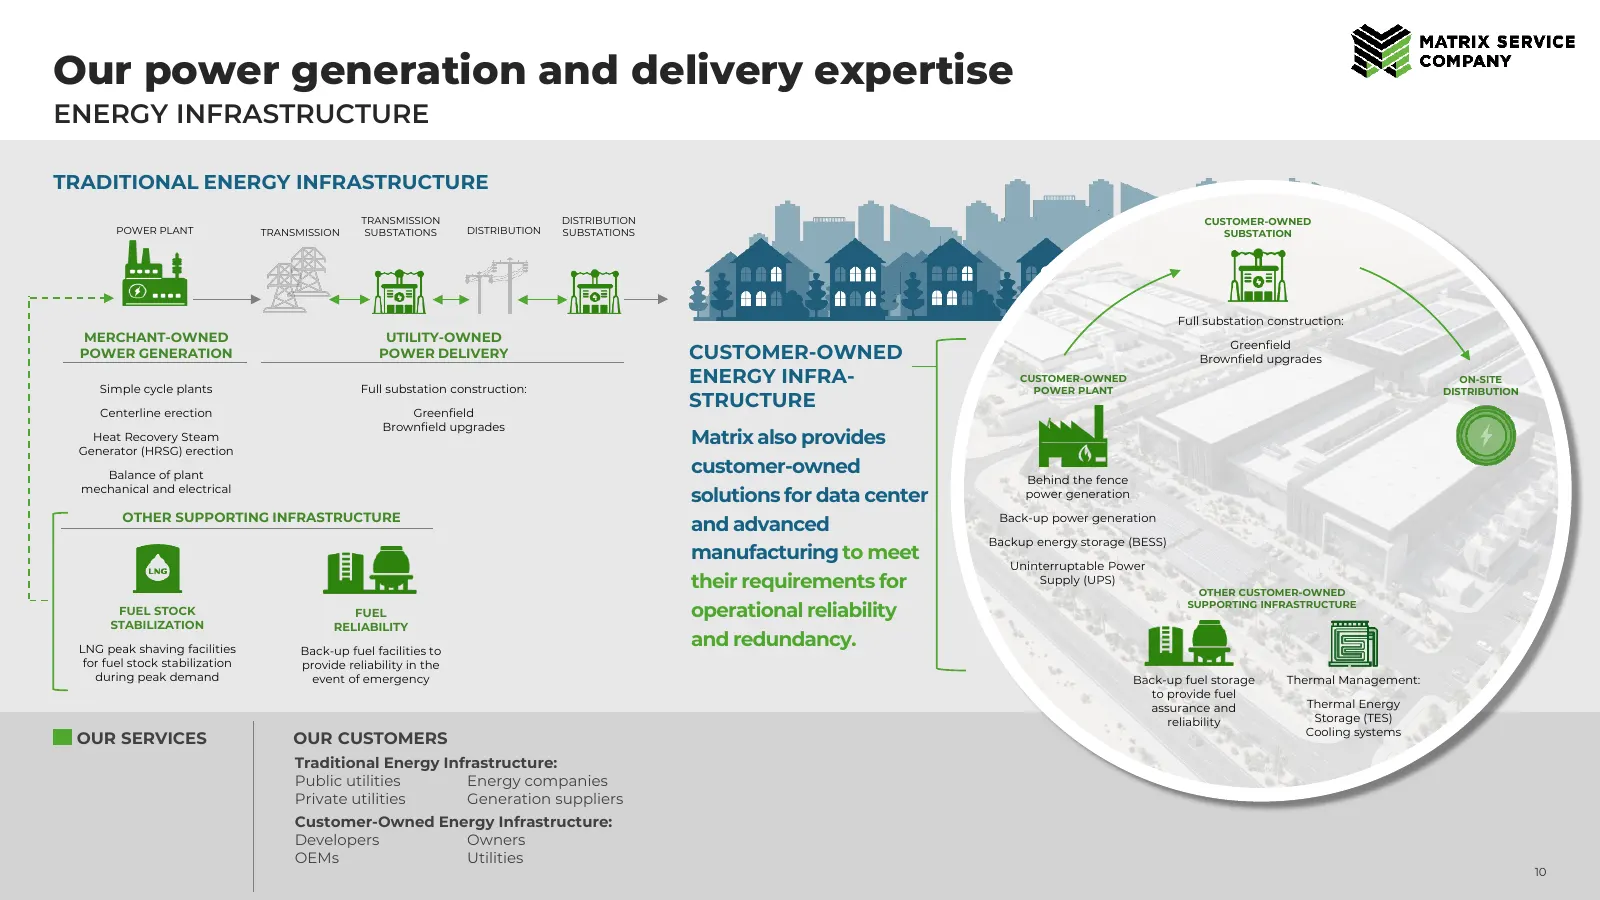
Slide 10: Our power generation and delivery expertise
Our power generation and delivery expertise ENERGY INFRASTRUCTURE TRADITIONAL ENERGY INFRASTRUCTURE TRANSMISSION DISTRIBUTION CUSTOMER-OWNED POWER PLANT TRANSMISSION SUBSTATIONS DISTRIBUTION SUBSTATIONS SUBSTATION Full substation construction: MERCHANT-OWNED UTILITY-OWNED Greenfield POWER GENERATION
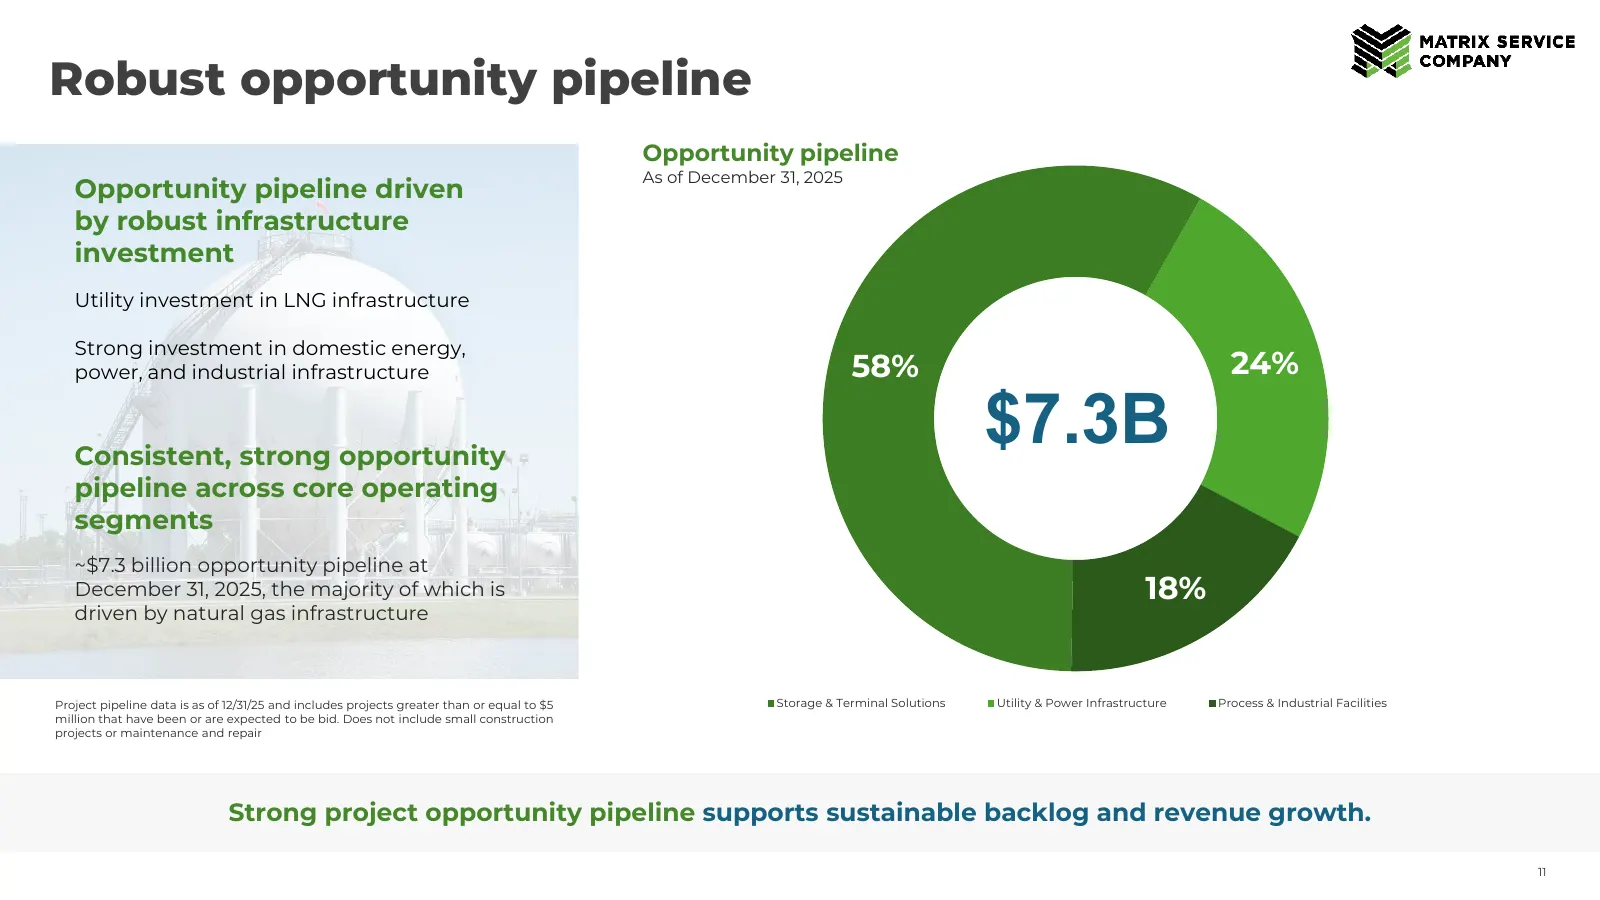
Slide 11: Robust opportunity pipeline
Robust opportunity pipeline Opportunity pipeline As of December 31, 2025 Opportunity pipeline driven by robust infrastructure investment Utility investment in LNG infrastructure Strong investment in domestic energy, power, and industrial infrastructure 58% 24% Consistent, strong opportunity $7.3B pi
Slide 12: Strategic Roadmap
MATRIX SERVICE COMPANY = AX 7 STRAT GIC ROADMAP ~~ Fo
Slide 13: Our strategic framework
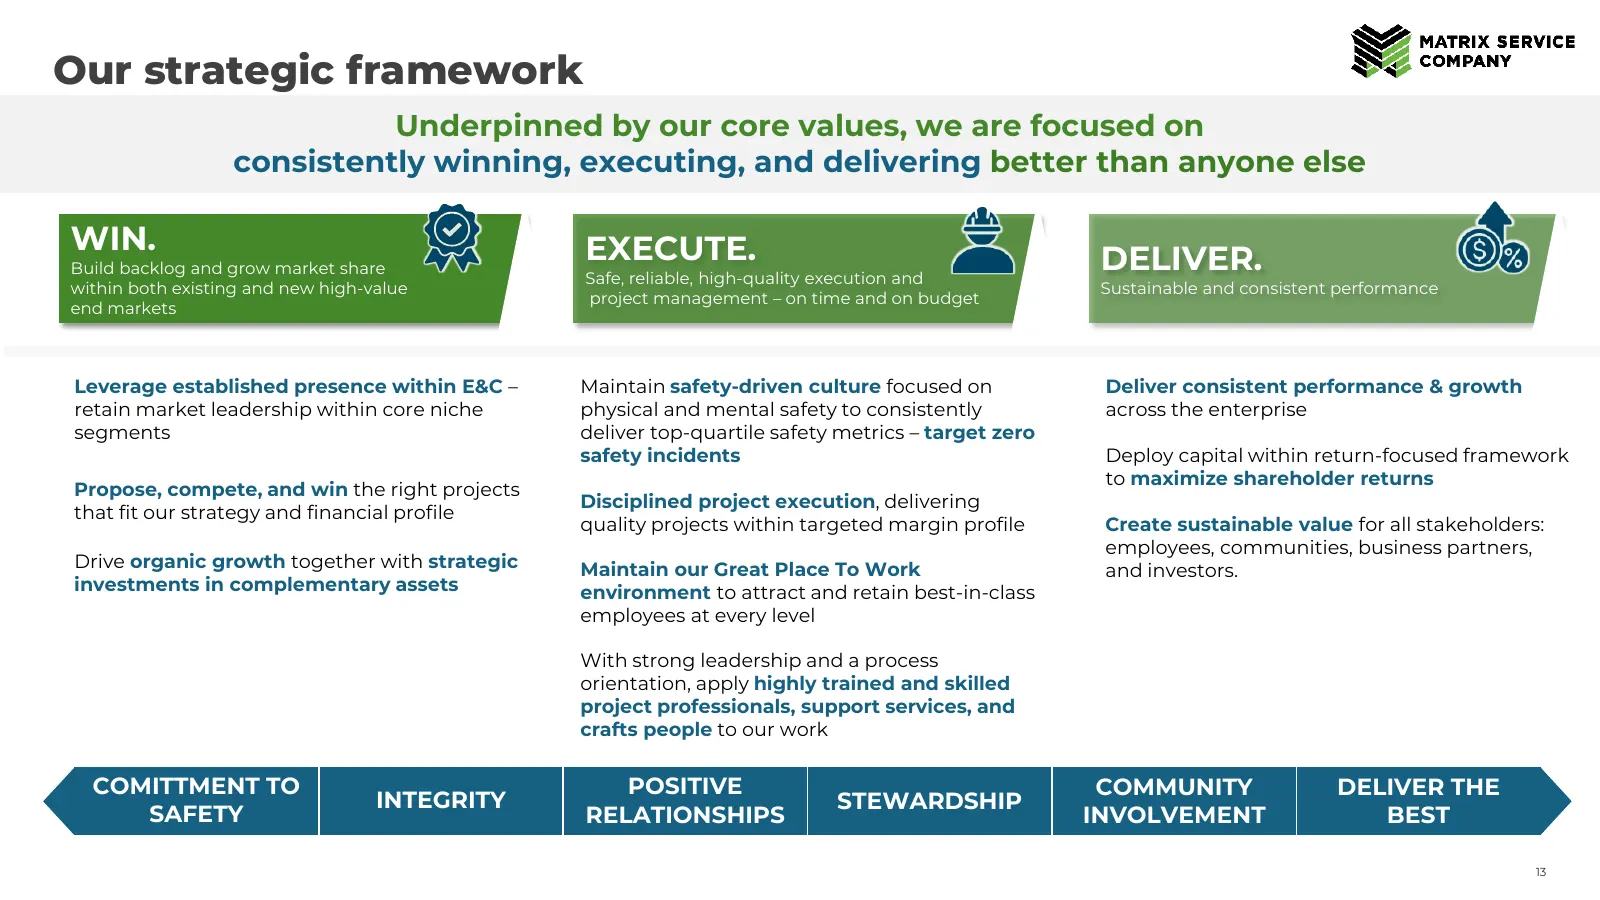
Our strategic framework Underpinned by our core values, we are focused on consistently winning, executing, and delivering better than anyone else WIN. EXECUTE. Build backlog and grow market share Safe, reliable, high-quality execution and DELIVER. within both existing and new high-value Sustainable
Slide 14: Return-centric capital allocation
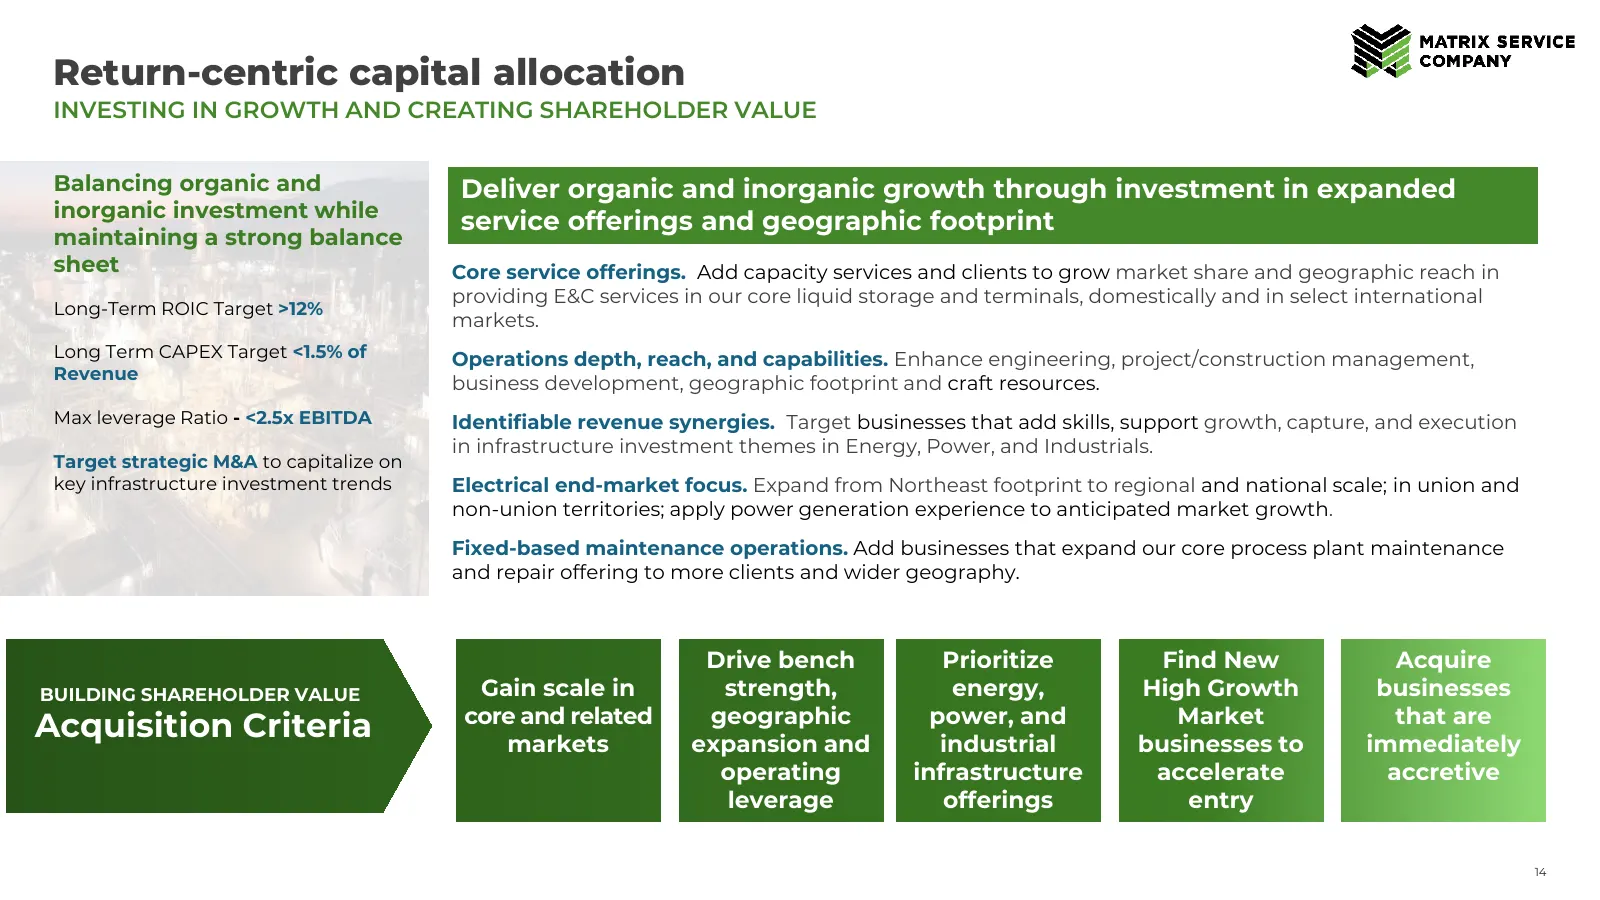
Return-centric capital allocation INVESTING IN GROWTH AND CREATING SHAREHOLDER VALUE Balancing organic and Deliver organic and inorganic growth through investment in expanded inorganic investment while service offerings and geographic footprint maintaining a strong balance sheet Core service offerin
Slide 15: Q2 FY26 Performance
Q2 FY26 PERFORMANCE
Slide 16: Project awards of $177M and strong $1.1B backlog provide multi-year visibility
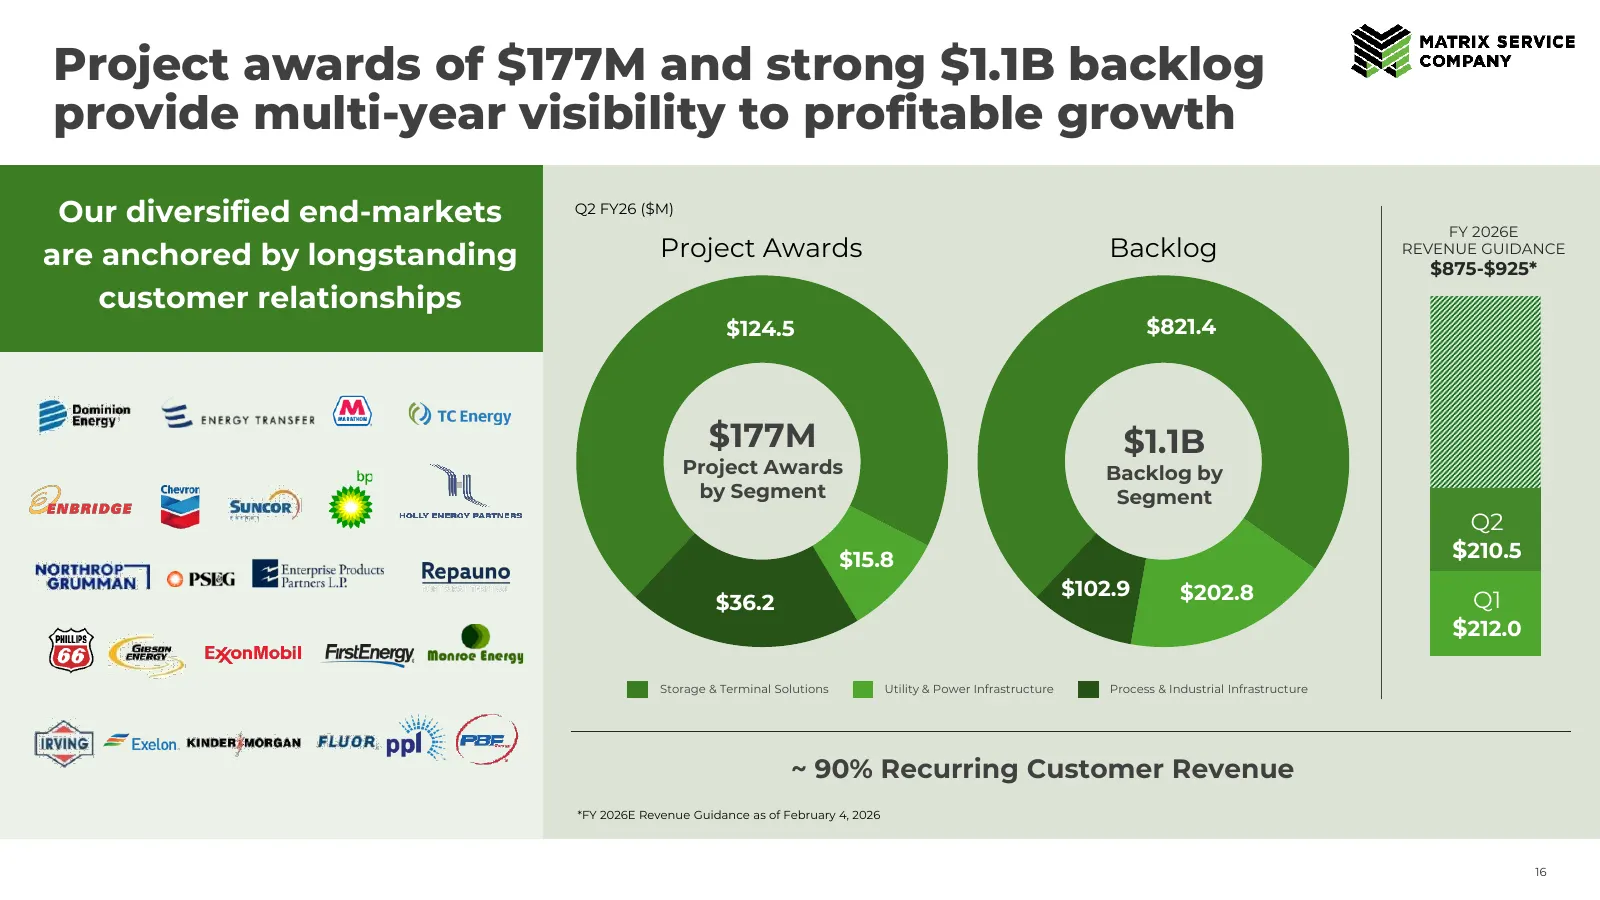
Project awards of $177M and strong $1.1B backlog provide multi-year visibility to profitable growth Our diversified end-markets Q2 FY26 ($M) FY 2026E are anchored by longstanding Project Awards Backlog REVENUE GUIDANCE $875-$925* customer relationships $124.5 $821.4 $177M $1.1B Project Awards Backlo
Slide 17: Financial performance
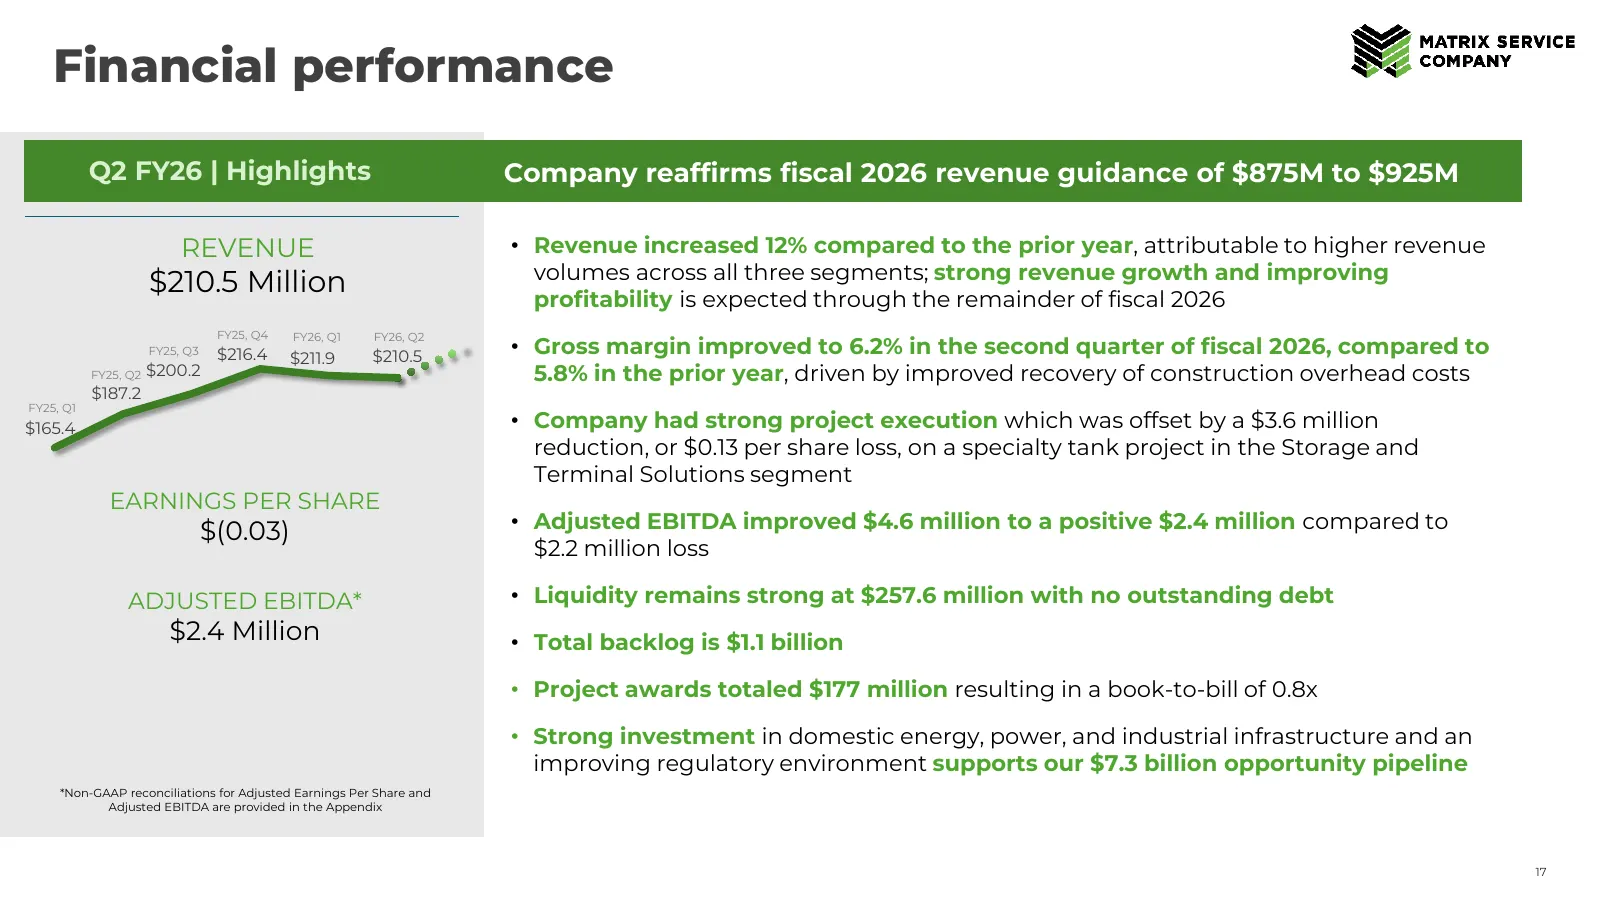
Financial performance Q2 Q2FY26 FY26| HIGHLIGHTS Highlights Company reaffirms fiscal 2026 revenue guidance of $875M to $925M REVENUE • Revenue increased 12% compared to the prior year, attributable to higher revenue volumes across all three segments; strong revenue growth and improving $210.5 Millio
Slide 18: Investment summary
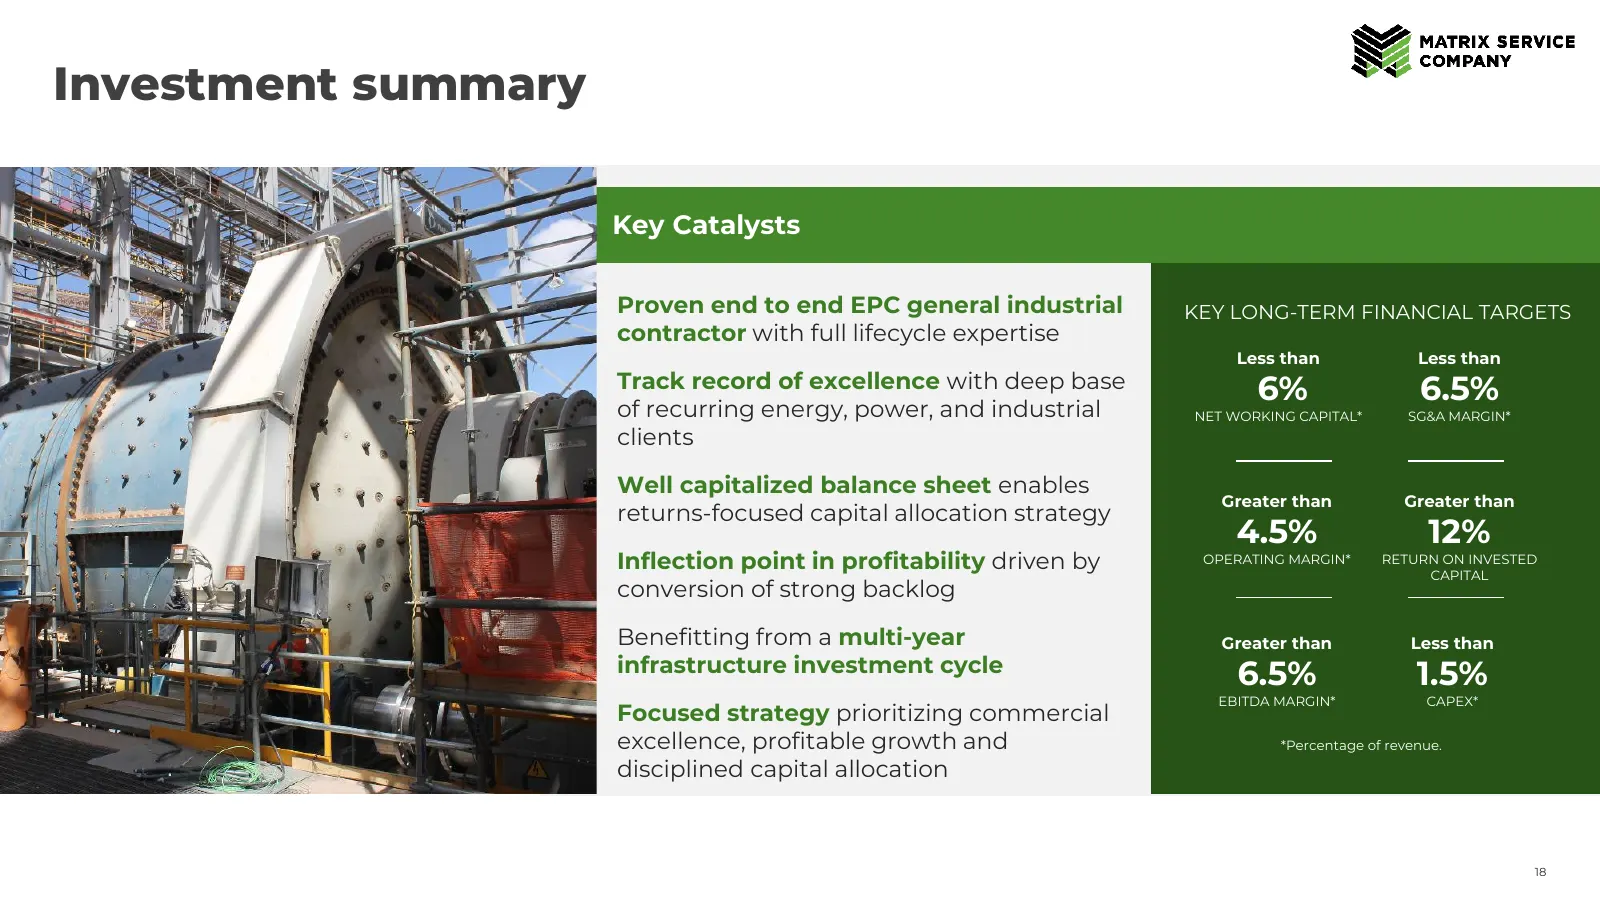
Investment summary Key Catalysts Proven end to end EPC general industrial KEY LONG-TERM FINANCIAL TARGETS contractor with full lifecycle expertise Less than Less than Track record of excellence with deep base 6% 6.5% of recurring energy, power, and industrial NET WORKING CAPITAL* SG&A MARGIN* client
Slide 19: Disciplined balance sheet management
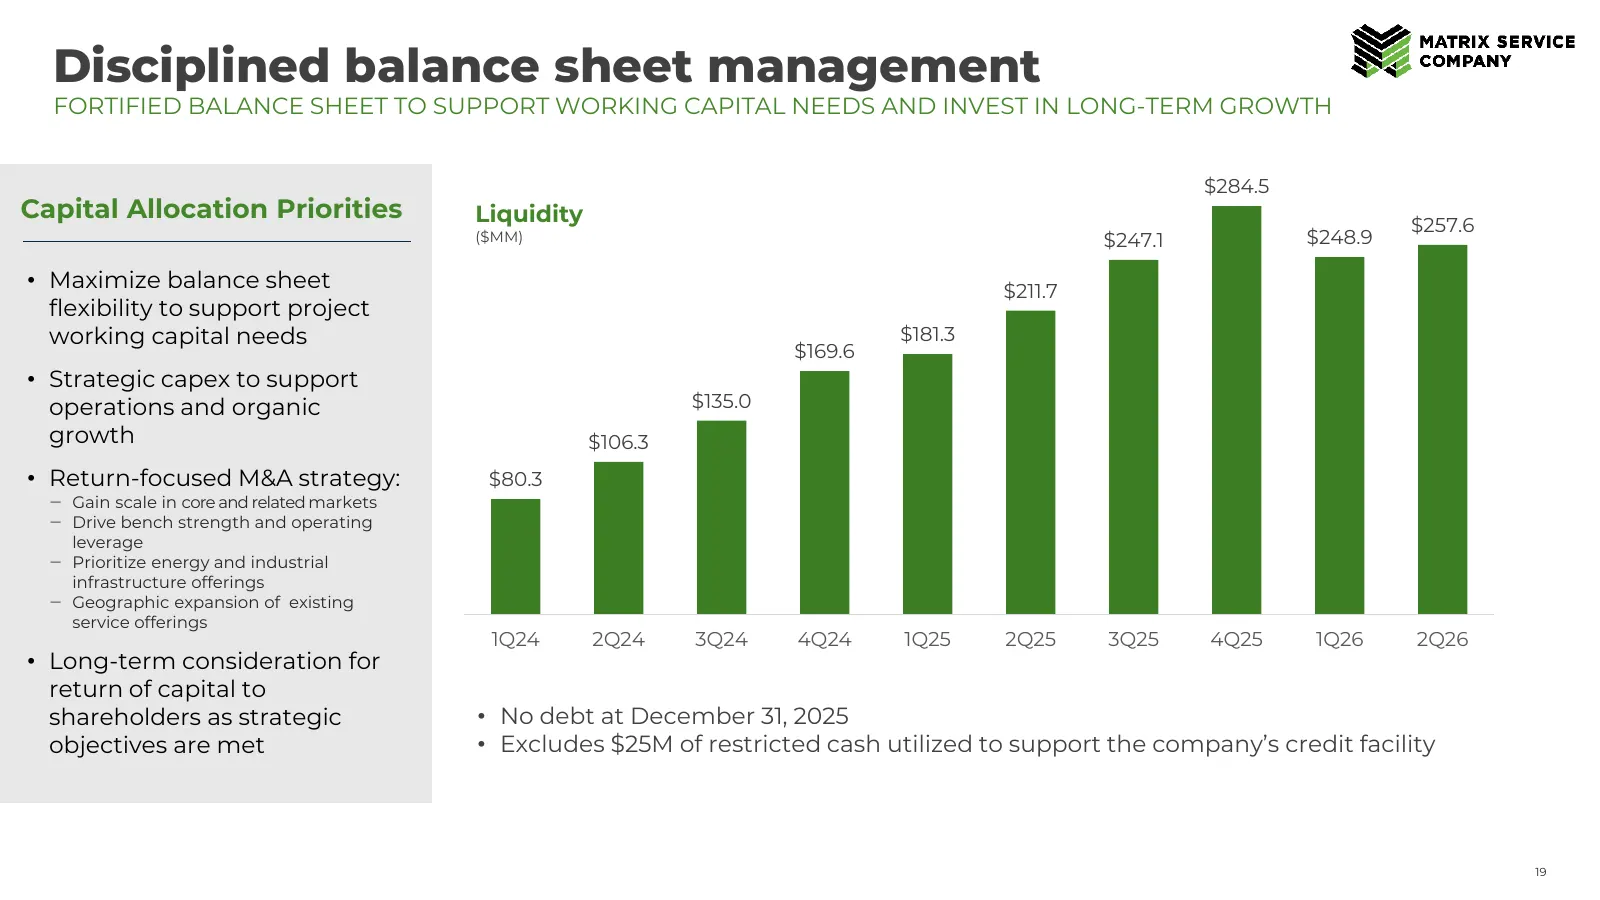
Disciplined balance sheet management FORTIFIED BALANCE SHEET TO SUPPORT WORKING CAPITAL NEEDS AND INVEST IN LONG-TERM GROWTH $284.5 Capital Allocation Priorities Liquidity $257.6 ($MM) $247.1 $248.9 • Maximize balance sheet $211.7 flexibility to support project working capital needs $181.3 $169.6 •
Slide 20: Investor Corporate Access
Investor Corporate Access Kellie Smythe Senior Director of Investor Relations, Sustainability, Marketing & Communications T • 918 359 8267 E • ir@matrixservicecompany.com SCAN QR CODE TO SIGN UP FOR MTRX NEWS © Matrix Service Company. All rights reserved. 20 20
Slide 21: Appendix
APPENDIX
Slide 22: Quarterly results | Consolidated
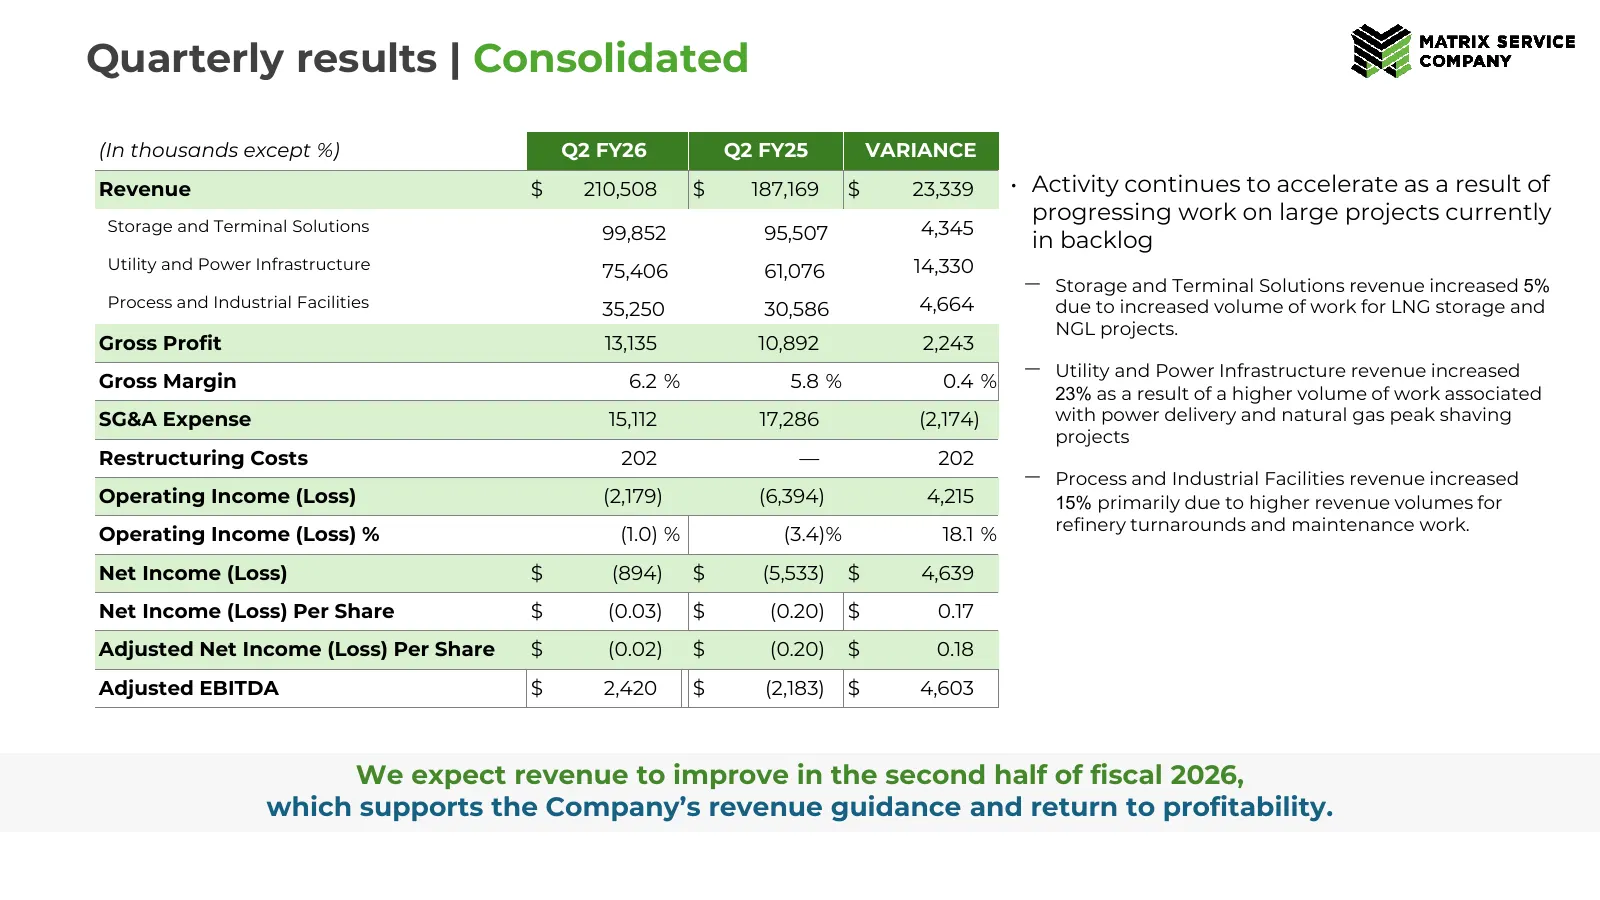
Quarterly results | Consolidated (In thousands except %) Q2 FY26 Q2 FY25 VARIANCE Revenue $ 210,508 $ 187,169 $ 23,339 • Activity continues to accelerate as a result of progressing work on large projects currently Storage and Terminal Solutions 99,852 95,507 4,345 in backlog Utility and Power Infras
Slide 23: Adjusted net income (loss)
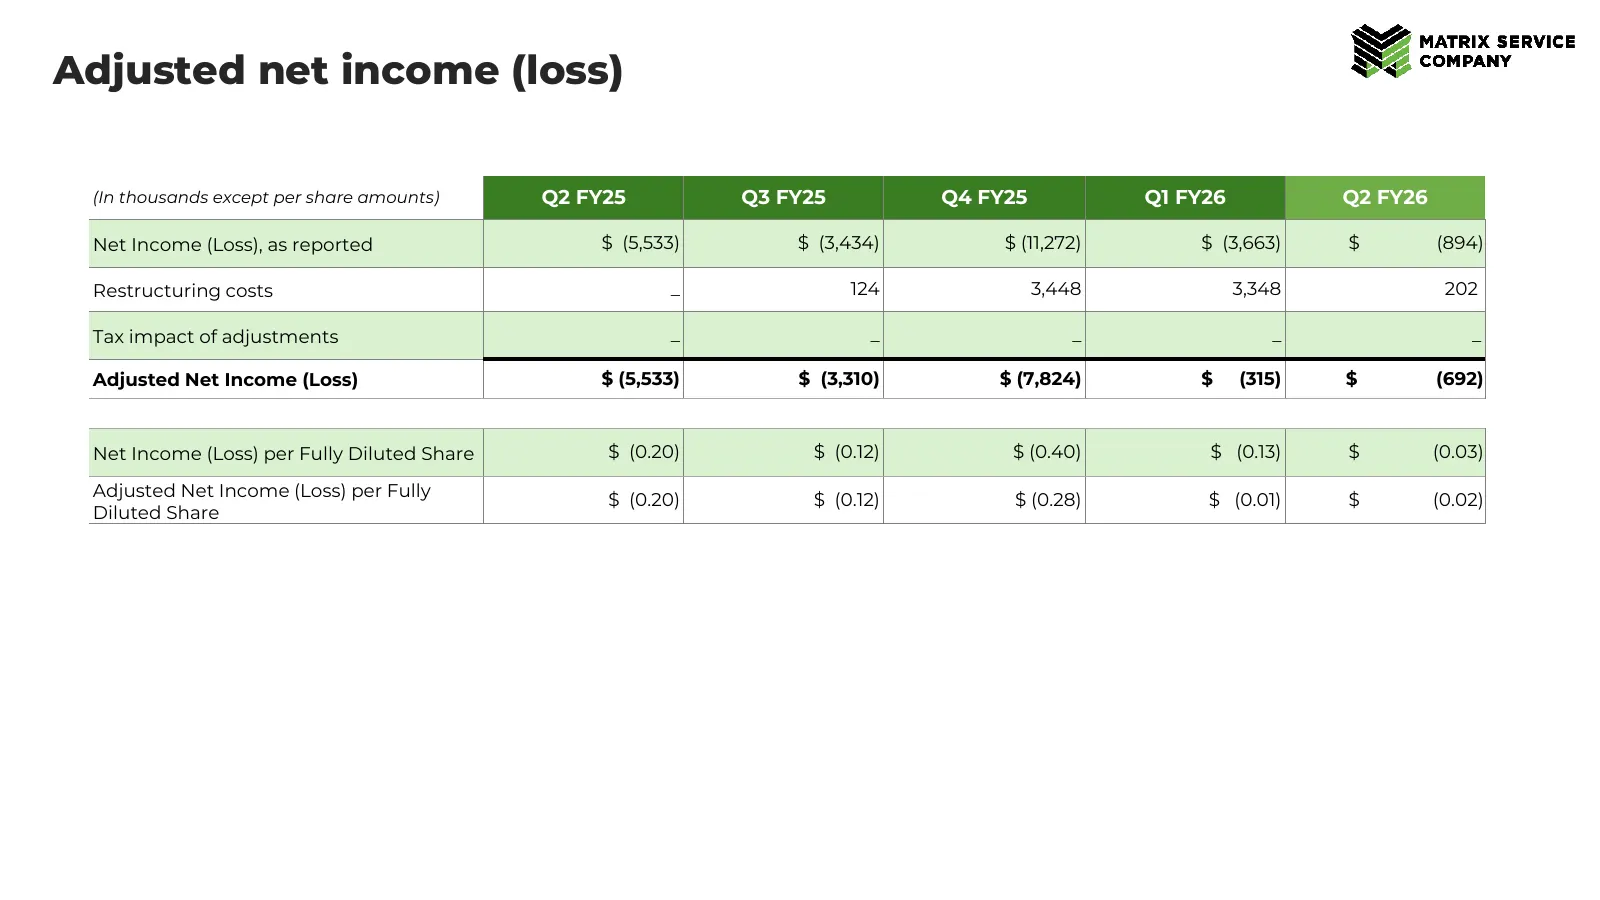
Adjusted net income (loss) (In thousands except per share amounts) Q2 FY25 Q3 FY25 Q4 FY25 Q1 FY26 Q2 FY26 Net Income (Loss), as reported $ (5,533) $ (3,434) $ (11,272) $ (3,663) $ (894) Restructuring costs _ 124 3,448 3,348 202 Tax impact of adjustments _ _ _ _ _ Adjusted Net Income (Loss) $ (5,533
Slide 24: Adjusted EBITDA
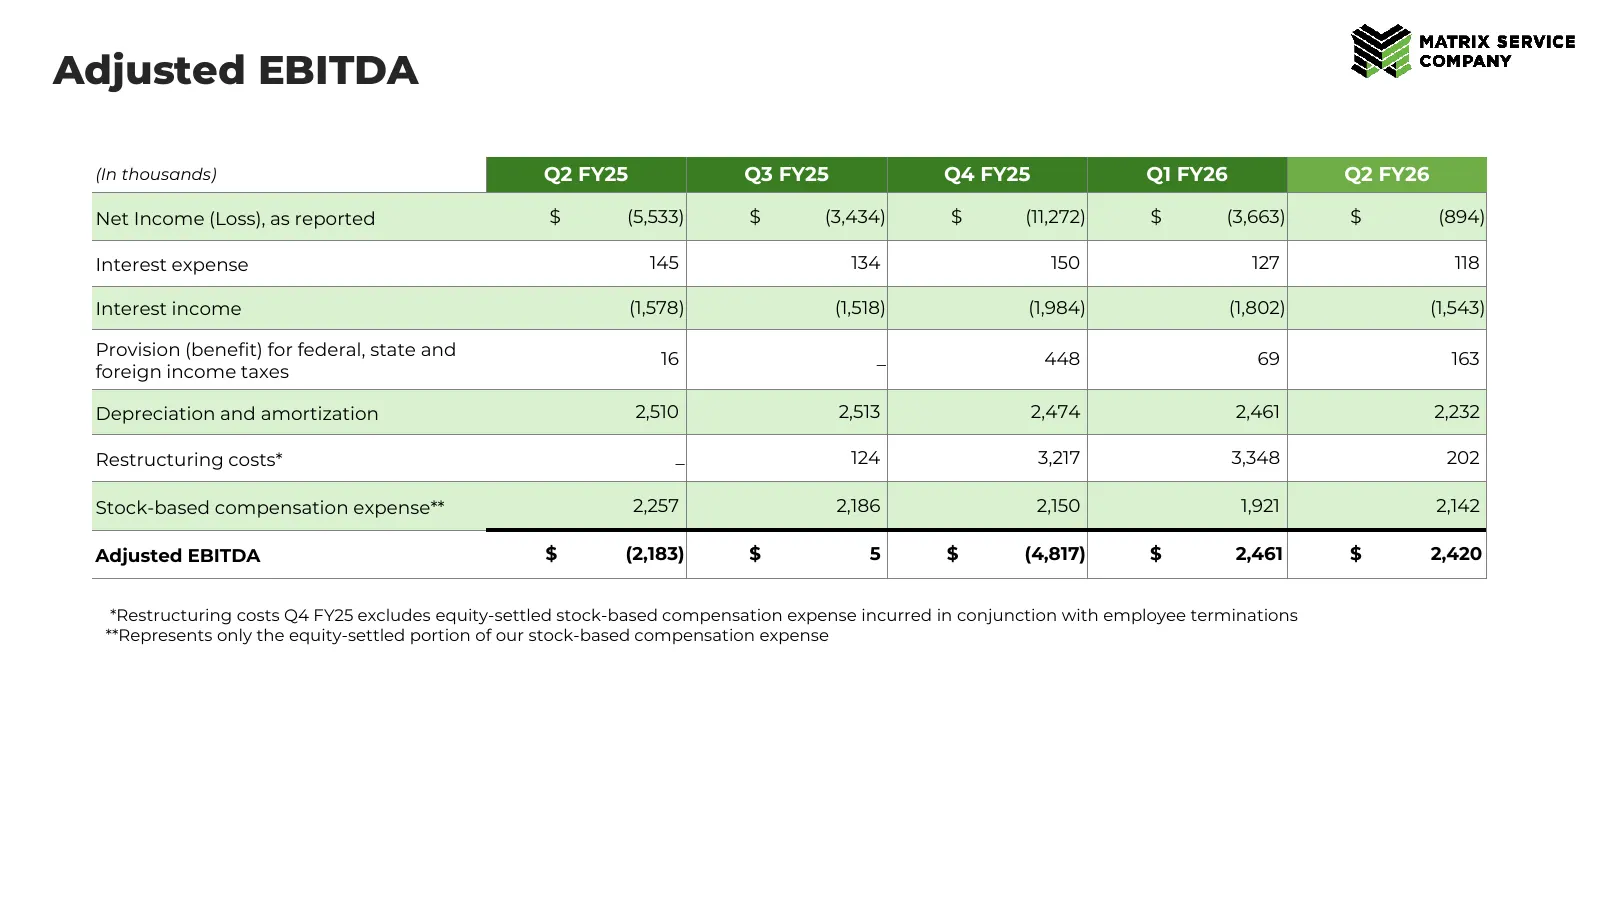
Adjusted EBITDA (In thousands) Q2 FY25 Q3 FY25 Q4 FY25 Q1 FY26 Q2 FY26 Net Income (Loss), as reported $ (5,533) $ (3,434) $ (11,272) $ (3,663) $ (894) Interest expense 145 134 150 127 118 Interest income (1,578) (1,518) (1,984) (1,802) (1,543) Provision (benefit) for federal, state and 16 _ 448 69 1
Source: 6ix earnings call
More decks from Matrix Service Company
 Q4 FY2026 Earnings Presentation21 slides · September 2026
 Q3 2026 Earnings Presentation22 slides · May 7, 2026
 Q1 2026 Earnings Presentation25 slides · Nov 6, 2025
 Q4 2025 Earnings Presentation25 slides · Sep 10, 2025
 Q3 2025 Earnings Presentation23 slides · May 8, 2025
 Q2 2025 Earnings Presentation23 slides · Feb 6, 2025