Furmanite — Q2 2010 Earnings Presentation
17 slides from Furmanite's earnings presentation, Aug 9, 2010
Slide 1: Furmanite Corporation Quarter Ended June 30, 2010
Furmanite Corporation QUARTER ENDED JUNE 30, 2010 Charles R. Cox, Chairman & CEO Joseph E. Milliron, President & COO Robert S. Muff, Principal Financial Officer
Slide 2: Safe Harbor Statement
Certain of the Company's statements in this presentation are not purely historical, and as such are "forward-looking statements" within the meaning of the Private Securities Litigation Reform Act of 1995. These include statements regarding management's plans, beliefs, expectations, intentions or pro

Slide 3: Review of Q2 2010
Furmanite Corporation Review of Q2 2010 Charles R. Cox, Chairman & CEO 8/9/2010 3
Slide 4: Q2 2010 Financial Review
Furmanite Corporation Q2 2010 Financial Review Robert S. Muff, Principal Financial Officer 8/9/2010 4
Slide 5: Consolidated Income Statements
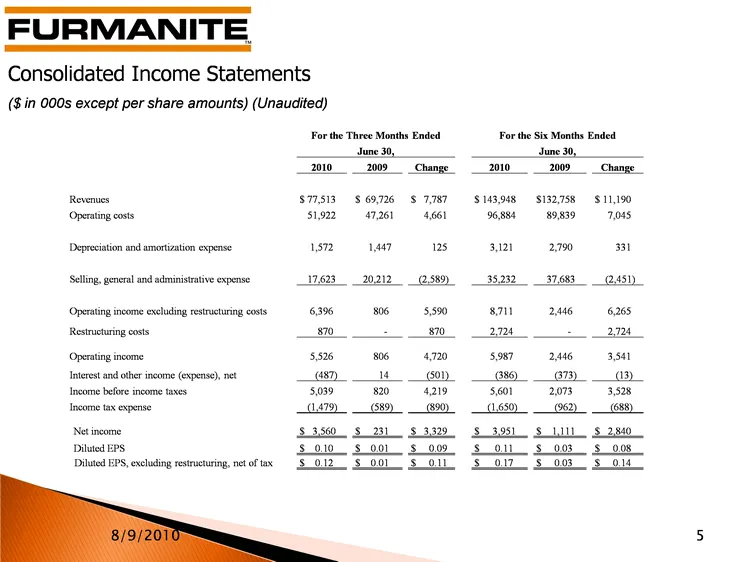
Consolidated Income Statements ($ in 000s except per share amounts) (Unaudited) 8/9/2010 5 For the Three Months Ended For the Three Months Ended For the Three Months Ended For the Three Months Ended For the Three Months Ended For the Six Months Ended For the Six Months Ended For the Six Months Ended
Slide 6: Adjustments for Currency Rates
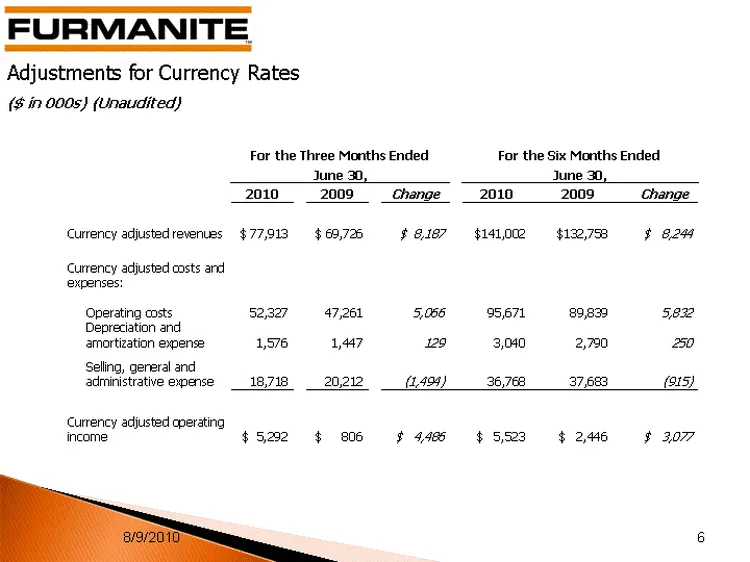
Adjustments for Currency Rates ($ in 000s) (Unaudited) 8/9/2010 6 For the Three Months Ended For the Three Months Ended For the Three Months Ended For the Three Months Ended For the Three Months Ended For the Six Months Ended For the Six Months Ended For the Six Months Ended For the Six Months Ended
Slide 7: Revenues Adjusted for Currency Rates
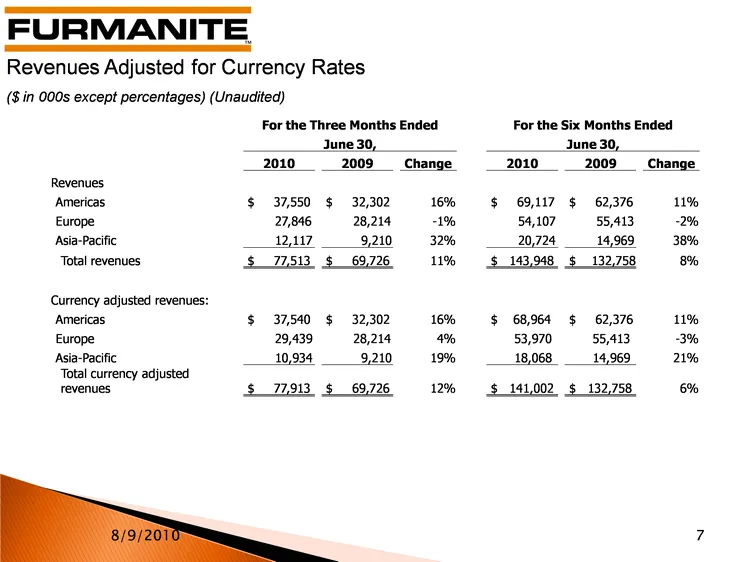
Revenues Adjusted for Currency Rates ($ in 000s except percentages) (Unaudited) 8/9/2010 7 For the Three Months Ended For the Three Months Ended For the Three Months Ended For the Three Months Ended For the Three Months Ended For the Six Months Ended For the Six Months Ended For the Six Months Ended
Slide 8: Adjustments for Currency Rates
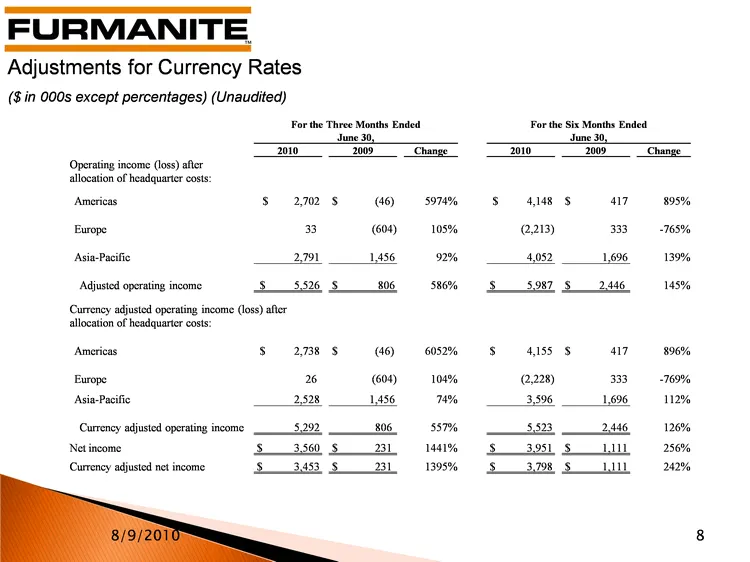
Adjustments for Currency Rates ($ in 000s except percentages) (Unaudited) 8/9/2010 8 For the Three Months Ended For the Three Months Ended For the Three Months Ended For the Three Months Ended For the Three Months Ended For the Six Months Ended For the Six Months Ended For the Six Months Ended For t
Slide 9: Condensed Consolidated Balance Sheets
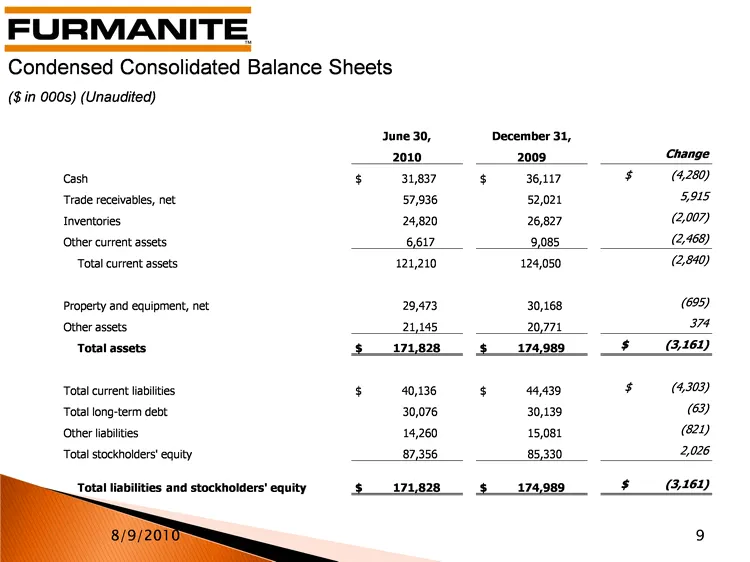
Condensed Consolidated Balance Sheets ($ in 000s) (Unaudited) 8/9/2010 9 June 30, December 31, 2010 2009 Change Cash $ 31,837 $ 36,117 $ (4,280) Trade receivables, net 57,936 52,021 5,915 Inventories 24,820 26,827 (2,007) Other current assets 6,617 9,085 (2,468) Total current assets 121,210 124,050
Slide 10: Condensed Consolidated Cash Flows
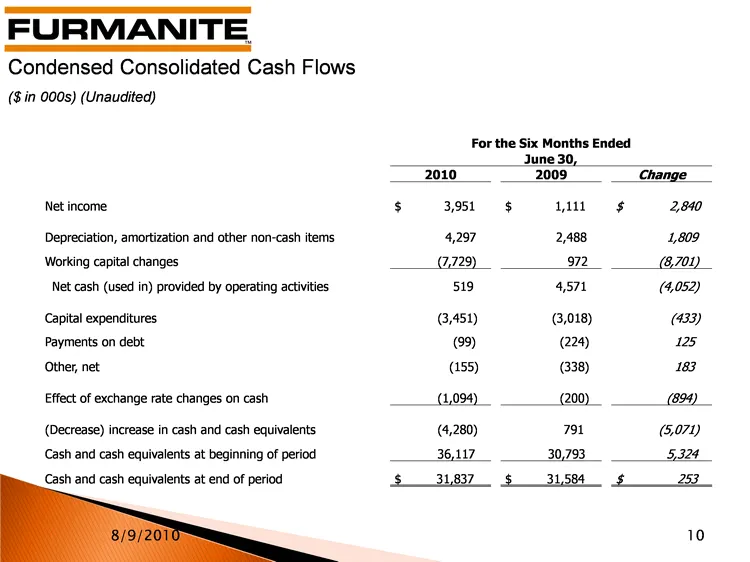
Condensed Consolidated Cash Flows ($ in 000s) (Unaudited) 8/9/2010 10 For the Six Months Ended For the Six Months Ended For the Six Months Ended For the Six Months Ended For the Six Months Ended June 30, June 30, June 30, June 30, June 30, 2010 2009 Change Net income $ 3,951 $ 1,111 $ 2,840 Deprecia
Slide 11: Q2 2010 Operations Review
Furmanite Corporation Q2 2010 Operations Review Joseph E. Milliron, President and Chief Operating Officer 8/9/2010 11
Slide 12: Employee headcount and costs aligned with revenues
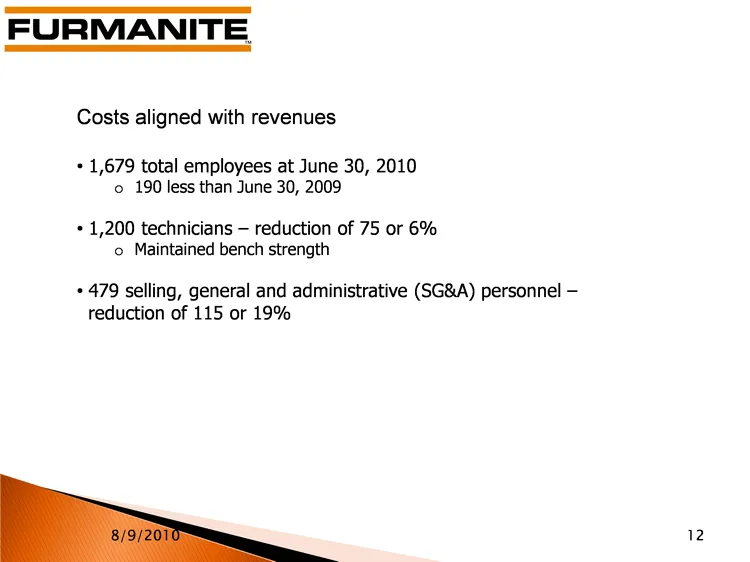
12 8/9/2010 1,679 total employees at June 30, 2010 190 less than June 30, 2009 1,200 technicians - reduction of 75 or 6% Maintained bench strength 479 selling, general and administrative (SG&A) personnel - reduction of 115 or 19% Costs aligned with revenues
Slide 13: Business and Geographic Data - Turnaround Services Revenues
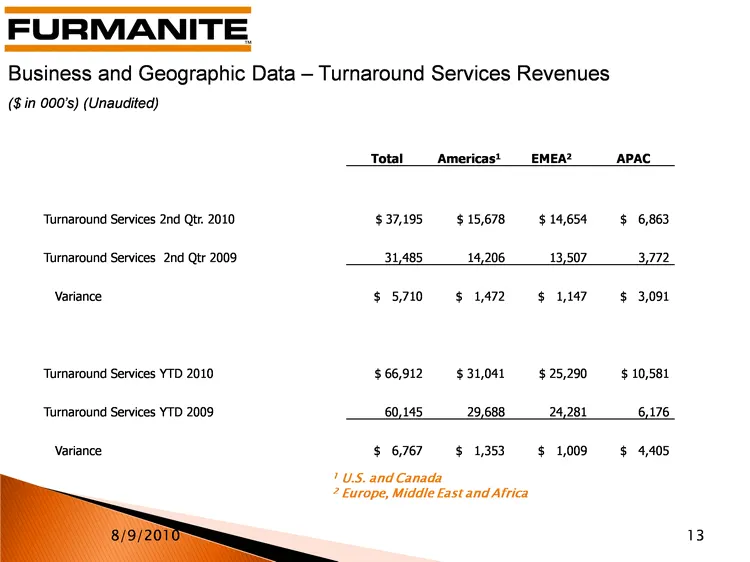
Business and Geographic Data - Turnaround Services Revenues ($ in 000's) (Unaudited) 8/9/2010 13 1 U.S. and Canada 2 Europe, Middle East and Africa Total Americas1 EMEA2 APAC Turnaround Services 2nd Qtr. 2010 $ 37,195 $ 15,678 $ 14,654 $ 6,863 Turnaround Services 2nd Qtr 2009 31,485 14,206 13,507 3,
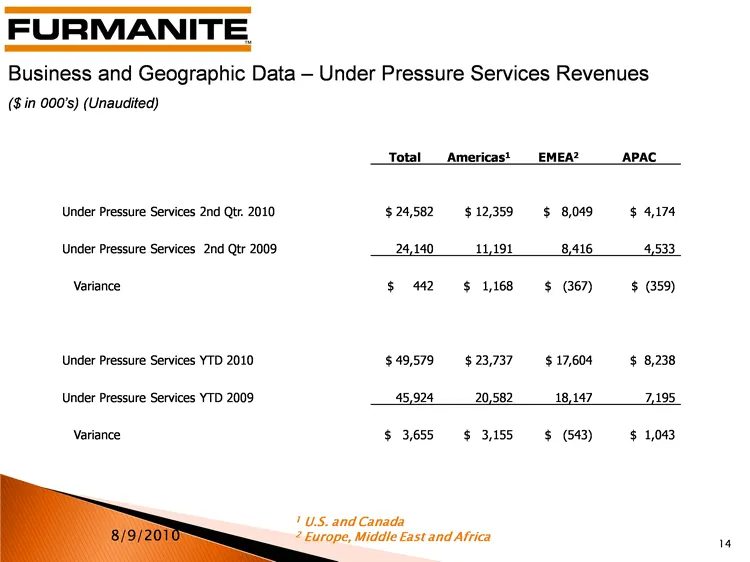
Slide 14: Business and Geographic Data - Under Pressure Services Revenues
14 Total Americas1 EMEA2 APAC Under Pressure Services 2nd Qtr. 2010 $ 24,582 $ 12,359 $ 8,049 $ 4,174 Under Pressure Services 2nd Qtr 2009 24,140 11,191 8,416 4,533 Variance $ 442 $ 1,168 $ (367) $ (359) Under Pressure Services YTD 2010 $ 49,579 $ 23,737 $ 17,604 $ 8,238 Under Pressure Services YTD
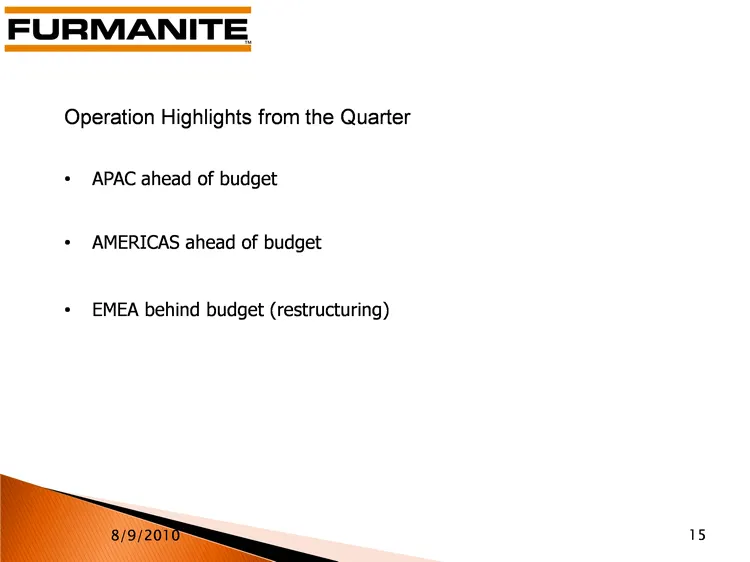
Slide 15: Operation Highlights from the Quarter
15 Operation Highlights from the Quarter APAC ahead of budget AMERICAS ahead of budget EMEA behind budget (restructuring) 8/9/2010
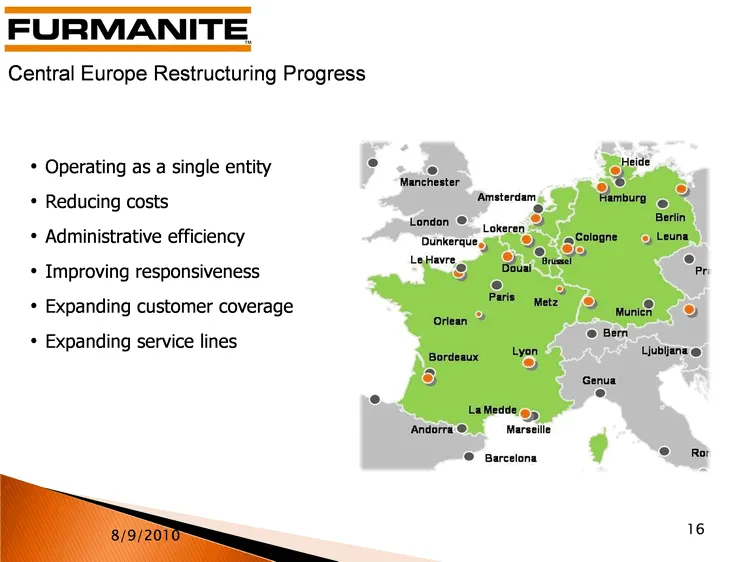
Slide 16: Central Europe Restructuring Progress
Central Europe Restructuring Progress 16 8/9/2010 Operating as a single entity Reducing costs Administrative efficiency Improving responsiveness Expanding customer coverage Expanding service lines

Slide 17: Furmanite Corporation Review of Q2 2010
Furmanite Corporation Review of Q2 2010 www.furmanite.com 17
Source: SEC EDGAR · 8-K filed Aug 9, 2010
More decks from Furmanite Corp
 Merger or Acquisition (November 2015)13 slides · Nov 2, 2015
 Q2 2015 Earnings Presentation19 slides · Aug 4, 2015
 Q1 2015 Earnings Presentation16 slides · May 11, 2015
 Proxy Contest (April 2015)40 slides · Apr 2, 2015
 Proxy Contest (April 2015)29 slides · Apr 2, 2015
 Proxy Contest (March 2015)39 slides · Mar 30, 2015