Entegra Financial — Shareholder Meeting (May 2017)
45 slides from Entegra Financial's shareholder meeting presentation, May 19, 2017
Slide 1: May 2017 Annual Shareholder Meeting
May 2017 Annual Shareholder Meeting
Slide 2: Forward Looking Statements
The discussions included in this document may contain “forward - looking statements” within the meaning of the Private Securities Litigation Reform Act of 1995 , including Section 21 E of the Securities Exchange Act of 1934 and Section 27 A of the Securities Act of 1933 . Such statements involve kno
Slide 3: Non-GAAP Measurements
Statements included in this document include non - GAAP financial measures and should be read along with the accompanying tables in the GAAP Appendix to our quarterly earnings release, which provide a reconciliation of non - GAAP financial measures to GAAP financial measures . This document discusse
Slide 4: Financial Basis
All financial numbers included in this presentation are shown in thousands ( 000 ’s) unless otherwise noted, excluding per share data and percentages . Financial Basis 4
Slide 5: Who We Are
Who We Are 5
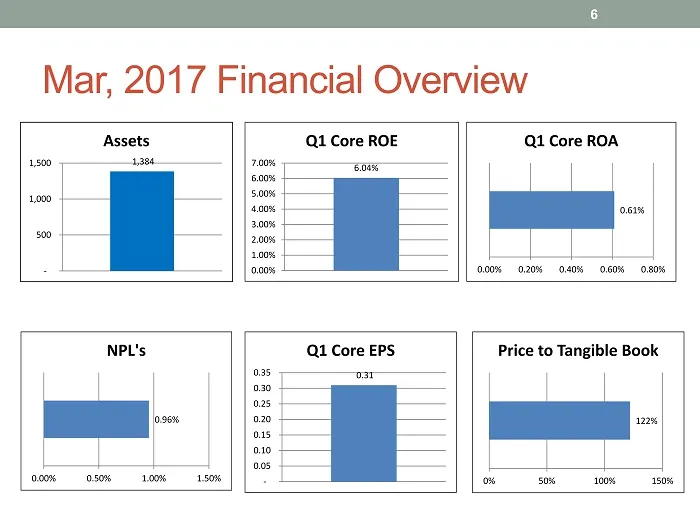
Slide 6: Mar, 2017 Financial Overview
Mar, 2017 Financial Overview 6 1,384 - 500 1,000 1,500 Assets 6.04% 0.00% 1.00% 2.00% 3.00% 4.00% 5.00% 6.00% 7.00% Q1 Core ROE 0.61% 0.00% 0.20% 0.40% 0.60% 0.80% Q1 Core ROA 0.96% 0.00% 0.50% 1.00% 1.50% NPL's 0.31 - 0.05 0.10 0.15 0.20 0.25 0.30 0.35 Q1 Core EPS 122% 0% 50% 100% 150% Price to Tan
Slide 7: What's In A Name? Integrity
What’s In A Name? Integrity (Noun) “the quality of being honest and having strong moral principles ; moral uprightness . ” 7
Slide 8: Years of History … And Counting
95 Years of History … And Counting 8
Slide 9: Branch Footprint
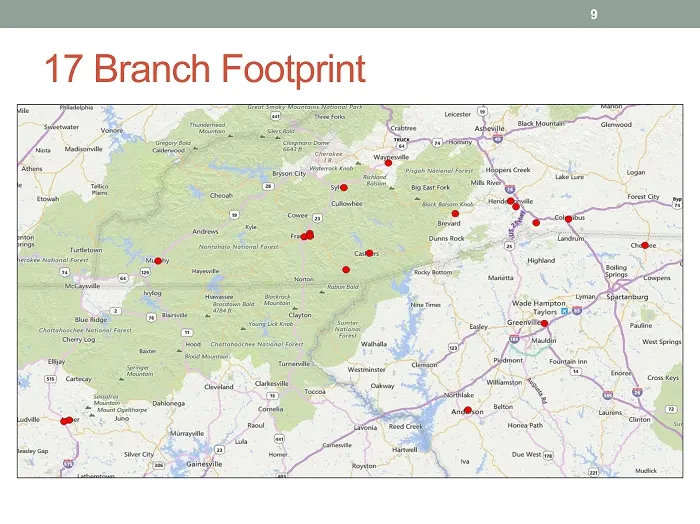
17 Branch Footprint 9
Slide 10: #2 Legacy Deposit Market Share
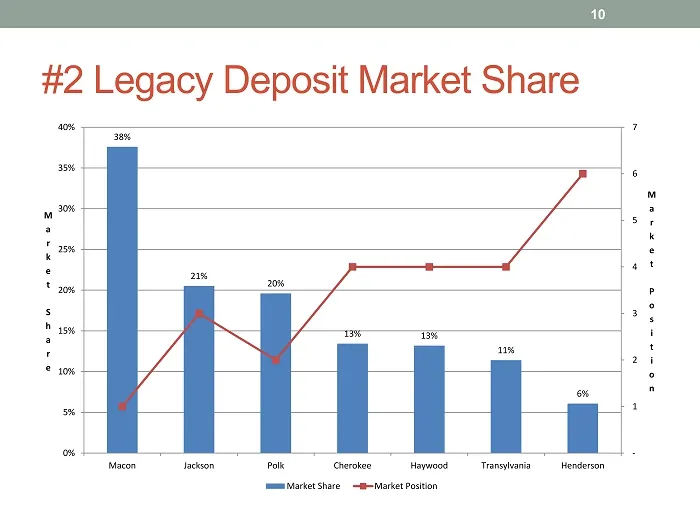
#2 Legacy Deposit Market Share 10 38% 21% 20% 13% 13% 11% 6% - 1 2 3 4 5 6 7 0% 5% 10% 15% 20% 25% 30% 35% 40% Macon Jackson Polk Cherokee Haywood Transylvania Henderson M a r k e t P o s i t i o n M a r k e t S h a r e Market Share Market Position
Slide 11: Major Employers
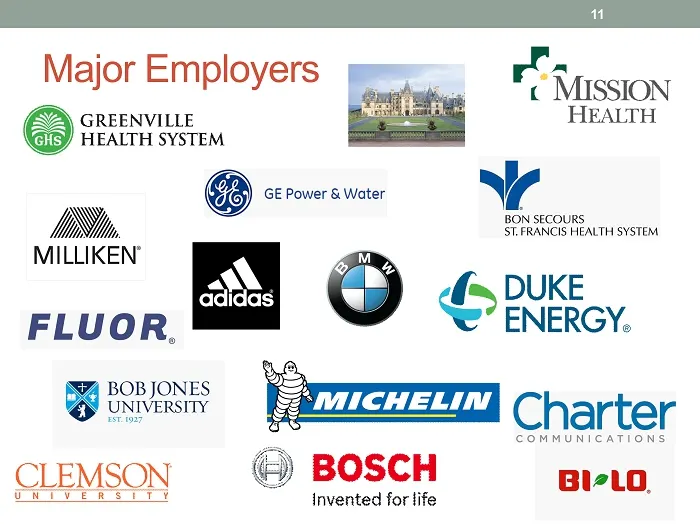
Major Employers mes res « MISSION GREENVILLE : HEALTH HEALTH SYSTEM GE Power & Water W Wn, BON secouns MILLIKEN’ NS at ias DUKE FLUOR. il Ot eee AT Charter COMMUNICATIONS CLEMSON ©) BOSCH BI-LO, invented for life
Slide 12: Charter Conversion
Charter Conversion 12
Slide 13: Experienced Executive Team
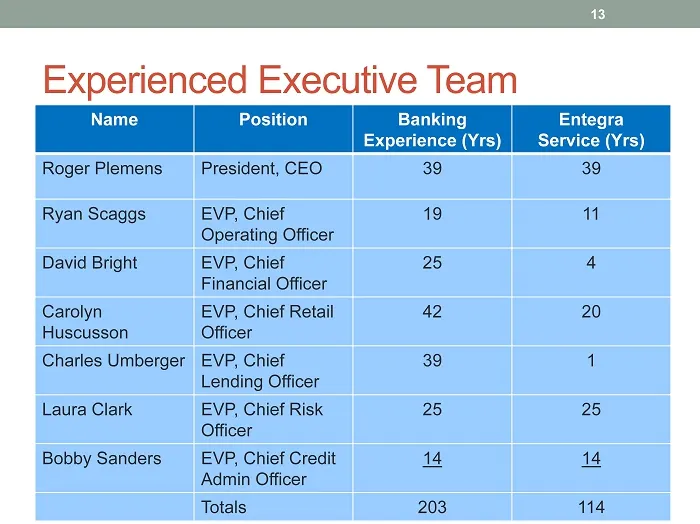
Experienced Executive Team Name Position Banking Experience ( Yrs ) Entegra Service ( Yrs ) Roger Plemens President, CEO 39 39 Ryan Scaggs EVP, Chief Operating Officer 19 11 David Bright EVP, Chief Financial Officer 25 4 Carolyn Huscusson EVP, Chief Retail Officer 42 20 Charles Umberger EVP, Chief L
Slide 14: Solid Stock Performance
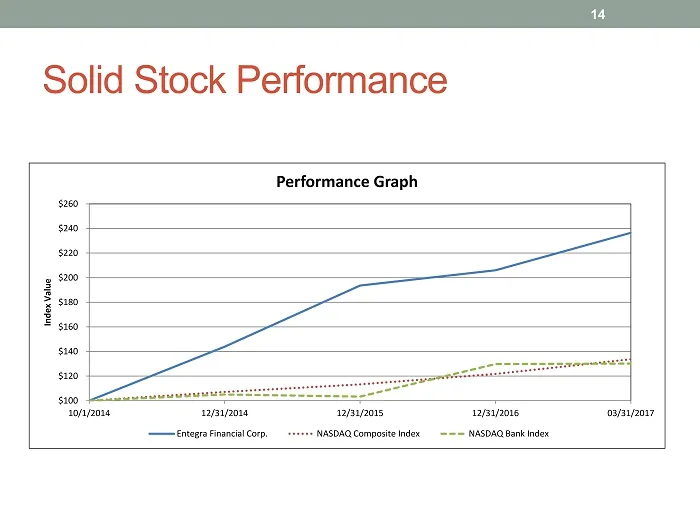
Solid Stock Performance 14 $100 $120 $140 $160 $180 $200 $220 $240 $260 10/1/2014 12/31/2014 12/31/2015 12/31/2016 03/31/2017 Index Value Performance Graph Entegra Financial Corp. NASDAQ Composite Index NASDAQ Bank Index
Slide 15: Attractively Valued
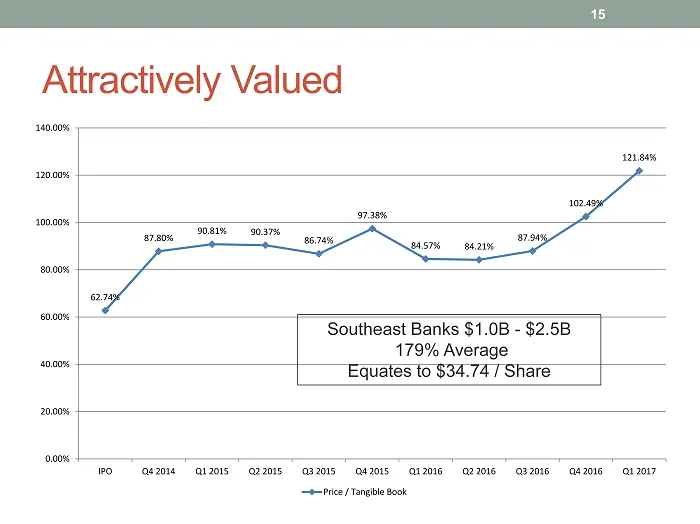
62.74% 87.80% 90.81% 90.37% 86.74% 97.38% 84.57% 84.21% 87.94% 102.49% 121.84% 0.00% 20.00% 40.00% 60.00% 80.00% 100.00% 120.00% 140.00% IPO Q4 2014 Q1 2015 Q2 2015 Q3 2015 Q4 2015 Q1 2016 Q2 2016 Q3 2016 Q4 2016 Q1 2017 Price / Tangible Book Attractively Valued Southeast Banks $1.0B - $2.5B 179% Av
Slide 16: Research Coverage
Research Coverage fay Ove GROUP 1 SANDLER pony Ronen tow . O'NEILL + PARTNERS
Slide 17: Strategy Summary
Strategy Summary 17
Slide 18: Continued Execution of Strategic Plan
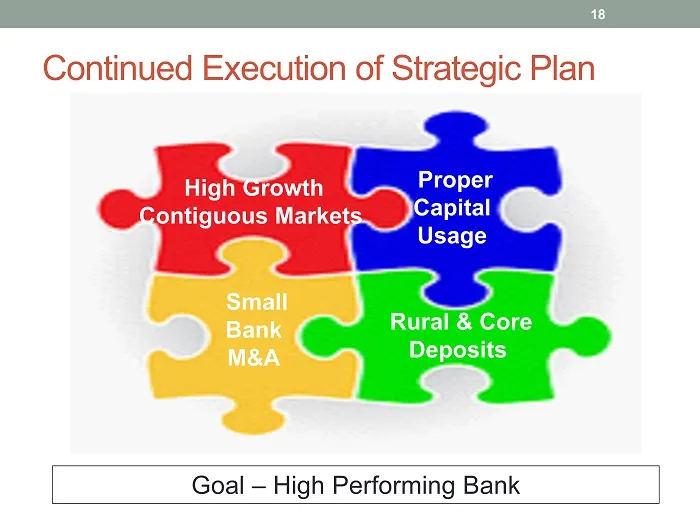
Continued Execution of Strategic Plan High Growth Contiguous Markets Small Bank M&A Rural & Core Deposits Proper Capital Usage Goal – High Performing Bank 18
Slide 19: Diverse Footprint
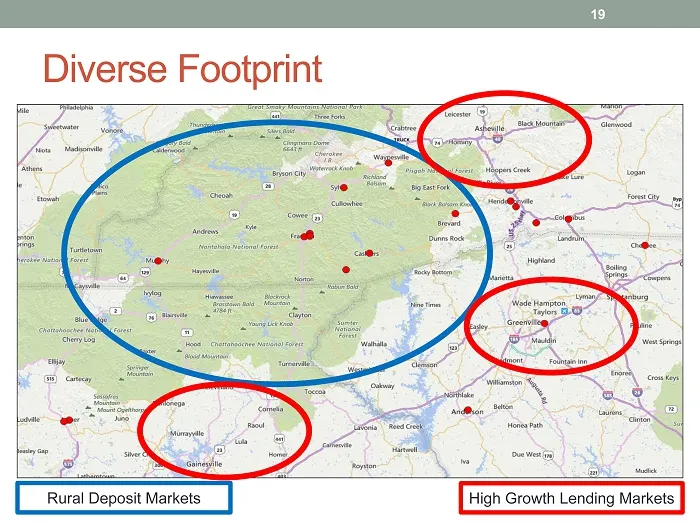
Diverse Footprint 19 Rural Deposit Markets High Growth Lending Markets
Slide 20: Proper Capital Usage
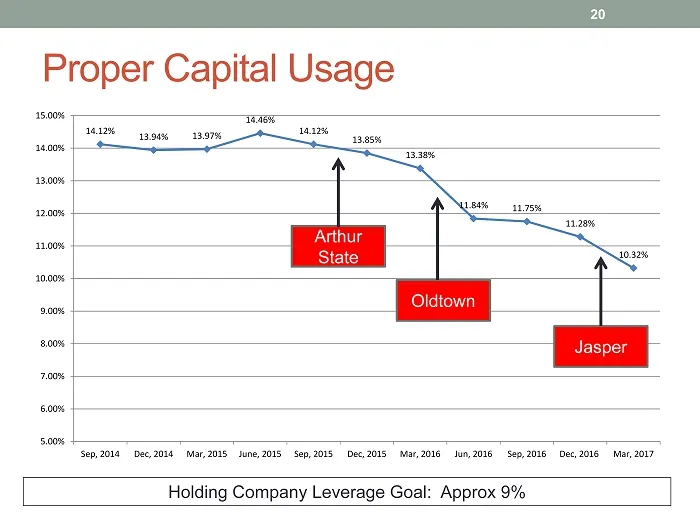
14.12% 13.94% 13.97% 14.46% 14.12% 13.85% 13.38% 11.84% 11.75% 11.28% 10.32% 5.00% 6.00% 7.00% 8.00% 9.00% 10.00% 11.00% 12.00% 13.00% 14.00% 15.00% Sep, 2014 Dec, 2014 Mar, 2015 June, 2015 Sep, 2015 Dec, 2015 Mar, 2016 Jun, 2016 Sep, 2016 Dec, 2016 Mar, 2017 Proper Capital Usage Holding Company Lev
Slide 21: Disciplined Acquisitions
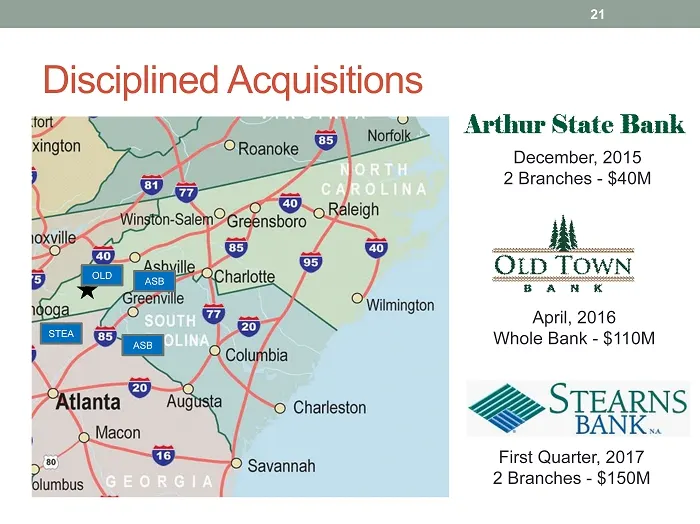
Disciplined Acquisitions December, 2015 2 Branches - $40M April, 2016 Whole Bank - $110M First Quarter, 2017 2 Branches - $150M 21 ASB ASB OLD STEA
Slide 22: Strategic De Novo Activity
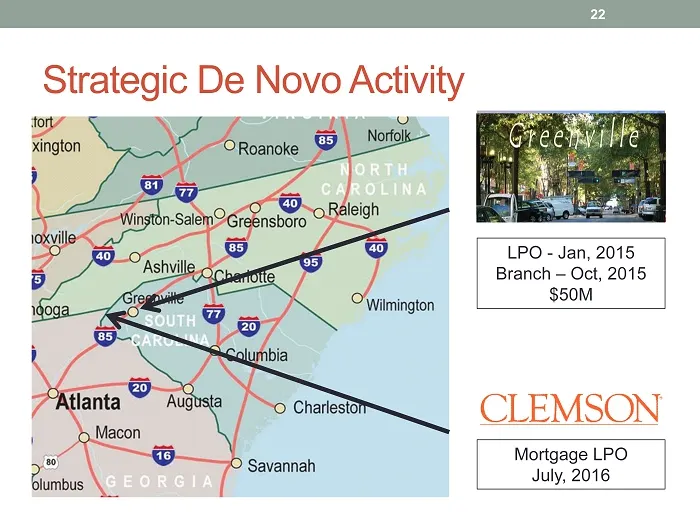
Strategic De Novo Activity Mortgage LPO July, 2016 LPO - Jan, 2015 Branch – Oct, 2015 $50M 22
Slide 23: Financial Overview
Financial Overview 23
Slide 24: Bank Capital Ratios
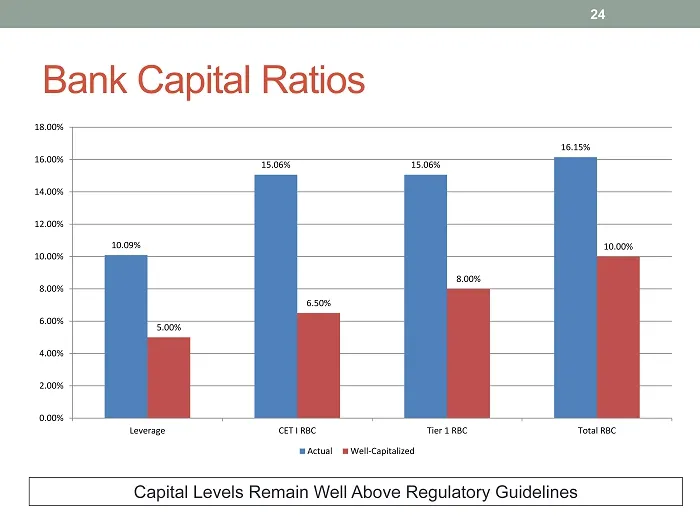
Bank Capital Ratios Capital Levels Remain Well Above Regulatory Guidelines 24 10.09% 15.06% 15.06% 16.15% 5.00% 6.50% 8.00% 10.00% 0.00% 2.00% 4.00% 6.00% 8.00% 10.00% 12.00% 14.00% 16.00% 18.00% Leverage CET I RBC Tier 1 RBC Total RBC Actual Well-Capitalized
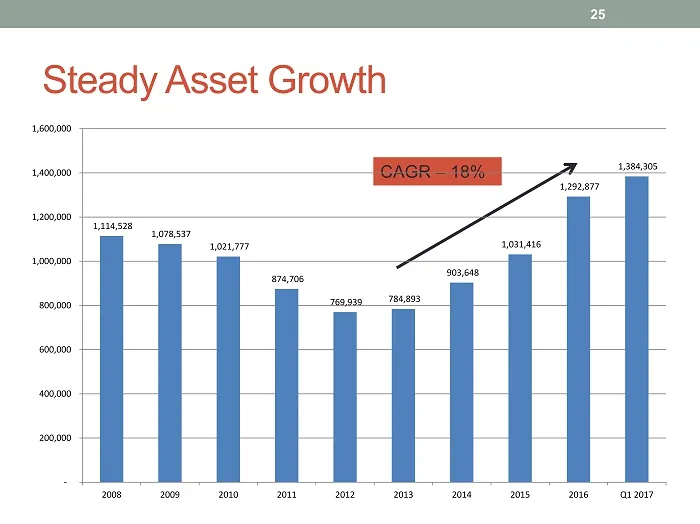
Slide 25: Steady Asset Growth
Steady Asset Growth CAGR – 18% 25 1,114,528 1,078,537 1,021,777 874,706 769,939 784,893 903,648 1,031,416 1,292,877 1,384,305 - 200,000 400,000 600,000 800,000 1,000,000 1,200,000 1,400,000 1,600,000 2008 2009 2010 2011 2012 2013 2014 2015 2016 Q1 2017
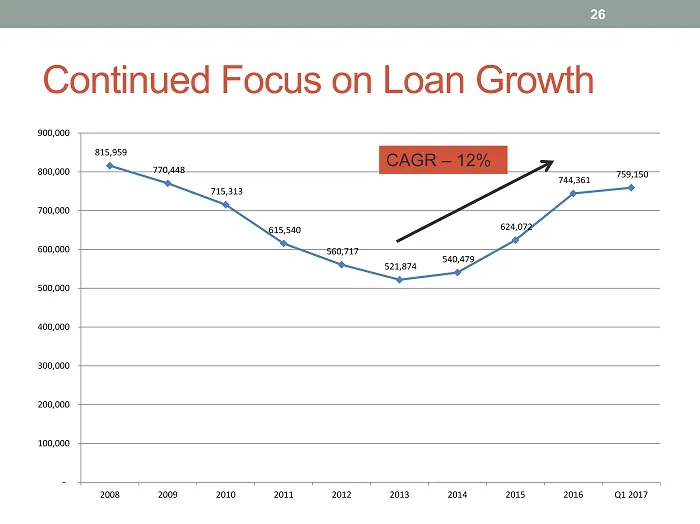
Slide 26: Continued Focus on Loan Growth
815,959 770,448 715,313 615,540 560,717 521,874 540,479 624,072 744,361 759,150 - 100,000 200,000 300,000 400,000 500,000 600,000 700,000 800,000 900,000 2008 2009 2010 2011 2012 2013 2014 2015 2016 Q1 2017 Continued Focus on Loan Growth CAGR – 12% 26
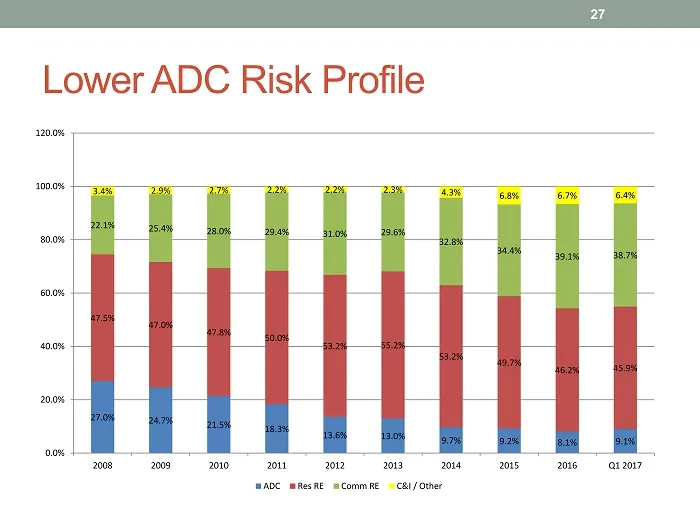
Slide 27: Lower ADC Risk Profile
Lower ADC Risk Profile 27 27.0% 24.7% 21.5% 18.3% 13.6% 13.0% 9.7% 9.2% 8.1% 9.1% 47.5% 47.0% 47.8% 50.0% 53.2% 55.2% 53.2% 49.7% 46.2% 45.9% 22.1% 25.4% 28.0% 29.4% 31.0% 29.6% 32.8% 34.4% 39.1% 38.7% 3.4% 2.9% 2.7% 2.2% 2.2% 2.3% 4.3% 6.8% 6.7% 6.4% 0.0% 20.0% 40.0% 60.0% 80.0% 100.0% 120.0% 2008
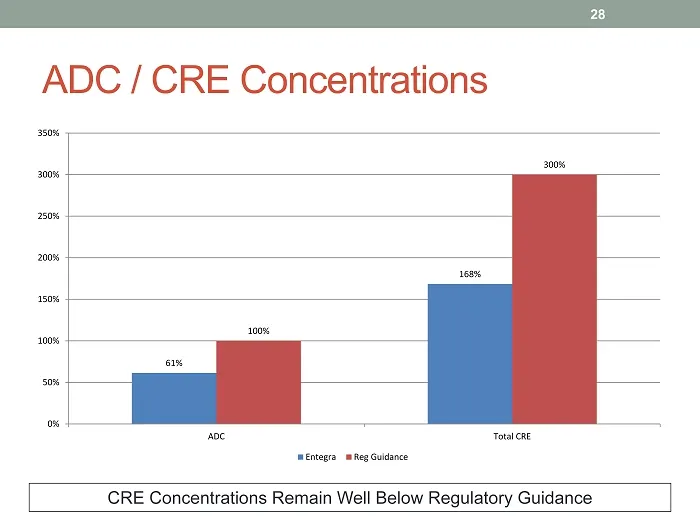
Slide 28: ADC / CRE Concentrations
ADC / CRE Concentrations CRE Concentrations Remain Well Below Regulatory Guidance 28 61% 168% 100% 300% 0% 50% 100% 150% 200% 250% 300% 350% ADC Total CRE Entegra Reg Guidance
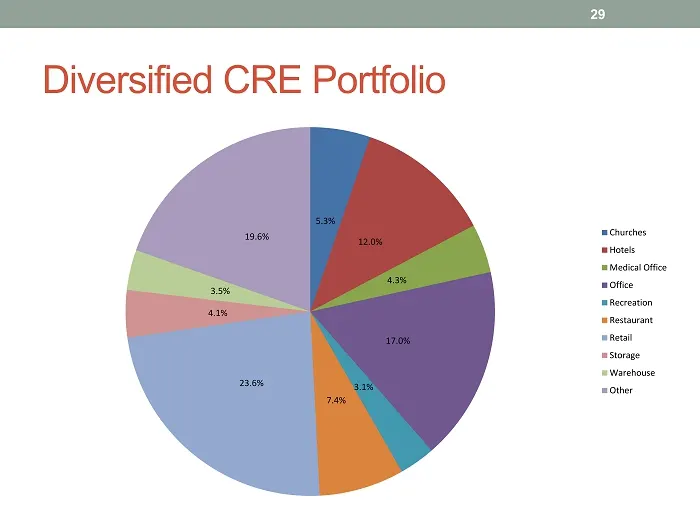
Slide 29: Diversified CRE Portfolio
Diversified CRE Portfolio 29 5.3% 12.0% 4.3% 17.0% 3.1% 7.4% 23.6% 4.1% 3.5% 19.6% Churches Hotels Medical Office Office Recreation Restaurant Retail Storage Warehouse Other
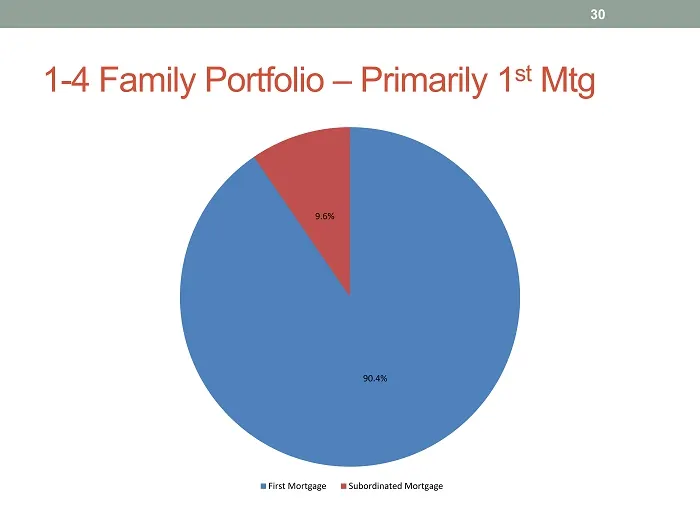
Slide 30: Family Portfolio
1 - 4 Family Portfolio – Primarily 1 st Mtg 30 90.4% 9.6% First Mortgage Subordinated Mortgage
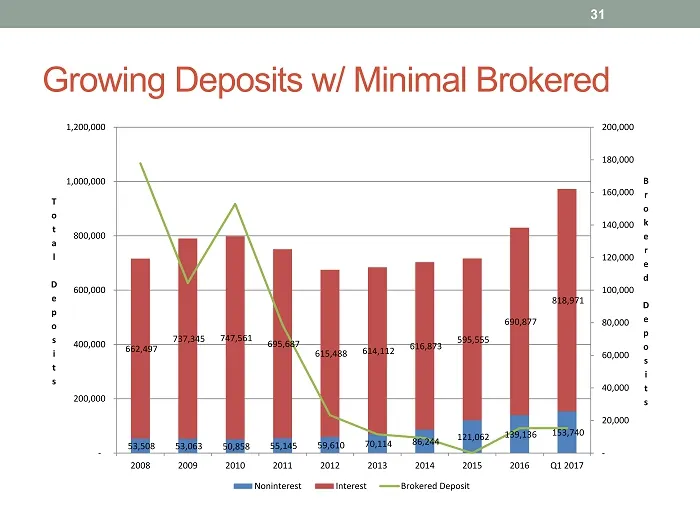
Slide 31: Growing Deposits w/ Minimal Brokered
Growing Deposits w / Minimal Brokered 31 53,508 53,063 50,858 55,145 59,610 70,114 86,244 121,062 139,136 153,740 662,497 737,345 747,561 695,687 615,488 614,112 616,873 595,555 690,877 818,971 - 20,000 40,000 60,000 80,000 100,000 120,000 140,000 160,000 180,000 200,000 - 200,000 400,000 600,000 80
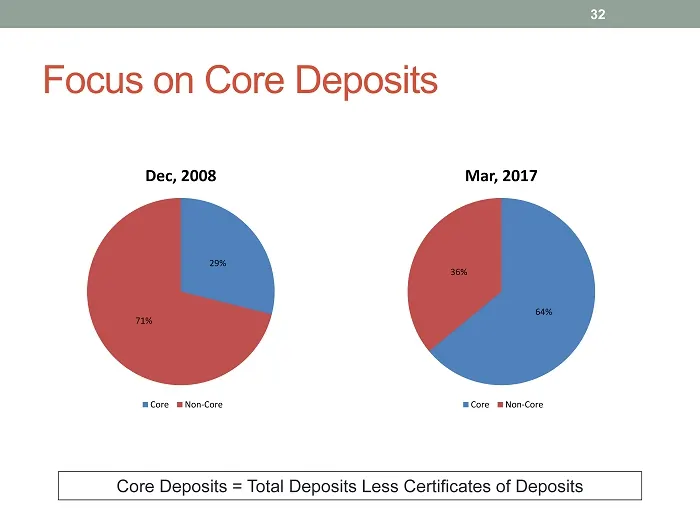
Slide 32: Focus on Core Deposits
Focus on Core Deposits Core Deposits = Total Deposits Less Certificates of Deposits 29% 71% Dec, 2008 Core Non-Core 32 64% 36% Mar, 2017 Core Non-Core
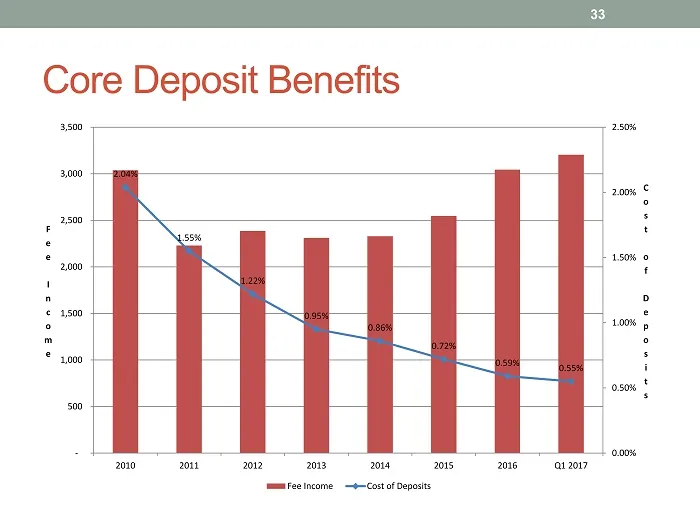
Slide 33: Core Deposit Benefits
Core Deposit Benefits 33 2.04% 1.55% 1.22% 0.95% 0.86% 0.72% 0.59% 0.55% 0.00% 0.50% 1.00% 1.50% 2.00% 2.50% - 500 1,000 1,500 2,000 2,500 3,000 3,500 2010 2011 2012 2013 2014 2015 2016 Q1 2017 C o s t o f D e p o s i t s F e e I n c o m e Fee Income Cost of Deposits
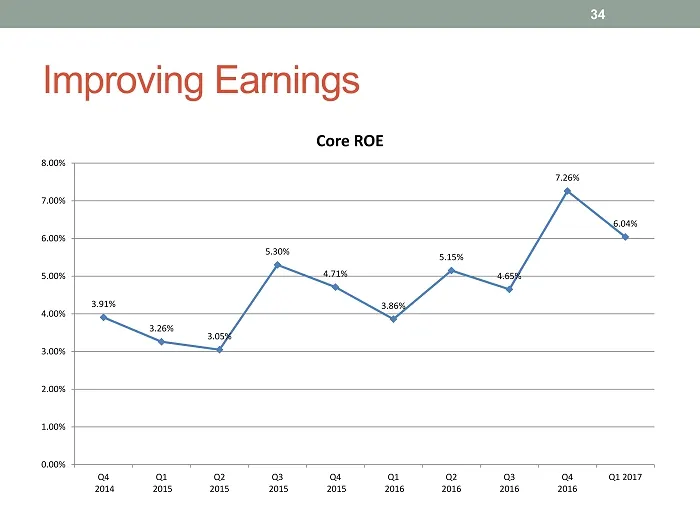
Slide 34: Improving Earnings
Improving Earnings 34 3.91% 3.26% 3.05% 5.30% 4.71% 3.86% 5.15% 4.65% 7.26% 6.04% 0.00% 1.00% 2.00% 3.00% 4.00% 5.00% 6.00% 7.00% 8.00% Q4 2014 Q1 2015 Q2 2015 Q3 2015 Q4 2015 Q1 2016 Q2 2016 Q3 2016 Q4 2016 Q1 2017 Core ROE
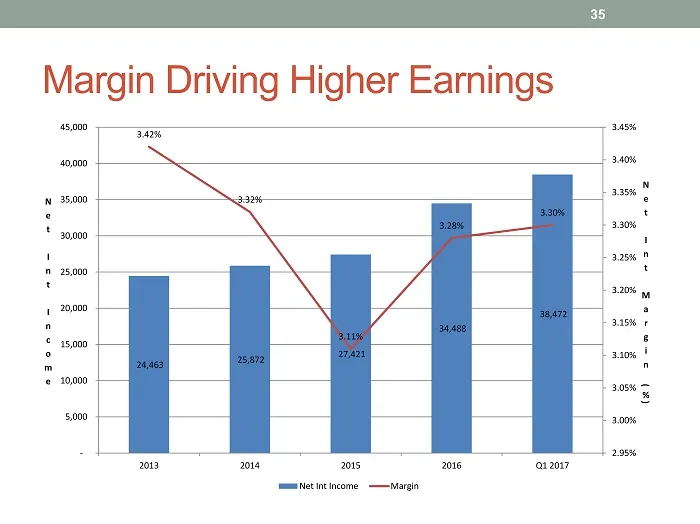
Slide 35: Margin Driving Higher Earnings
Margin Driving Higher Earnings 35 24,463 25,872 27,421 34,488 38,472 3.42% 3.32% 3.11% 3.28% 3.30% 2.95% 3.00% 3.05% 3.10% 3.15% 3.20% 3.25% 3.30% 3.35% 3.40% 3.45% - 5,000 10,000 15,000 20,000 25,000 30,000 35,000 40,000 45,000 2013 2014 2015 2016 Q1 2017 N e t I n t M a r g i n ( % ) N e t I n t I
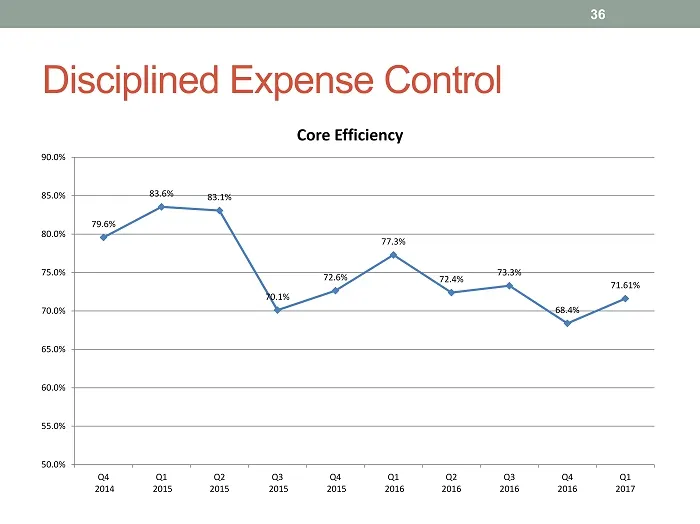
Slide 36: Disciplined Expense Control
Disciplined Expense Control 36 79.6% 83.6% 83.1% 70.1% 72.6% 77.3% 72.4% 73.3% 68.4% 71.61% 50.0% 55.0% 60.0% 65.0% 70.0% 75.0% 80.0% 85.0% 90.0% Q4 2014 Q1 2015 Q2 2015 Q3 2015 Q4 2015 Q1 2016 Q2 2016 Q3 2016 Q4 2016 Q1 2017 Core Efficiency
Slide 37: Credit Losses Continue to Decline
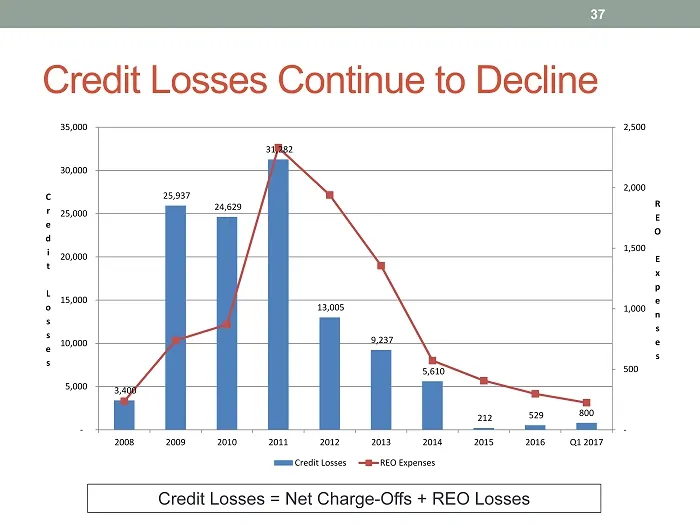
Credit Losses Continue to Decline Credit Losses = Net Charge - Offs + REO Losses 37 3,400 25,937 24,629 31,282 13,005 9,237 5,610 212 529 800 - 500 1,000 1,500 2,000 2,500 - 5,000 10,000 15,000 20,000 25,000 30,000 35,000 2008 2009 2010 2011 2012 2013 2014 2015 2016 Q1 2017 R E O E x p e n s e s C r
Slide 38: Problem Assets Are Shrinking
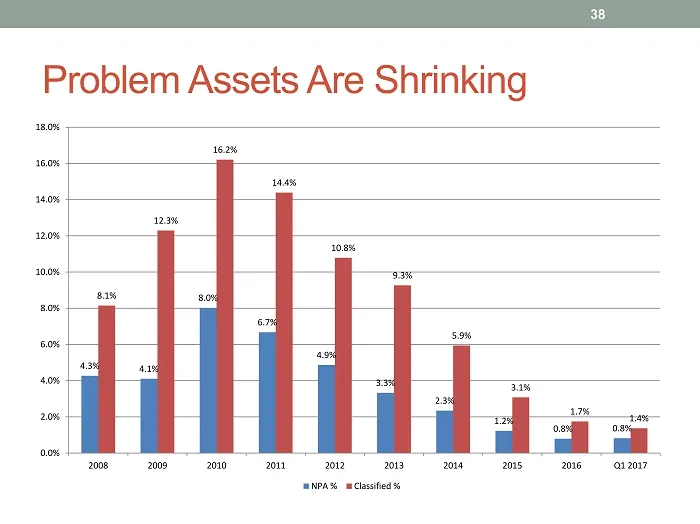
Problem Assets Are Shrinking 38 4.3% 4.1% 8.0% 6.7% 4.9% 3.3% 2.3% 1.2% 0.8% 0.8% 8.1% 12.3% 16.2% 14.4% 10.8% 9.3% 5.9% 3.1% 1.7% 1.4% 0.0% 2.0% 4.0% 6.0% 8.0% 10.0% 12.0% 14.0% 16.0% 18.0% 2008 2009 2010 2011 2012 2013 2014 2015 2016 Q1 2017 NPA % Classified %
Slide 39: Continued Growth in Mortgage Banking
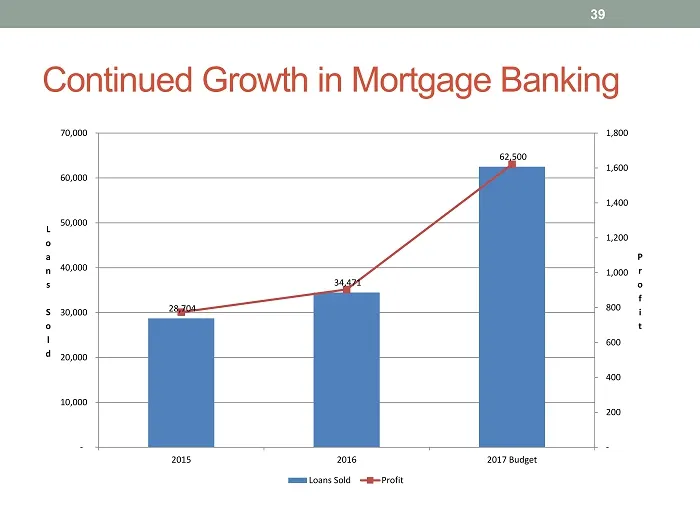
Continued Growth in Mortgage Banking 39 28,704 34,471 62,500 - 200 400 600 800 1,000 1,200 1,400 1,600 1,800 - 10,000 20,000 30,000 40,000 50,000 60,000 70,000 2015 2016 2017 Budget P r o f i t L o a n s S o l d Loans Sold Profit
Slide 40: Summary
Summary 40
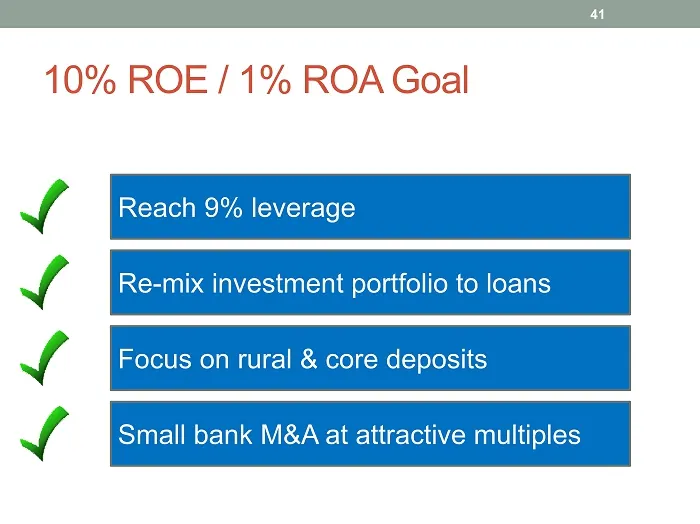
Slide 41: 10% ROE / 1% ROA Goal
10% ROE / 1% ROA Goal 41 Reach 9 % leverage Re - mix investment portfolio to loans F ocus on rural & core deposits Small bank M&A at attractive multiples
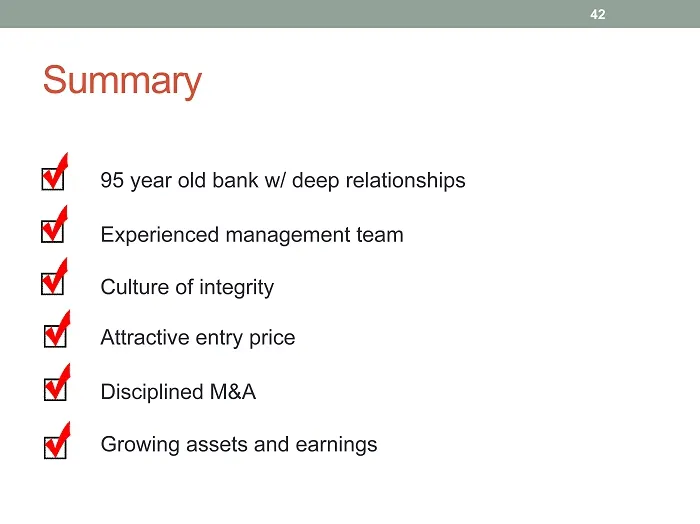
Slide 42: Summary
Summary 95 year o ld bank w/ deep relationships Experienced management team Culture of integrity Attractive entry price Disciplined M&A Growing assets and earnings 42
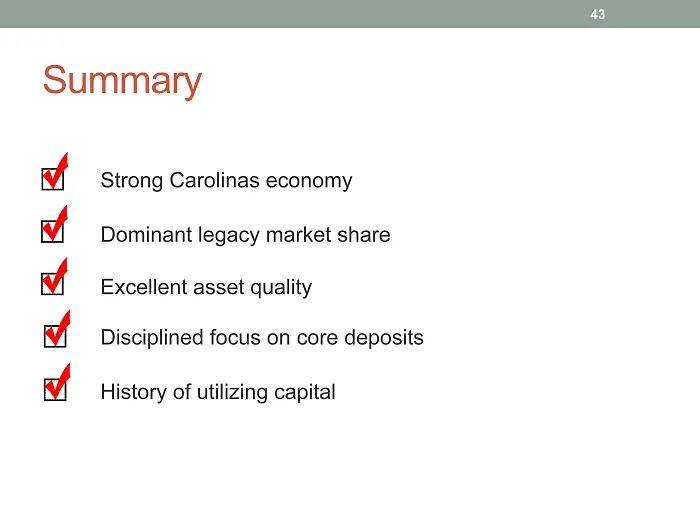
Slide 43: Summary
Summary Strong Carolinas economy Dominant legacy market share Excellent asset quality Disciplined focus on core deposits History of utilizing capital 43
Slide 44: GAAP Appendix
GAAP Appendix 44
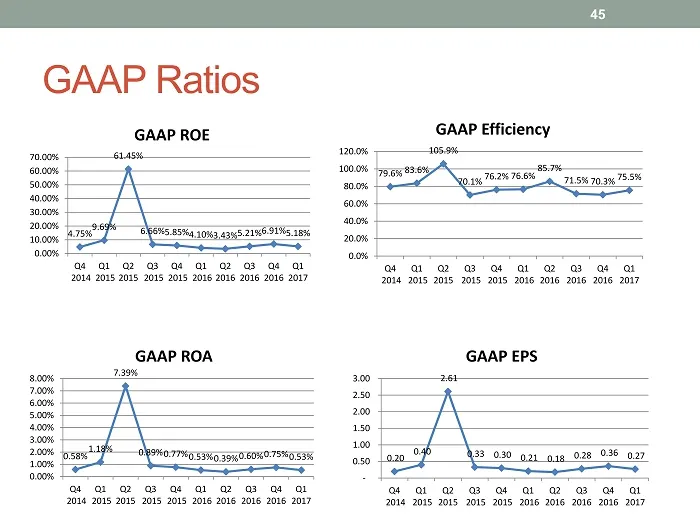
Slide 45: GAAP Ratios
GAAP Ratios 45 4.75% 9.69% 61.45% 6.66% 5.85% 4.10% 3.43% 5.21% 6.91% 5.18% 0.00% 10.00% 20.00% 30.00% 40.00% 50.00% 60.00% 70.00% Q4 2014 Q1 2015 Q2 2015 Q3 2015 Q4 2015 Q1 2016 Q2 2016 Q3 2016 Q4 2016 Q1 2017 GAAP ROE 79.6% 83.6% 105.9% 70.1% 76.2% 76.6% 85.7% 71.5% 70.3% 75.5% 0.0% 20.0% 40.0% 60
Source: SEC EDGAR · 8-K filed May 19, 2017
More decks from Entegra Financial Corp
 Merger or Acquisition (February 2019)21 slides · Feb 6, 2019
 Q4 2018 Earnings Presentation17 slides · Jan 24, 2019
 Merger or Acquisition (January 2019)25 slides · Jan 16, 2019
 Q3 2018 Earnings Presentation14 slides · Oct 18, 2018
 Investor Presentation (September 2018)48 slides · Sep 17, 2018
 Q2 2018 Earnings Presentation10 slides · Jul 19, 2018