Railamerica — Q4 2005 Earnings Presentation
15 slides from Railamerica's earnings presentation, Feb 15, 2006
Slide 1: RailAmerica, Inc. Fourth Quarter 2005 Financial Results
RailAmerica, Inc. Fourth Quarter 2005 Financial Results February 15, 2006
Slide 2: Forward-Looking Statements and Forecasts
Forward-Looking Statements and Forecasts This presentation contains forward-looking statements, forecasts, and information regarding future events and the future performance of RailAmerica, Inc. ("RailAmerica" or the "Company") that involve risks and uncertainties that could cause actual results and
Slide 3: Charles Swinburn, Chief Executive Officer
Charles Swinburn Chief Executive Officer
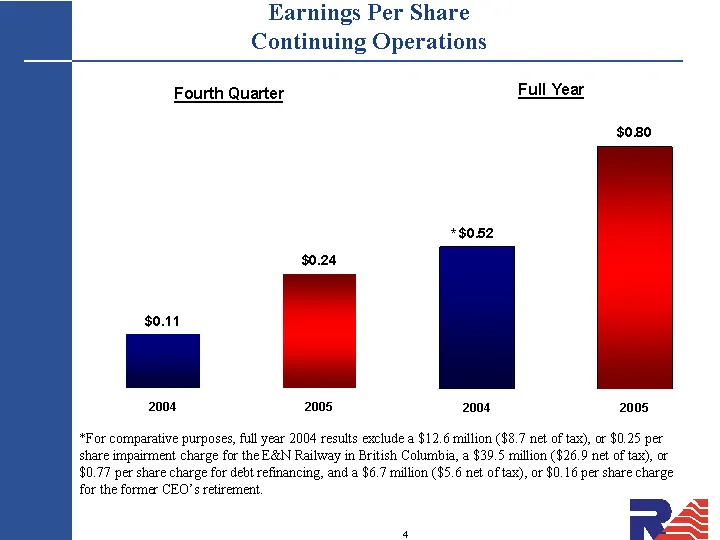
Slide 4: Earnings Per Share Continuing Operations
Earnings Per Share Continuing Operations *For comparative purposes, full year 2004 results exclude a $12.6 million ($8.7 net of tax), or $0.25 per share impairment charge for the E&N Railway in British Columbia, a $39.5 million ($26.9 net of tax), or $0.77 per share charge for debt refinancing, and
Slide 5: Acquisitions and Divestitures
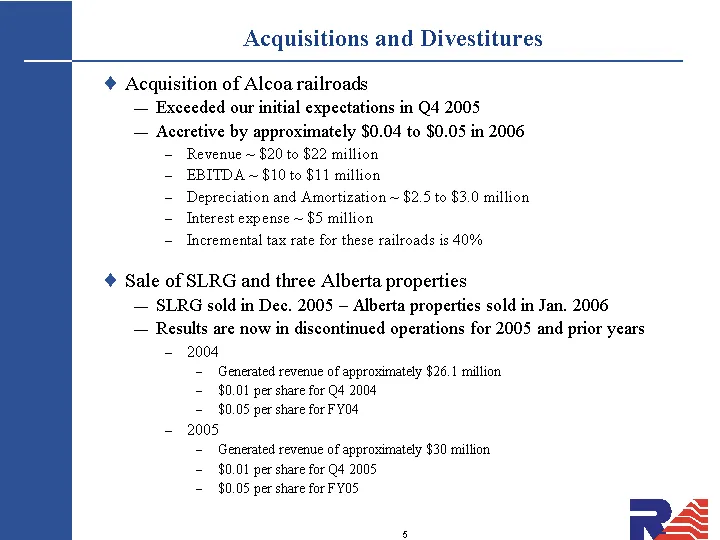
Acquisitions and Divestitures Acquisition of Alcoa railroads Exceeded our initial expectations in Q4 2005 Accretive by approximately $0.04 to $0.05 in 2006 Revenue ~ $20 to $22 million EBITDA ~ $10 to $11 million Depreciation and Amortization ~ $2.5 to $3.0 million Interest expense ~ $5 million Incr
Slide 6: Personal Injury Frequency Ratio
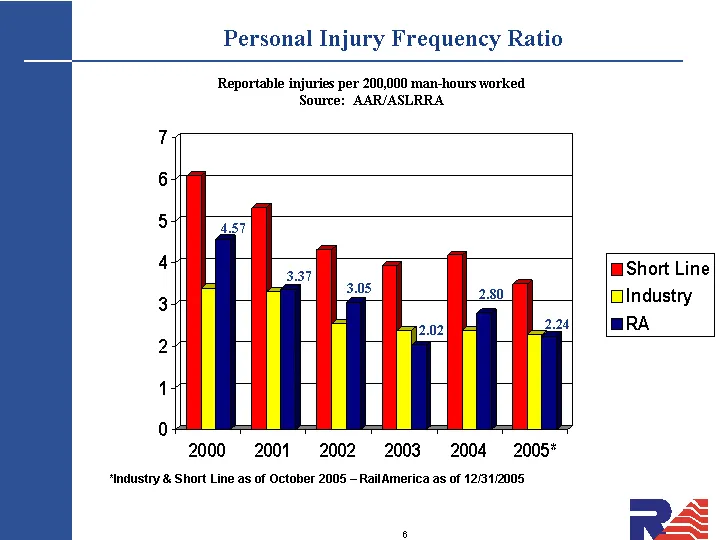
Personal Injury Frequency Ratio 2000 2001 2002 2003 2004 2005* Short Line 6.08 5.32 4.32 3.93 4.19 3.49 Industry 3.39 3.3 2.54 2.37 2.38 2.28 RA 4.57 3.37 3.05 2.02 2.8 2.24 *Industry & Short Line as of October 2005 - RailAmerica as of 12/31/2005 3.05 2.02 2.80 2.24 Reportable injuries per 200,000 m
Slide 7: Michael Howe, Executive Vice President and Chief Financial Officer
Michael Howe Executive Vice President and Chief Financial Officer
Slide 8: Income Statement
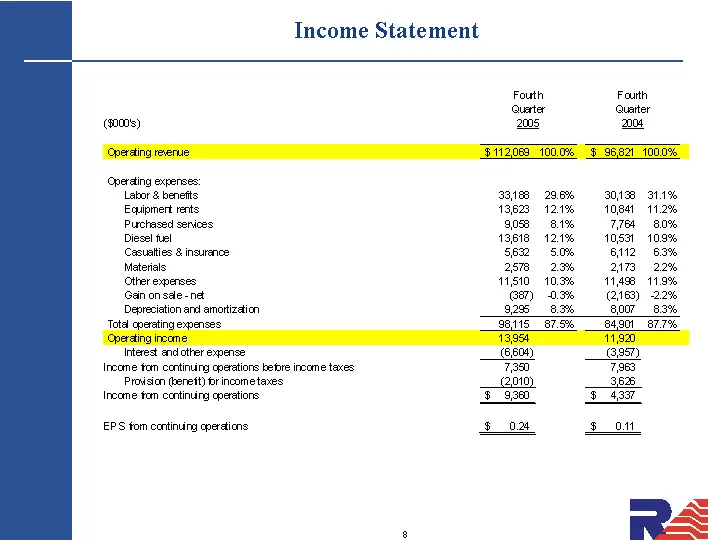
Income Statement (goons) Operating expenses: Labor & henefts Equipmert rents Purchased senices Diese! te! Casuatties & insurance Materials Other expenses Gain an sde-net Depreciation ard amortization Tote cperating expences Interest endother expense Income fem continuing cperations before income tax
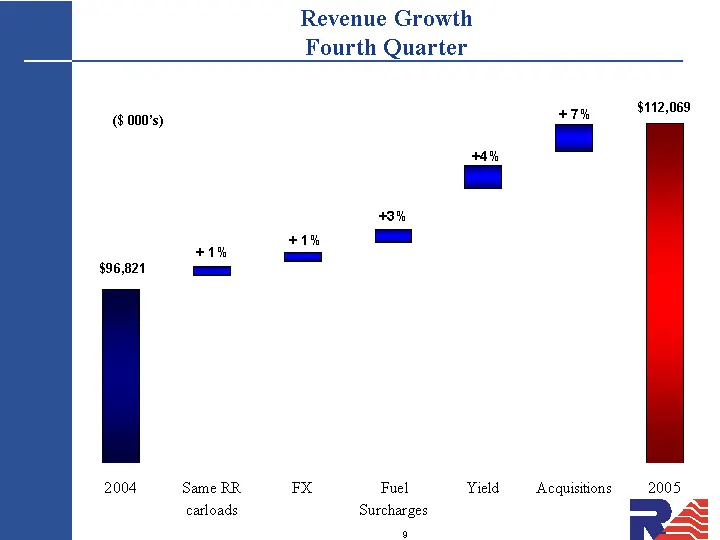
Slide 9: Revenue Growth Fourth Quarter
Revenue Growth Fourth Quarter + 1% + 1% +4% + 7% +3% ($ 000's) 2004 Same RR carloads FX Fuel Surcharges Yield Acquisitions 2005 X 94000 95500 97000 99000 105000 109000 112069 Y 1000 1000 1500 2500 3000
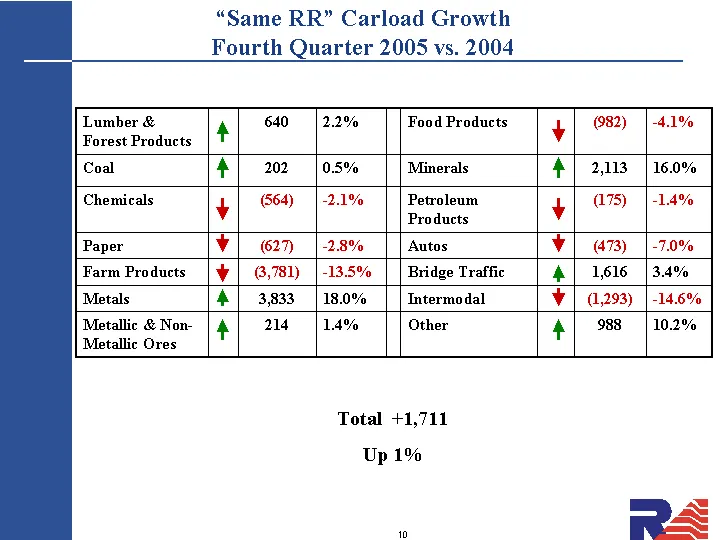
Slide 10: "Same RR" Carload Growth Fourth Quarter 2005 vs. 2004
"Same RR" Carload Growth Fourth Quarter 2005 vs. 2004 Total +1,711 Up 1% Lumber & Forest Products 640 2.2% Food Products (982) -4.1% Coal 202 0.5% Minerals 2,113 16.0% Chemicals (564) -2.1% Petroleum Products (175) -1.4% Paper (627) -2.8% Autos (473) -7.0% Farm Products (3,781) -13.5% Bridge Traffic
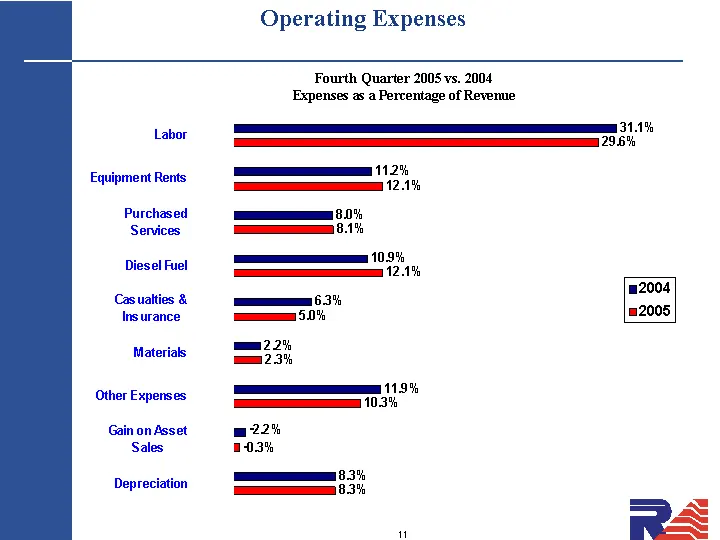
Slide 11: Operating Expenses as a Percentage of Revenue
Operating Expenses Depreciation Gain on Asset Sales Other Expenses Materials Casualties & Insurance Diesel Fuel Purchased Services Equipment Rents Labor 2005 0.083 0.005 0.103 0.023 0.05 0.121 0.081 0.121 0.296 2004 0.083 0.01 0.119 0.022 0.063 0.109 0.08 0.112 0.311 Fourth Quarter 2005 vs. 2004 Exp
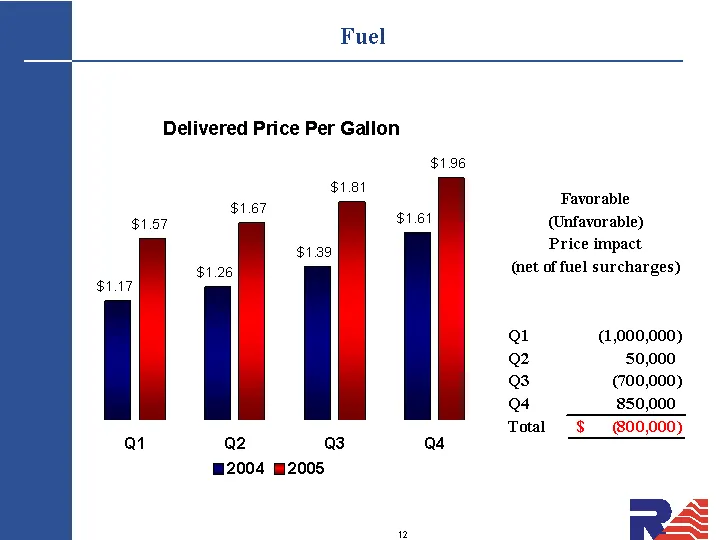
Slide 12: Fuel
Fuel Q1 Q2 Q3 Q4 2004 1.17 1.26 1.39 1.61 2005 1.57 1.67 1.81 1.96
Slide 13: Capital Structure: Net Debt-to-Capital
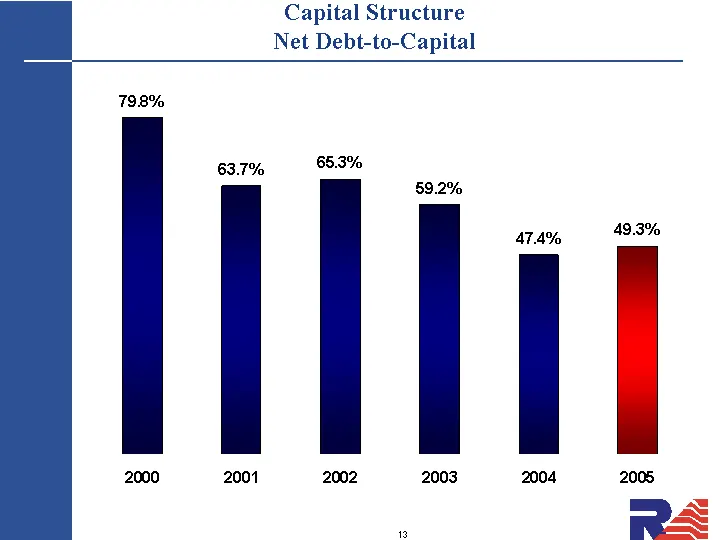
Capital Structure Net Debt-to-Capital 2000 2001 2002 2003 2004 2005 Net Debt to Capital 0.798 0.637 0.653 0.592 0.474 0.493
Slide 14: Charles Swinburn, Chief Executive Officer
Charles Swinburn Chief Executive Officer
Slide 15: Closing Comments
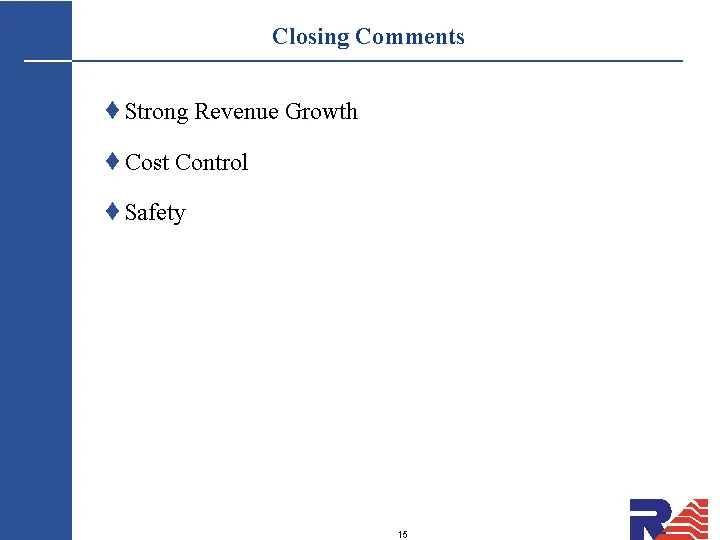
Closing Comments Strong Revenue Growth Cost Control Safety
Source: SEC EDGAR · 8-K filed Feb 15, 2006
More decks from Railamerica Inc
 Q2 2012 Earnings Presentation25 slides · Jul 25, 2012
 Q1 2012 Earnings Presentation29 slides · Apr 26, 2012
 Q4 2011 Earnings Presentation33 slides · Feb 9, 2012
 Q3 2011 Earnings Presentation28 slides · Oct 26, 2011
 Q2 2011 Earnings Presentation27 slides · Jul 28, 2011
 Q1 2011 Earnings Presentation28 slides · Apr 28, 2011