Allegheny Energy — Citigroup Conference June 7-8, 2010
56 slides from Allegheny Energy's conference presentation, Jun 7, 2010
Slide 1: Citigroup Conference, June 7-8, 2010
Citigroup Conference June 7-8, 2010 Exhibit 99.1
Slide 2: Table of Contents
Table of Contents Page Page I. COMPANY OVERVIEW V. OUTLOOK Primary businesses Merchant generation formulas Service area Outlook: Consolidated Overview Outlook: Merchant generation 40-45 Quality and costs 9-11 Outlook: Utility operations Business units Outlook: Transmission expansion Outlook: Depreci

Slide 3: Non-GAAP Financial Measures
Non-GAAP Financial Measures This presentation includes non-GAAP financial measures as defined in the Securities and Exchange Commission’s Regulation G. Where noted, the presentation shows certain financial information on an “as adjusted” basis, to exclude the effect of certain items as described her
Slide 4: Primary Businesses
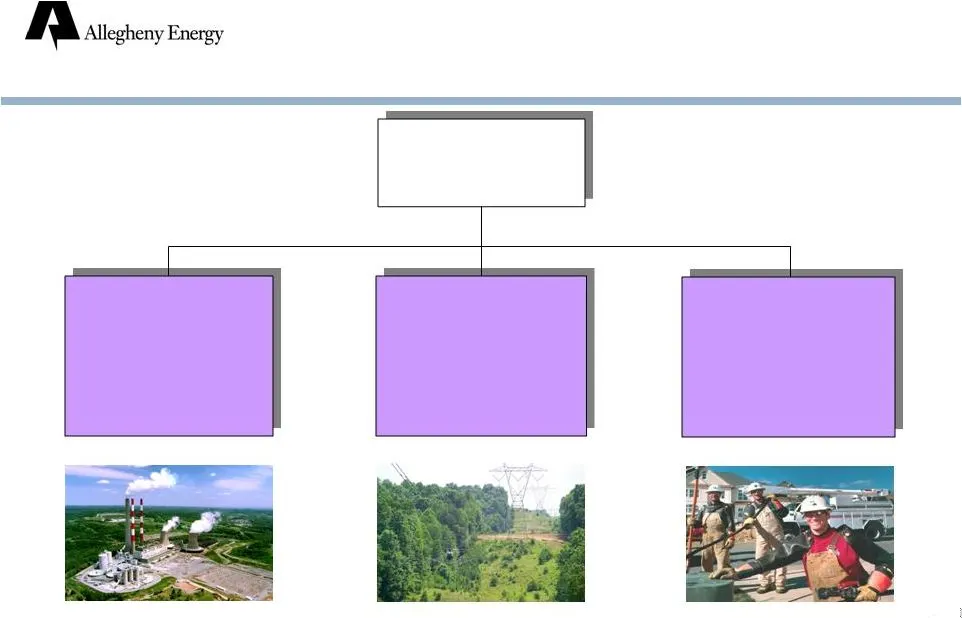
Merchant Generation Transmission Expansion Utility Operations Primary Businesses Output for 12 months ended December 31, 2009. Customers include about 102,000 customers in VA. Sale of VA distribution operations was completed on June 1, 2010. Allegheny Energy Coal-fired, PJM 26.0 million MWH TrAIL, P
Slide 5: Service Area and Generation Facilities
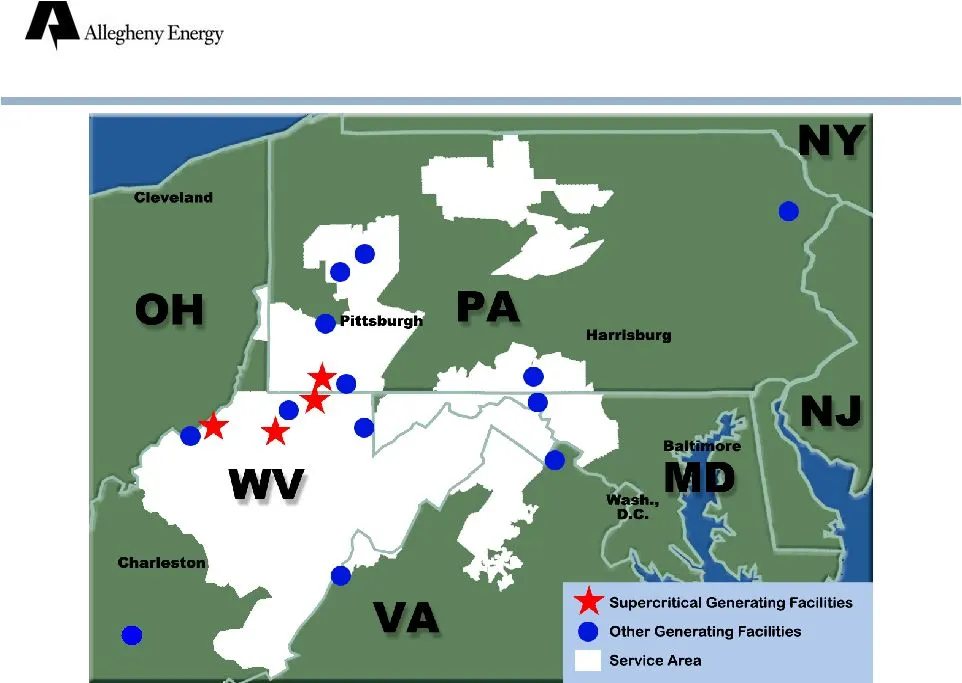
Service Area and Generation Facilities

Slide 6: Focused on quality and costs
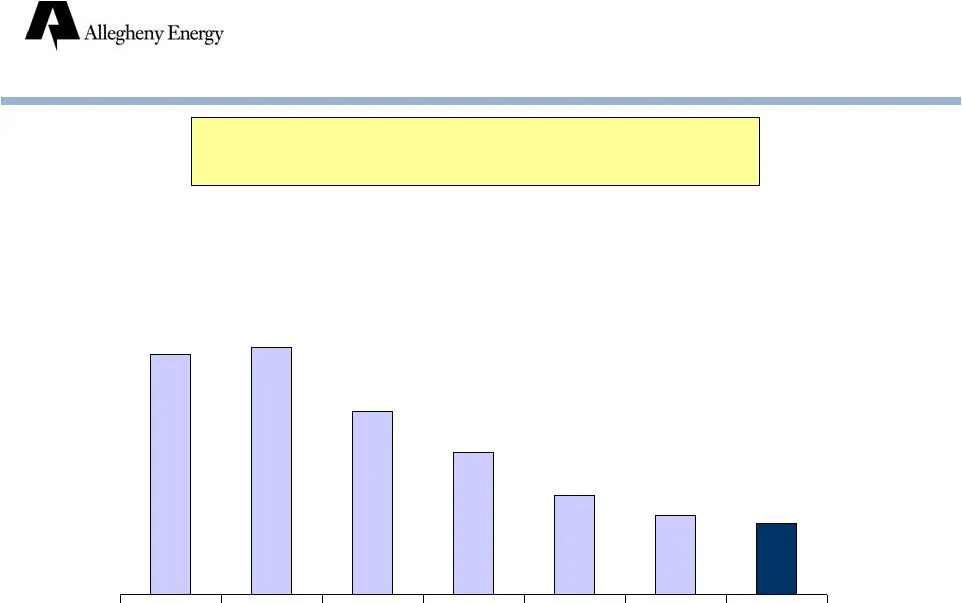
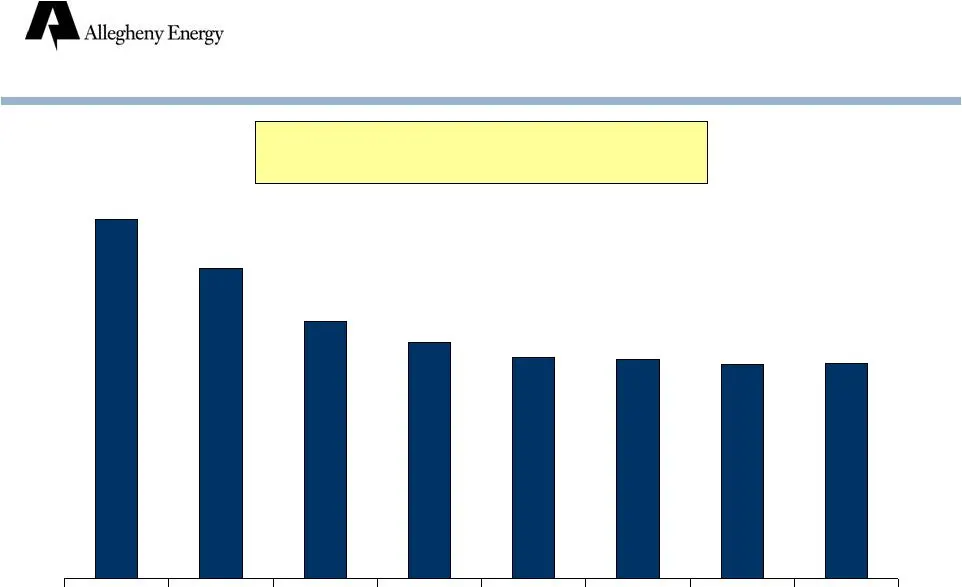
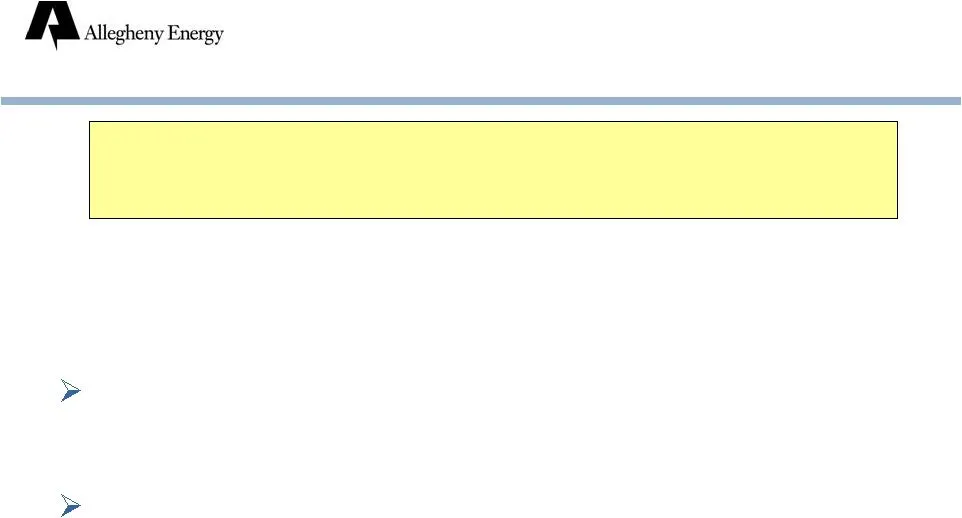
Focused on quality and costs Merchant generation well-positioned for a recovering economy Growing rate base in transmission and utility businesses Merger with FirstEnergy scheduled for completion in first half 2011 Overview
Slide 7
Slide 8
Slide 9
Slide 10: Business Units
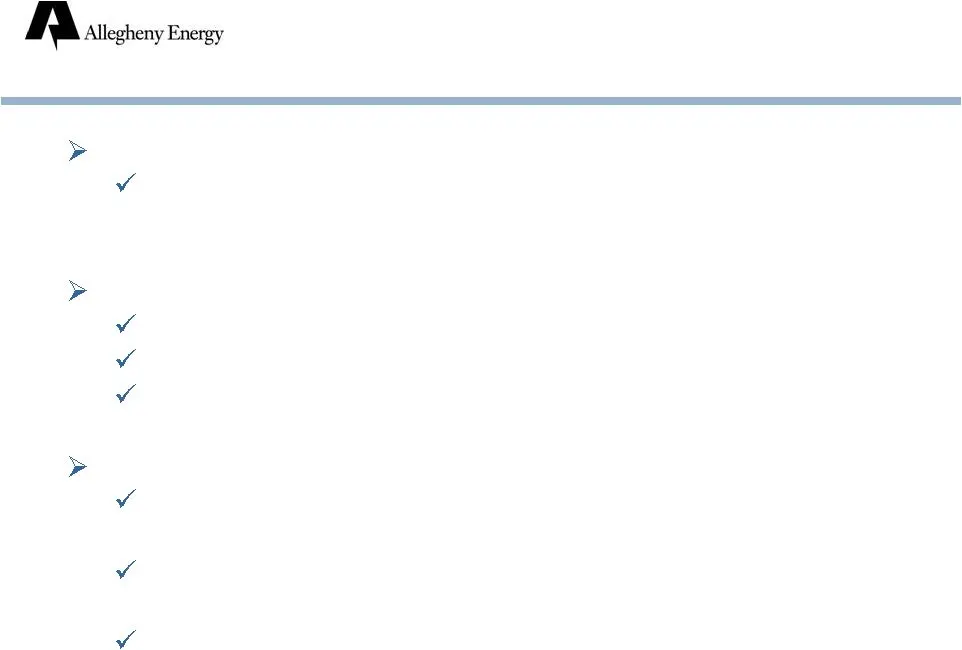
Merchant generation Unregulated generation (primarily Allegheny Energy Supply, LLC) Transmission expansion TrAIL PATH PJM transmission reliability projects Utility operations Monongahela Power (WV) - transmission, distribution, generation Potomac Edison (WV, MD, VA) - transmission, distribution West
Slide 11: Merchant Generation: Overview
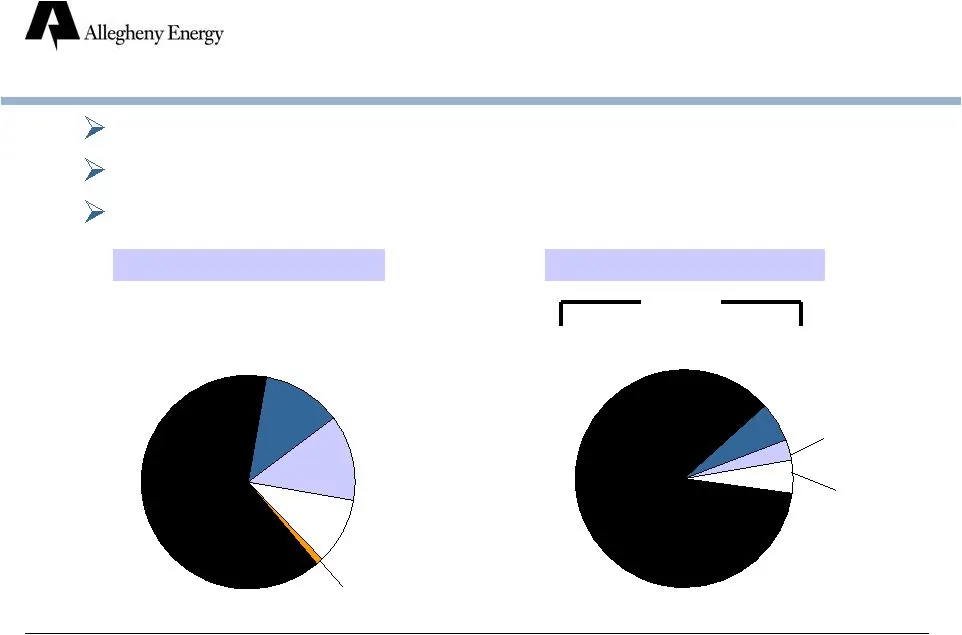
Merchant Generation: Overview Capacity (MW)* * Capacity as of December 31, 2009. Output for 12 months ended December 31, 2009. Capacity: over 7,000 MW* Primarily base load coal-fired plants Located in PJM (13 states) Output (MWH)* Hydro 10% Gas 13% Supercritical Coal 64% Other Coal 12% Oil 1% Superc
Slide 12: Merchant Generation: Spot Power Prices
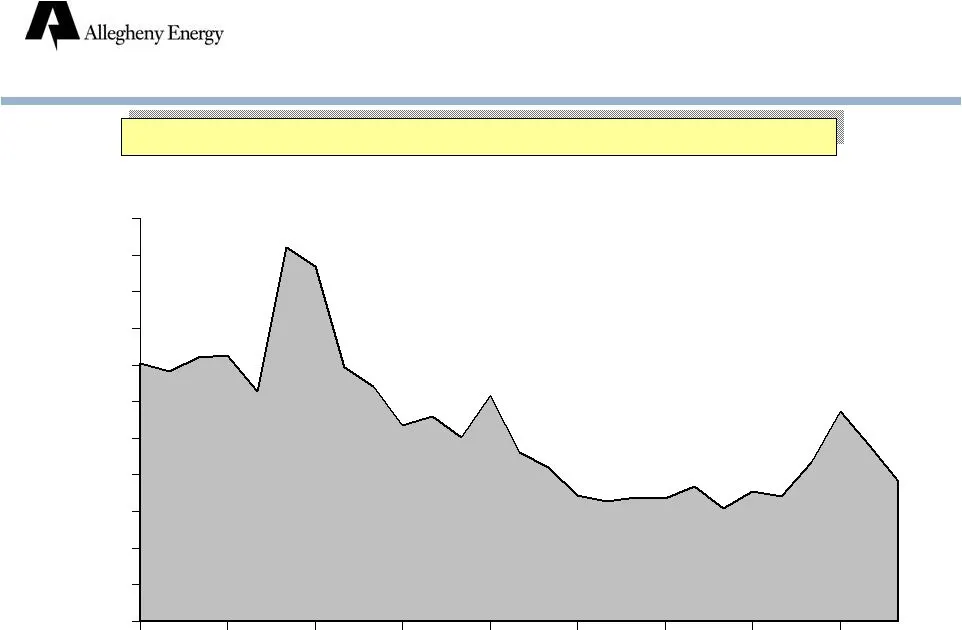
Merchant Generation: Spot Power Prices PJM Western Hub ($/MWH round-the-clock) Jan. June Dec. June Dec. Mar. $0 $10 $20 $30 $40 $50 $60 $70 $80 $90 $100 $110 Spot prices have decreased sharply since June 2008.
Slide 13: Merchant Generation: Forward Power Prices
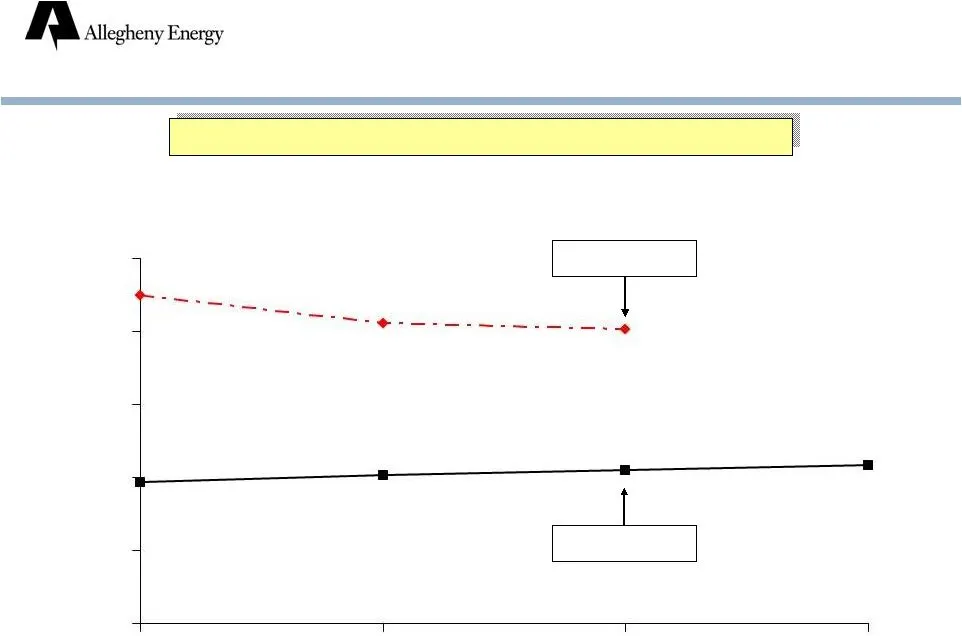
Merchant Generation: Forward Power Prices PJM Western Hub ($/MWH round-the-clock) June 2008 March 2010 $0 $20 $40 $60 $80 $100 2011 forward prices have decreased by nearly 50%.
Slide 14: PJM Western Hub, AYE Plants and AEP-Dayton Hub
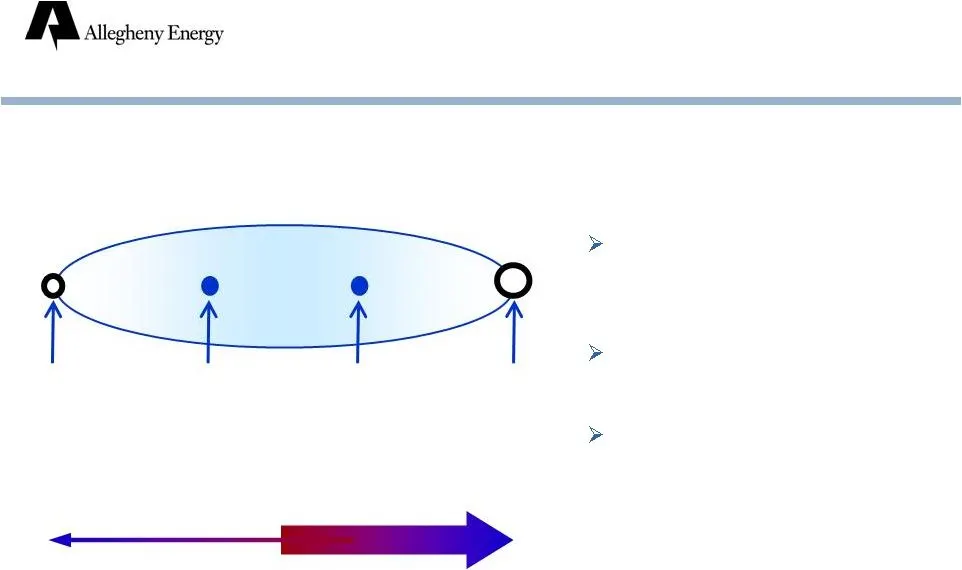
AEP Dayton Hub APS Zone PJM W. Hub AYE Generator Nodes Transmission Less Congestion More Congestion Each plant sells all its output at its generator node price in PJM energy market APS Zone: legacy retail customer base Due to transmission congestion, plants’ realized energy prices tend to be closer
Slide 15: MA aieztexy E0027
MA aieztexy E0027 > > >
Slide 16: Forward Prices and Basis Differentials
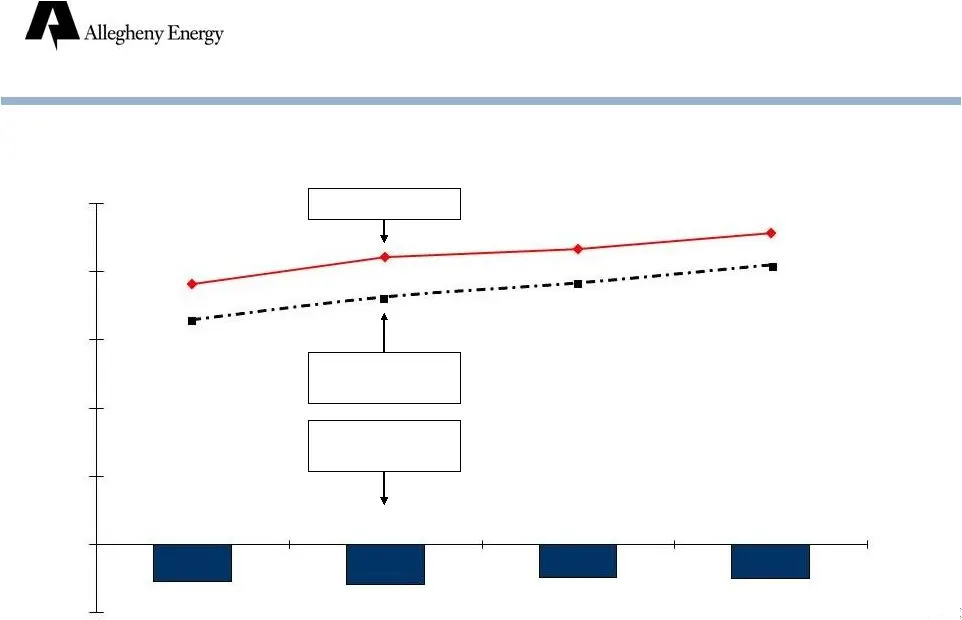
As of March 31, 2010 $ per MWH, round-the-clock Forward Prices and Basis Differentials ($5.45) ($5.89) ($4.89) ($4.97) AEP-Dayton Hub PJM W. Hub Basis Differential -$10 $0 $10 $20 $30 $40 $50
Slide 17: Merchant Generation: Power Hedge Margin
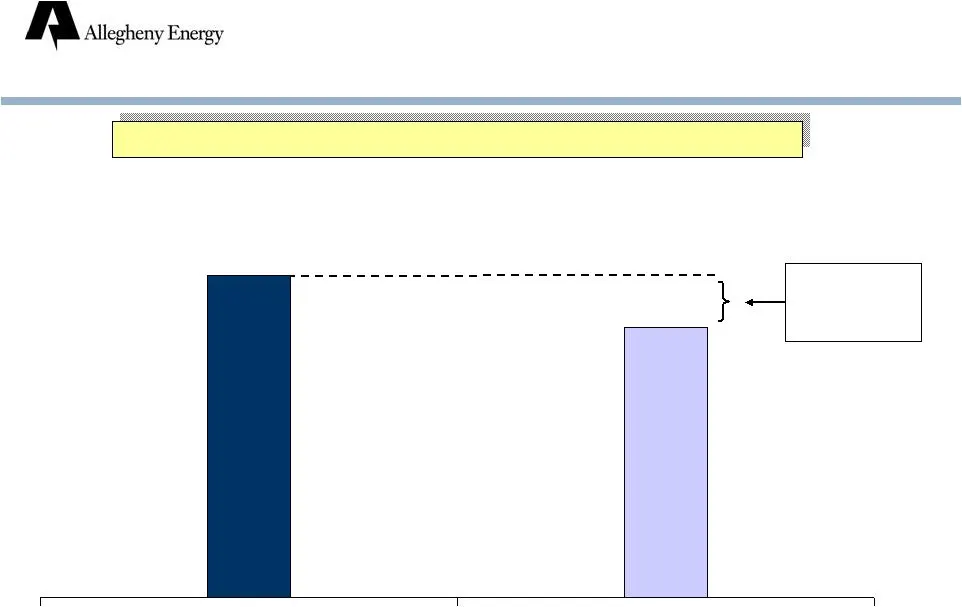
Merchant Generation: Power Hedge Margin 2010 Power Hedge Margin ($/MWH; estimates as of March 31, 2010) Margin: $4/MWH $110 million* * Based on 2010 power hedge volume of 27.8 million MWH $55 $51 Average Contract Price Estimated Market Value Power hedges substantially protect 2010 financial results.
Slide 18: if
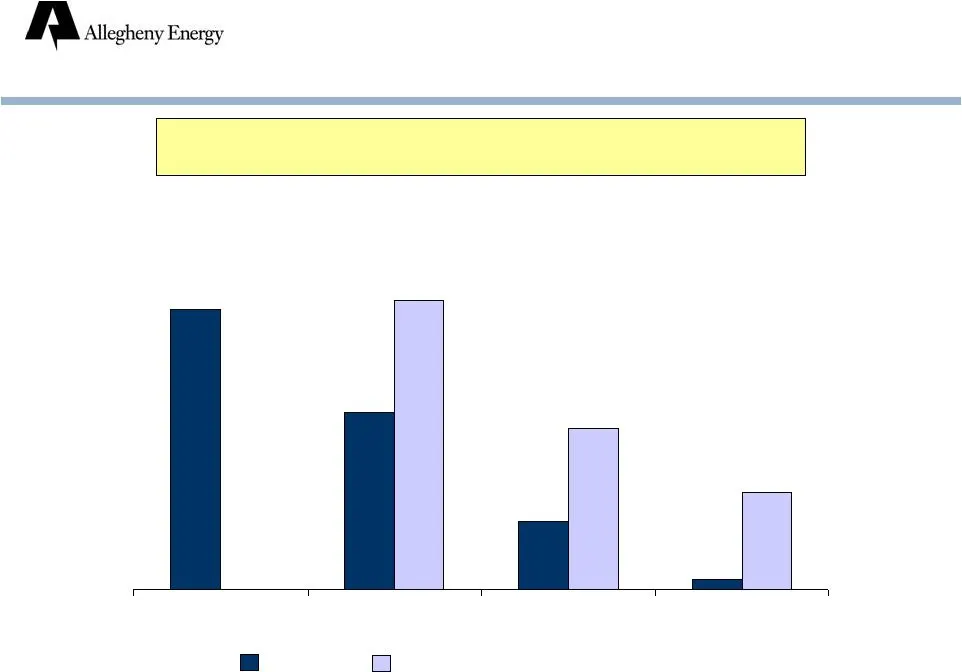
if
Slide 19: Increasing Pennsylvania Generation Rates
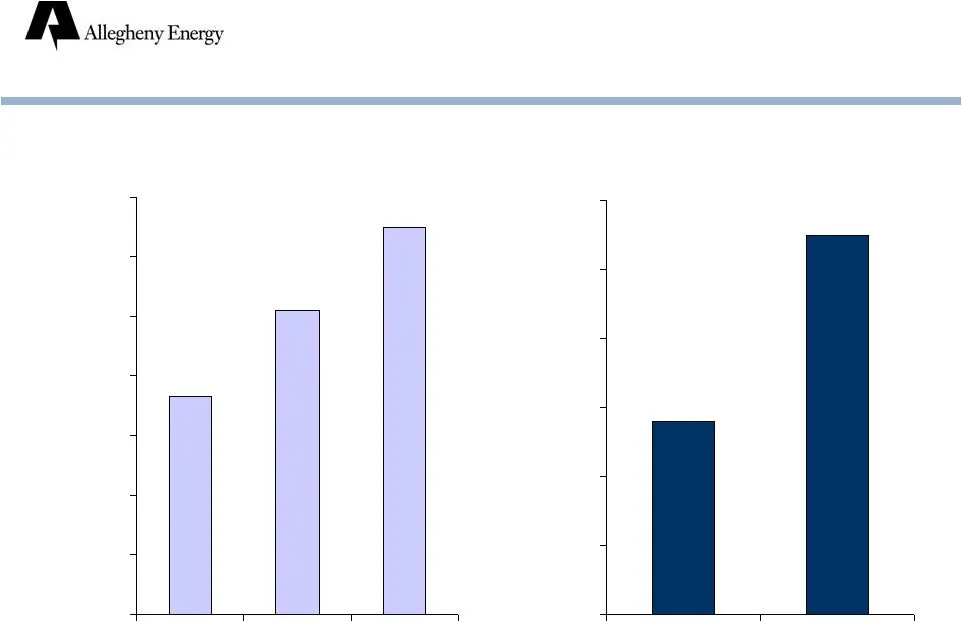
Pennsylvania POLR Rate $ per MWH Cumulative Increase in Pre-Tax Operating Income $ millions; estimates Increasing Pennsylvania Generation Rates $0 $50 $100 $150 $200 $250 $300 $20 $25 $30 $35 $40 $45 $50 $55

Slide 20: Transitioning to Market: Pennsylvania
Transitioning to Market: Pennsylvania West Penn Power Pennsylvania Power Procurement APRIL 2009 JUNE 2009 OCT. 2009 JAN. 2010 MAY 2010 Average weighted retail generation price ($/MWH): Residential $72.80 $71.64 $65.29 $62.27 $59.39 Non-residential $75.40 $67.24 $65.26 $63.38 Projected increase in 20
Slide 21: Power Procurement Schedule: Pennsylvania and Maryland
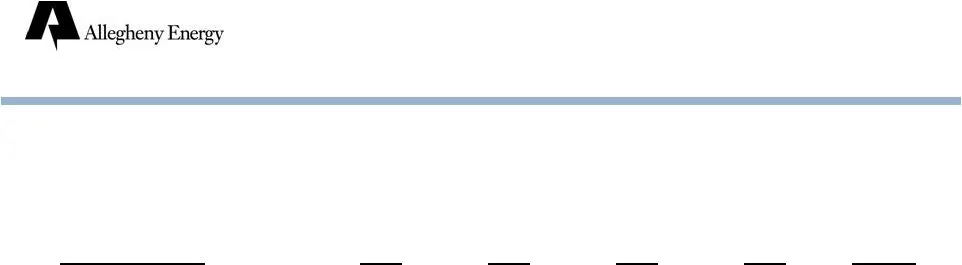
Power Procurement Schedule: Pennsylvania and Maryland MWH thousands AUCTION DATE TOTAL June 11, - MD October 22, - PA - 7,285 8,230 October 29, - MD - - January 14, - MD - - - January 20, - PA - - 2,000 1,400 3,400 April 20, - PA - - 1,900 1,300 3,200 Spot Purchases - PA - 1,850 8,100 3,350 13,300
Slide 22: Merchant Generation: Coal Contracts
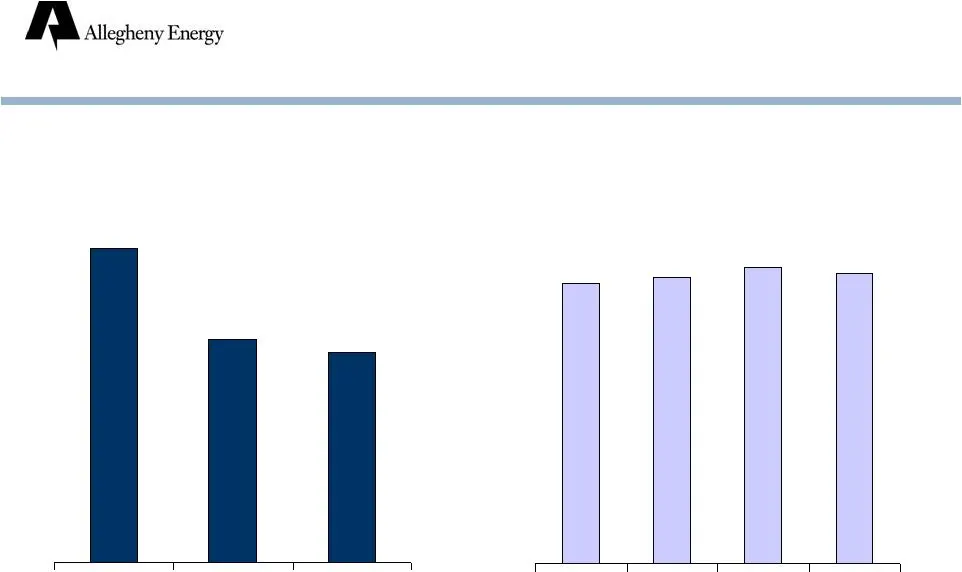
Merchant Generation: Coal Contracts Contracted & Priced* Contract Price* ($/ton) * As of March 31, 2010. Contract price includes delivery costs averaging $8-10/ton. $55 $56 $58 $57 99% 70% 66%
Slide 23: Location: Favorable for Coal Procurement
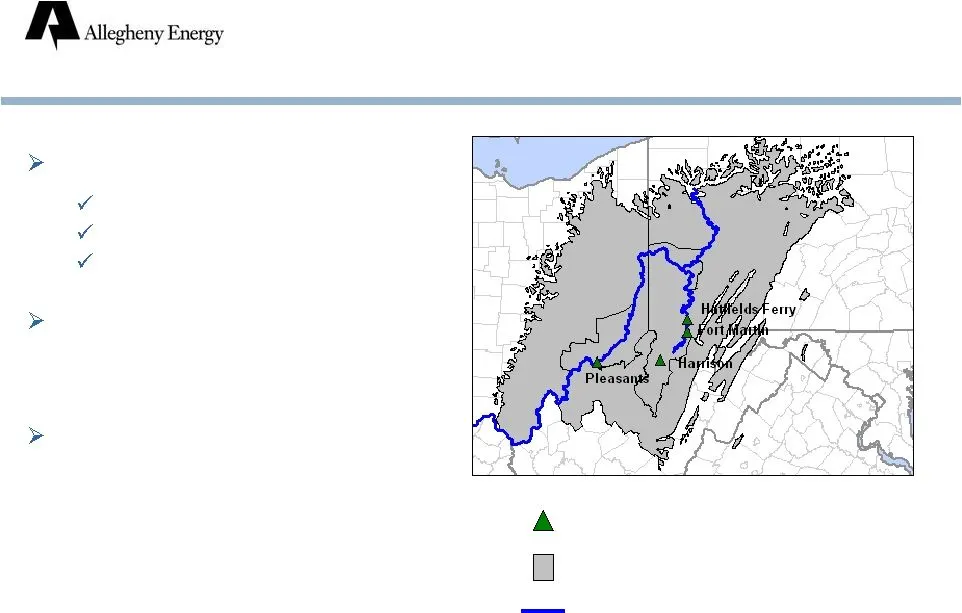
Adjacent to reserves, rivers Low transportation costs Flexible procurement Competing suppliers A natural partner for independent mines in need of an “anchor” purchaser Contract costs in line with operating costs of leading producers Location: Favorable for Coal Procurement Supercritical coal generat
Slide 24: Coal Type and Delivery Methods
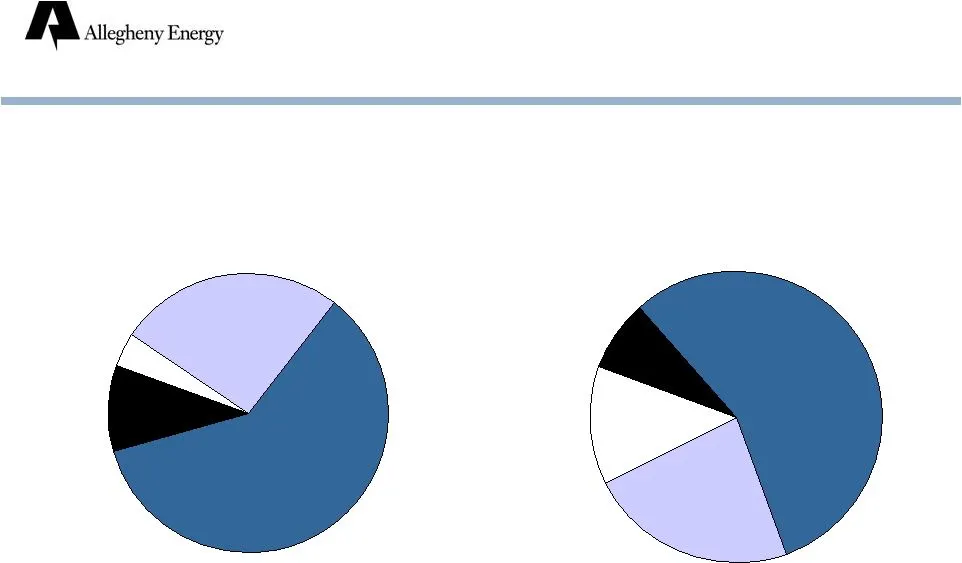
Coal Type and Delivery Methods (merchant; estimates) Northern App. Scrubber 60% Northern App. 26% PRB 4% Illinois 10% Rail 8% Truck 13% Conveyor 23% Barge 56%
Slide 25: Environmental Controls
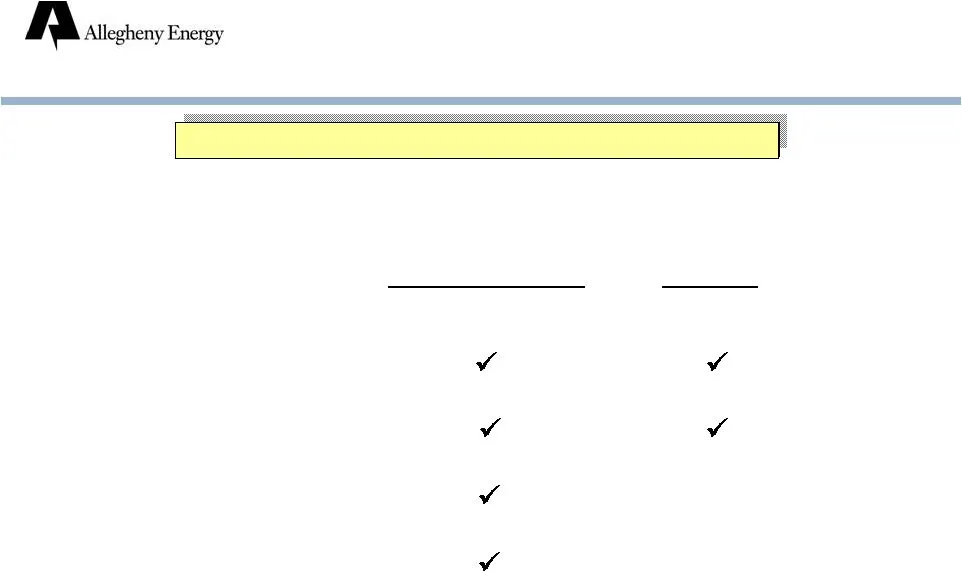
SCRUBBERS SCRs (SO ) (NO X ) Harrison Pleasants Hatfield Ft. Martin Environmental Controls All supercritical coal units have scrubbers.
Slide 26: Plant Availability
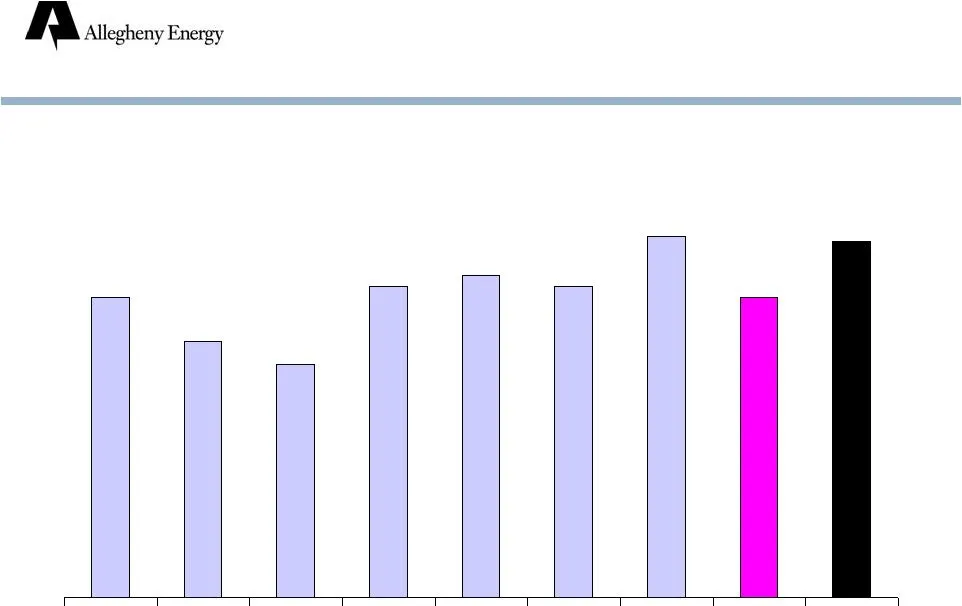
Supercritical Coal Plants (merchant and regulated) Plant Availability Top Quartile 82% 78% 76% 83% 84% 83% 87.5% 82% 87%
Slide 27: Transmission Expansion: Overview
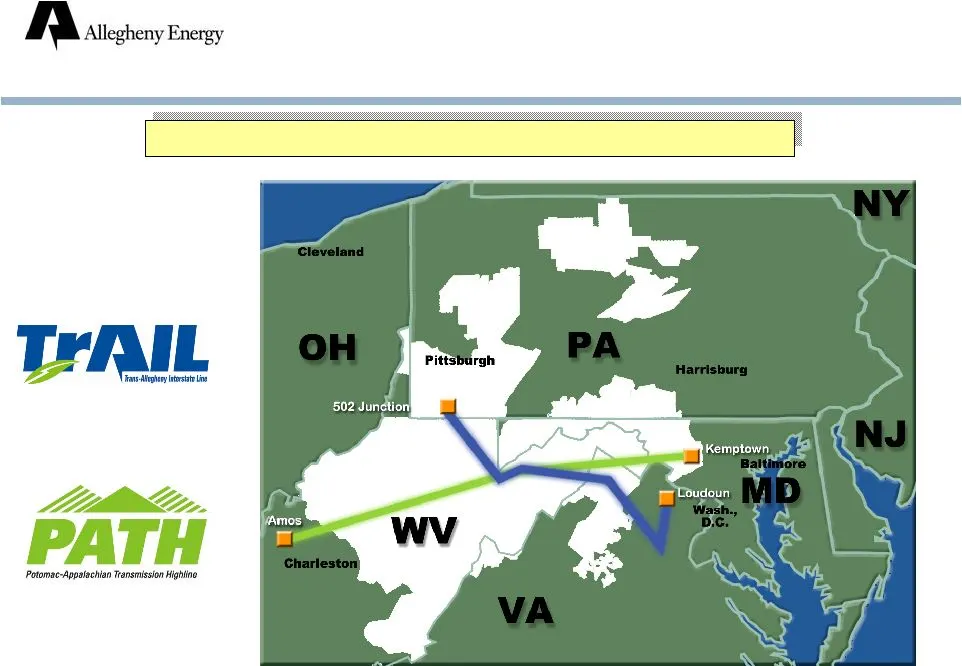
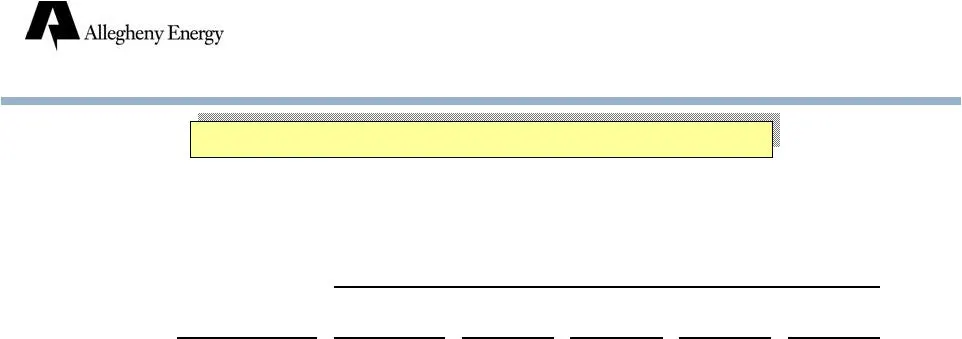
Transmission Expansion: Overview Allegheny is investing $2.6 billion in these projects.
Slide 28: Transmission Expansion
($ millions; cash basis) * Totals exclude AFUDC and capitalized interest. PATH represents Allegheny’s portion of project costs. FERC-approved equity ratio = 50% Transmission Expansion APPROVED ROE PROJECT TOTAL TrAIL 12.7% $ 925* $67 $384 $357 $80 Other projects 11.7-12.7% 425* PATH 14.3% 1,200* CAP
Slide 29: Growing Rate Base: Transmission Expansion
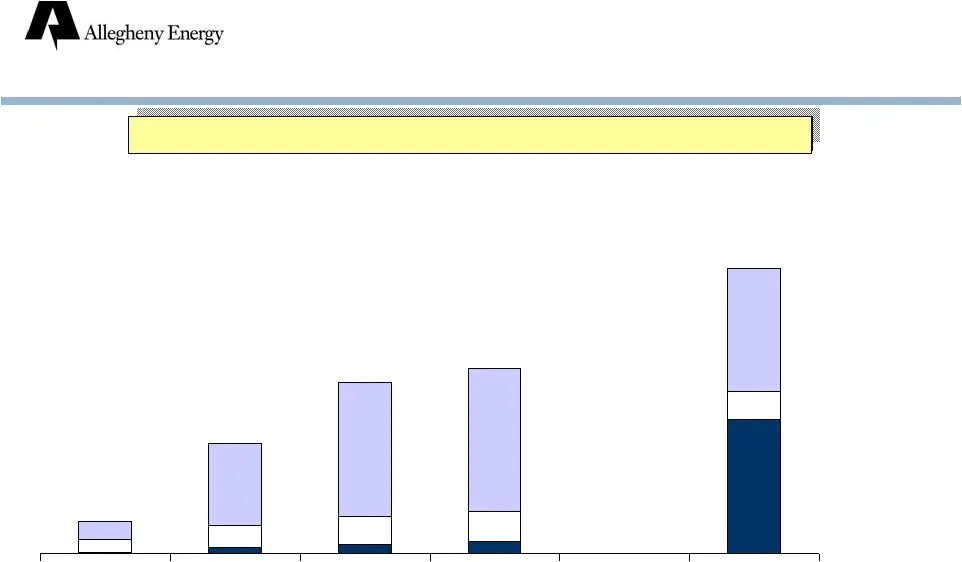
Growing Rate Base: Transmission Expansion Rate Base Year-End; $ billions $0.2 $0.8 $1.2 $1.3 $2.0 // TrAIL Other PJM PATH (Allegheny portion) Note: Assumes weighted average ROE based on rates for TrAIL (12.7%), Other (11.7-12.7%), and PATH (14.3%). Rate base is projected to nearly triple from 2009 t
Slide 30: TrAIL Construction Update
% Complete Rights of way 96% Substation construction 95-100% Towers constructed 67% Line installed 23% As of May 2010 Transmission Expansion: TrAIL Construction Update
Slide 31: Utility Operations: Overview
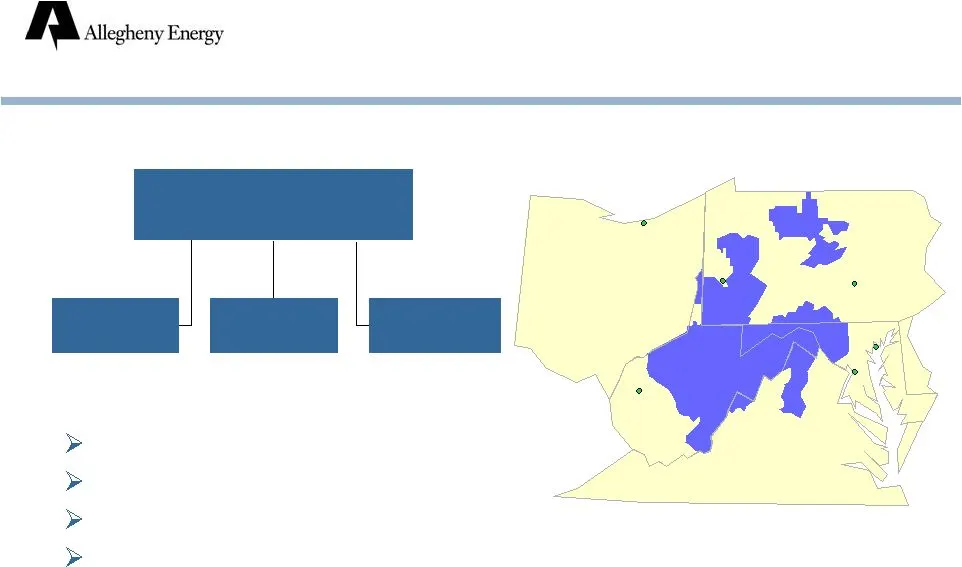
Allegheny Power West Penn Power Monongahela Power Potomac Edison WEST VIRGINIA Utility Operations: Overview In 4 states (PA, WV, MD, VA) 1.6 million electric customers Retail sales: 42.0 million MWH Regulated generation: over 2,700 MW (84% coal) VIRGINIA CHARLESTON OHIO HARRISBURG MARYLAND KENTUCKY
Slide 32: Utility Operations: Retail Revenue Mix, 2009
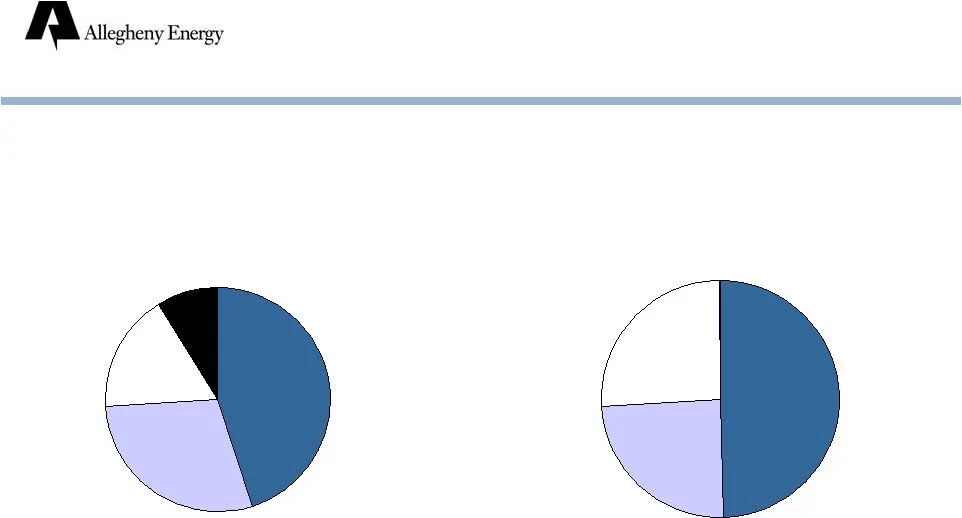
Utility Operations: Retail Revenue Mix, 2009 By State By Customer Class Residential 51% Industrial 25% Commercial 24% * Sale of VA distribution operations was completed on June 1, 2010. PA 45% WV 29% MD 17% VA* 9%

Slide 33: Authorized Capital Structures and ROE's
Authorized Capital Structures and ROE’s * Includes $154 of VA distribution assets. Sale of VA distribution operations was completed on June 1, 2010. STATE RATE BASE ($ millions; 12/31/09) APPROVED EQUITY RATIO APPROVED ROE RATIO/ROE APPROVED ON WV $1,426 46% 10.5% May 2007 PA 1,028 11.5 Dec. 1994 MD
Slide 34: Growing Rate Base: Utility Operations
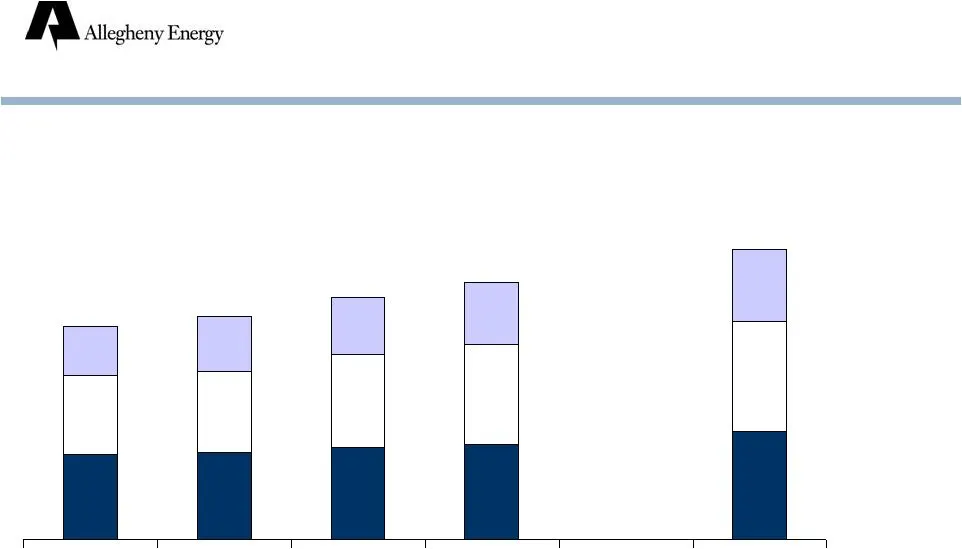
Potomac Edison* West Penn Mon Power // $2.9 $2.9 $3.9 $3.2 $3.5 Growing Rate Base: Utility Operations Year-end; $ billions * Excludes VA distribution assets for all periods Note: Includes capital expenditures for PA Act 129 plan as originally proposed ($174 million in 2010, $102 million in 2011, $44
Slide 35: Utility Operations: Competitive Rates
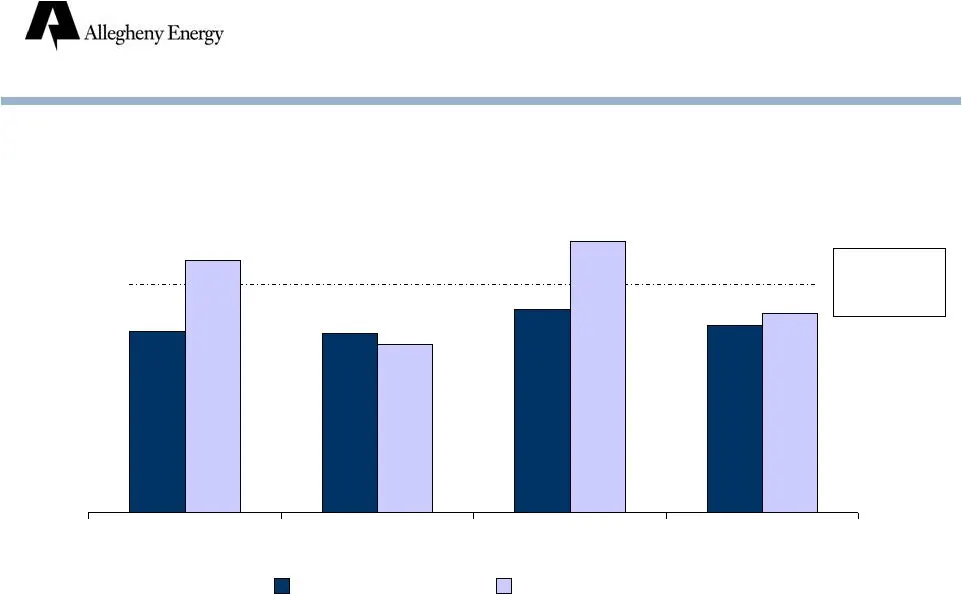
Utility Operations: Competitive Rates National Average = 11.65 ¢/kWh Residential Rates ¢/kWh as of January 1, 2010 * Sale of VA distribution operations was completed on June 1, 2010. 9.29 9.18 10.37 9.58 12.90 8.61 10.19 13.91 Pennsylvania West Virginia Maryland Virginia* Allegheny Power State Avera
Slide 36: 2010 Outlook
($ millions adjusted pre-tax; estimates as of 03/31/10) 2010 Outlook Change from Actual Better (Worse) Adjusted EBITDA: Merchant generation $ (55) $ (46) $ Utility operations (54) Transmission expansion Other (2) (1) - Depreciation (282) (46) Interest (258) (49) (1) 2010 Earnings Increase (Decrease)

Slide 37: Merchant Generation: 2010 Outlook
Merchant Generation: 2010 Outlook ($ millions adjusted pre-tax; estimates as of 03/31/10) Actual Adjusted EBITDA: Merchant generation $ (55) $ (46) $ Key drivers: Unhedged energy margin $ (220) $ Capacity Other (4) (5) Operating expenses (10) (5) Power hedge margin (99) Change from 2010 Earnings Inc
Slide 38: Merchant Generation: Key Drivers of EBITDA
Excludes volumes from Buchanan and volumes consumed by pumping at Bath County. The expected realized price received from PJM at the generator. Includes emissions, lime, urea, natural gas, other fuels, OVEC purchased power, and Bath County pumping costs. Includes ancillaries, Kern River, and other mi
Slide 39: Merchant Generation: Key Drivers of EBITDA
Includes POLR obligations, marketing contracts, and financial hedges. Volume weighted contract price, including energy, capacity, ancillaries, congestion, and shaping. Volume weighted market price as of 3/31/10 including energy, capacity, ancillaries, congestion, and shaping. Difference between aver
Slide 40: Merchant Generation: Key Drivers of EBITDA
Note: For period 2010-2012 power volumes, % power hedged, and % coal priced are based upon 3/31/10 production forecasts which are subject to change; coal contract prices include delivery costs Merchant Generation: Key Drivers of EBITDA Includes supplemental auctions Estimates as of 03/31/10 - $ mill
Slide 41: Merchant Generation: Forward Market Data
Merchant Generation: Forward Market Data Note: broker estimates SO2 allowance to ton of emission ratio – = 1:1 and 2010-2012 = 2:1 Actual Balance As of 03/31/1 0 POWER ($/MWh) PJM West Hub RTC 38.75 $ 38.08 $ 42.04 $ 43.32 $ AEP Dayton Hub RTC 32.98 32.63 36.15 38.43 NATURAL GAS ($/MMBtu) Henry Hub

Slide 42: Merchant Generation: Sensitivities
Change in pre-tax income = (Total generation volume – power hedge volume – Bath pumping annual volume of approximately 1.5 TWh) x realized energy price sensitivity ($/MWh) Cost of each emission allowance adjusted by same percentage Note: does not reflect potential dispatch changes, load changes, cha
Slide 43: Utility Operations: 2010 Outlook
Utility Operations: 2010 Outlook ($ millions adjusted pre-tax; estimates as of 03/31/10) Subject to change pending outcome of review of lower cost compliance alternative Excludes gain from sale of VA Distribution Actual Adjusted EBITDA: Utility operations $ $ (54) $ Key drivers: WV base rate settlem

Slide 44: Transmission Expansion: 2010 Outlook
Transmission Expansion: 2010 Outlook ($ millions adjusted pre-tax; estimates as of 03/31/10) Change from Actual Better (Worse) Adjusted EBITDA: Transmission expansion $ $ $ 2010 Earnings Increase (Decrease)

Slide 45: Depreciation: 2010 Outlook
Depreciation: 2010 Outlook ($ millions adjusted pre-tax; estimates as of 03/31/10) Change from Actual Better (Worse) Depreciation (282) $ (46) $ $ Key drivers: Scrubber (Ft. Martin) (21) $ - $ Scrubber (Hatfield) (19) - Other (6) 2010 Earnings Increase (Decrease)
Slide 46: Capital Expenditures
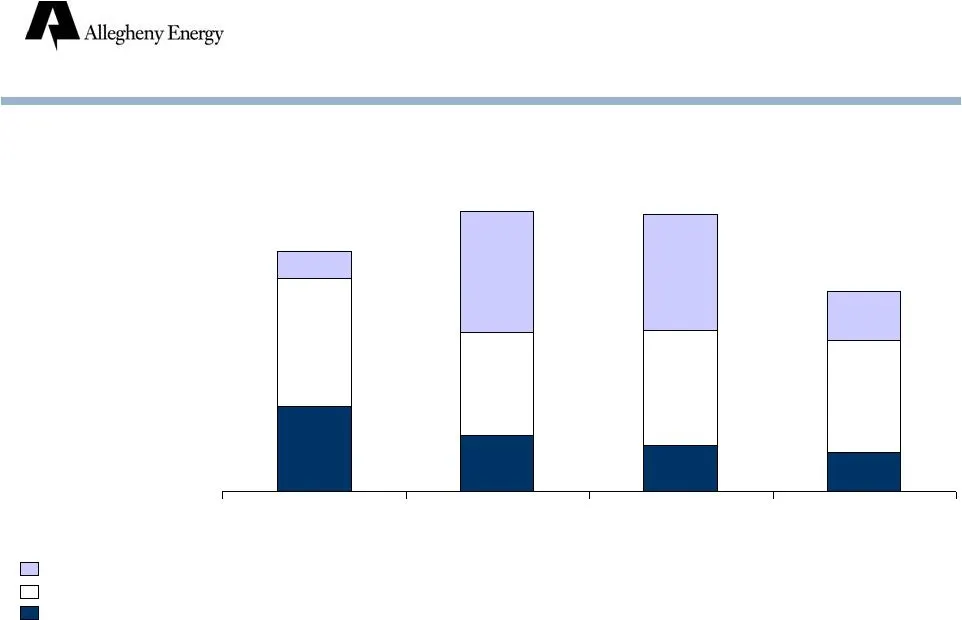
Transmission expansion $112 $499 $480 $202 Utility Operations Merchant generation $ millions; cash basis Capital Expenditures $991 $1,152 $823 $1,144 NOTE: includes securitized scrubber capital expenditures, Allegheny’s portion of PATH, and expenditures for PA Act 129 plan (as originally proposed) w
Slide 47: Interest: 2010 Outlook
Interest: 2010 Outlook ($ millions adjusted pre-tax; estimates as of 03/31/10) * Subject to formulaic recovery Change from Actual Better (Worse) Interest (258) $ (49) $ (1) $ Key drivers: Securitized interest $ * $ Capitalized interest (21) (1) Transmission (20) * Other (13) (7) 2010 Earnings Increa
Slide 48: Risks and Challenges
Strength of economic recovery Gas prices Environmental regulations Climate change legislation PATH approvals Merger approvals Risks and Challenges
Slide 49: FirstEnergy Merger: Significant benefits to shareholders
Significant benefits to shareholders Premium Dividend increase Diversifies fuel mix by adding nuclear capacity Provides greater scale and scope Strong business portfolio, excellent growth opportunities FirstEnergy Merger
Slide 50: FirstEnergy Merger: Diversifies Fuel Mix
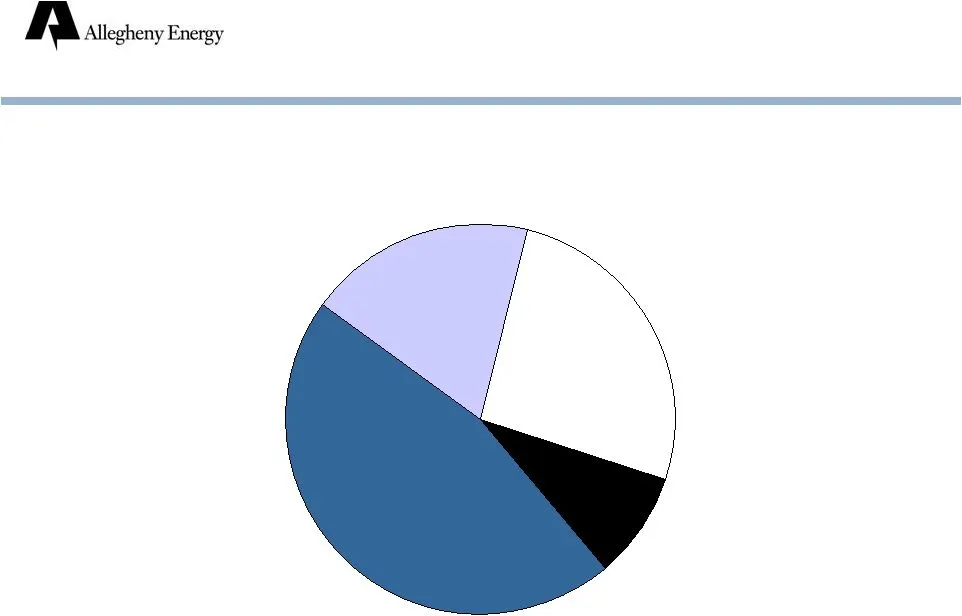
FirstEnergy Merger: Diversifies Fuel Mix Coal: Unscrubbed 19% Coal: Scrubbed 46% Natural Gas 9% Non-Emitting 26% Combined Generation Capacity December 31, 2009 Includes nuclear, wind and hydro
Slide 51: FirstEnergy Merger: Greater Scale and Scope
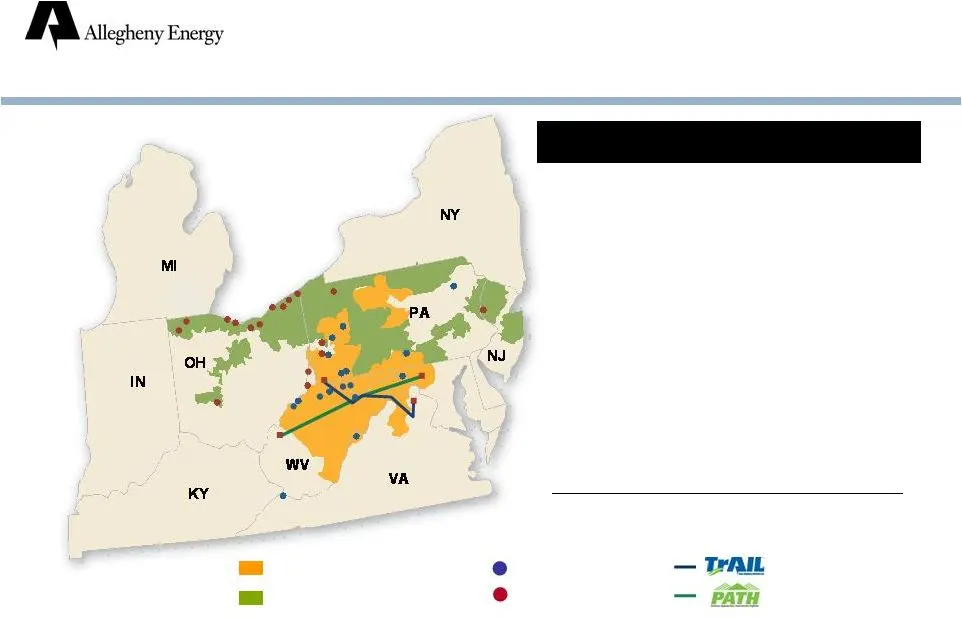
FirstEnergy Merger: Greater Scale and Scope Revenue $16.4 billion Electric Customers 6.1 million Rate Base $10.8 billion Total Generation 24 GW Competitive Generation 21 GW Service Territory 67,000 sq miles Employees ~17,750 FirstEnergy Service Territory Allegheny Service Territory FirstEnergy Plant
Slide 52: FirstEnergy Merger: Timeline
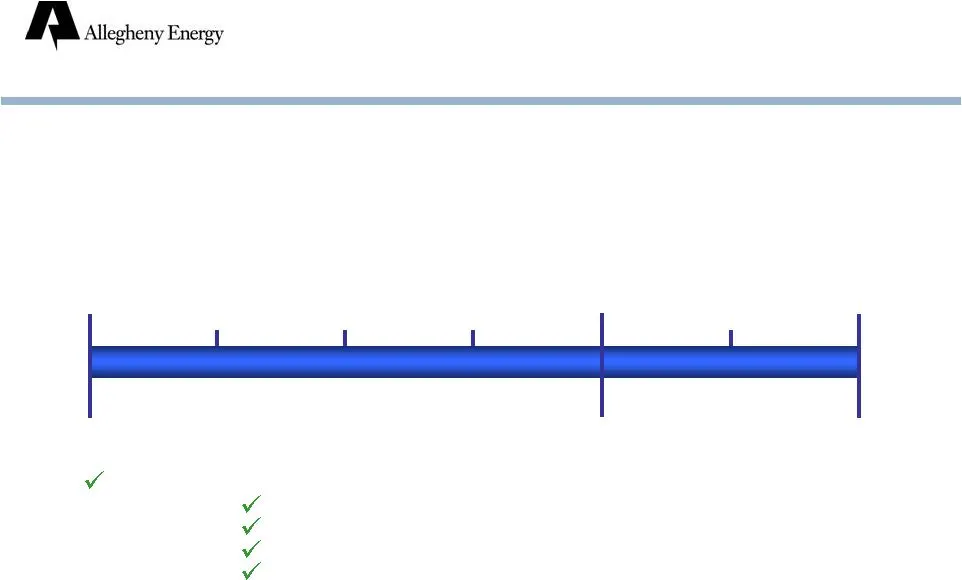
FirstEnergy Merger: Timeline Announced merger, filed S-4 Filed with: FERC PA WV MD VA Shareholder meetings Complete merger Q1 Q4 Q2 Q3 Q1 Q2

Slide 53: Earnings (Loss) Per Share
Earnings (Loss) Per Share As Reported As Adjusted As Reported As Adjusted 2003: Q1 $ (0.46) $ (0.32) 2007: Q1 $ 0.65 $ 0.65 Q2 (1.82) (0.23) Q2 0.45 0.45 Q3 (0.40) 0.11 Q3 0.67 0.67 Q4 (0.11) (0.14) Q4 0.65 0.46 Year (2.80) (0.37) Year 2.43 2.26 2004: Q1 $ 0.25 $ (0.03) 2008: Q1 $ 0.80 $ 0.80 Q2 (0.

Slide 54: EBITDA
EBITDA As Reported As Adjusted As Reported As Adjusted 2003: Q1 $ 77.6 $ 92.9 2007: Q1 $ 312.6 $ 312.6 Q2 (203.5) 150.1 Q2 263.8 263.8 Q3 117.3 225.3 Q3 308.6 308.6 Q4 197.4 185.6 Q4 242.9 243.6 Year 156.8 634.9 Year 1,128.0 1,131.1 2004: Q1 $ 247.8 $ 175.5 2008: Q1 $ 323.1 $ 323.1 Q2 110.3 122.0 Q2
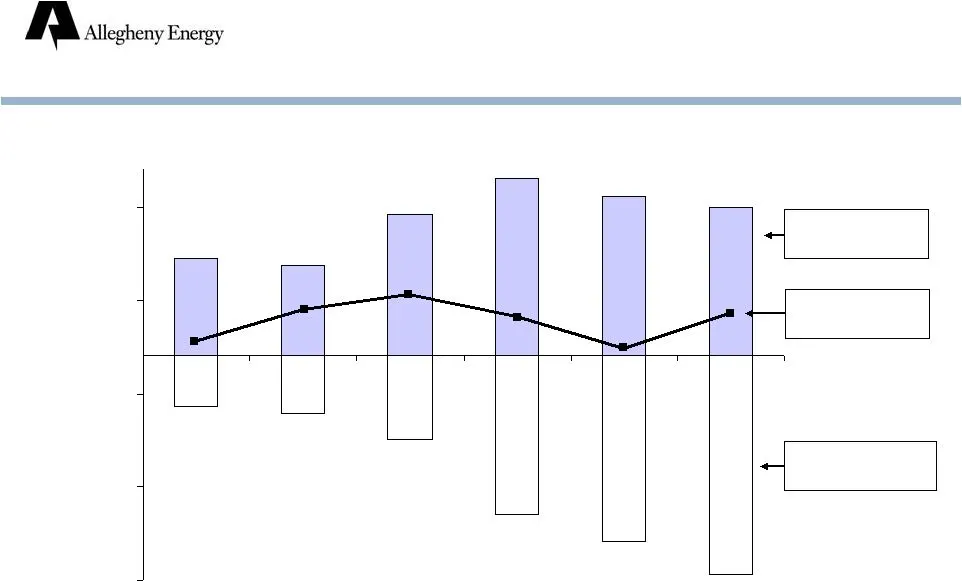
Slide 55: Cash Flow
($1,200) ($700) ($200) $300 $800 Cash Flow $ millions * Adjusted cash from operations net of capital expenditures excluding securitization and project financings. Cash From Operations Capital Expenditures Free Cash Flow*

Slide 56: Credit Ratings
Credit Ratings Baa3 Ba3 B3 Moody’s BBB- BB- CCC+ S&P Senior Unsecured Debt Baa2 Baa3 B1 Moody’s BBB BBB- B S&P Senior Secured Debt AE Supply Ba1 Ba2 B2 Moody’s BB+ BB- CCC+ S&P Senior Unsecured Debt BBB- BB+ B S&P Corporate Family Rating AYE, Inc. April
Source: SEC EDGAR · 8-K filed Jun 7, 2010
More decks from Allegheny Energy Inc
 EEI Financial Conference 201045 slides · Nov 1, 2010
 Barclays Capital CEO Energy-Power Conference 20105 slides · Sep 15, 2010
 Merger or Acquisition (September 2010)19 slides · Sep 14, 2010
 Merger or Acquisition (August 2010)20 slides · Aug 13, 2010
 Merger or Acquisition (August 2010)7 slides · Aug 4, 2010
 Merger or Acquisition (June 2010)7 slides · Jun 7, 2010