Suja Life, Inc. · NASDAQ:SUJA
Suja Life — Q3 2026 Earnings Presentation
14 slides from Suja Life's earnings presentation, Nov 10, 2026

Slide 1: Third Quarter 2026 Earnings Results
Third Quarter 2026 Earnings Results
Slide 2: Disclaimer
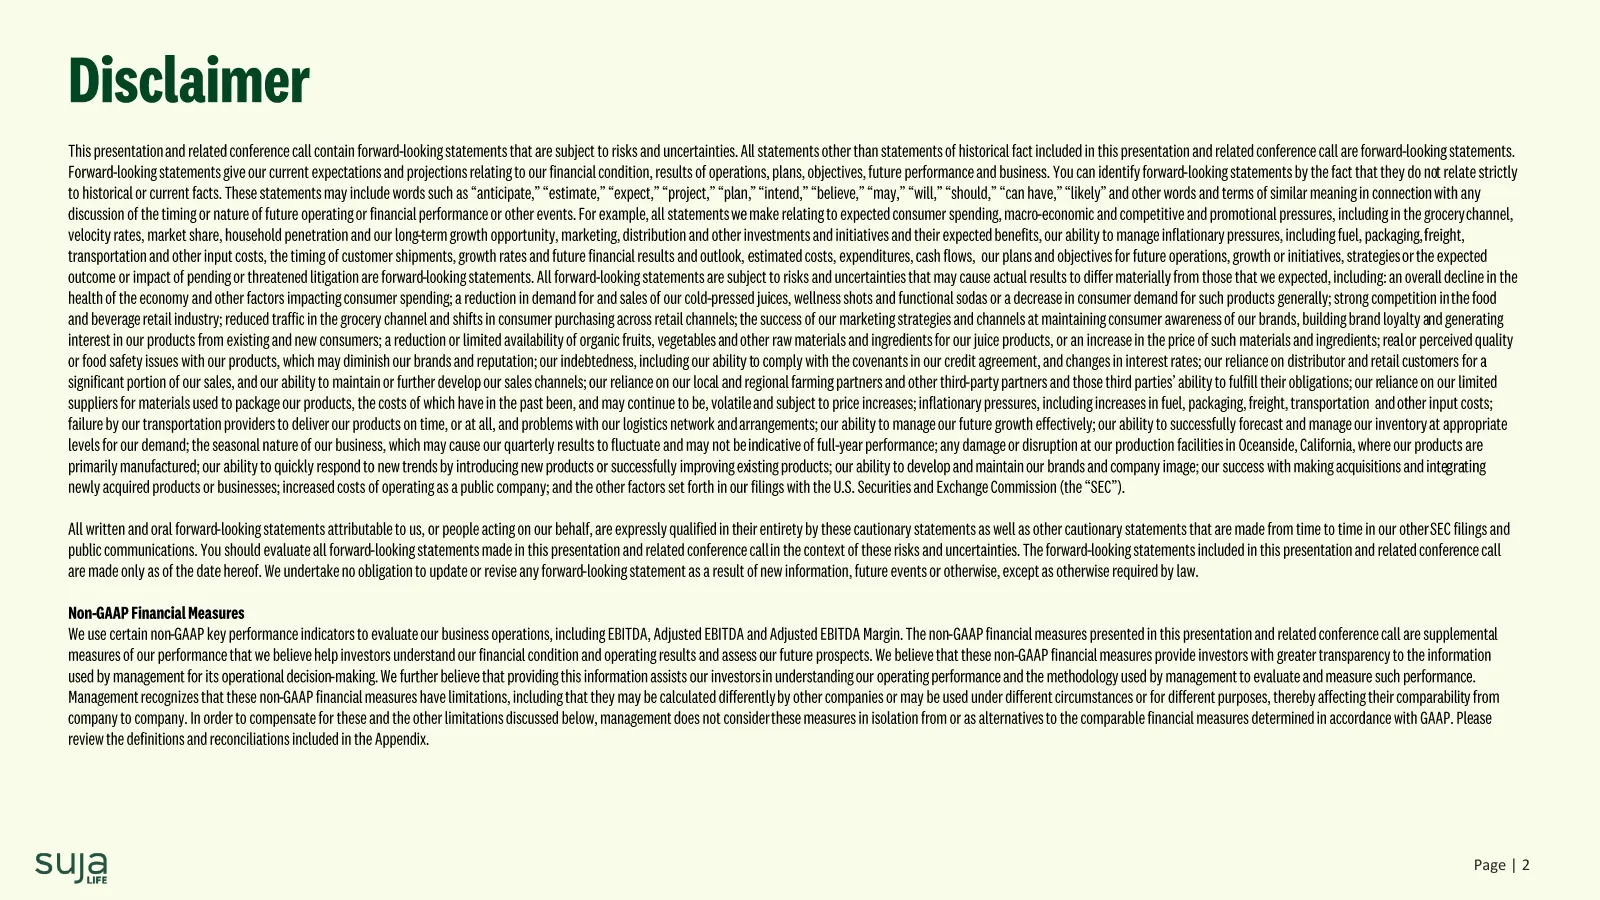
Disclaimer This presentation and related conference call contain-looking forward statements that are subject to risks and uncertainties. l statements other Al than statements of historical fact included in this presentation and related -look conference ing statements.call are forwa Forward-looking s

Slide 3: Our Purpose: To Change What Beverages Bring to the Table
Our Purpose To Change What Beverages Bring to the Table REAL, GREAT APPROACHABLE FUNCTIONAL TASTE & ACCESSIBLE NUTRITION 3
Slide 4: We Are A Growing Platform In Natural Healthy Beverage
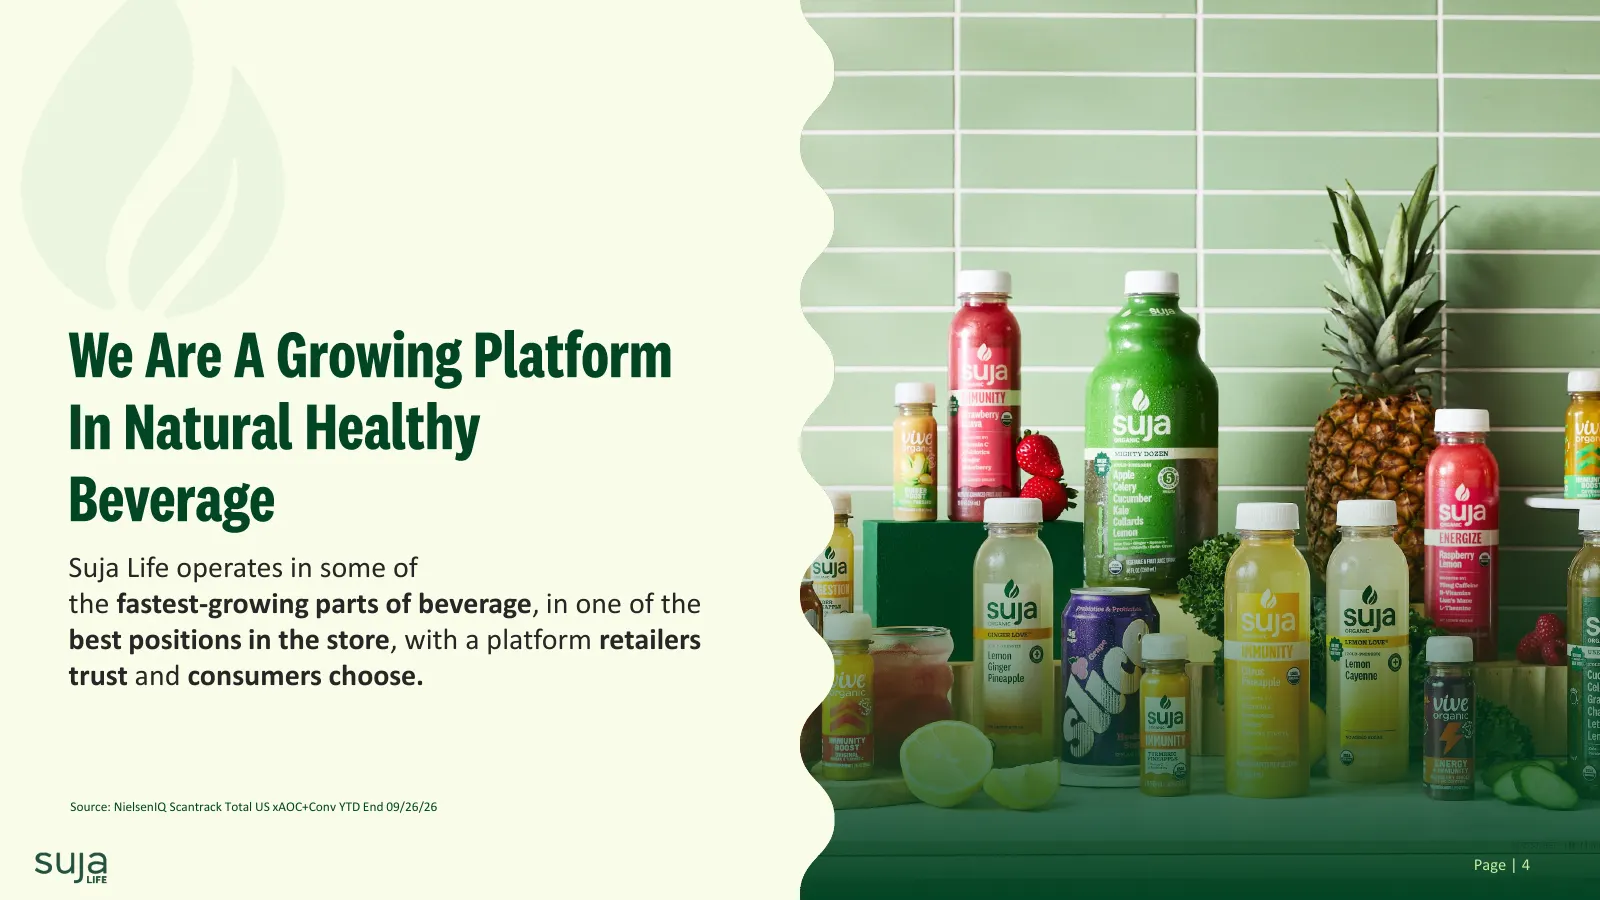
We Are A Growing Platform In Natural Healthy Beverage Suja Life operates in some of the fastest-growing parts of beverage, in one of the best positions in the store, with a platform retailers trust and consumers choose. Source: NielsenIQ Scantrack Total US xAOC+Conv YTD End 09/26/26 Page | 4
Slide 5: The Suja Life Platform
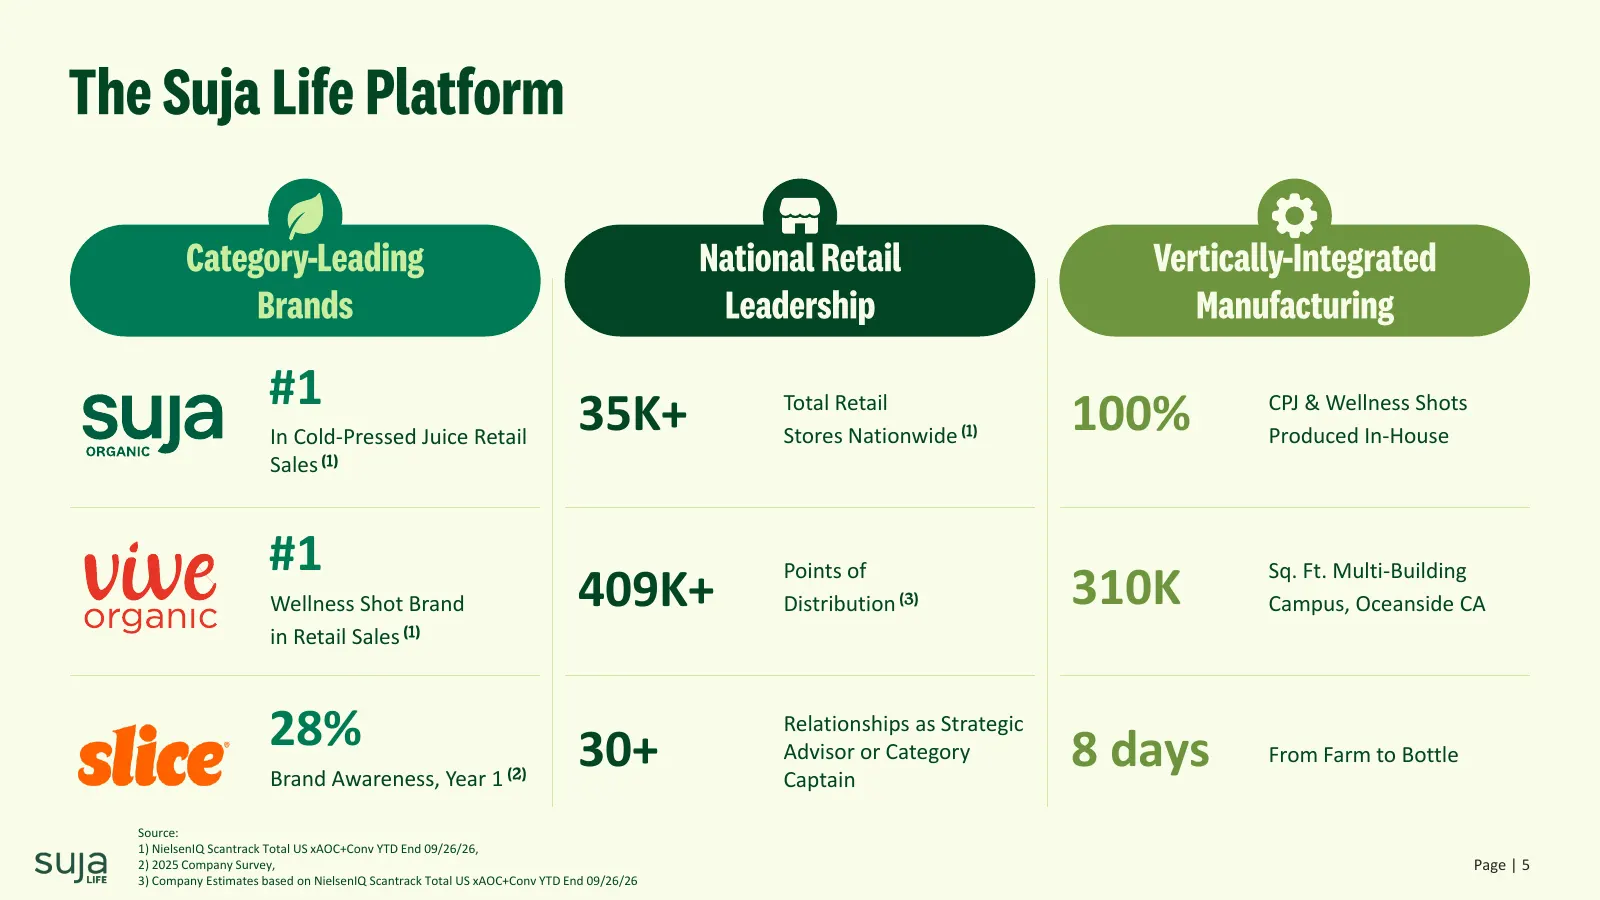
The Suja Life Platform Category -Leading National Retail Vertically -Integrated Brands Leadership Manufacturing #1 In Cold-Pressed Juice Retail 35K+ Total Retail Stores Nationwide (1) 100% CPJ & Wellness Shots Produced In-House Sales (1) #1 Points of Sq. Ft. Multi-Building Wellness Shot Brand 409K+
Slide 6: Q3 2026 Highlights
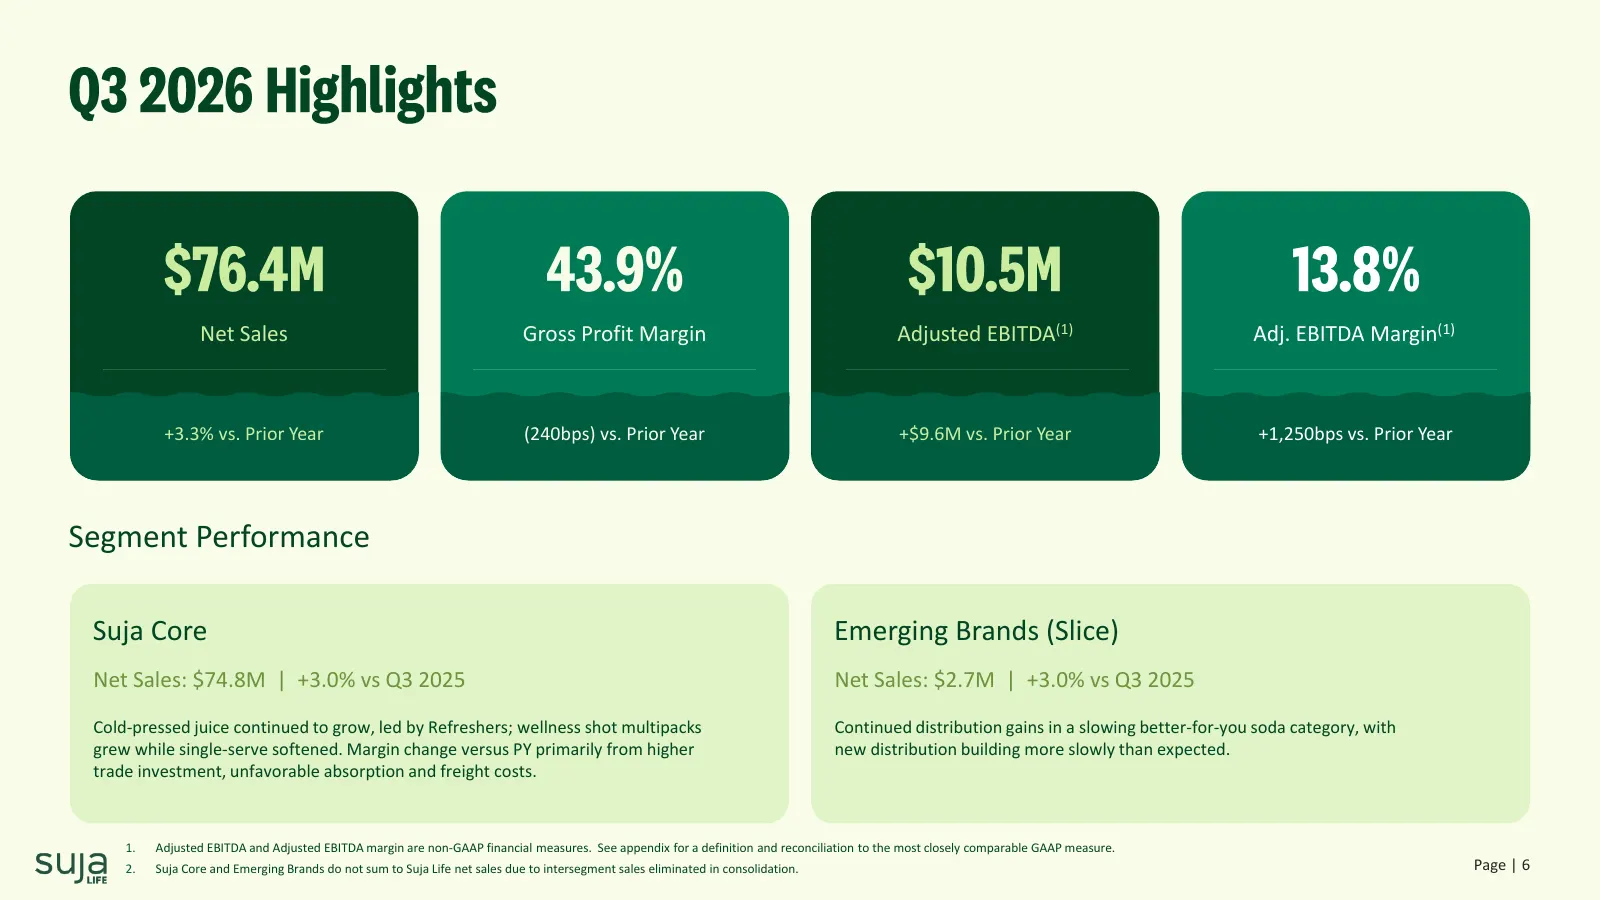
Q3 2026 Highlights $76.4M 43.9% $10.5M 13.8% Net Sales Gross Profit Margin Adjusted EBITDA(1) Adj. EBITDA Margin(1) +3.3% vs. Prior Year (240bps) vs. Prior Year +$9.6M vs. Prior Year +1,250bps vs. Prior Year Segment Performance Suja Core Emerging Brands (Slice) Net Sales: $74.8M | +3.0% vs Q3 2025 N
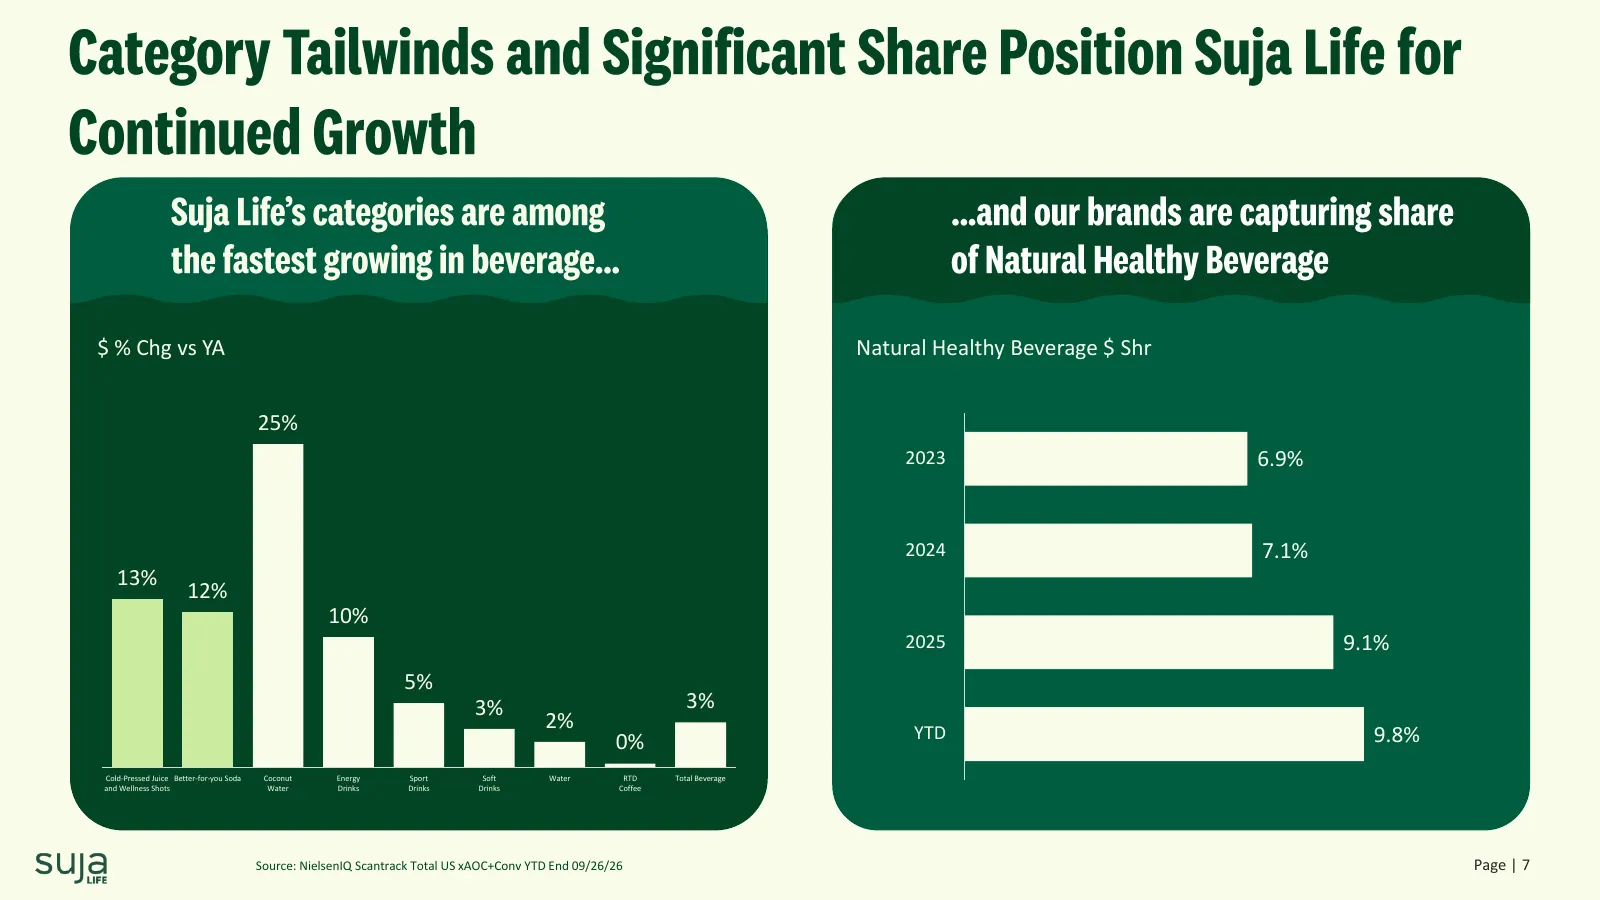
Slide 7: Category Tailwinds and Significant Share Position Support Continued Growth
Category Tailwinds and Significant Share Position Suja L Continued Growth Suja Life’s categories are among …and our brands are capturing share the fastest growing in beverage… of Natural Healthy Beverage $ % Chg vs YA Natural Healthy Beverage $ Shr 25% 2023 6.9% 2024 7.1% 13% 12% 10% 2025 9.1% 5% 3%
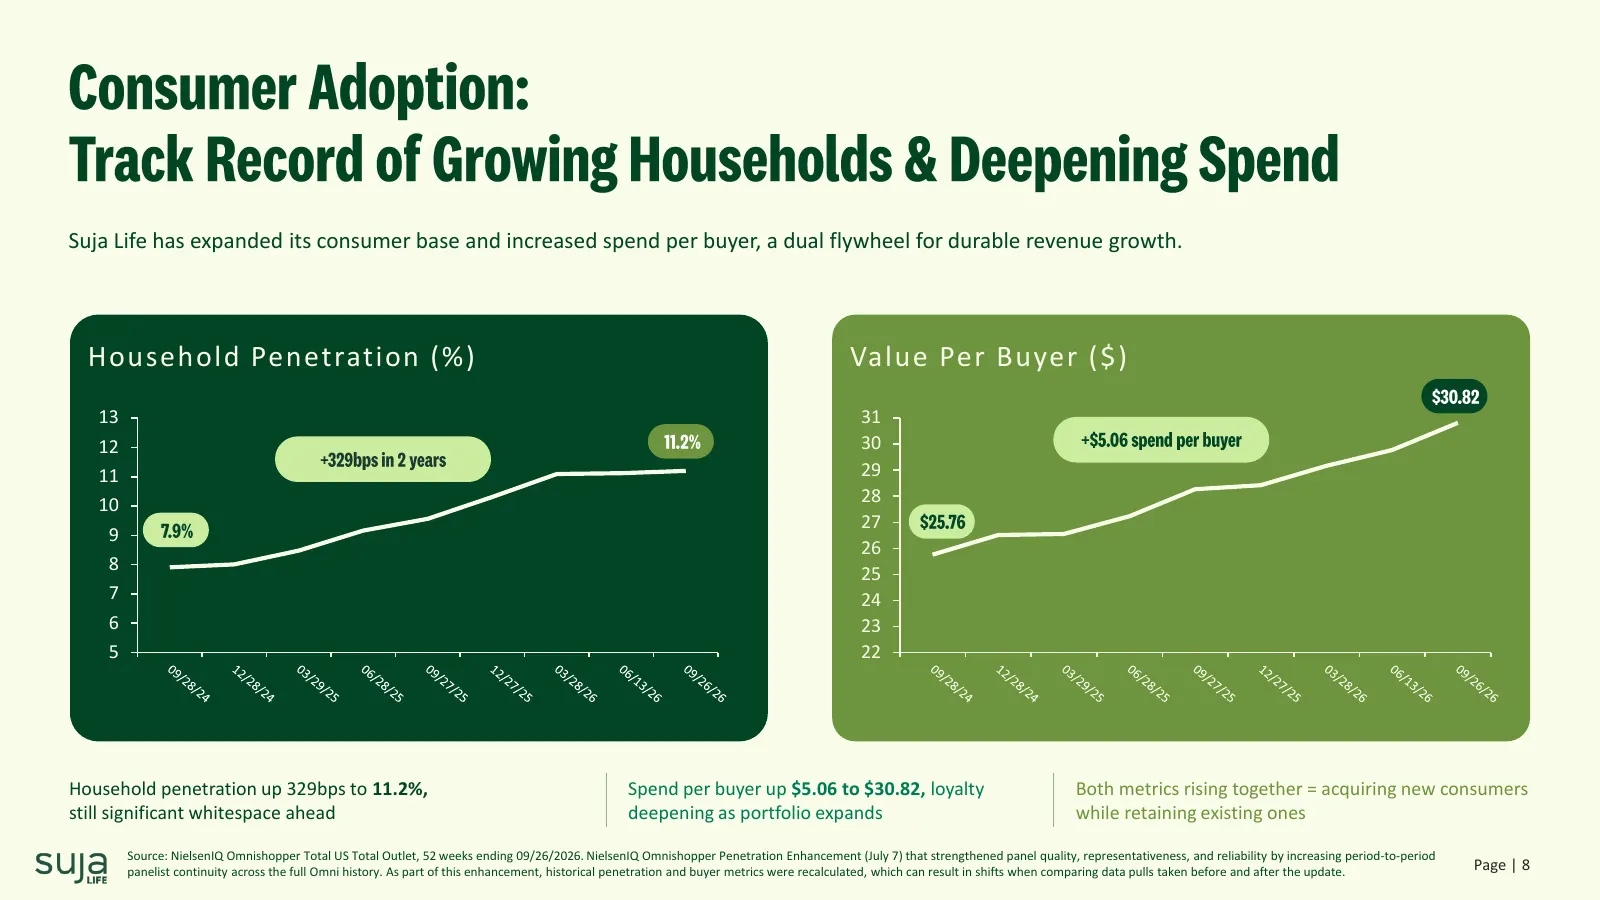
Slide 8: Consumer Adoption: Track Record of Growing Households & Deepening Spend
Consumer Adoption: Track Record of Growing Households & Deepening Spen Suja Life has expanded its consumer base and increased spend per buyer, a dual flywheel for durable revenue growth. Household Penetration (%) Value Per Buyer ($) $30.82 13 31 12 11.2% 30 +$5.06 spend per buyer +329bps in 2 years
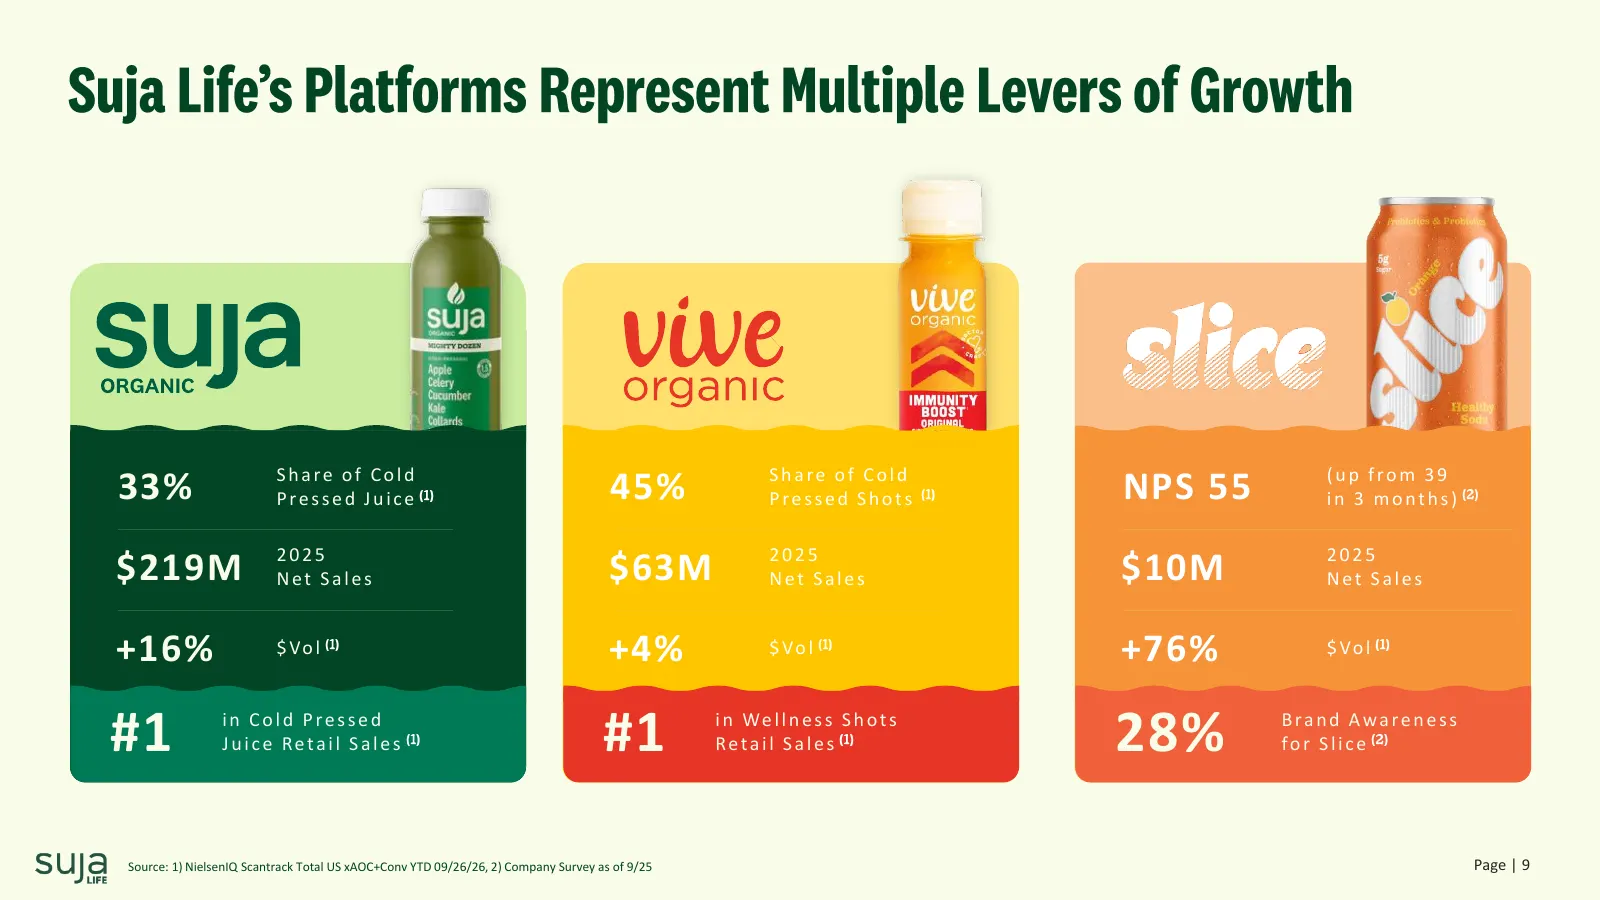
Slide 9: Suja Life's Platforms Represent Multiple Levers of Growth
Suja Life’s Platforms Represent Multiple Levers of Grow Share of Cold Share of Cold (up from 39 33% P r e s s e d J u i c e (1) 45% P r e s s e d S h o t s (1) NPS 55 i n 3 m o n t h s ) (2) 2025 2025 2025 $219M Net Sales $63M Net Sales $10M Net Sales +16% $ Vo l (1) +4% $ Vo l (1) +76% $ Vo l (1) #
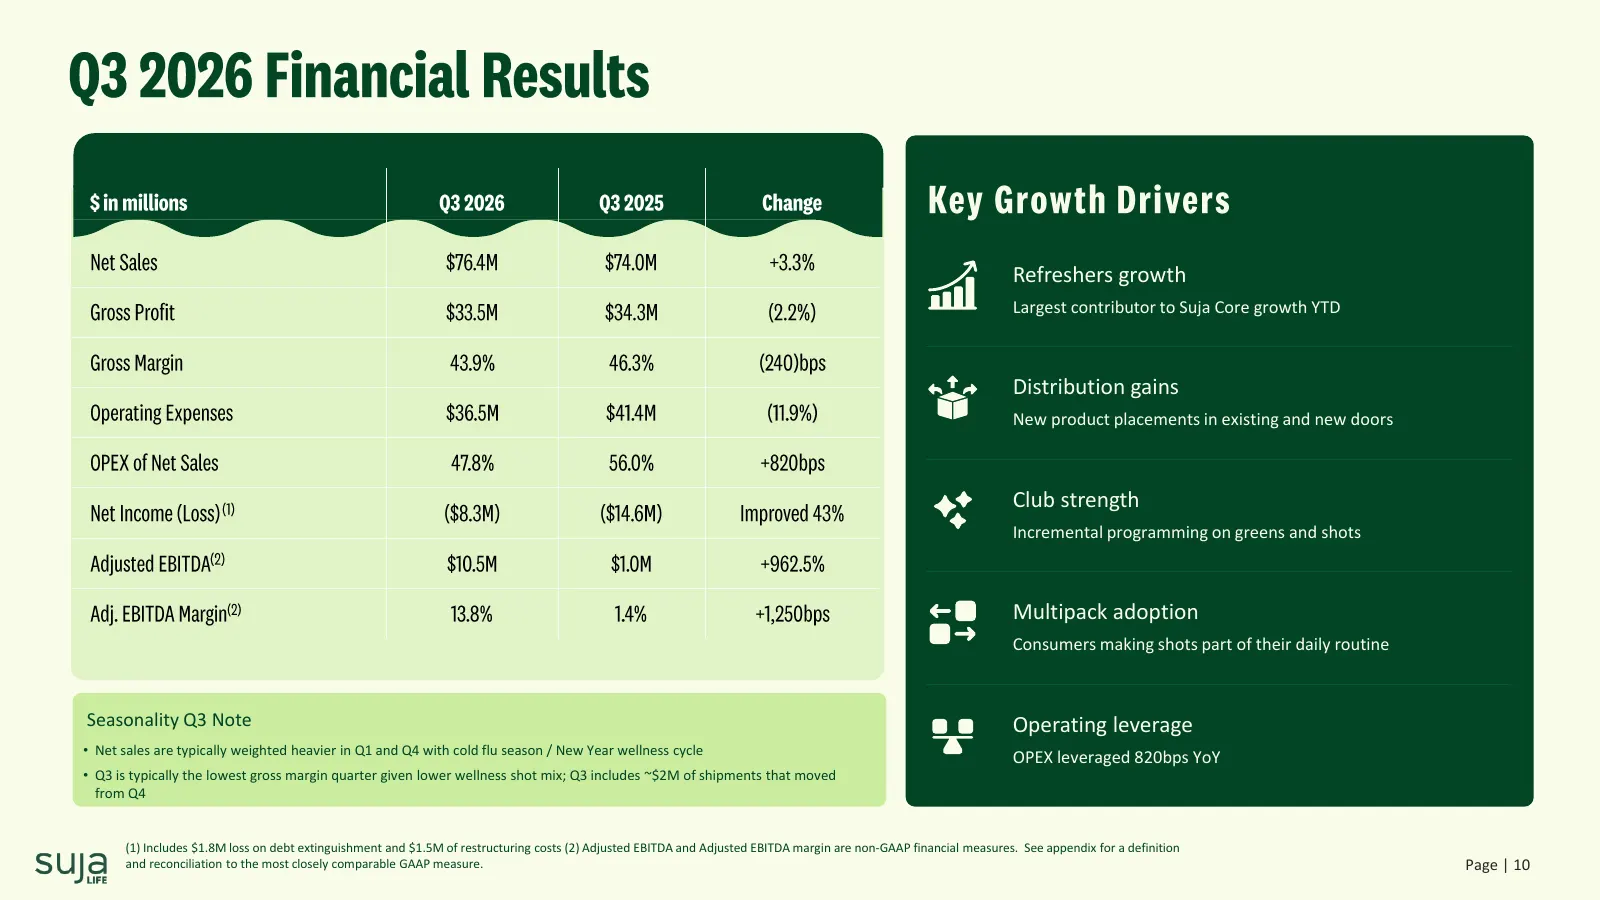
Slide 10: Q3 2026 Financial Results
Q3 2026 Financial Results $ in millions Q3 2026 Q3 2025 Change Key Growth Drivers Net Sales $76.4M $74.0M +3.3% Refreshers growth Gross Profit $33.5M $34.3M (2.2%) Largest contributor to Suja Core growth YTD Gross Margin 43.9% 46.3% (240)bps Distribution gains Operating Expenses $36.5M $41.4M (11.9%
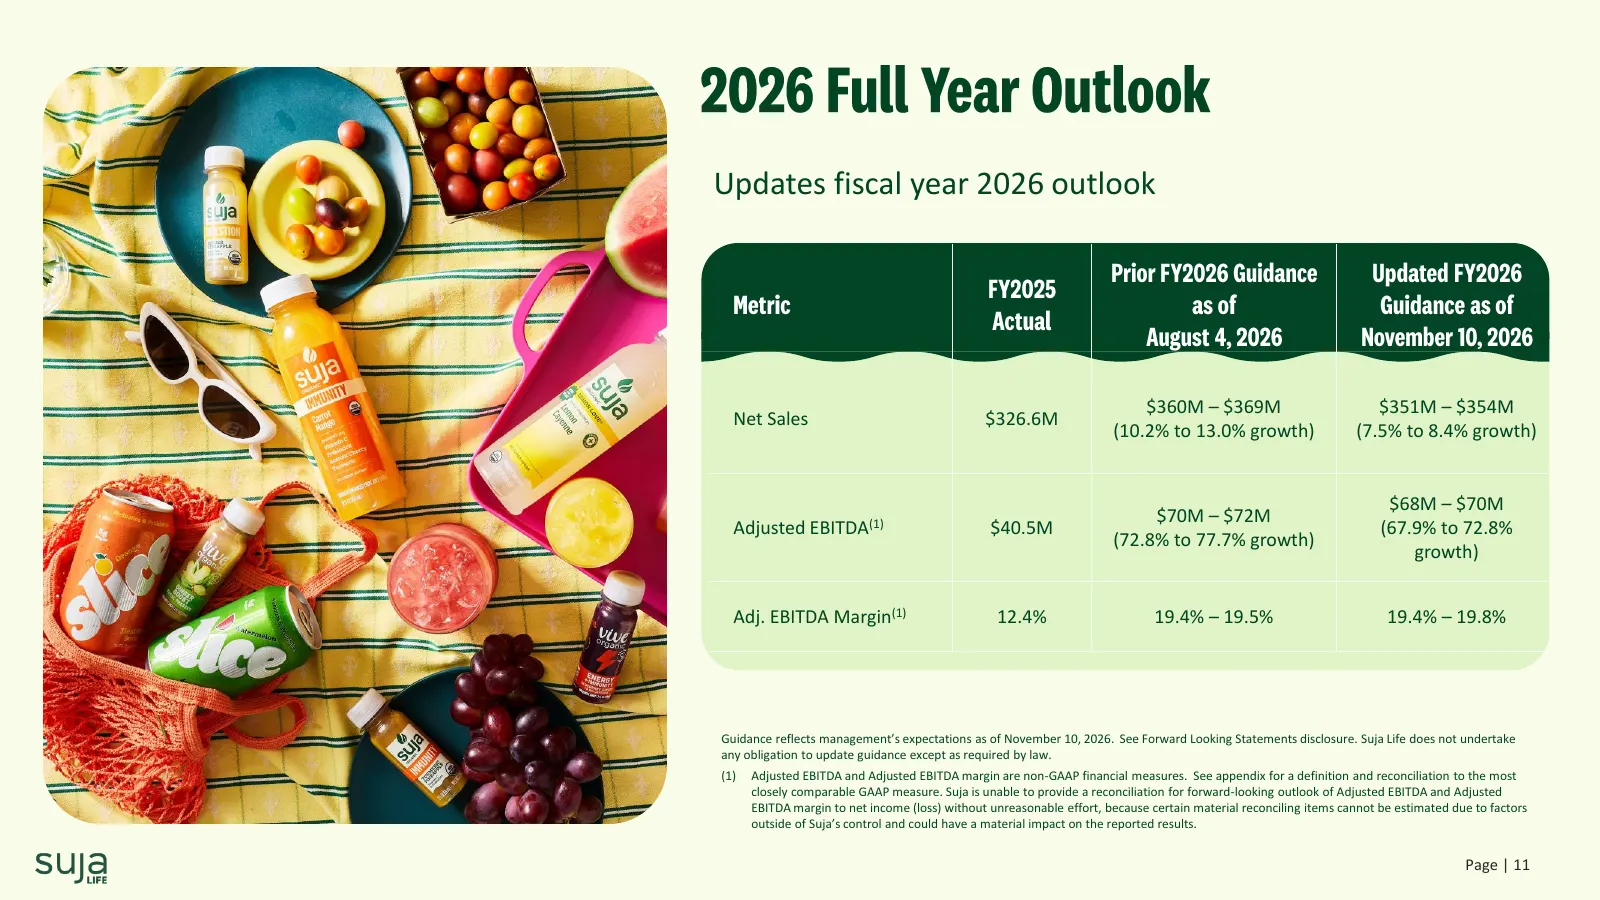
Slide 11: 2026 Full Year Outlook
2026 Full Year Outlook Updates fiscal year 2026 outlook Prior FY2026 Guidance Updated FY2026 FY2025 Metric as of Guidance as of Actual August 4, 2026 November 10, 2026 $360M – $369M $351M – $354M Net Sales $326.6M (10.2% to 13.0% growth) (7.5% to 8.4% growth) $68M – $70M $70M – $72M Adjusted EBITDA(
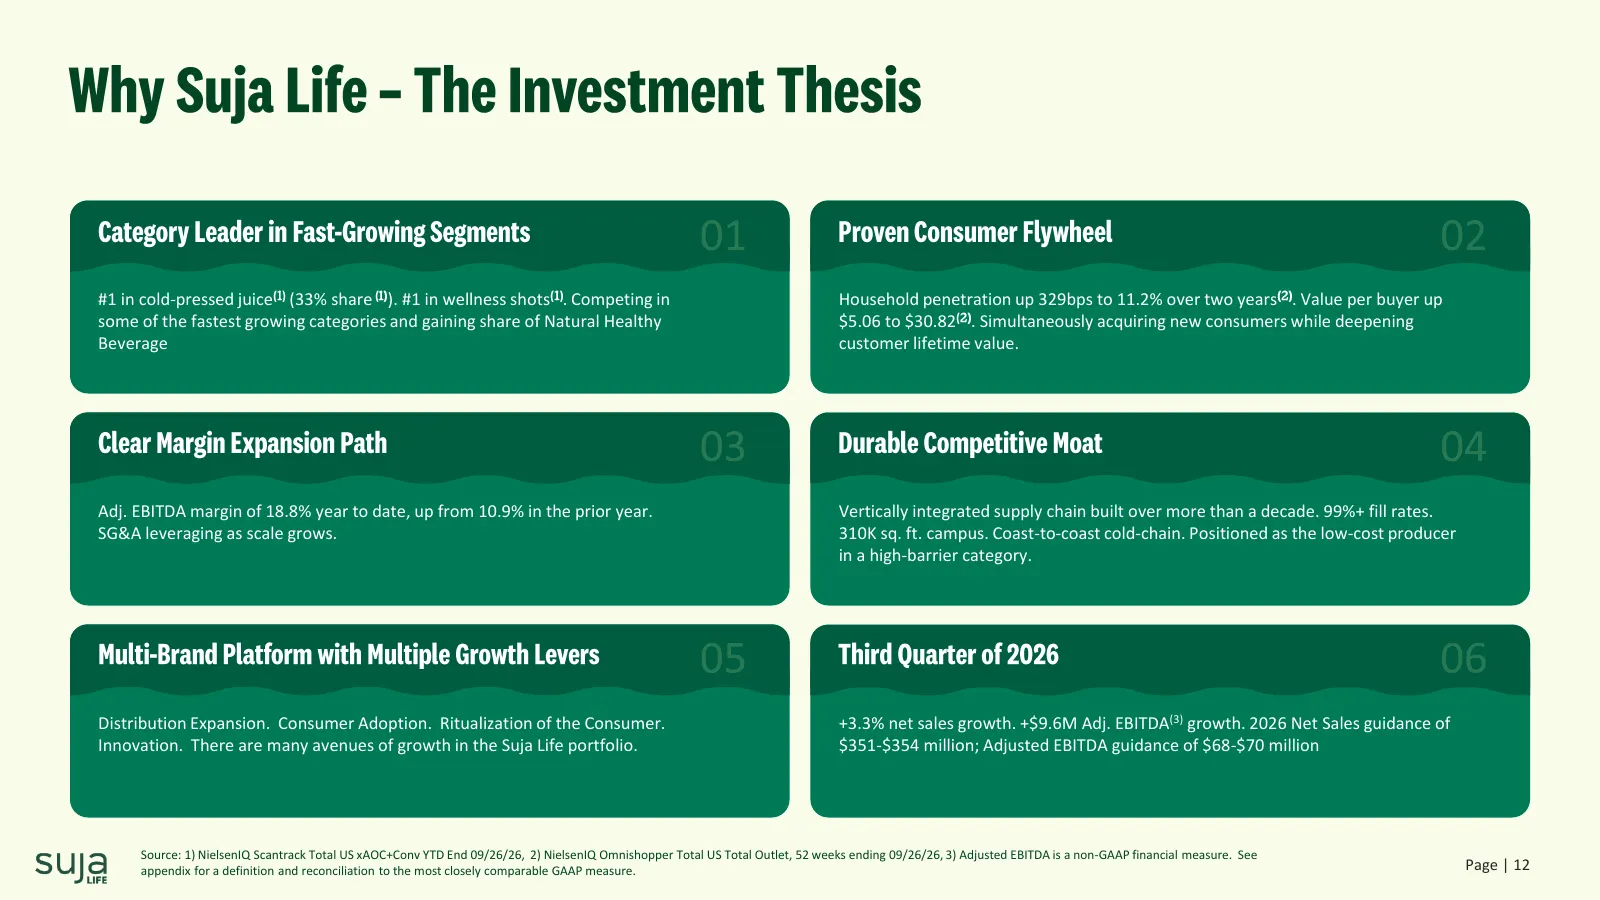
Slide 12: Why Suja Life – The Investment Thesis
Why Suja Life – The Investment Thesis Category Leader in -Growing Fast Segments Proven Consumer Flywheel #1 in cold-pressed juice(1) (33% share (1)). #1 in wellness shots(1). Competing in Household penetration up 329bps to 11.2% over two years(2). Value per buyer up some of the fastest growing categ

Slide 13: Appendix
Appendix
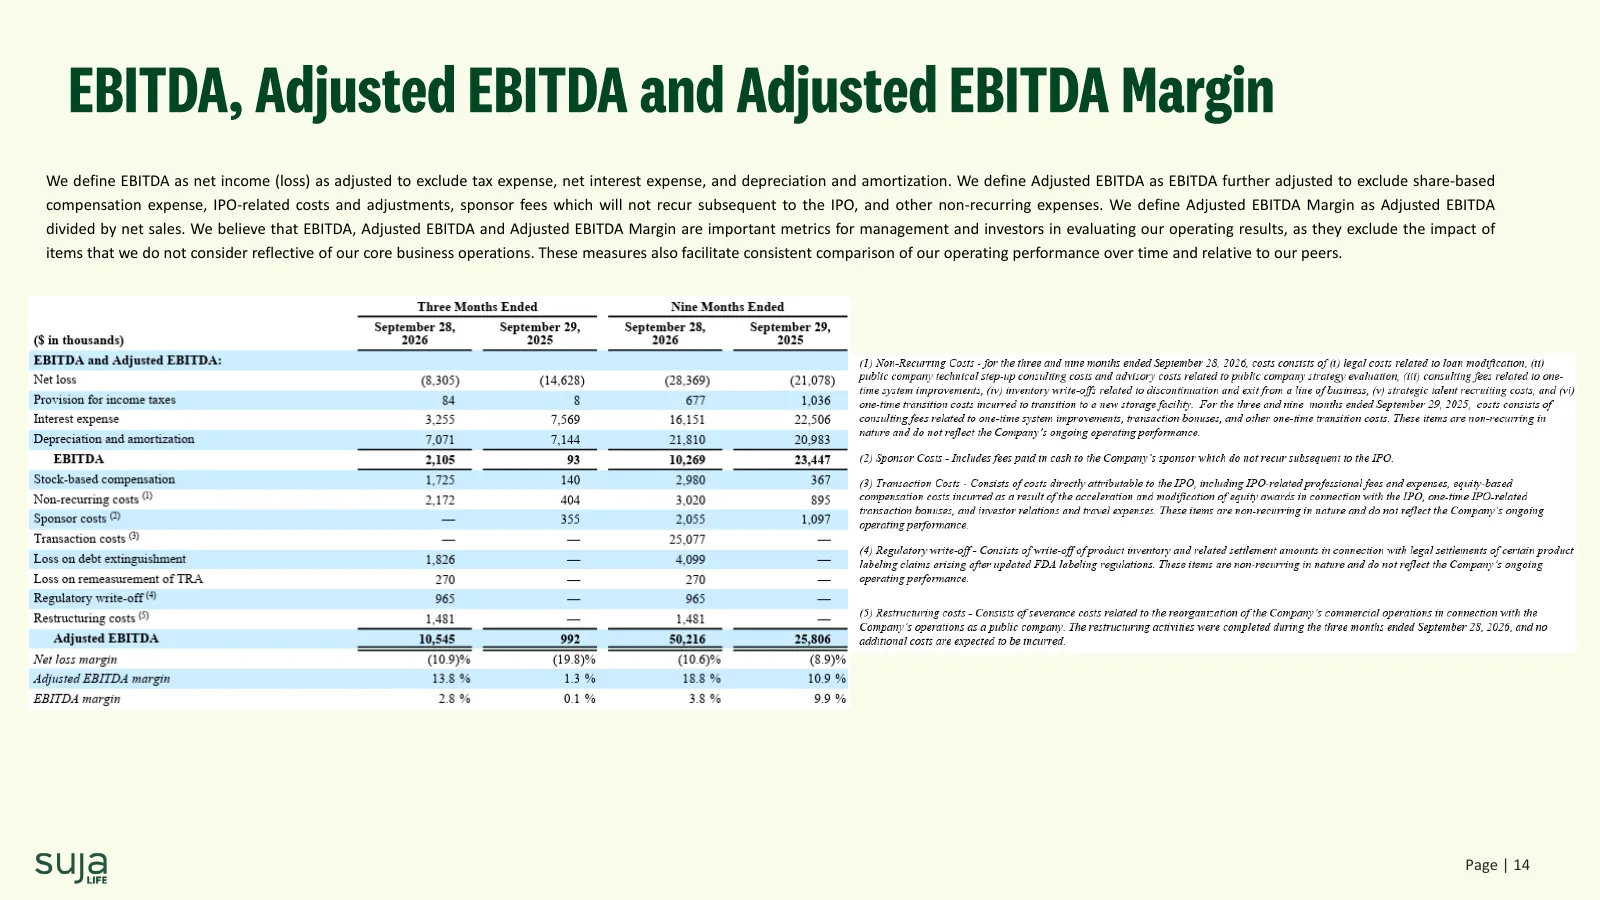
Slide 14: EBITDA, Adjusted EBITDA and Adjusted EBITDA Margin
EBITDA, Adjusted EBITDA and Adjusted EBITDA Margin We define EBITDA as net income (loss) as adjusted to exclude tax expense, net interest expense, and depreciation and amortization. We define Adjusted EBITDA as EBITDA further adjusted to exclude share-based compensation expense, IPO-related costs an
Source: 6ix earnings call