OSG Corp · TSE:6136
OSG — 1H FY2018 Earnings Presentation
15 slides from OSG's earnings presentation, July 2018
Slide 1: Financial Results for FY2018 – 1H
Financial Results for FY2018 – 1H July, 2018 OSG Corporation © 2018 OSG Corporation
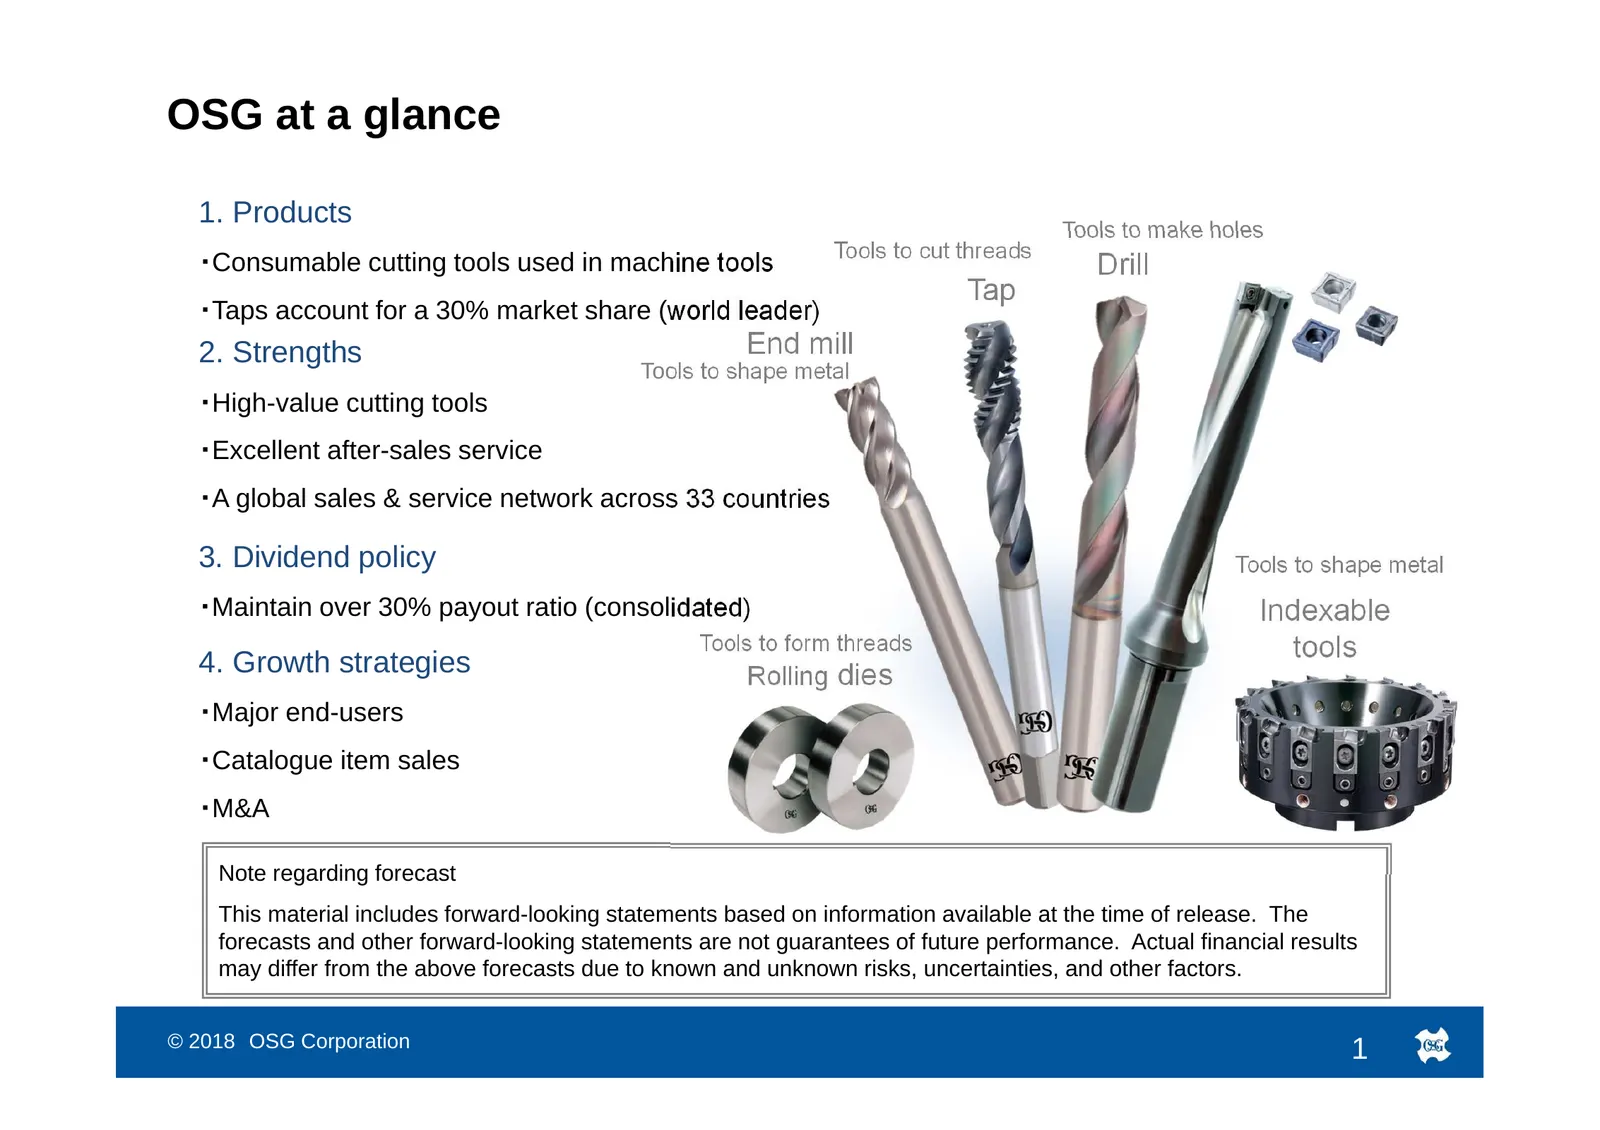
Slide 2: OSG at a glance
OSG at a glance 1. Products Tools to make holes Tools to cut threads ・Consumable cutting tools used in machine tools Drill Tap ・Taps account for a 30% market share (world leader) 2. Strengths End mill Tools to shape metal ・High-value cutting tools ・Excellent after-sales service ・A global sales & ser
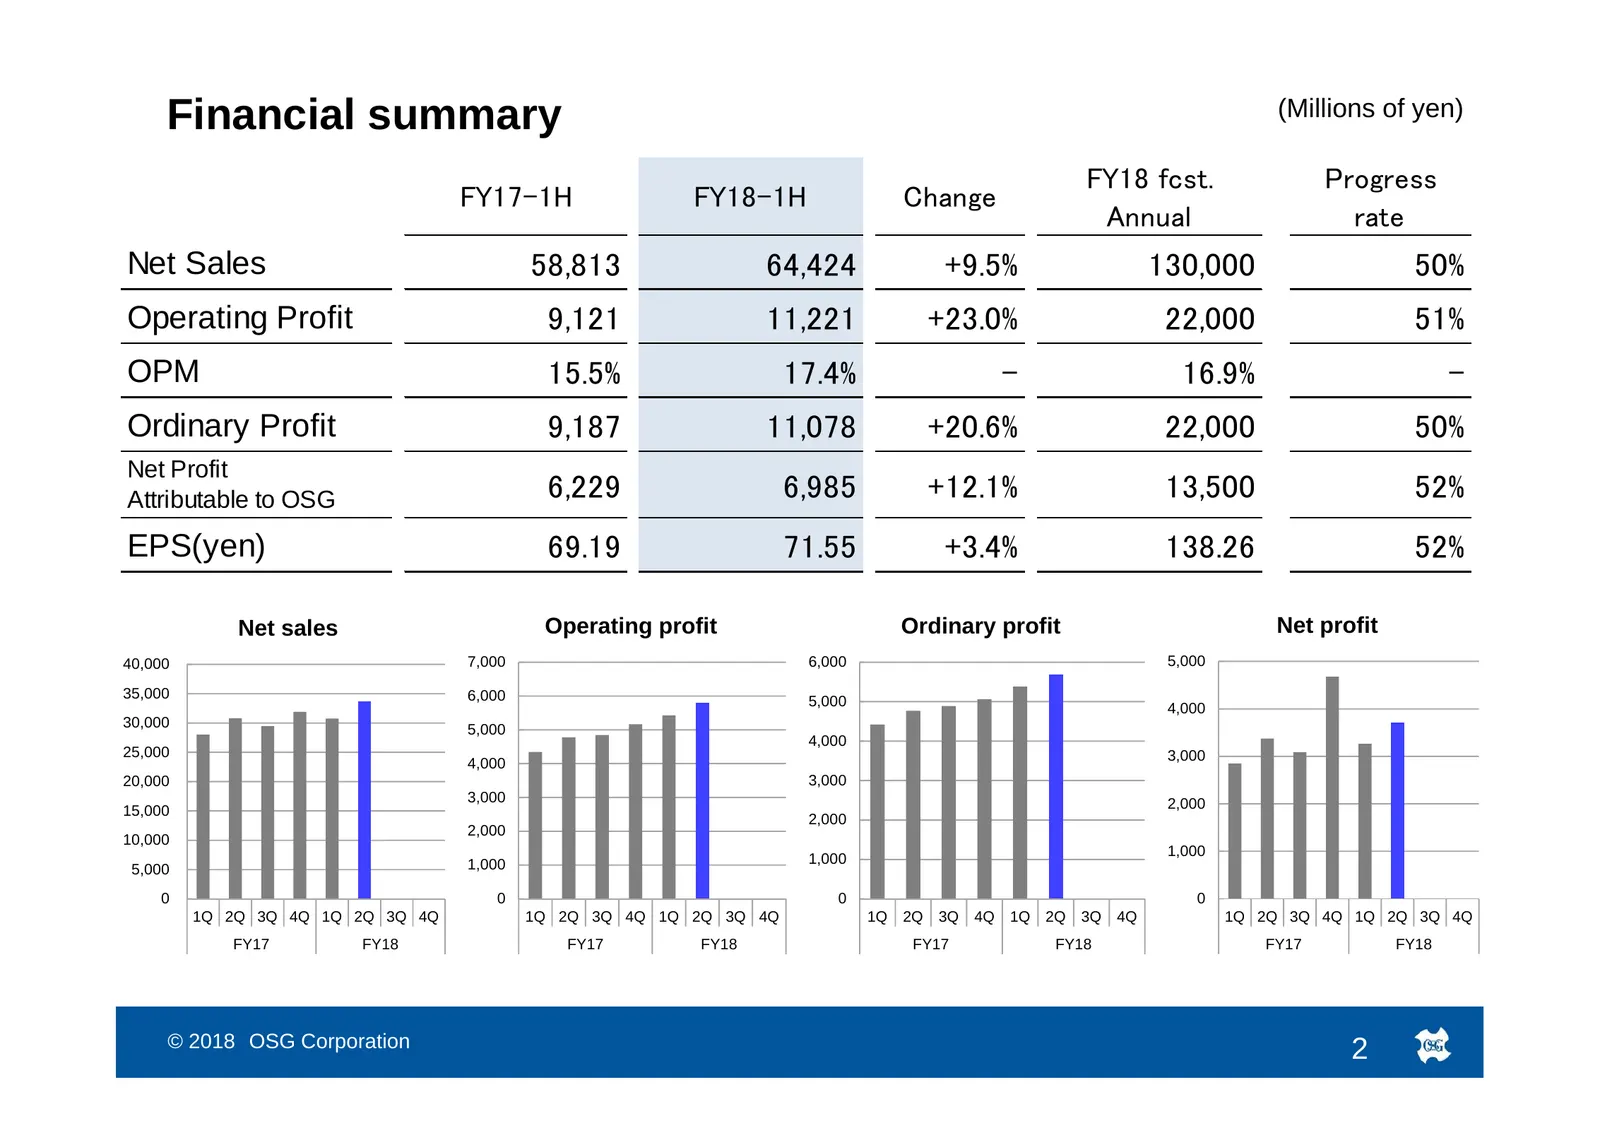
Slide 3: Financial summary
Financial summary (Millions of yen) FY18 fcst. Progress FY17-1H FY18-1H Change Annual rate Net Sales 58,813 64,424 +9.5% 130,000 50% Operating Profit 9,121 11,221 +23.0% 22,000 51% OPM 15.5% 17.4% - 16.9% - Ordinary Profit 9,187 11,078 +20.6% 22,000 50% Net Profit Attributable to OSG 6,229 6,985 +12
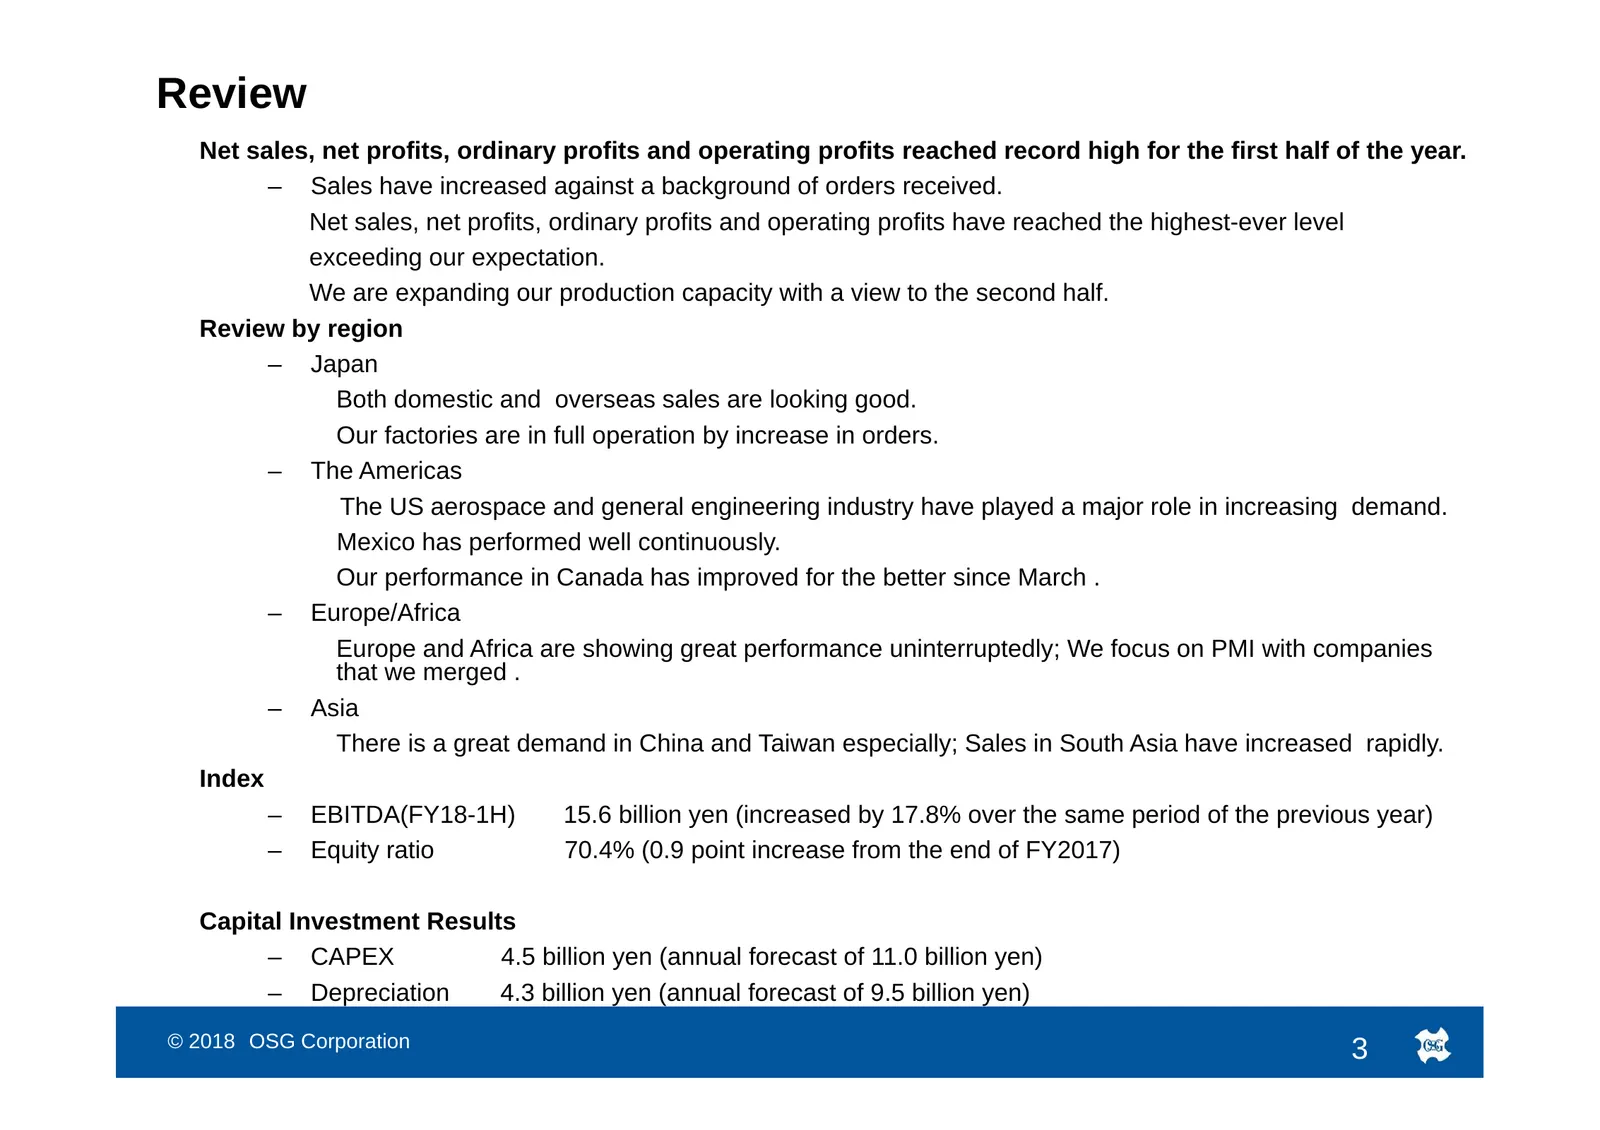
Slide 4: Review
Review Net sales, net profits, ordinary profits and operating profits reached record high for the first half of the year. – Sales have increased against a background of orders received. Net sales, net profits, ordinary profits and operating profits have reached the highest-ever level exceeding our e
Slide 5: Sales to Customer
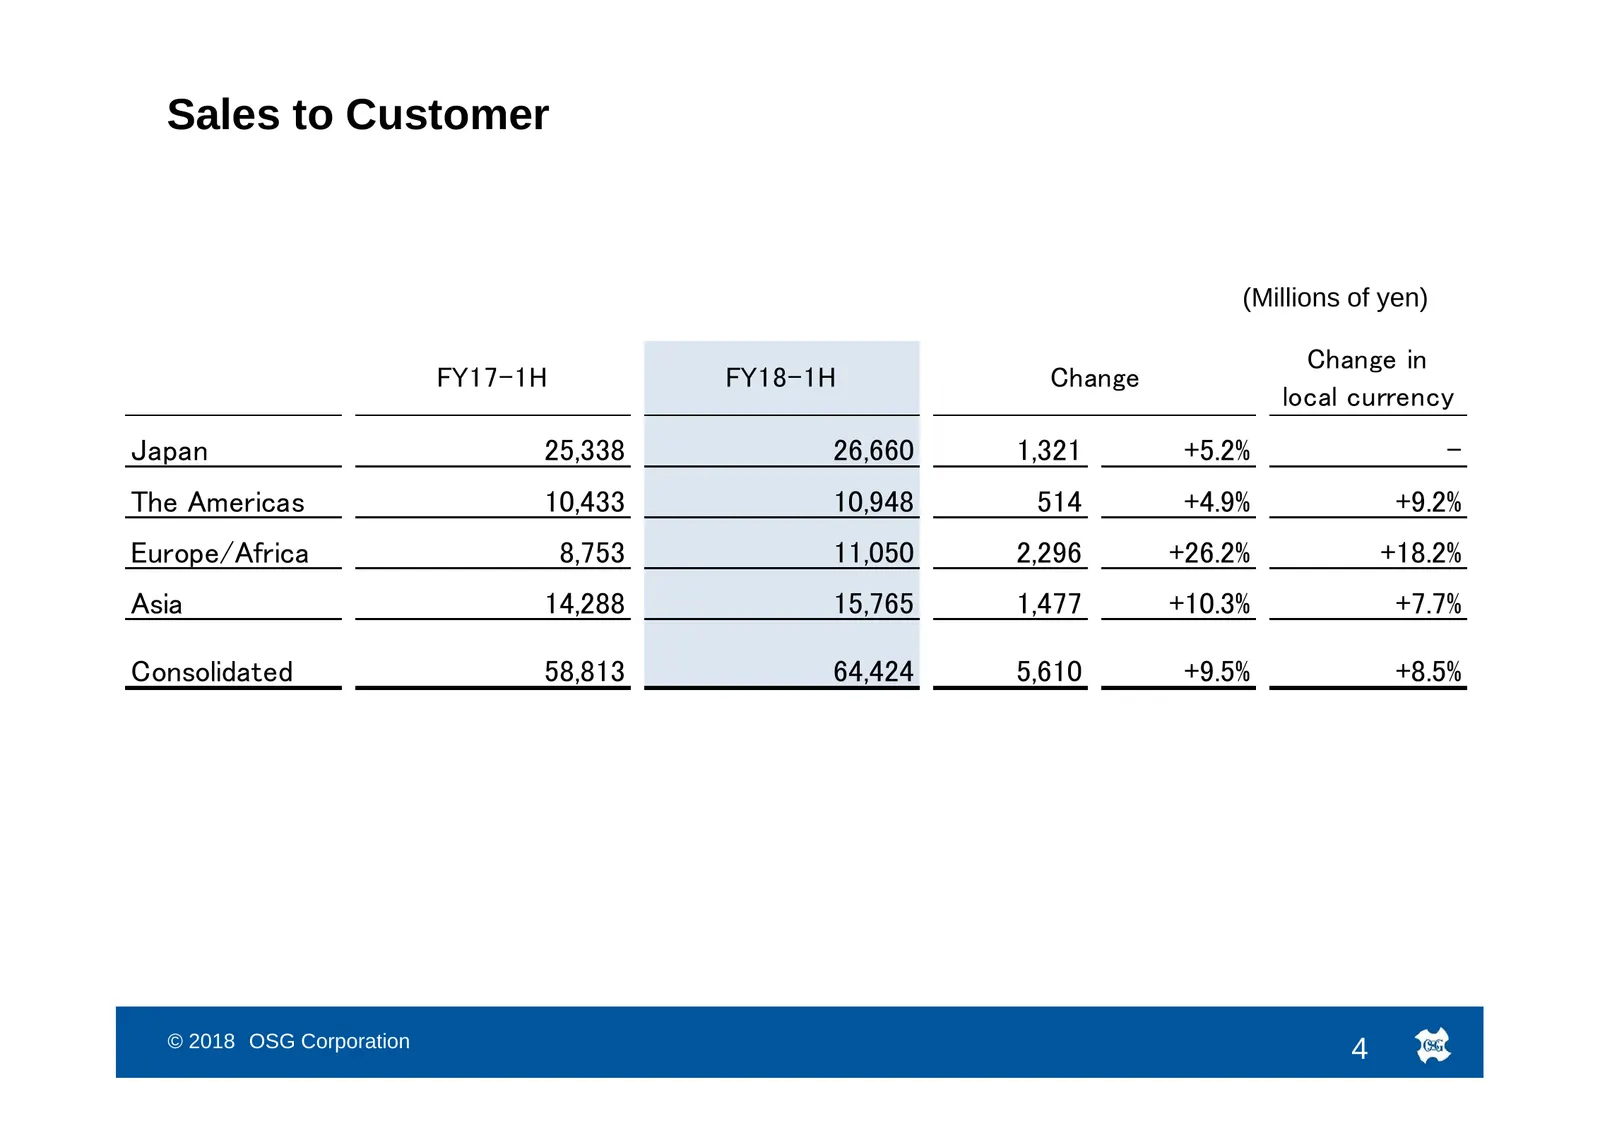
Sales to Customer (Millions of yen) Change in FY17-1H FY18-1H Change local currency Japan 25,338 26,660 1,321 +5.2% - The Americas 10,433 10,948 514 +4.9% +9.2% Europe/Africa 8,753 11,050 2,296 +26.2% +18.2% Asia 14,288 15,765 1,477 +10.3% +7.7% Consolidated 58,813 64,424 5,610 +9.5% +8.5% © 2018 OS
Slide 6: Sales to Customer
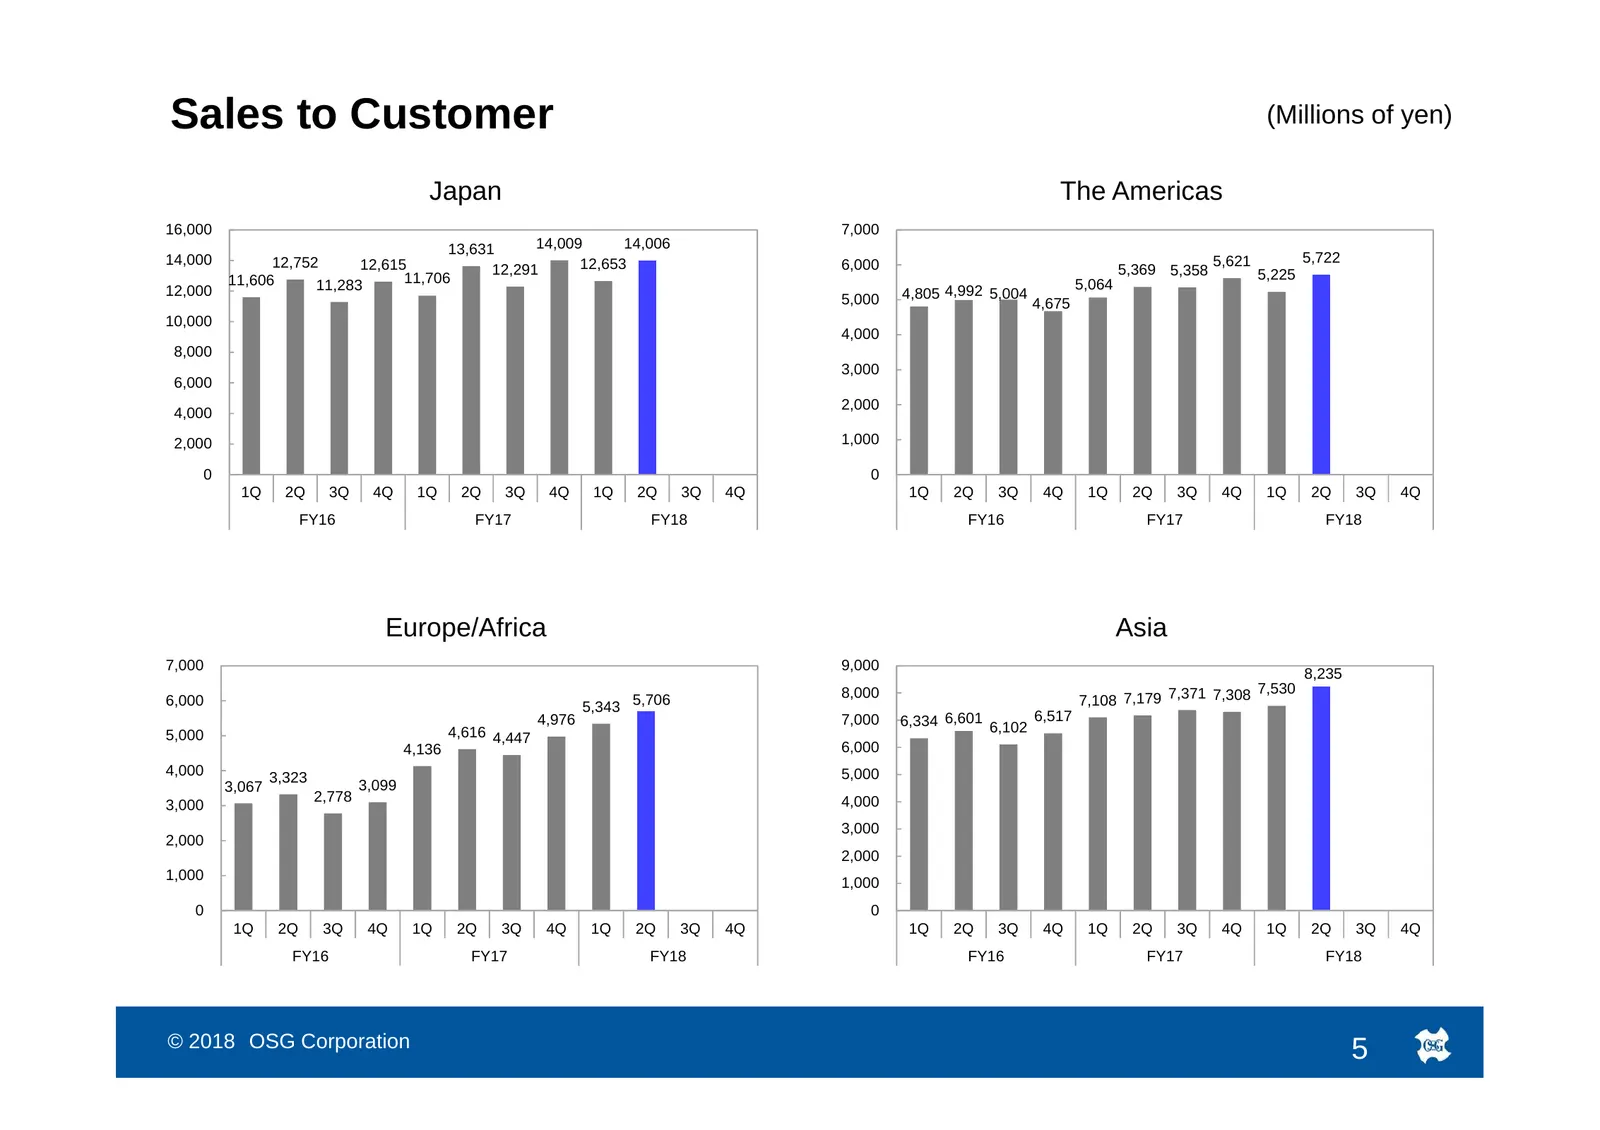
Sales to Customer (Millions of yen) Japan The Americas 16,000 7,000 13,631 14,009 14,006 14,000 12,752 12,615 12,653 6,000 5,621 5,722 12,291 5,369 5,358 5,225 11,606 11,283 11,706 5,064 12,000 4,805 4,992 5,004 5,000 4,675 10,000 4,000 8,000 3,000 6,000 2,000 4,000 2,000 1,000 0 0 1Q 2Q 3Q 4Q 1Q 2Q
Slide 7: Operating Income
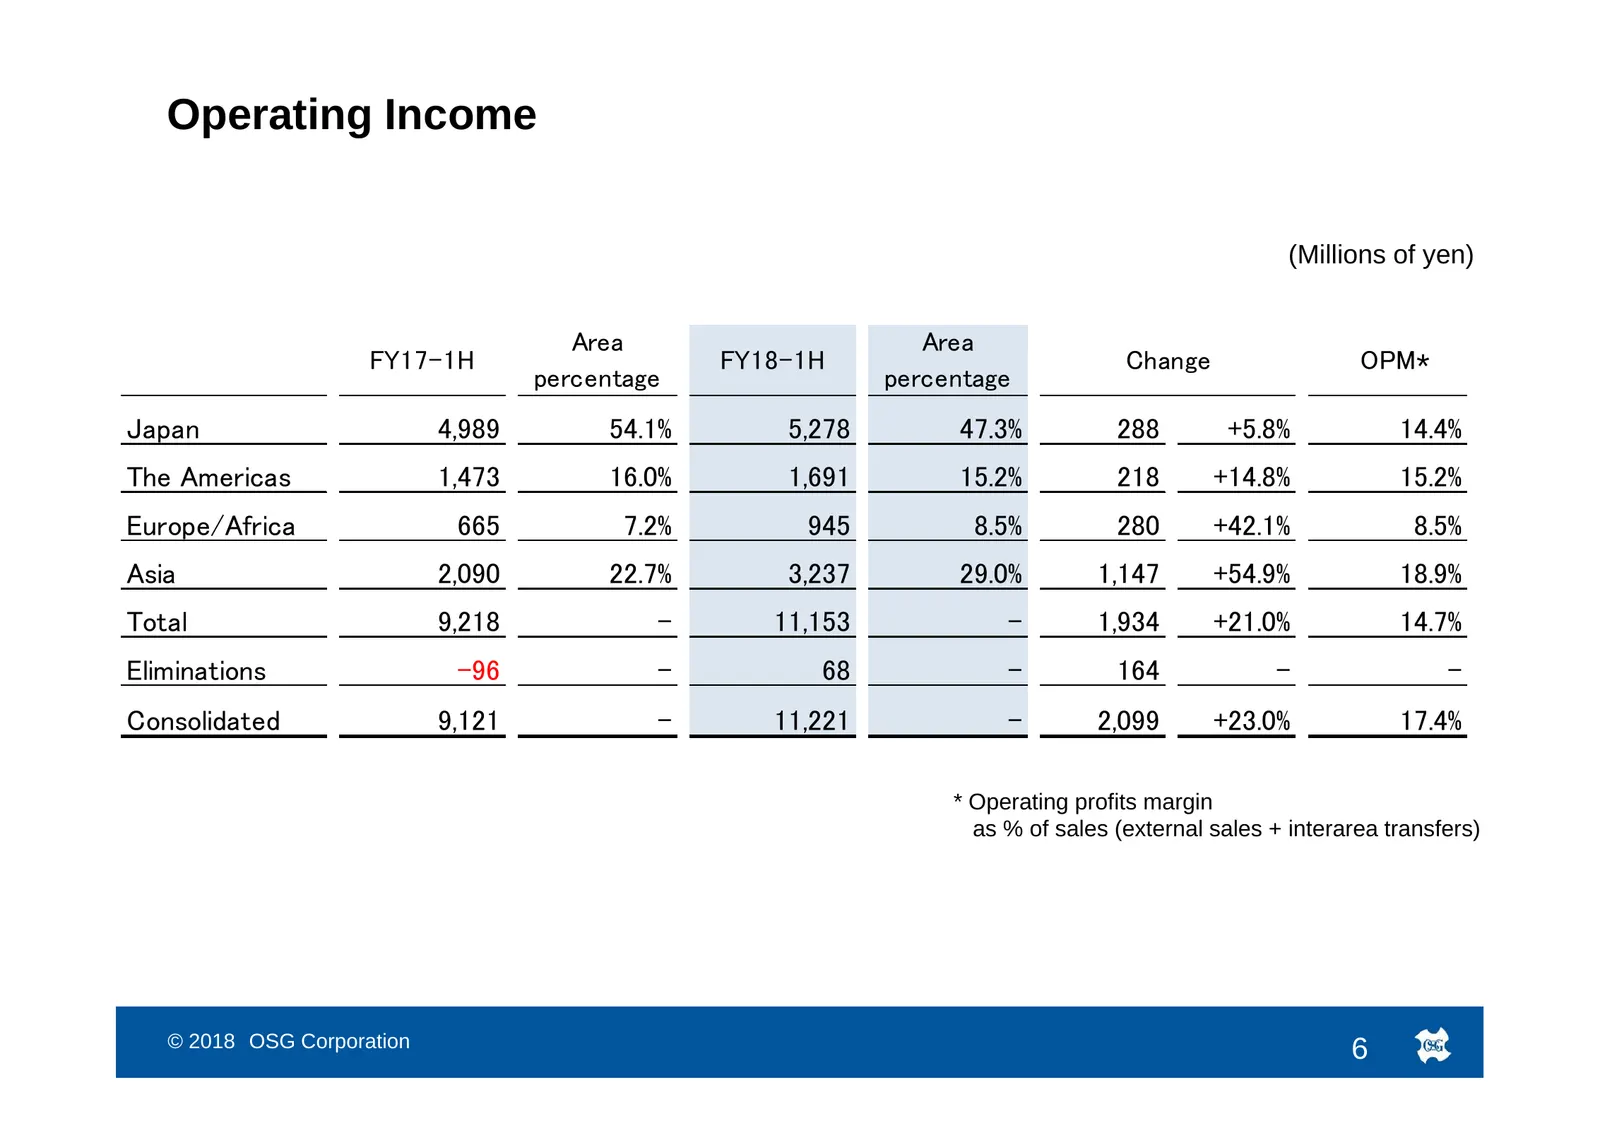
Operating Income (Millions of yen) Area Area FY17-1H FY18-1H Change OPM * percentage percentage Japan 4,989 54.1% 5,278 47.3% 288 +5.8% 14.4% The Americas 1,473 16.0% 1,691 15.2% 218 +14.8% 15.2% Europe/Africa 665 7.2% 945 8.5% 280 +42.1% 8.5% Asia 2,090 22.7% 3,237 29.0% 1,147 +54.9% 18.9% Total 9,
Slide 8: Operating Income
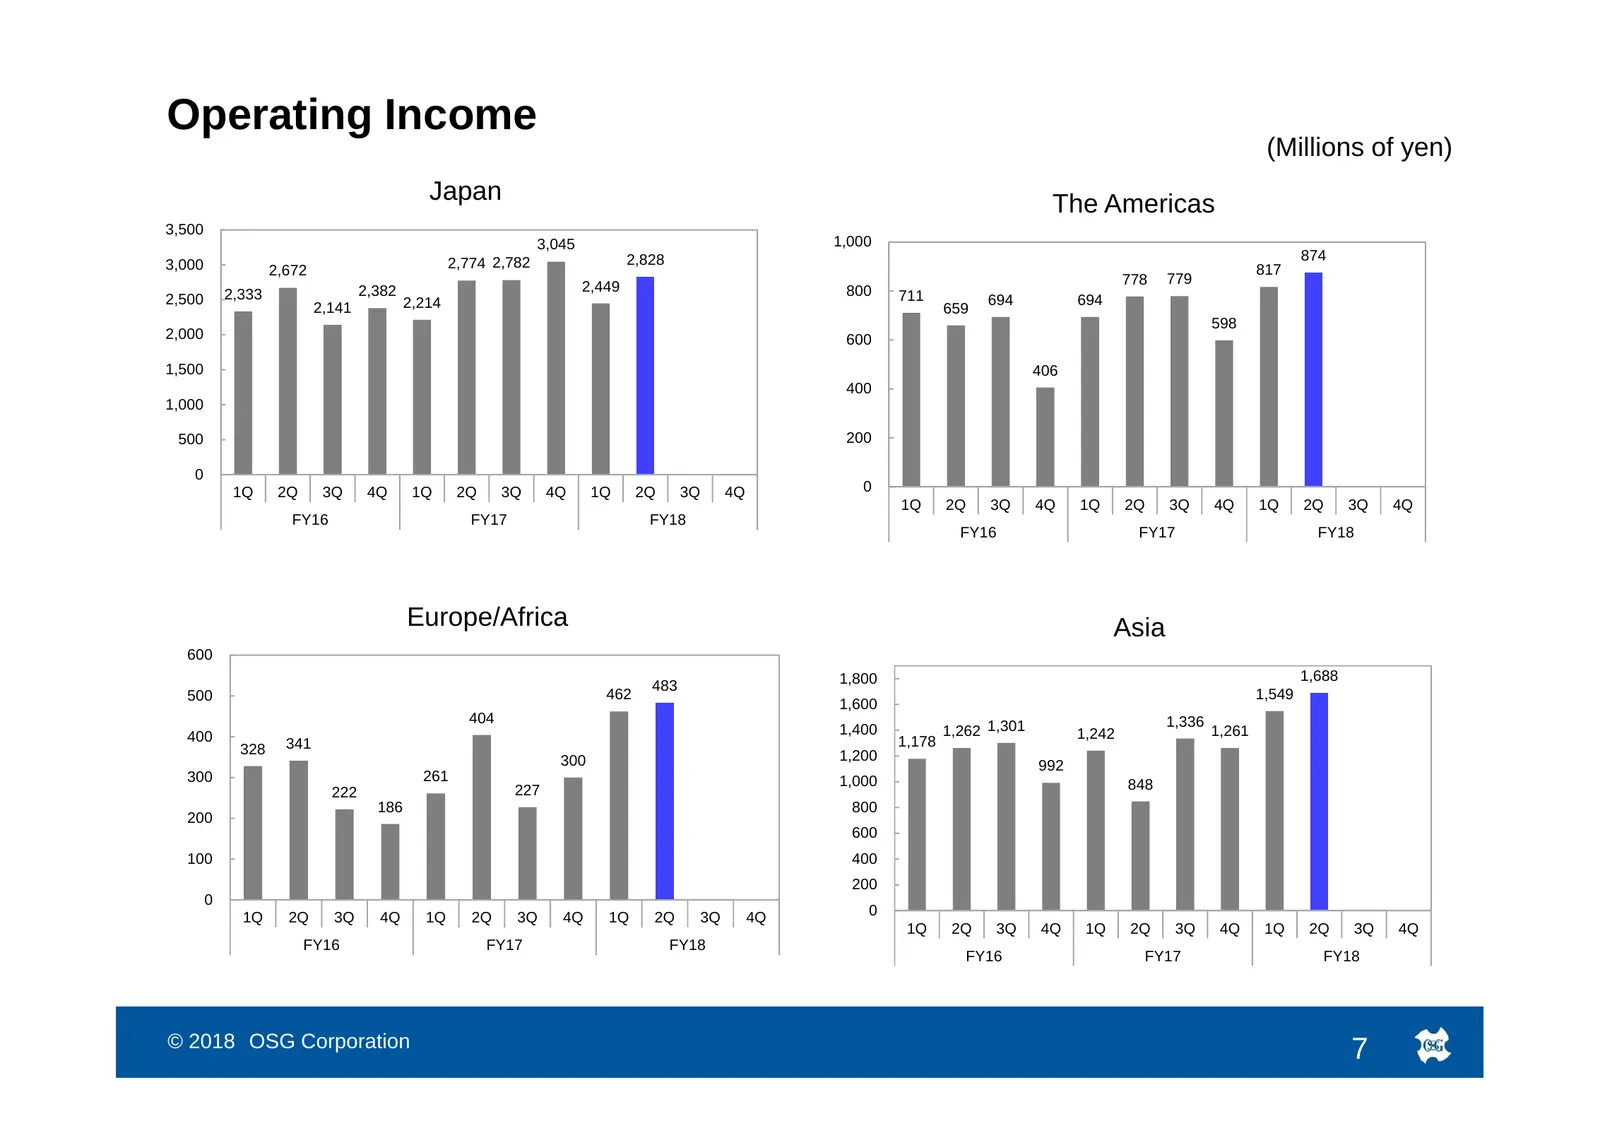
Operating Income (Millions of yen) Japan The Americas 3,500 3,045 1,000 2,828 874 3,000 2,672 2,774 2,782 817 2,449 778 779 2,333 2,382 800 711 2,500 2,214 694 694 2,141 659 598 2,000 600 1,500 406 400 1,000 500 200 0 1Q 2Q 3Q 4Q 1Q 2Q 3Q 4Q 1Q 2Q 3Q 4Q 0 1Q 2Q 3Q 4Q 1Q 2Q 3Q 4Q 1Q 2Q 3Q 4Q FY16 FY1
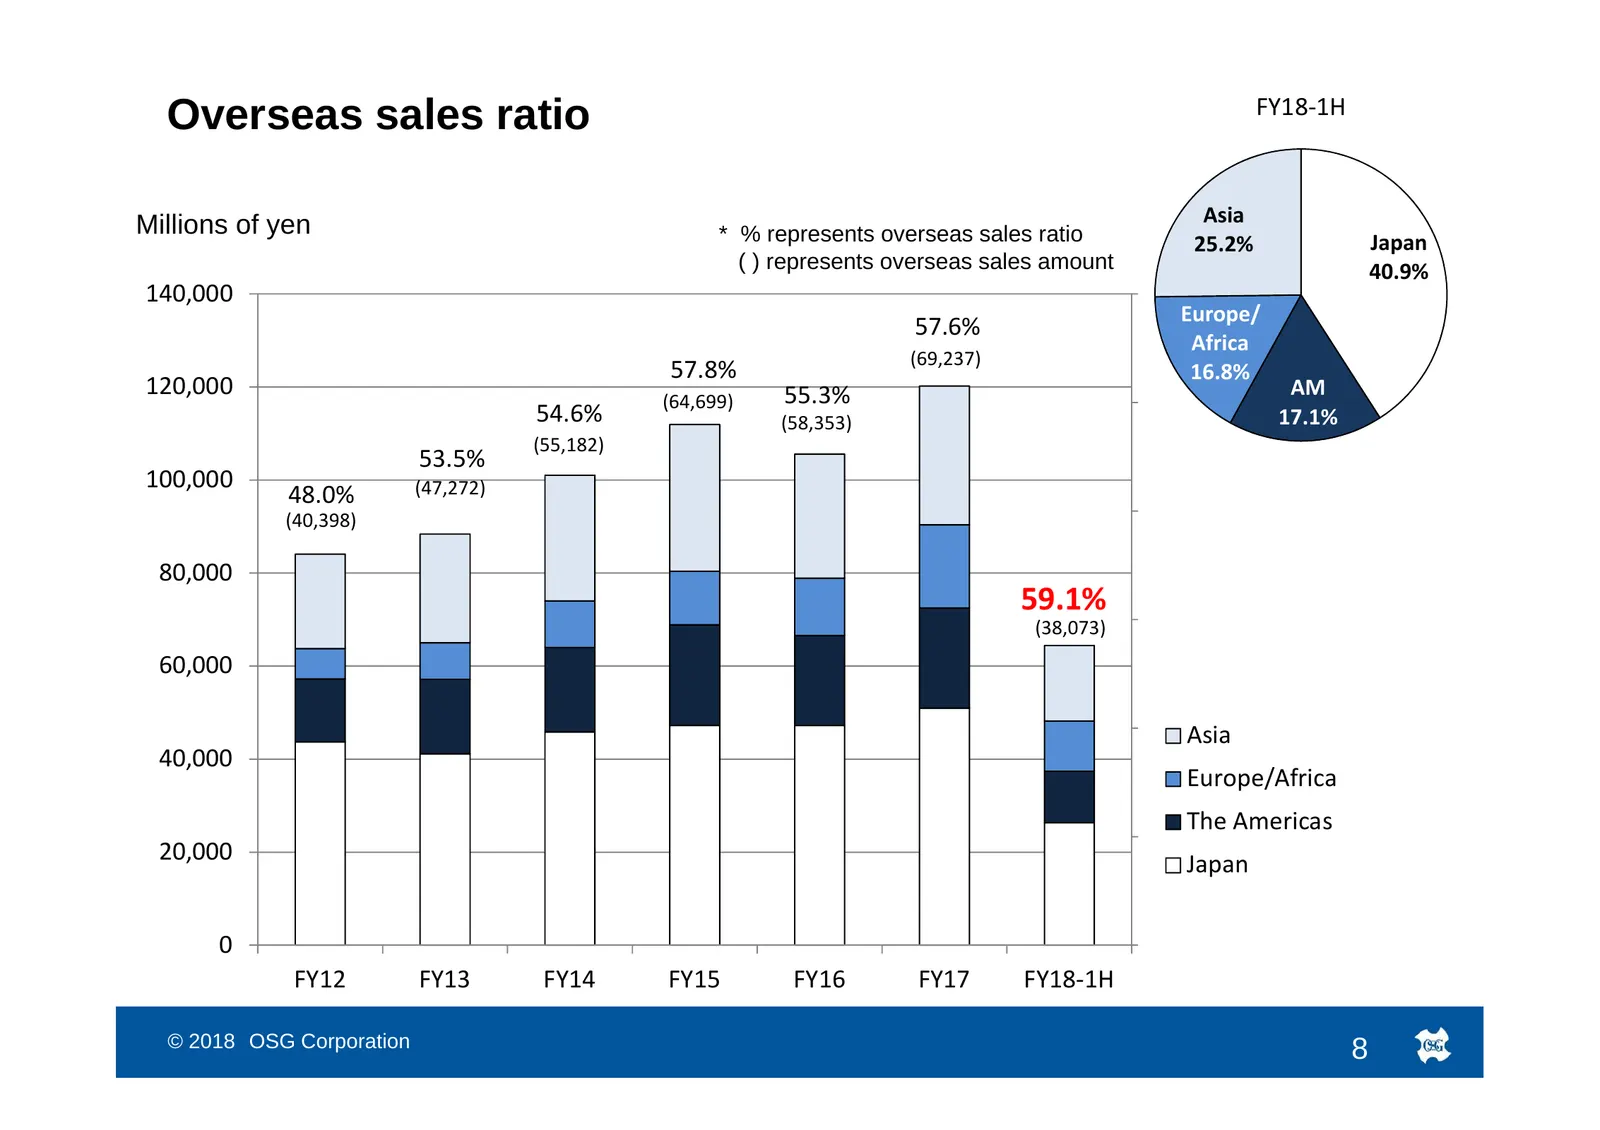
Slide 9: Overseas sales ratio
FY18-1H Overseas sales ratio Millions of yen Asia * % represents overseas sales ratio 25.2% Japan ( ) represents overseas sales amount 40.9% 140,000 60.0% Europe/ 57.6% Africa (69,237) 57.8% 16.8% 120,000 55.3% AM (64,699) 50.0% 54.6% (58,353) 17.1% (55,182) 53.5% 100,000 (47,272) 48.0% 40.0% (40,39
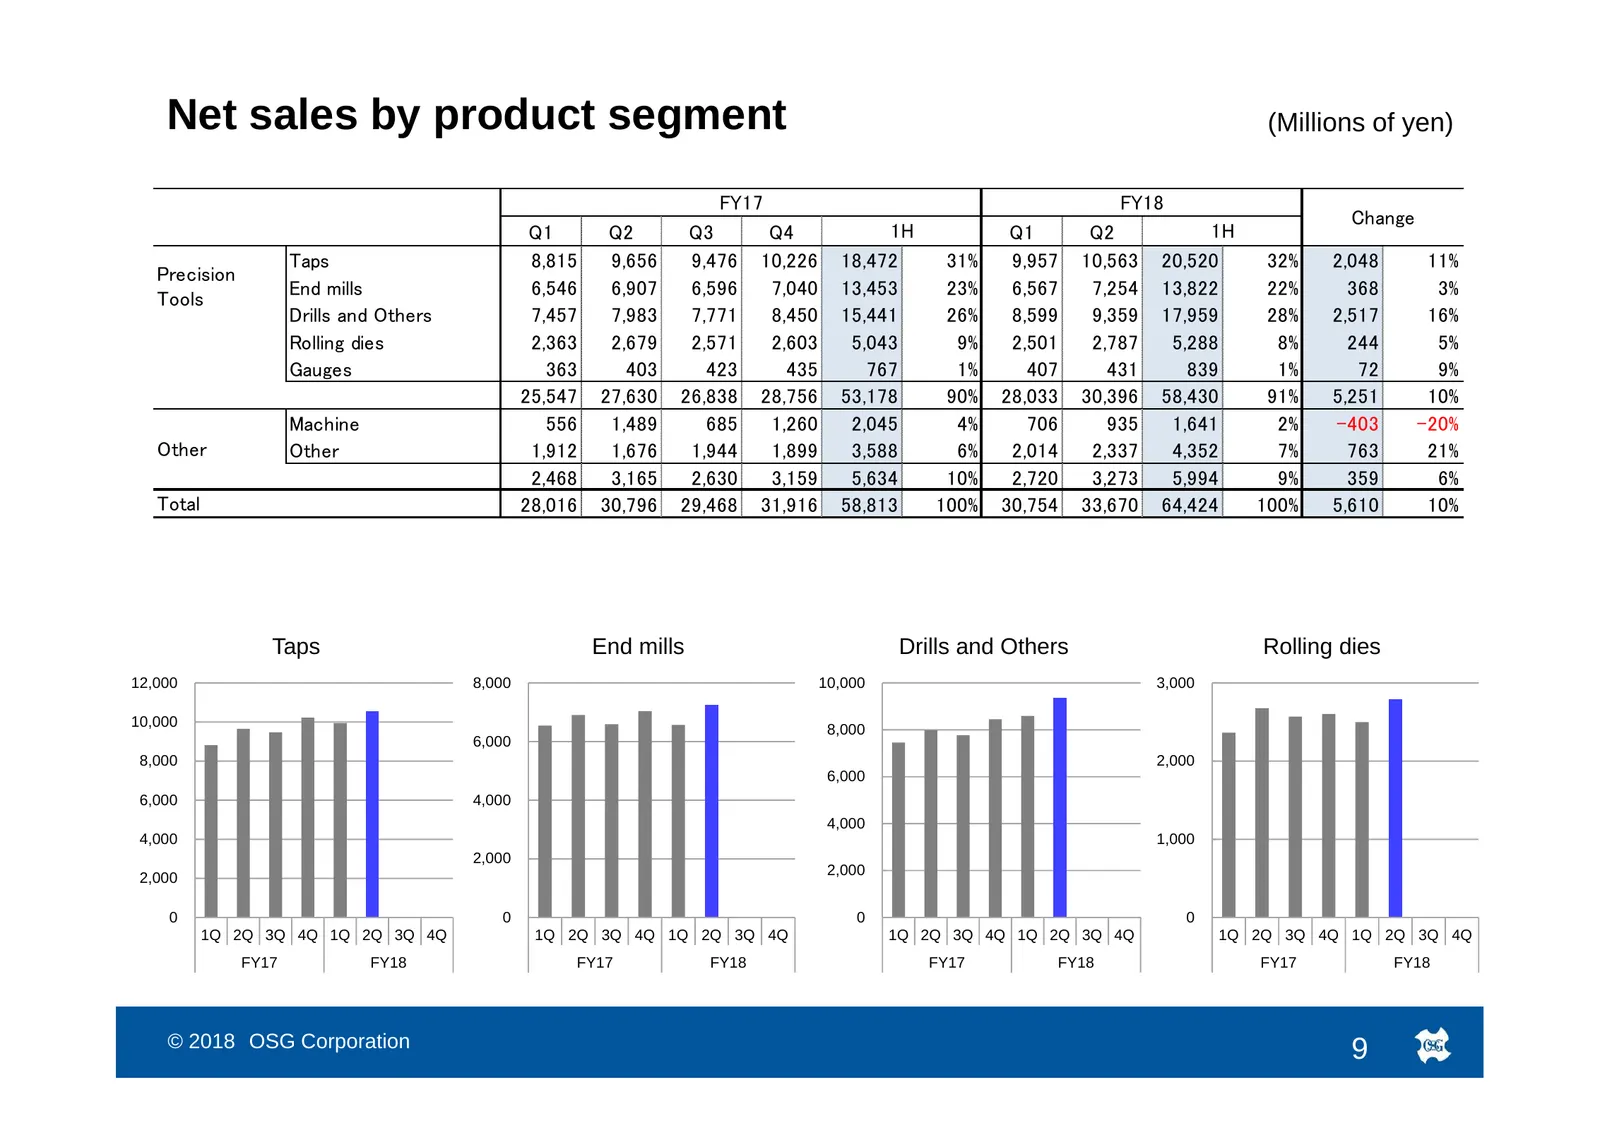
Slide 10: Net sales by product segment
Net sales by product segment (Millions of yen) FY17 FY18 Change Q1 Q2 Q3 Q4 1H Q1 Q2 1H Taps 8,815 9,656 9,476 10,226 18,472 31% 9,957 10,563 20,520 32% 2,048 11% Precision End mills 6,546 6,907 6,596 7,040 13,453 23% 6,567 7,254 13,822 22% 368 3% Tools Drills and Others 7,457 7,983 7,771 8,450 15,4
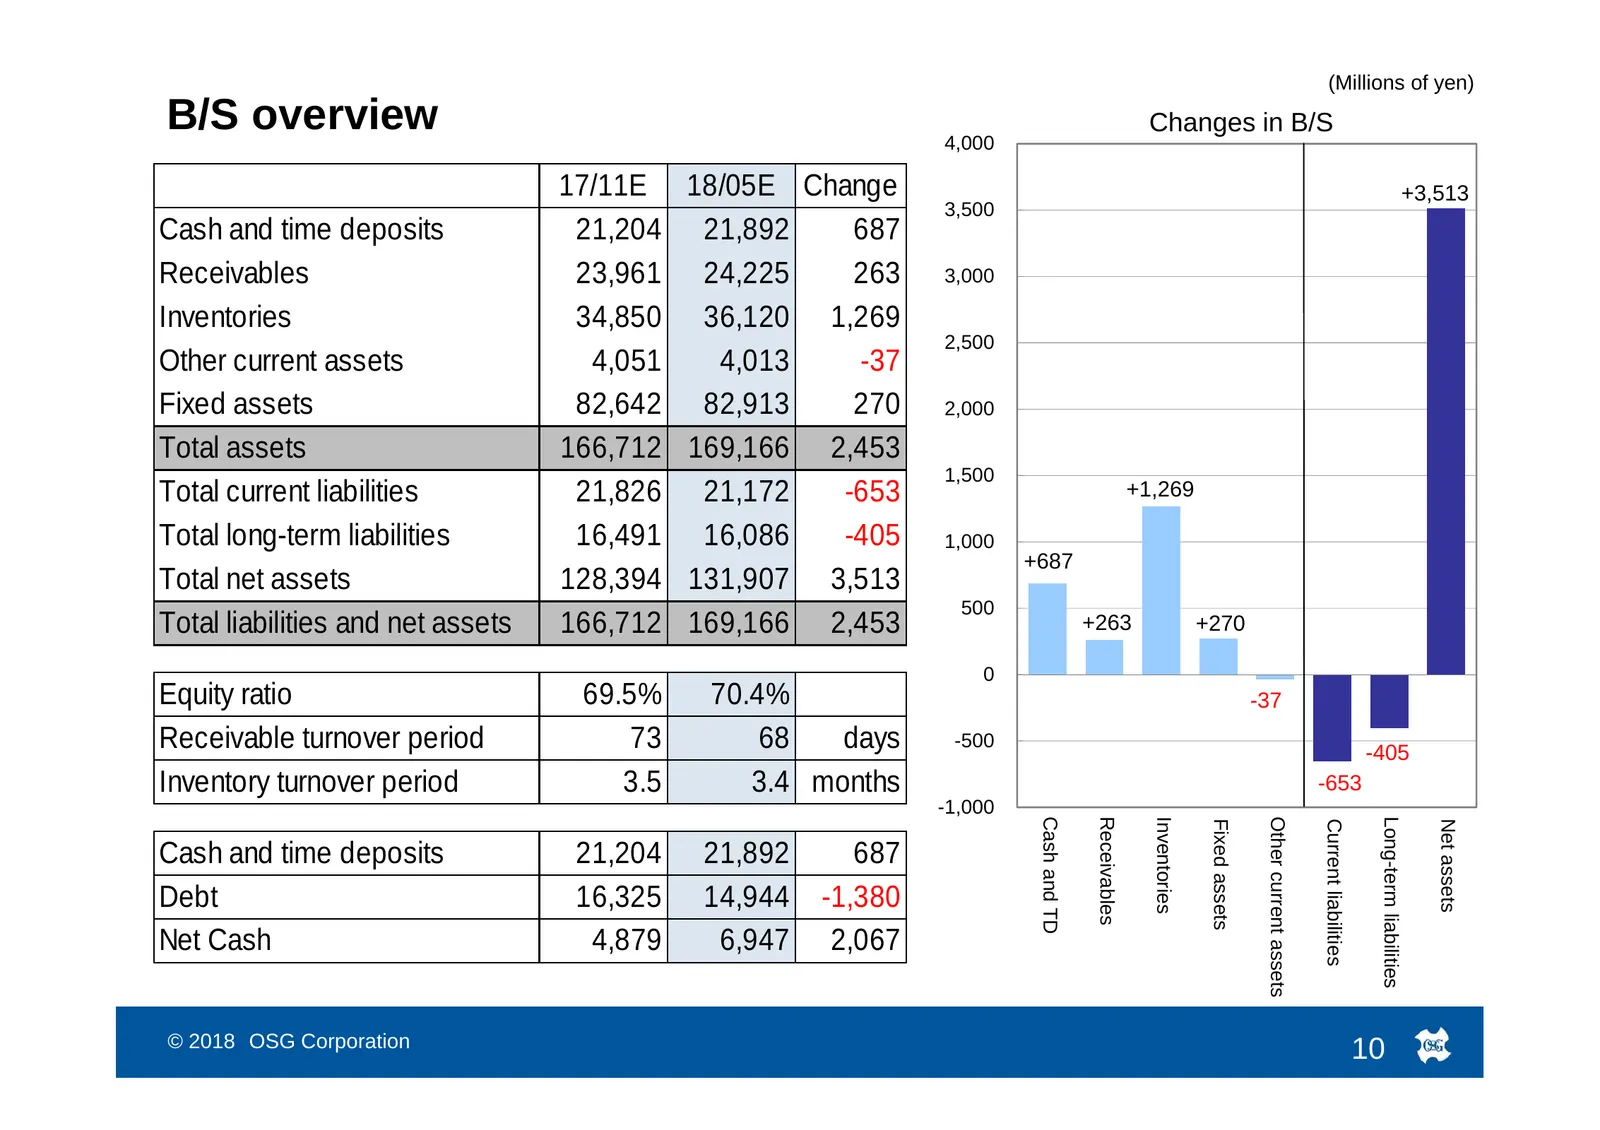
Slide 11: B/S overview
(Millions of yen) B/S overview 4,000 Changes in B/S 17/11E 18/05E Change +3,513 3,500 Cash and time deposits 21,204 21,892 687 Receivables 23,961 24,225 263 3,000 Inventories 34,850 36,120 1,269 2,500 Other current assets 4,051 4,013 -37 Fixed assets 82,642 82,913 270 2,000 Total assets 166,712 169,
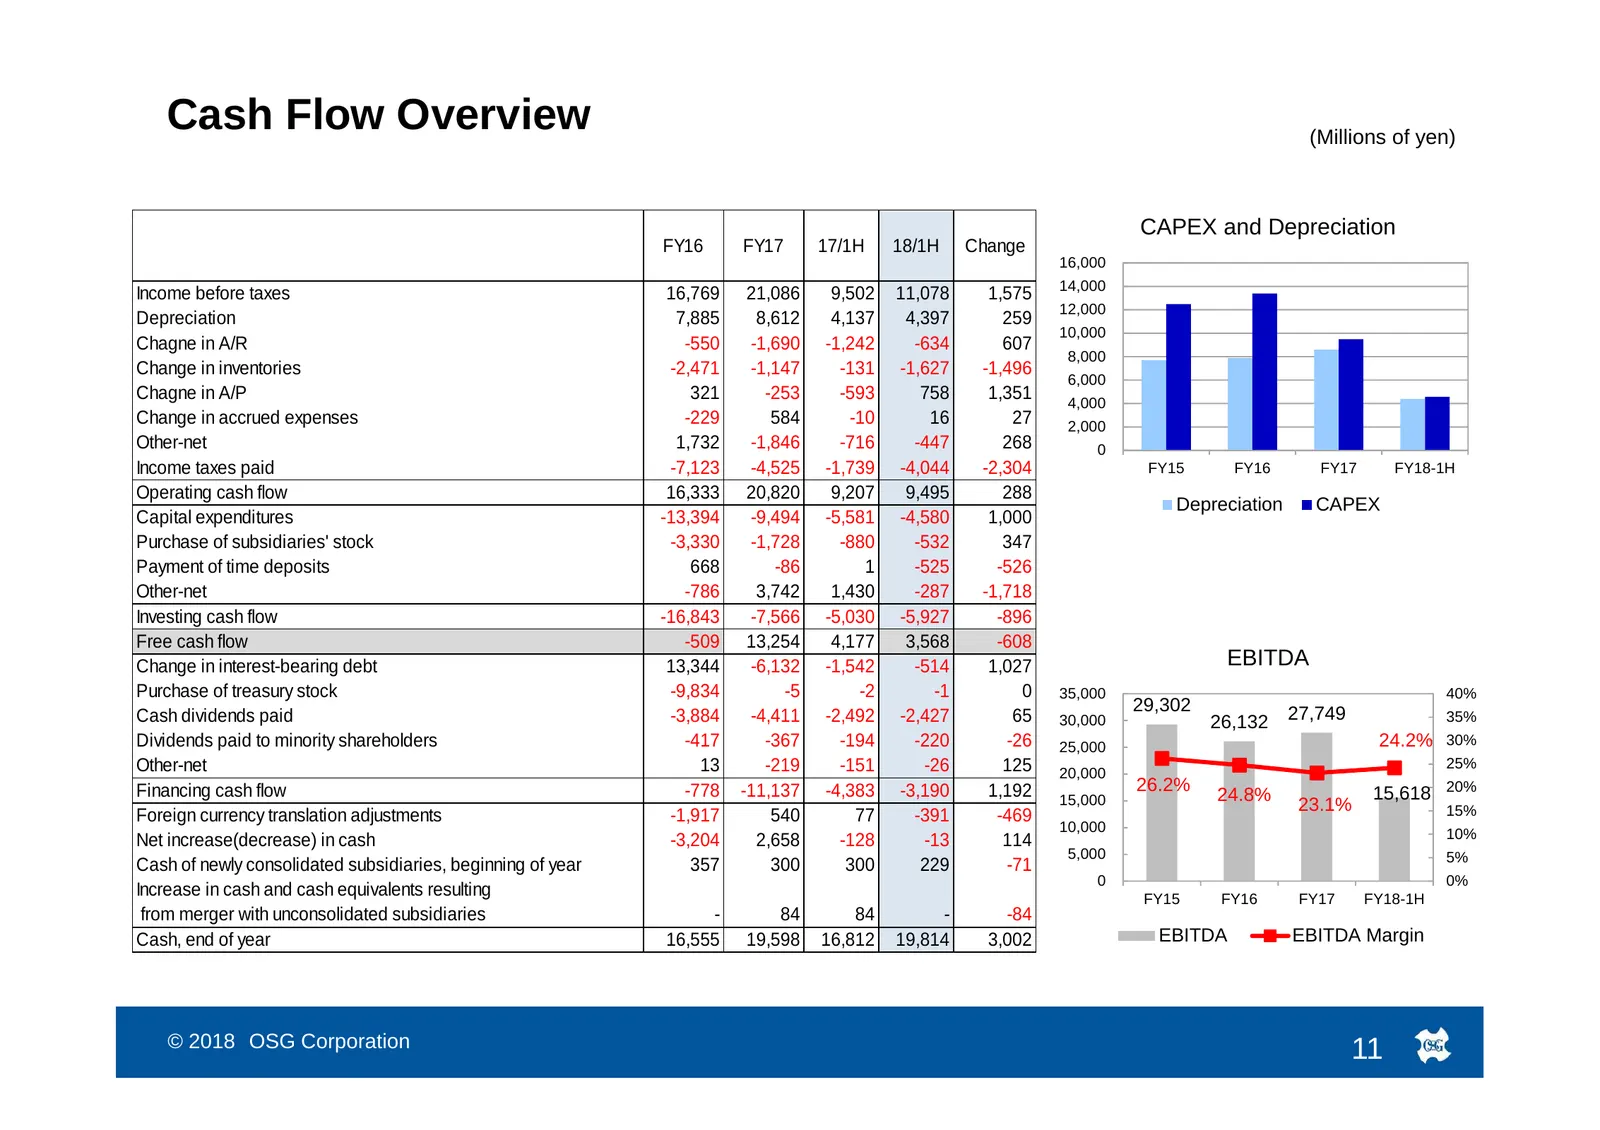
Slide 12: Cash Flow Overview
Cash Flow Overview (Millions of yen) CAPEX and Depreciation FY16 FY17 17/1H 18/1H Change 16,000 14,000 Income before taxes 16,769 21,086 9,502 11,078 1,575 12,000 Depreciation 7,885 8,612 4,137 4,397 259 10,000 Chagne in A/R -550 -1,690 -1,242 -634 607 8,000 Change in inventories -2,471 -1,147 -131
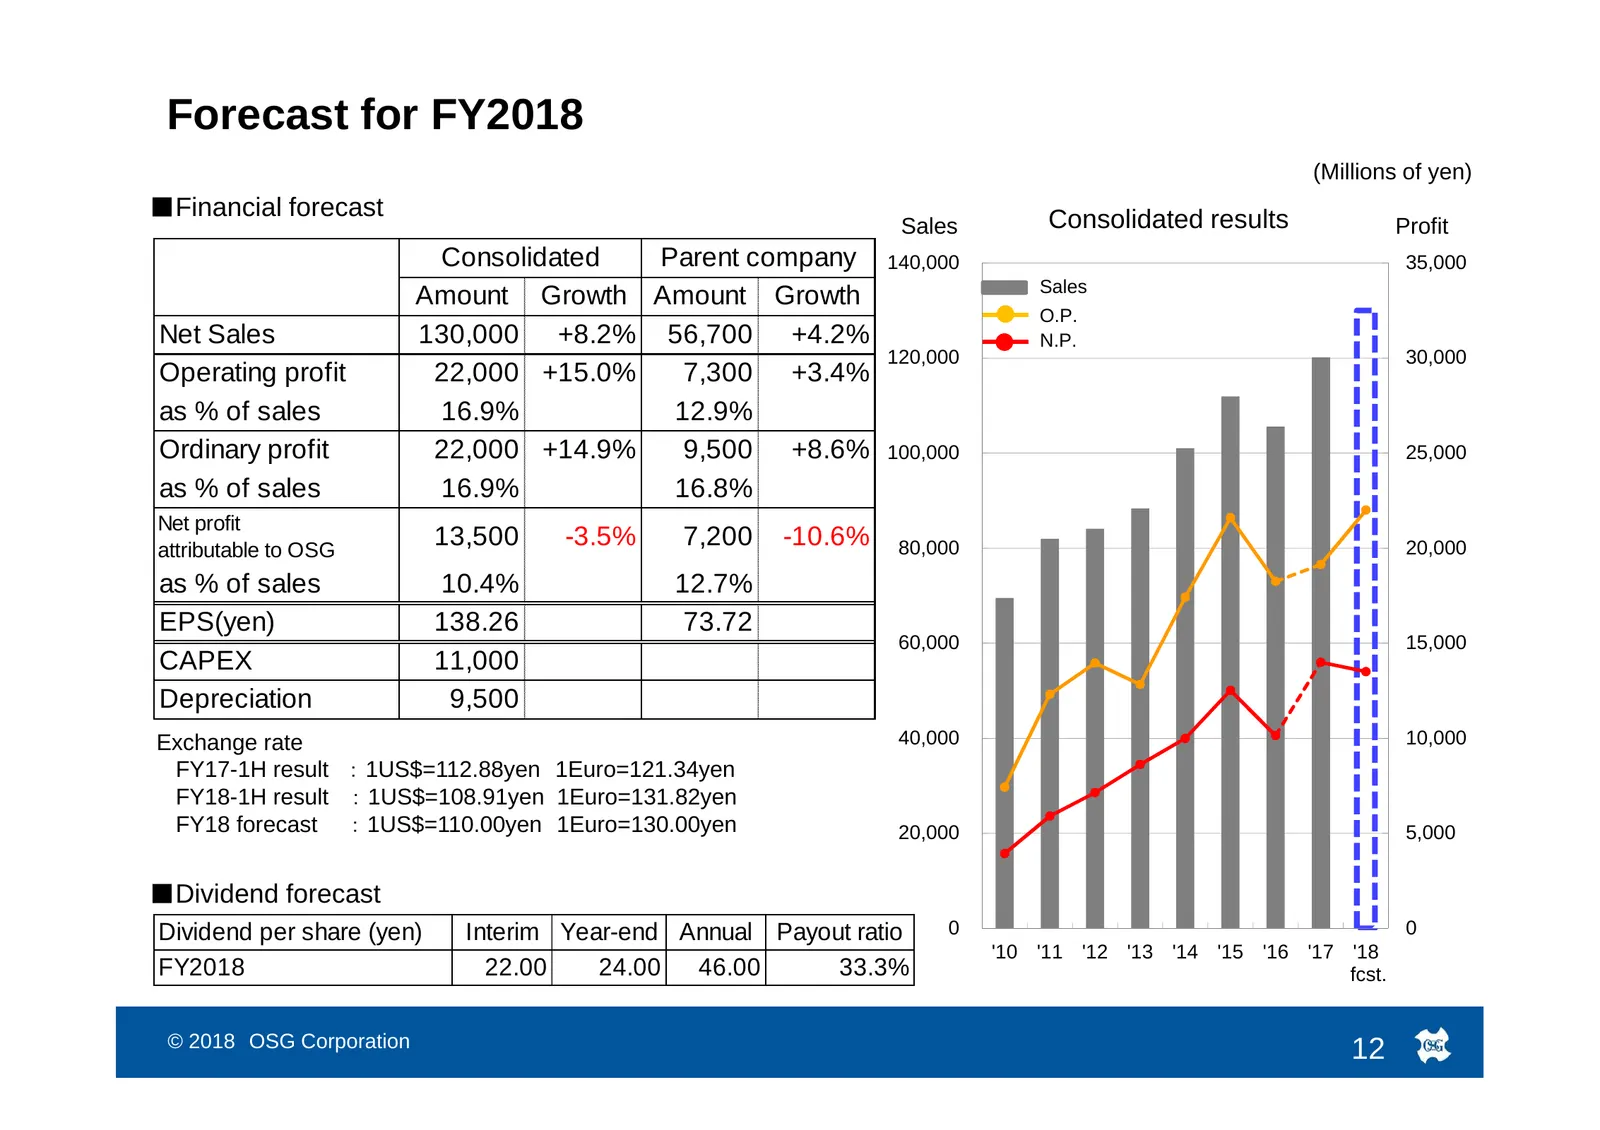
Slide 13: Forecast for FY2018
Forecast for FY2018 (Millions of yen) ■Financial forecast Consolidated results Sales Profit Consolidated Parent company 140,000 35,000 Sales Amount Growth Amount Growth O.P. Net Sales 130,000 +8.2% 56,700 +4.2% N.P. 120,000 30,000 Operating profit 22,000 +15.0% 7,300 +3.4% as % of sales 16.9% 12.9%
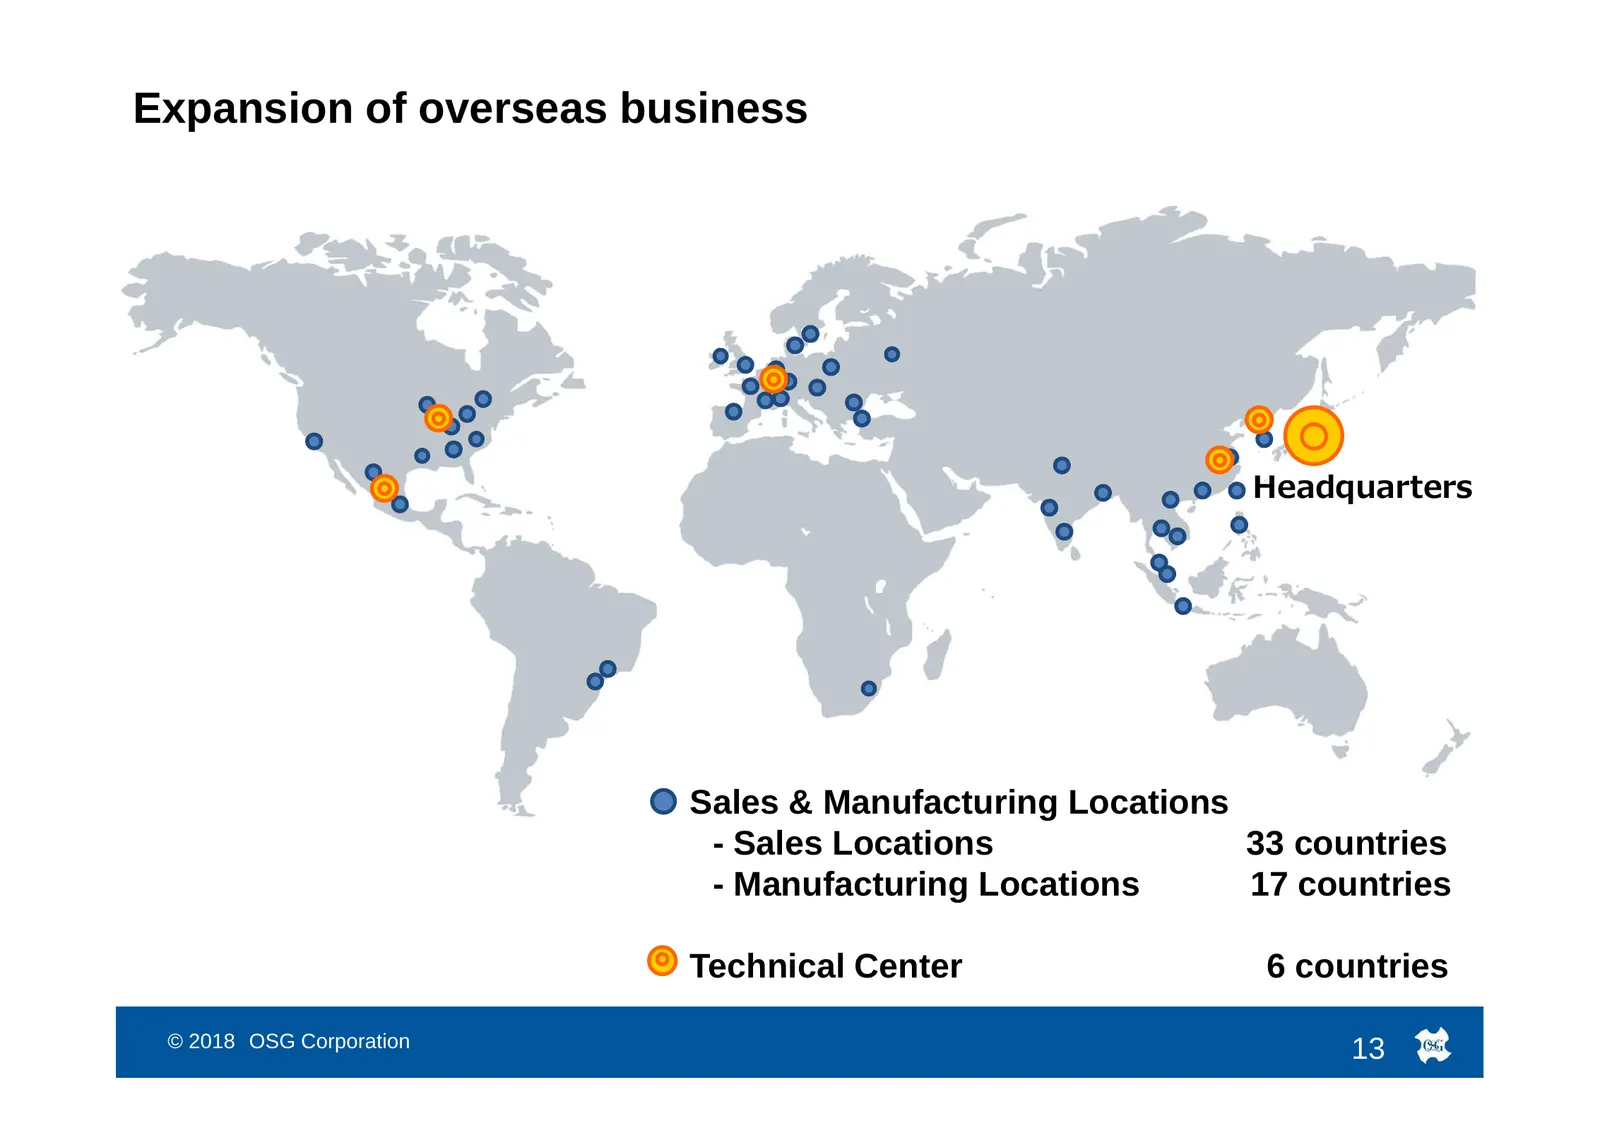
Slide 14: Expansion of overseas business
Expansion of overseas business Headquarters Sales & Manufacturing Locations - Sales Locations 33 countries - Manufacturing Locations 17 countries Technical Center 6 countries © 2018 OSG Corporation 13
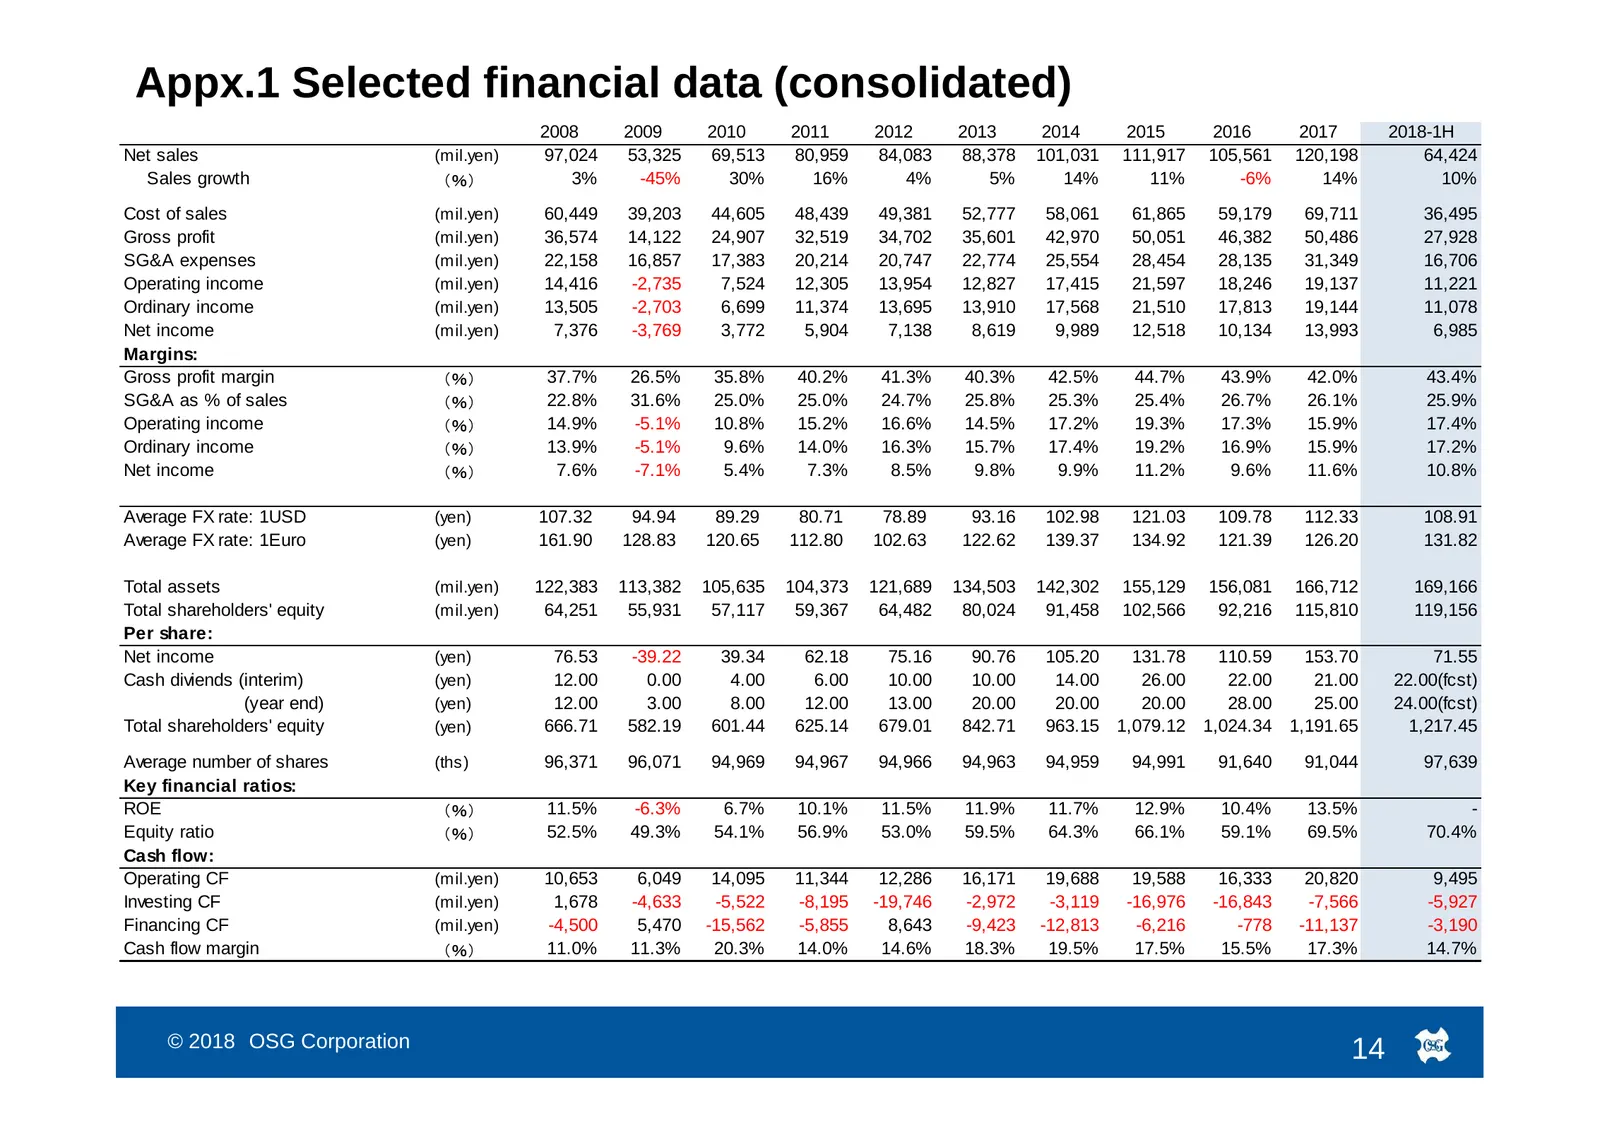
Slide 15: Appx.1 Selected financial data (consolidated)
Appx.1 Selected financial data (consolidated) 2008 2009 2010 2011 2012 2013 2014 2015 2016 2017 2018-1H Net sales (mil.yen) 97,024 53,325 69,513 80,959 84,083 88,378 101,031 111,917 105,561 120,198 64,424 Sales growth (%) 3% -45% 30% 16% 4% 5% 14% 11% -6% 14% 10% Cost of sales (mil.yen) 60,449 39,20
Source: Internet Archive copy of osg.co.jp
More decks from OSG Corp
 Q3 FY2026 Earnings Presentation40 slides · October 2026
 Q2 FY2026 Earnings Presentation41 slides · July 2026
 Q1 FY2026 Earnings Presentation41 slides · April 2026
 FY2025 Earnings Presentation44 slides · January 2026
 Fact Sheet (November 2025)1 slide · Nov 30, 2025
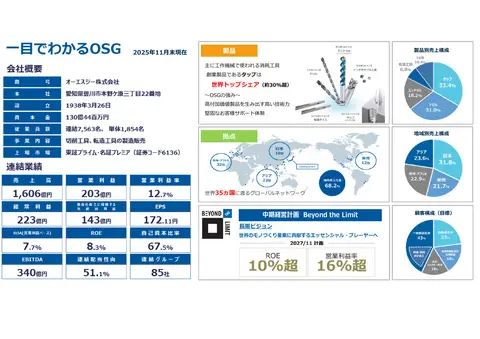 Fact Sheet (November 2025)1 slide · November 2025