Xeta Technologies — B. Riley & Co. Investor Conference 2008
24 slides from Xeta Technologies's conference presentation, Apr 2, 2008
Slide 1: B. Riley & Co. Investor Conference
-1- April 2007 B. Riley & Co. Investor Conference April 2, 2008
Slide 2: Forward-Looking Statements
-2- Portions of this presentation contain forward-looking statements within the meaning of the Private Securities Litigation Reform Act of 1995. Forward-looking statements include information concerning our possible or assumed future results of operations, as well as trends and conditions in our mar
Slide 3: XETA at a Glance
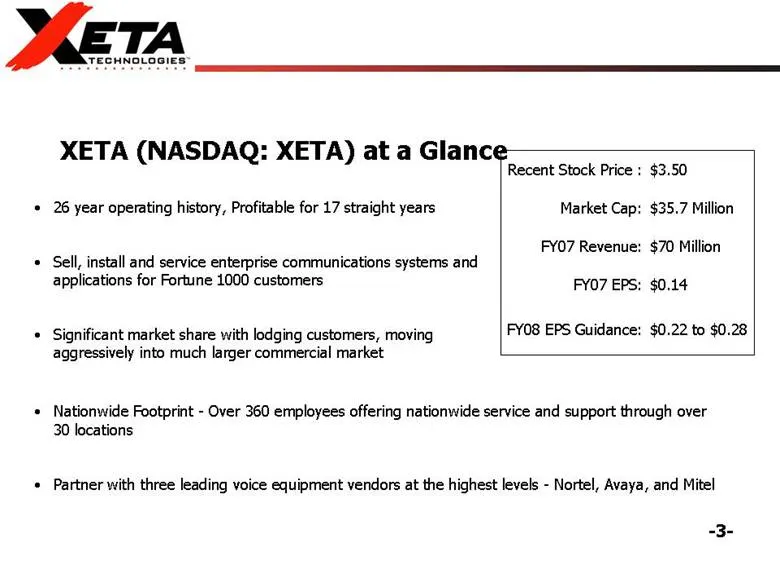
-3- • 26 year operating history, Profitable for 17 straight years • Sell, install and service enterprise communications systems and applications for Fortune 1000 customers • Significant market share with lodging customers, moving aggressively into much larger commercial market XETA (NASDAQ: XETA) at
Slide 4: What We Do
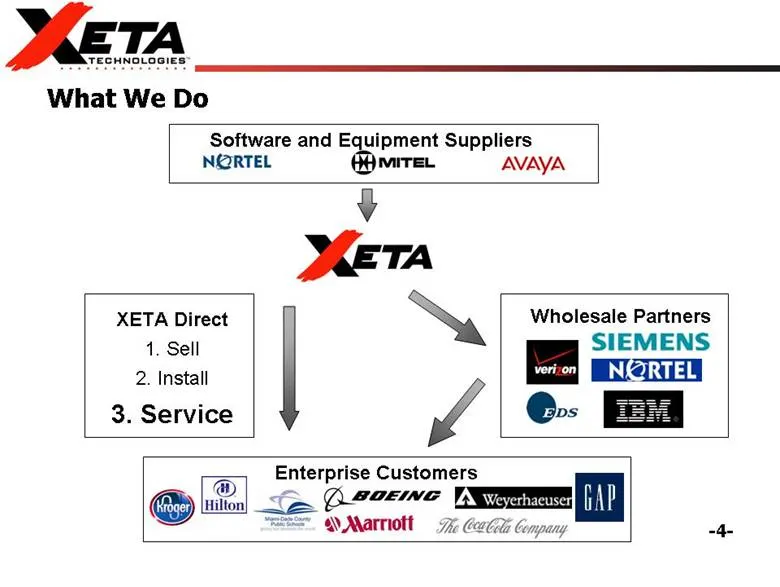
-4- What We Do Software and Equipment Suppliers Wholesale Partners Enterprise Customers XETA Direct 1. Sell 2. Install 3. Service
Slide 5: Investment Considerations
-5- • Taking Market Share: Well positioned to acquire significant market share with targeted 15% top line organic growth over the next 3 to 5 years. • Improving Profitability: to come from a shift in the revenue mix and operating leverage....targeted EBITDA of 12% versus 5% in 2007. • Recurring Reve
Slide 6: Market Overview
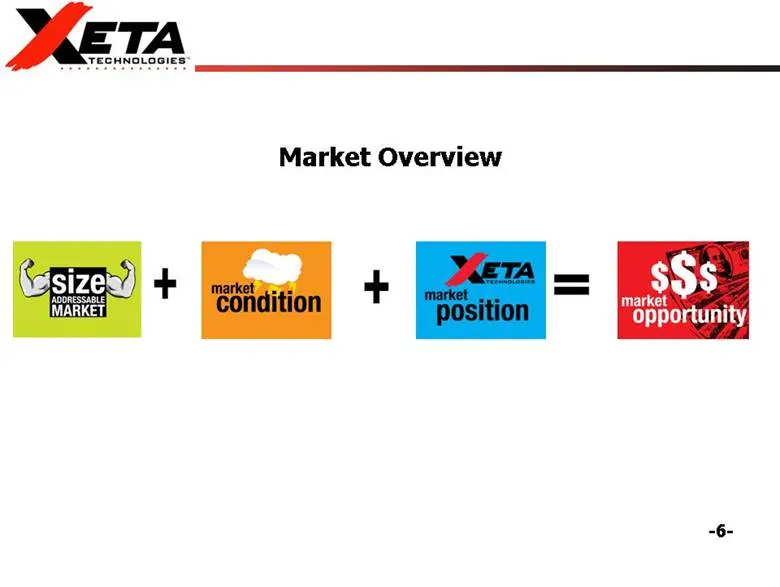
-6- Market Overview
Slide 7: Size of Addressable Market
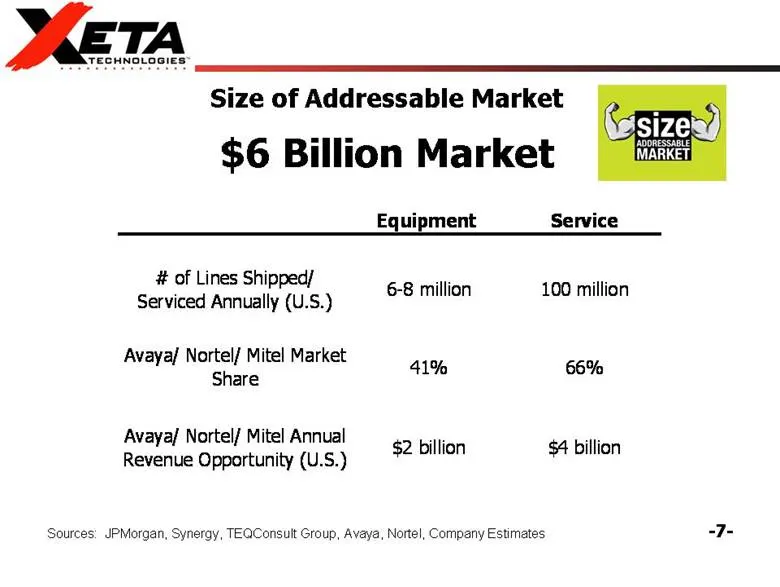
-7- Size of Addressable Market $6 Billion Market Sources: JPMorgan, Synergy, TEQConsult Group, Avaya, Nortel, Company Estimates Equipment Service # of Lines Shipped/ Serviced Annually (U.S.) 6-8 million 100 million Avaya/ Nortel/ Mitel Market Share 41% 66% Avaya/ Nortel/ Mitel Annual Revenue Opportu
Slide 8: Condition of Addressable Market
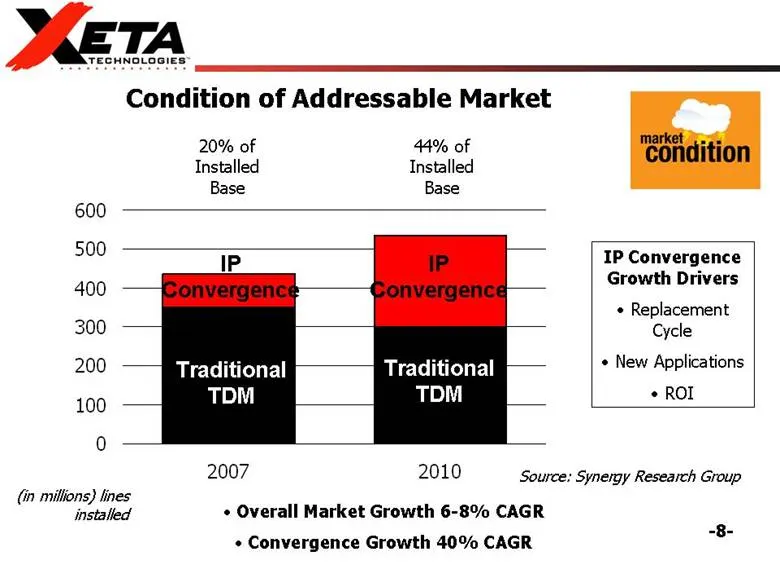
-8- 0 100 200 300 400 500 600 2007 2010 IP Convergence Growth Drivers • Replacement Cycle • New Applications • ROI 44% of Installed Base Source: Synergy Research Group • Overall Market Growth 6-8% CAGR • Convergence Growth 40% CAGR 20% of Installed Base Condition of Addressable Market ( in millions
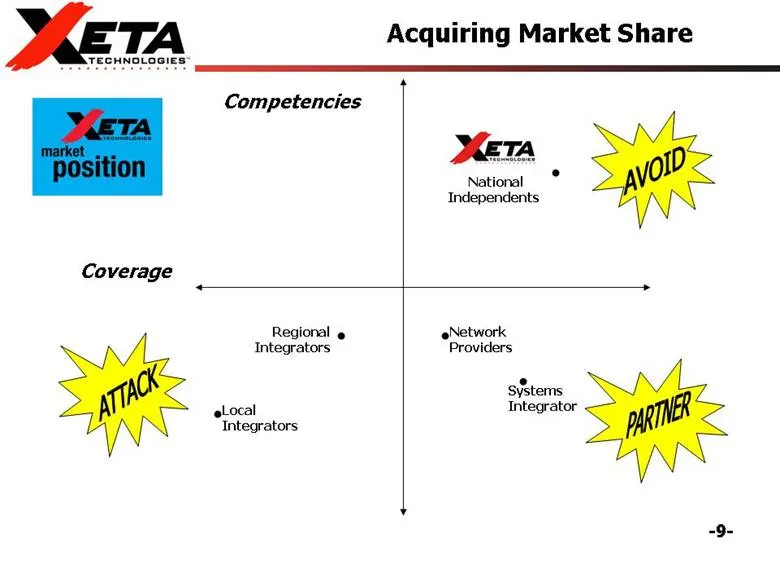
Slide 9: Acquiring Market Share
-9- National Independents Regional Integrators Systems Integrator Network Providers Local Integrators Competencies Coverage Acquiring Market Share
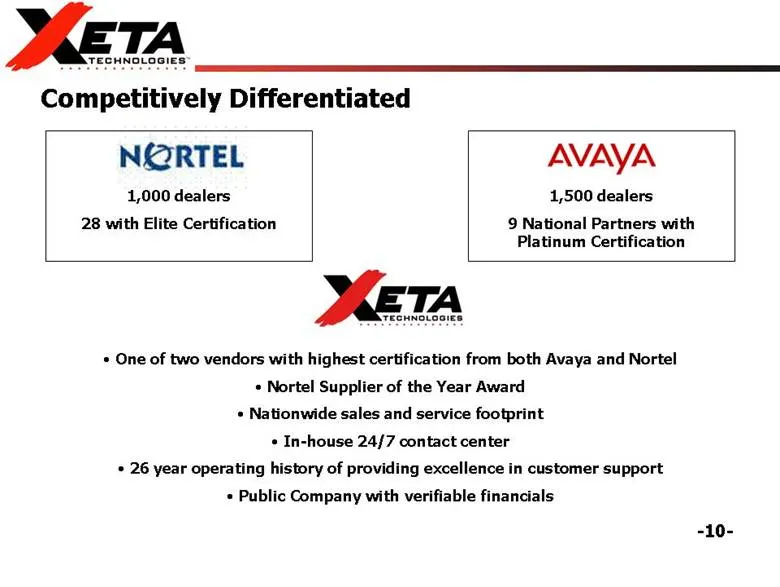
Slide 10: Competitively Differentiated
-10- Competitively Differentiated 1,000 dealers 28 with Elite Certification • One of two vendors with highest certification from both Avaya and Nortel • Nortel Supplier of the Year Award • Nationwide sales and service footprint • In-house 24/7 contact center • 26 year operating history of providing
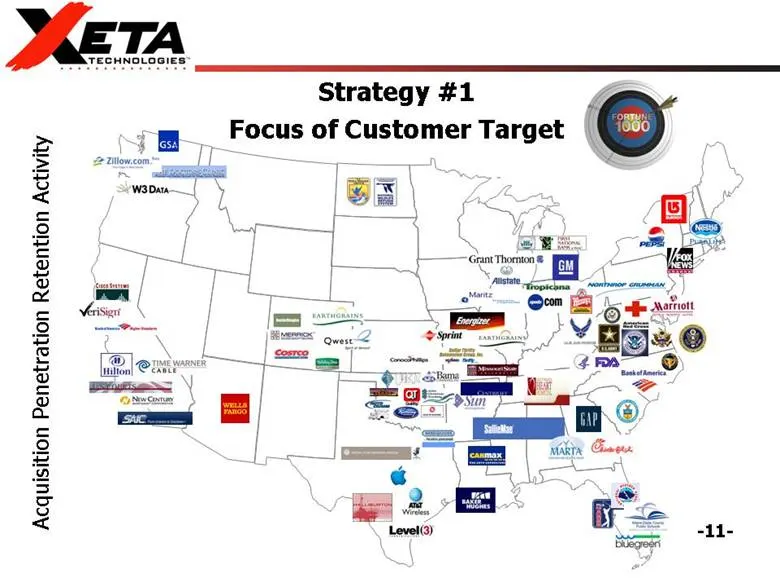
Slide 11: Strategy #1: Focus of Customer Activity
-11- Strategy #1 Focus of Customer Target Acquisition Penetration Retention Activity
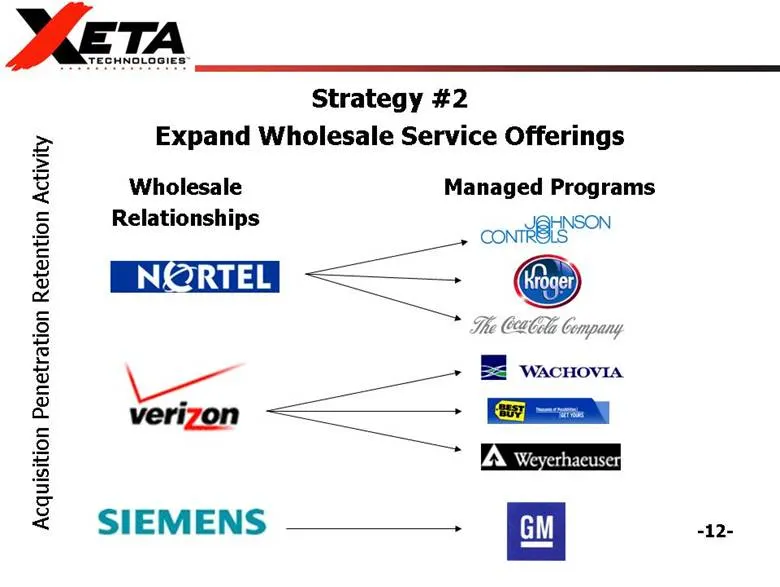
Slide 12: Strategy #2: Expand Wholesale Service Offerings
-12- Wholesale Relationships Managed Programs Acquisition Penetration Retention Activity Strategy #2 Expand Wholesale Service Offerings
Slide 13: Strategy #3: Alignment with Major Business Partners
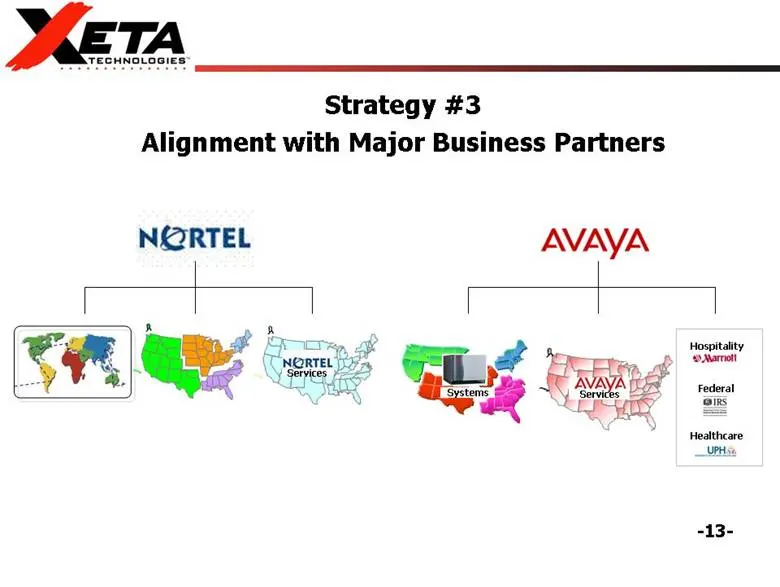
-13- Strategy #3 Alignment with Major Business Partners Services Services Systems Hospitality Healthcare Federal
Slide 14: Acquisition Criteria
-14- • Strategic – Recurring Revenue – Added Coverage and Competency – Targeted Customers and Talent • Operational – Manufacturer Competencies and Relationships – Comparable Business Models – Cultural Fit • Economic – Deal Size $3M to $15M Annual Revenues – 2 to 3 year pay back – Accretive Acquisiti
Slide 15: Experienced Leadership Team
-15- Experienced Leadership Team •Greg Forrest – CEO and President – CEO since June 2007, joined the company in July 2005 through acquisition. Prior to XETA, founded several fast-growing companies in the clothing, commercial interior and telecommunications industries. •Robert Wagner – CFO – Joined t
Slide 16: Historical Trends – 14% growth in TTM Revenue
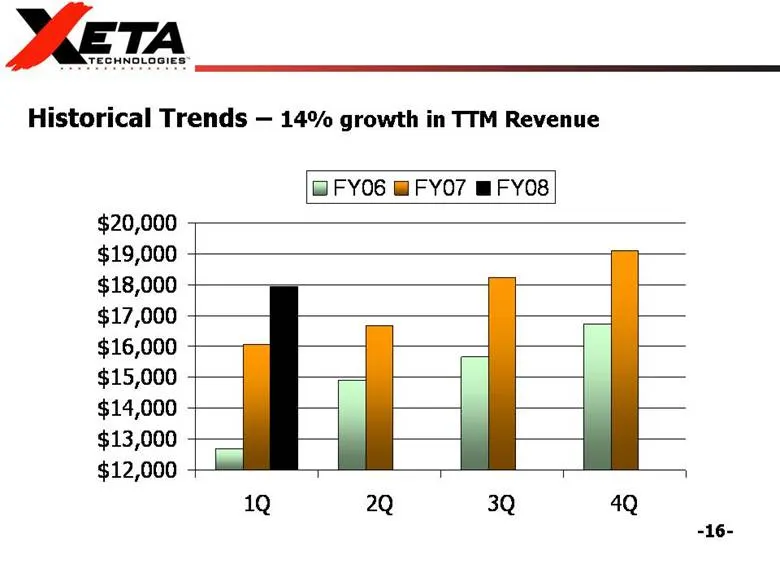
-16- Historical Trends – 14% growth in TTM Revenue $12,000 $13,000 $14,000 $15,000 $16,000 $17,000 $18,000 $19,000 $20,000 1Q 2Q 3Q 4Q FY06 FY07 FY08
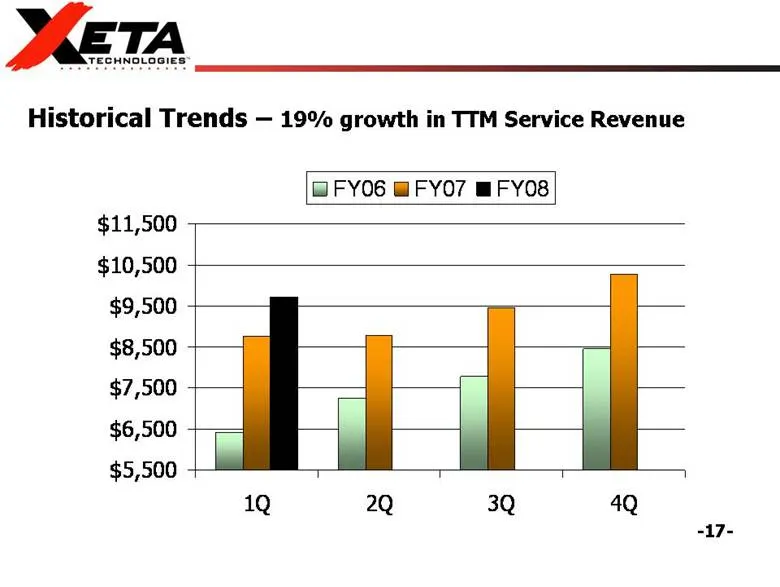
Slide 17: Historical Trends – 19% growth in TTM Service Revenue
-17- Historical Trends – 19% growth in TTM Service Revenue $5,500 $6,500 $7,500 $8,500 $9,500 $10,500 $11,500 1Q 2Q 3Q 4Q FY06 FY07 FY08
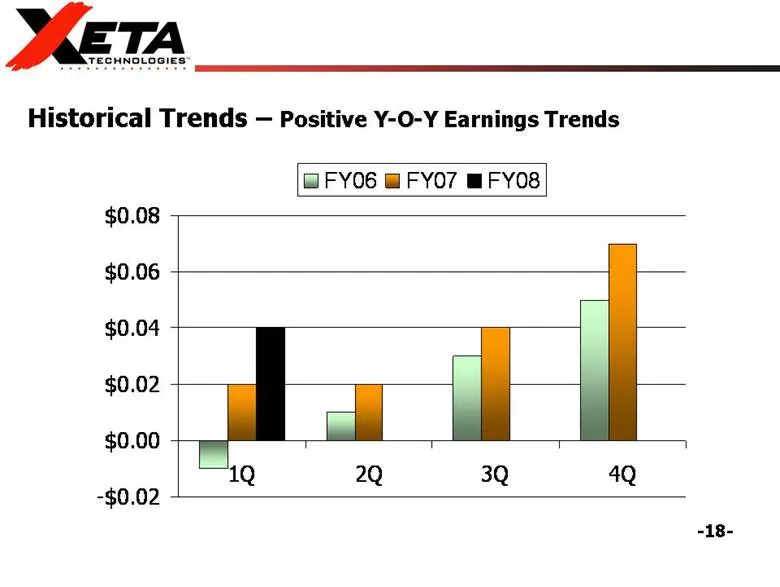
Slide 18: Historical Trends – Positive Y-O-Y Earnings Trends
-18- Historical Trends – Positive Y-O-Y Earnings Trends -$0.02 $0.00 $0.02 $0.04 $0.06 $0.08 1Q 2Q 3Q 4Q FY06 FY07 FY08
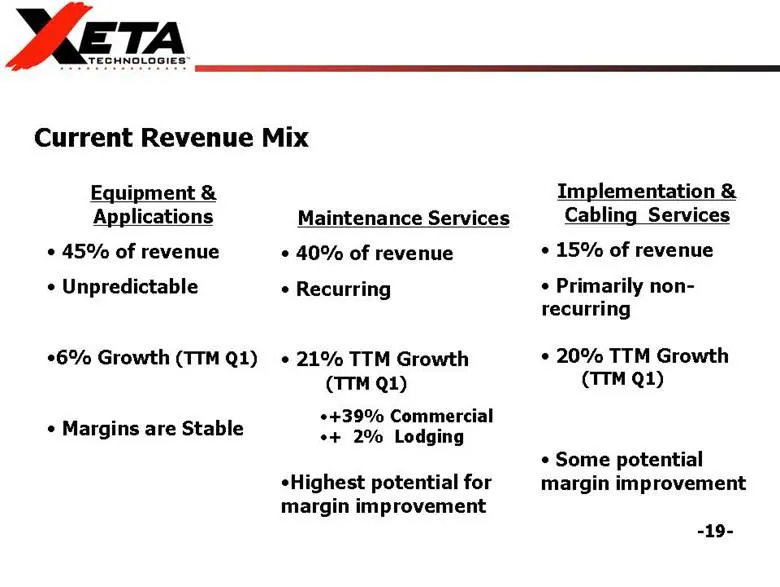
Slide 19: Current Revenue Mix
-19- Current Revenue Mix Maintenance Services • 40% of revenue • Recurring • 21% TTM Growth (TTM Q1) •+39% Commercial •+ 2% Lodging •Highest potential for margin improvement Implementation & Cabling Services • 15% of revenue • Primarily non-recurring • 20% TTM Growth (TTM Q1) • Some potential margin
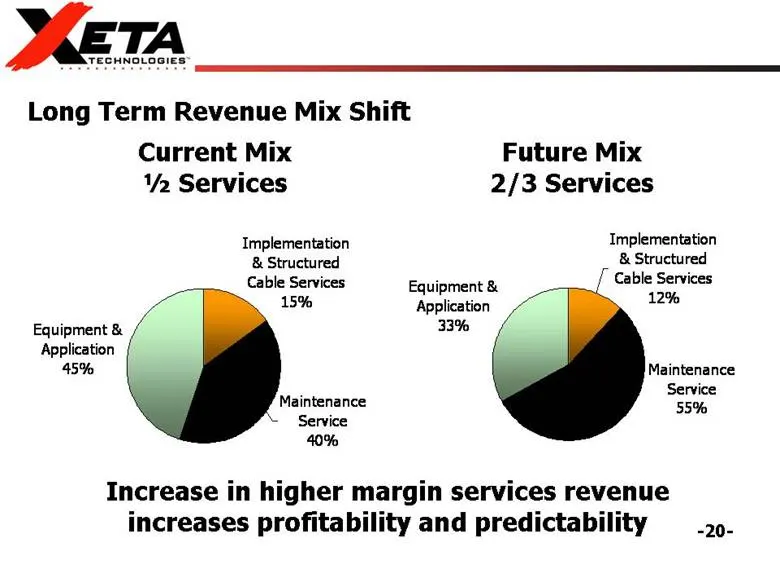
Slide 20: Long Term Revenue Mix Shift
-20- Long Term Revenue Mix Shift Current Mix ½ Services Future Mix 2/3 Services Increase in higher margin services revenue increases profitability and predictability Equipment & Application 45% Implementation & Structured Cable Services 15% Maintenance Service 40% Equipment & Application 33% Impleme
Slide 21: Targeted Operating Results
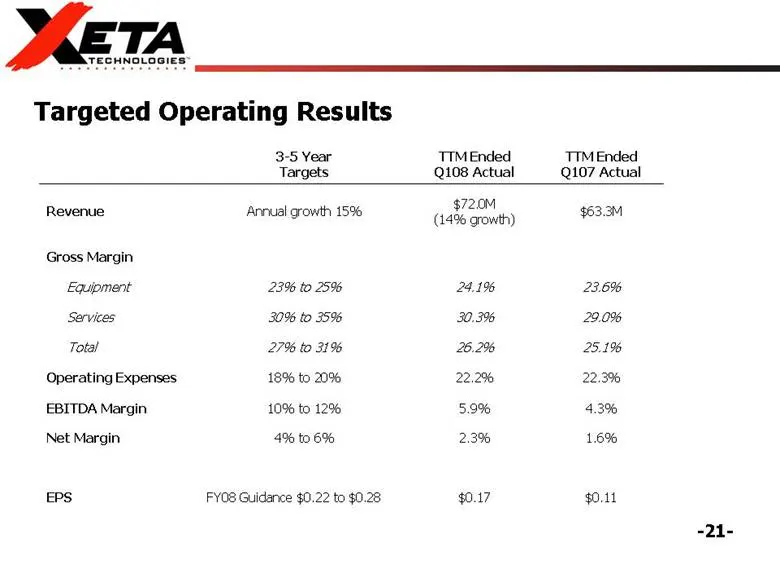
-21- Targeted Operating Results FY08 Guidance $0.22 to $0.28 4% to 6% 10% to 12% 18% to 20% 27% to 31% 30% to 35% 23% to 25% Annual growth 15% 3-5 Year Targets $0.17 2.3% 5.9% 22.2% 26.2% 30.3% 24.1% $72.0M (14% growth) TTM Ended Q108 Actual $0.11 EPS 1.6% Net Margin 4.3% EBITDA Margin 22.3% Operati
Slide 22: Financials – Balance Sheet
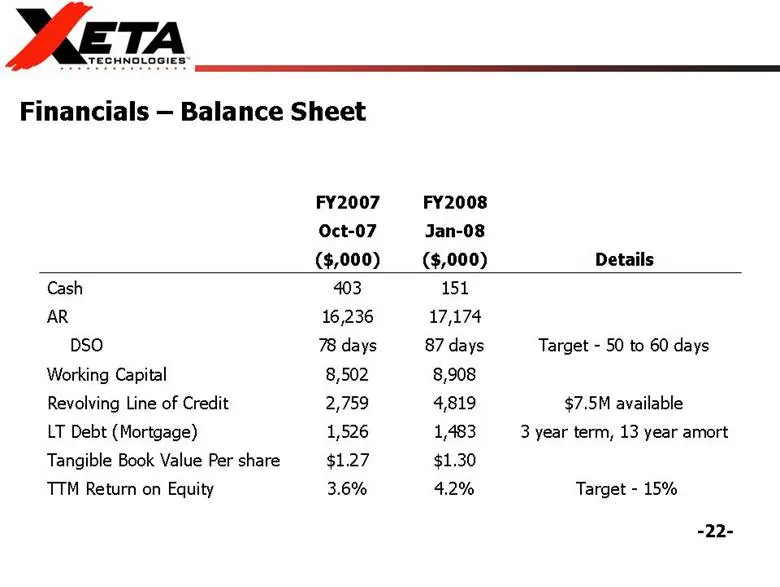
-22- Financials – Balance Sheet Target - 15% 4.2% 3.6% TTM Return on Equity $1.30 $1.27 Tangible Book Value Per share 3 year term, 13 year amort 1,483 1,526 LT Debt (Mortgage) $7.5M available 4,819 2,759 Revolving Line of Credit 8,908 8,502 Working Capital Target - 50 to 60 days 87 days 78 days DSO
Slide 23: Investment Considerations
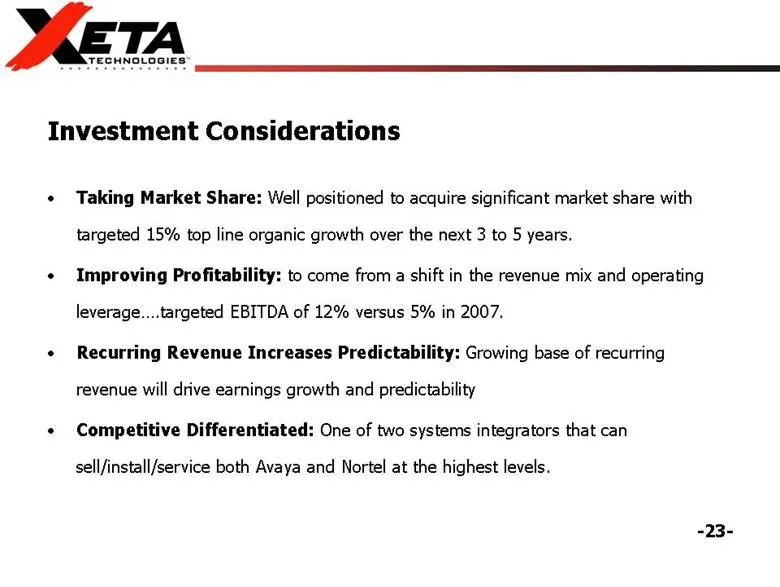
-23- • Taking Market Share: Well positioned to acquire significant market share with targeted 15% top line organic growth over the next 3 to 5 years. • Improving Profitability: to come from a shift in the revenue mix and operating leverage....targeted EBITDA of 12% versus 5% in 2007. • Recurring Rev
Slide 24: -24- April 2007
-24- April 2007 Investor Presentation
Source: SEC EDGAR · 8-K filed Apr 2, 2008
More decks from Xeta Technologies Inc
 Southwest IDEAS Conference 201025 slides · Nov 10, 2010
 Midwest IDEAS Conference 201025 slides · Aug 31, 2010
 ROTH 22nd Annual Growth Stock Conference 201027 slides · Mar 17, 2010
 Southwestern Showcase Investor Conference (November 2008)25 slides · Nov 19, 2008
 Investor Presentation (November 2007)22 slides · Nov 14, 2007