Xeta Technologies — ROTH 22nd Annual Growth Stock Conference 2010
27 slides from Xeta Technologies's conference presentation, Mar 17, 2010
Slide 1: ROTH 22nd Annual Growth Stock Conference
April 2007 Investor Presentation ROTH 22nd Annual Growth Stock Conference March 17, 2010
Slide 2: Forward-looking statements and GAAP reconciliation
Portions of this presentation contain forward-looking statements within the meaning of the Private Securities Litigation Reform Act of 1995. Forward-looking statements include information concerning our possible or assumed future results of operations, as well as trends and conditions in our markets
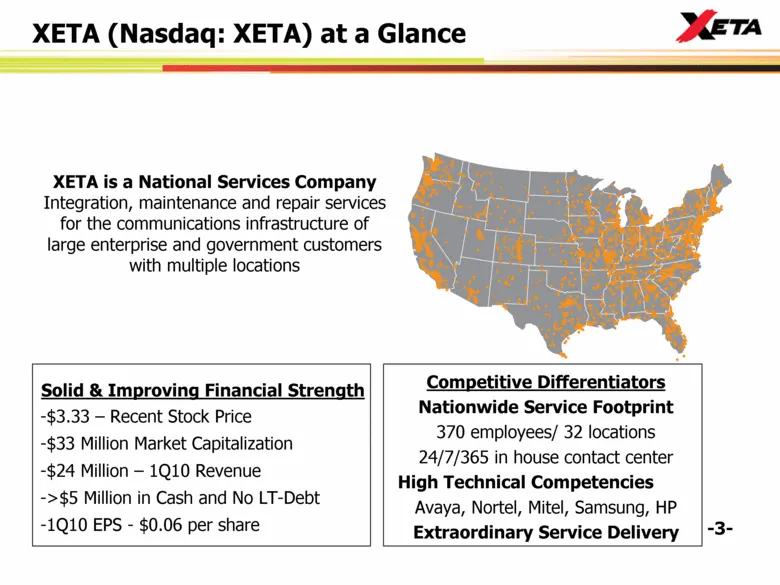
Slide 3: XETA is a National Services Company
XETA is a National Services Company Integration, maintenance and repair services for the communications infrastructure of large enterprise and government customers with multiple locations Solid & Improving Financial Strength $3.33 – Recent Stock Price $33 Million Market Capitalization $24 Million –
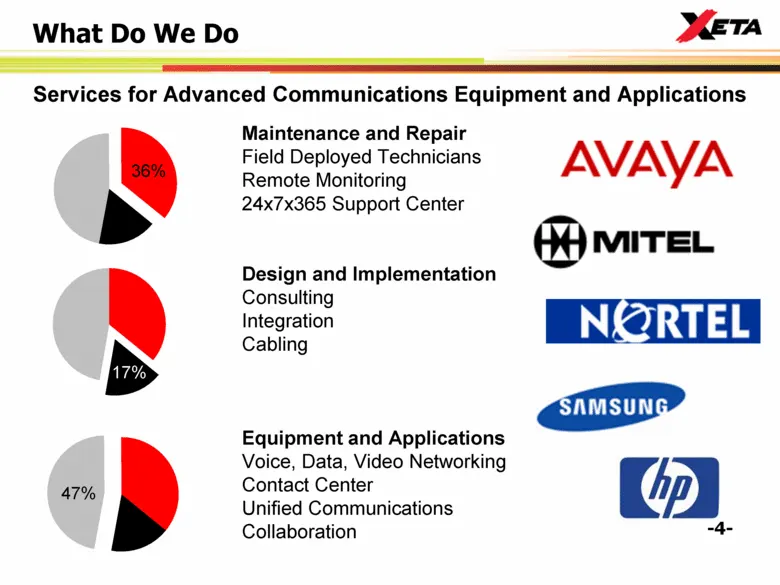
Slide 4: What Do We Do
Maintenance and Repair Field Deployed Technicians Remote Monitoring 24x7x365 Support Center Design and Implementation Consulting Integration Cabling Equipment and Applications Voice, Data, Video Networking Contact Center Unified Communications Collaboration Services for Advanced Communications Equip
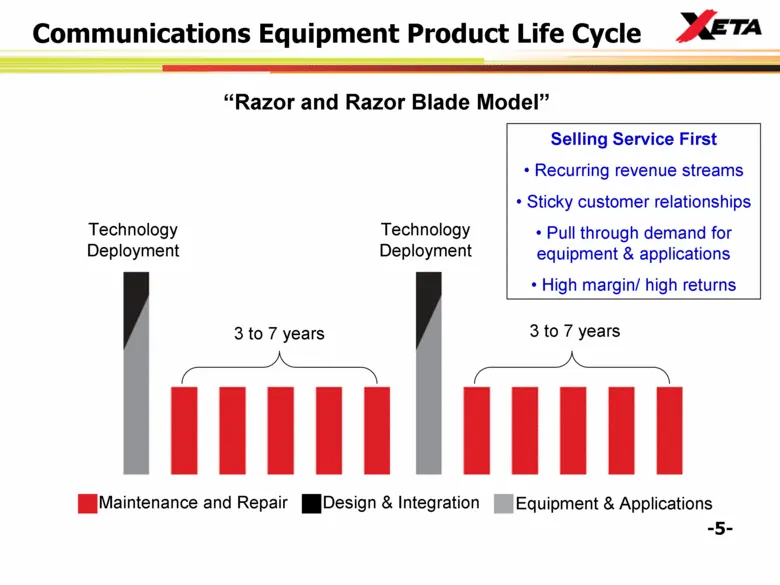
Slide 5: Razor and Razor Blade Model
“Razor and Razor Blade Model” 44% Selling Service First Recurring revenue streams Sticky customer relationships Pull through demand for equipment & applications High margin/ high returns Maintenance and Repair Design & Integration Equipment & Applications 3 to 7 years Communications Equipment Produc
Slide 6: Investment Considerations
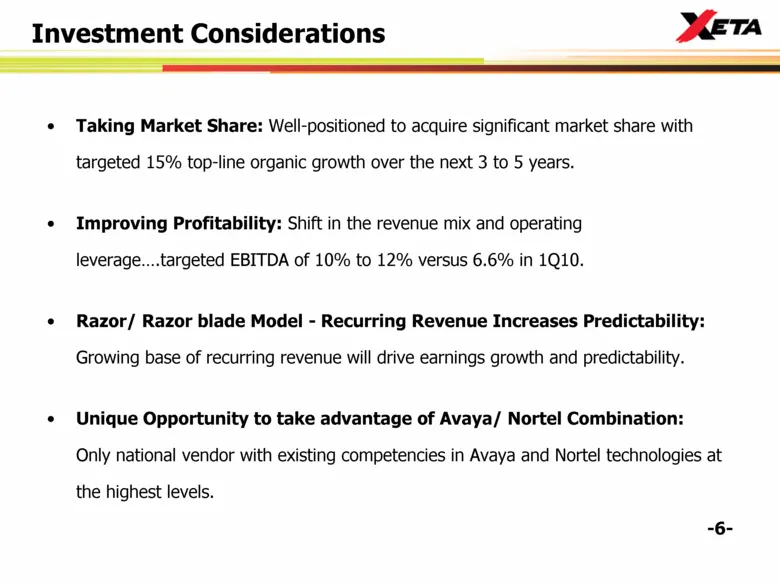
Taking Market Share: Well-positioned to acquire significant market share with targeted 15% top-line organic growth over the next 3 to 5 years. Improving Profitability: Shift in the revenue mix and operating leverage.targeted EBITDA of 10% to 12% versus 6.6% in 1Q10. Razor/ Razor blade Model - Recurr
Slide 7: Size of Addressable Market
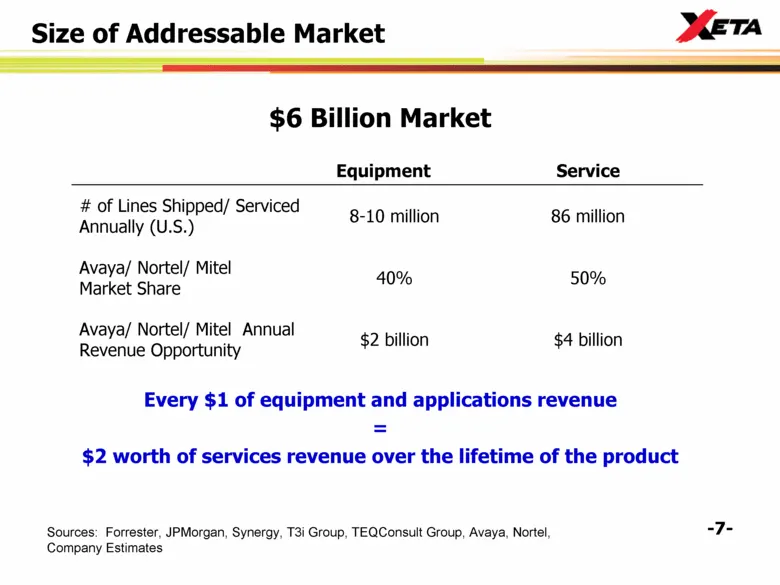
Size of Addressable Market $6 Billion Market Sources: Forrester, JPMorgan, Synergy, T3i Group, TEQConsult Group, Avaya, Nortel, Company Estimates Equipment Service # of Lines Shipped/ Serviced Annually (U.S.) 8-10 million 86 million Avaya/ Nortel/ Mitel Market Share 40% 50% Avaya/ Nortel/ Mitel Annu
Slide 8: Competitively Differentiated – Why XETA?
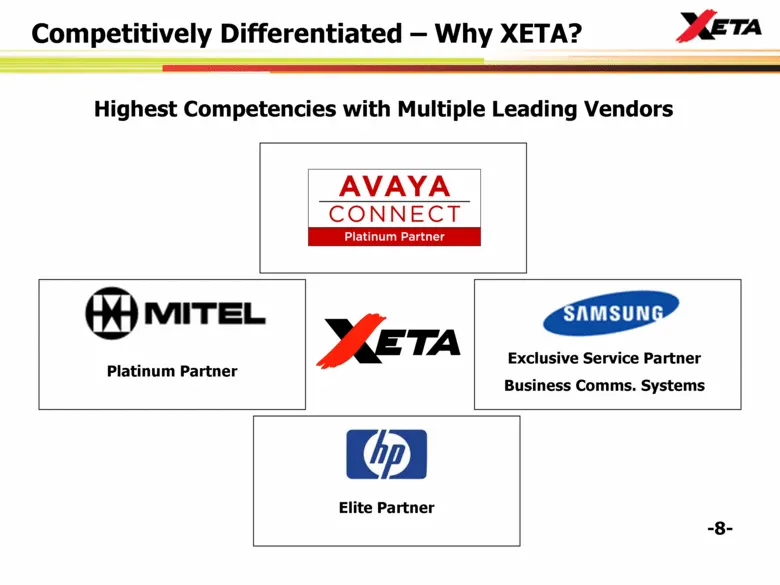
Competitively Differentiated – Why XETA? Highest Competencies with Multiple Leading Vendors Platinum Partner Elite Partner Exclusive Service Partner Business Comms. Systems
Slide 9: Competitively Differentiated – Why XETA? Customer List
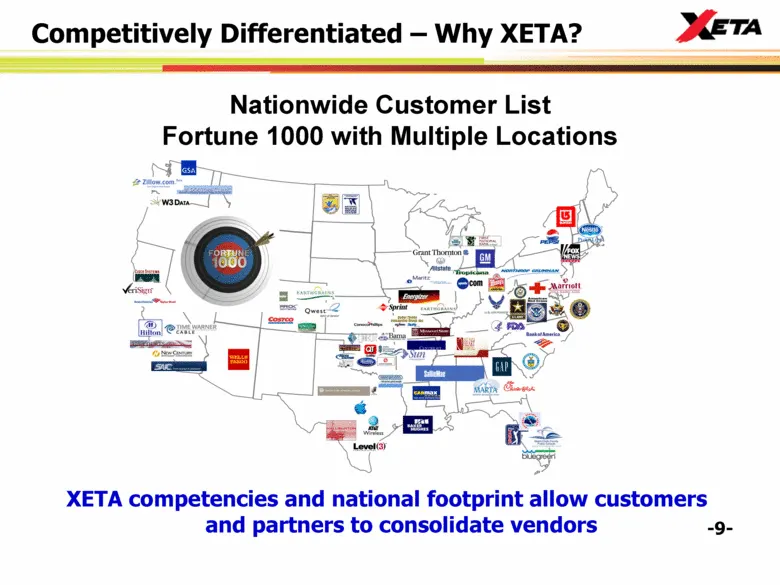
XETA competencies and national footprint allow customers and partners to consolidate vendors Nationwide Customer List Fortune 1000 with Multiple Locations Competitively Differentiated – Why XETA?
Slide 10: Growth Opportunity - Acquire Market Share
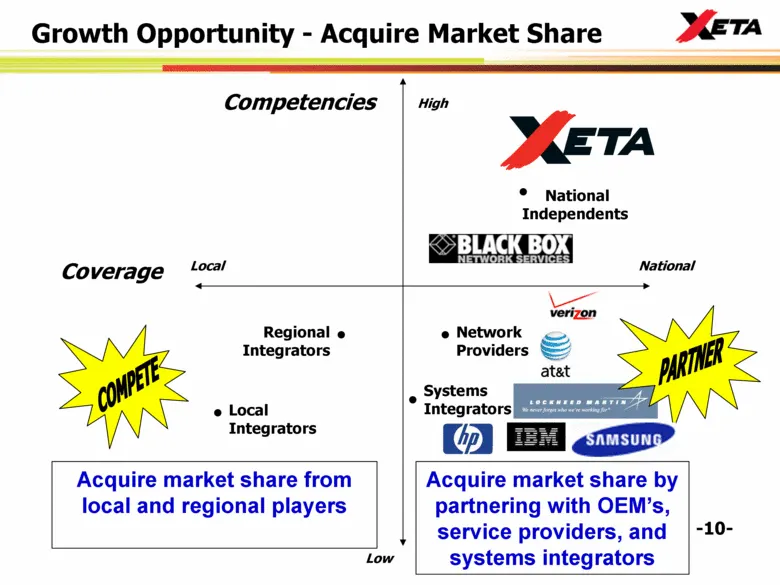
National Independents Regional Integrators Systems Integrators Network Providers Local Integrators Competencies Coverage Growth Opportunity - Acquire Market Share Acquire market share from local and regional players Acquire market share by partnering with OEM’s, service providers, and systems integr
Slide 11: Acquire Market Share – Unique Wholesale Model
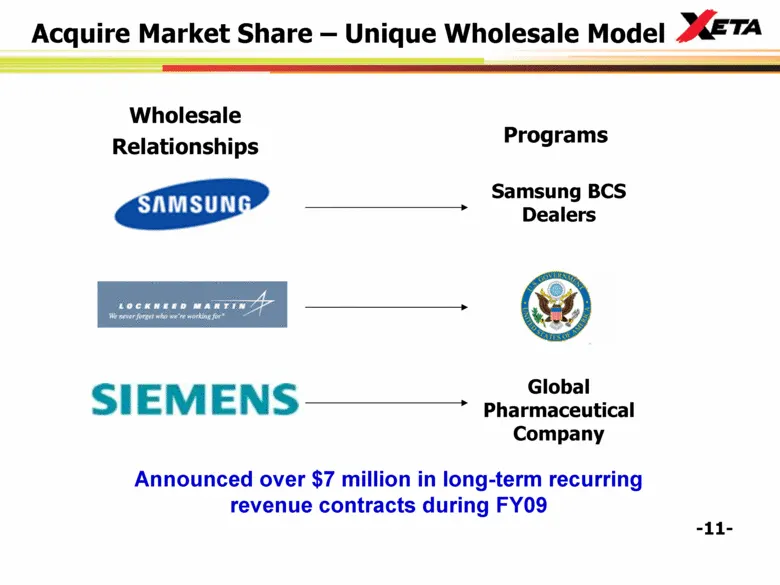
Wholesale Relationships Programs Acquire Market Share – Unique Wholesale Model Samsung BCS Dealers Global Pharmaceutical Company Announced over $7 million in long-term recurring revenue contracts during FY09
Slide 12: XETA's Unique Position
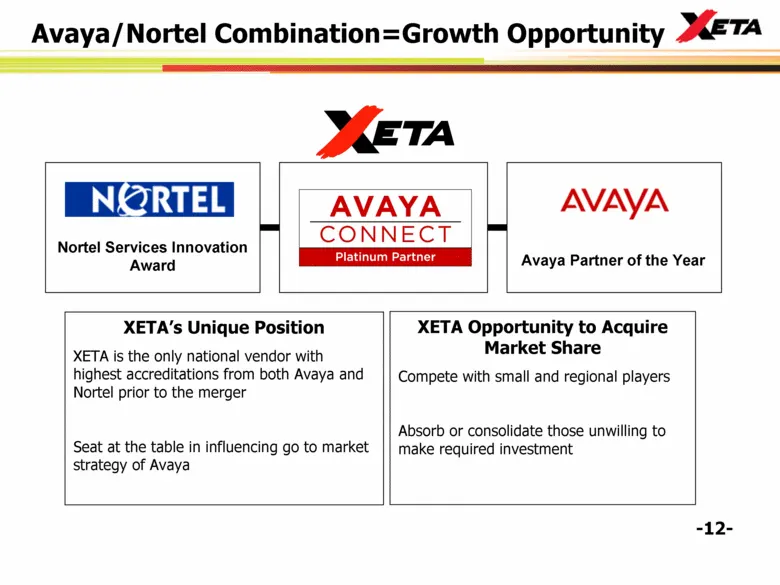
Nortel Services Innovation Award XETA’s Unique Position XETA is the only national vendor with highest accreditations from both Avaya and Nortel prior to the merger Seat at the table in influencing go to market strategy of Avaya Avaya Partner of the Year Avaya/Nortel Combination=Growth Opportunity XE
Slide 13: Accelerate Growth Through Acquisitions
Target both scale and scope Strategic Recurring revenue Added coverage and competency Targeted customers and talent Economic Deal size $5M to $25M annual revenues Accretive Accelerate Growth Through Acquisitions
Slide 14: Experienced Leadership Team
Experienced Leadership Team Greg Forrest – CEO and President – CEO since June 2007, joined the company in July 2005 through an acquisition. Prior to XETA, Greg was CEO of several fast-growing companies in the clothing, commercial interior and telecommunications industries. Robert Wagner – CFO – Join
Slide 15: Revenue Mix Shift
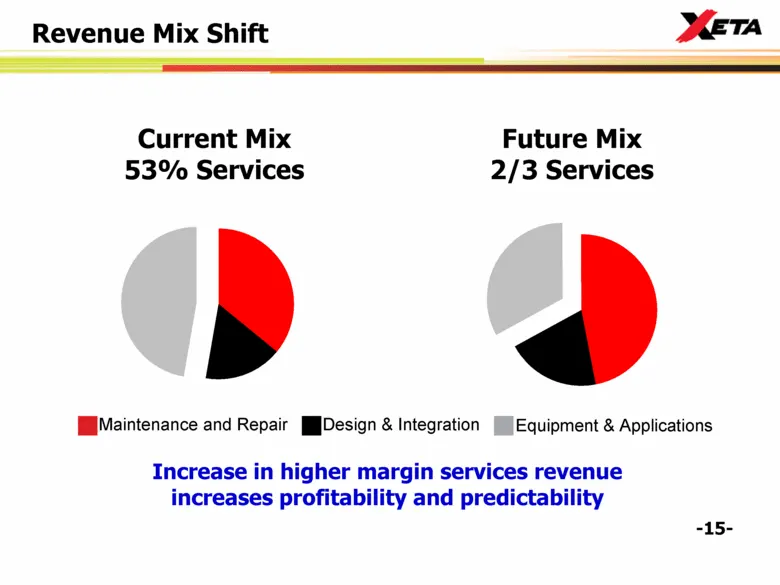
Revenue Mix Shift Current Mix 53% Services Future Mix 2/3 Services Increase in higher margin services revenue increases profitability and predictability Design & Integration Equipment & Applications Maintenance and Repair
Slide 16: Total Revenue Historical Trends
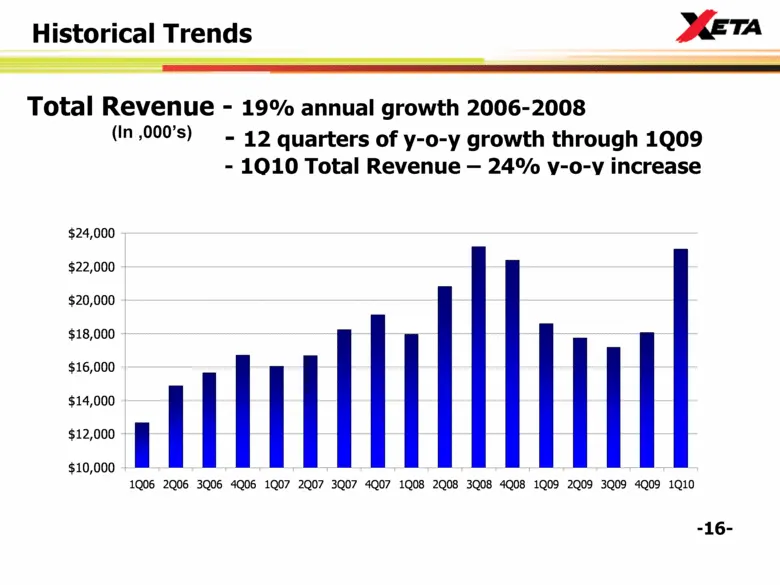
Total Revenue - 19% annual growth 2006-2008 - 12 quarters of y-o-y growth through 1Q09 - 1Q10 Total Revenue – 24% y-o-y increase (In ,000’s) Historical Trends $10,000 $12,000 $14,000 $16,000 $18,000 $20,000 $22,000 $24,000 1Q06 2Q06 3Q06 4Q06 1Q07 2Q07 3Q07 4Q07 1Q08 2Q08 3Q08 4Q08 1Q09 2Q09 3Q09 4Q
Slide 17: Service Revenue Historical Trends
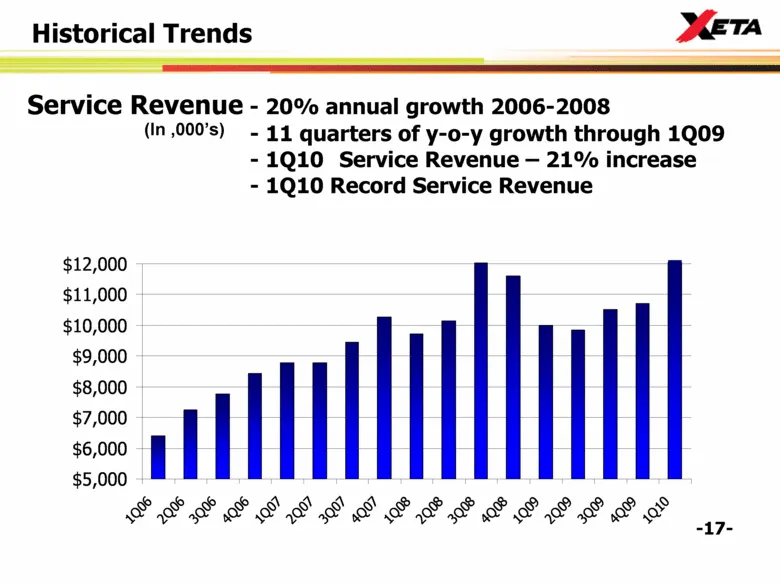
Service Revenue - 20% annual growth 2006-2008 - 11 quarters of y-o-y growth through 1Q09 - 1Q10 Service Revenue – 21% increase - 1Q10 Record Service Revenue (In ,000’s) Historical Trends $5,000 $6,000 $7,000 $8,000 $9,000 $10,000 $11,000 $12,000 1Q06 2Q06 3Q06 4Q06 1Q07 2Q07 3Q07 4Q07 1Q08 2Q08 3Q08
Slide 18: Targeted Operating Results
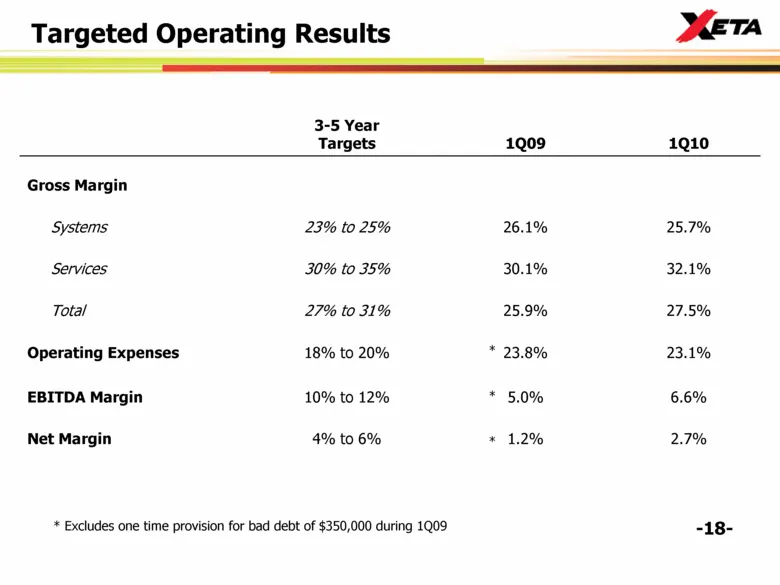
Targeted Operating Results * * Excludes one time provision for bad debt of $350,000 during 1Q09 1.2% 5.0% 23.8% 25.9% 30.1% 26.1% 1Q09 3-5 Year Targets 1Q10 Gross Margin Systems 23% to 25% 25.7% Services 30% to 35% 32.1% Total 27% to 31% 27.5% Operating Expenses 18% to 20% 23.1% EBITDA Margin 10% to
Slide 19: Systems Gross Margin Target
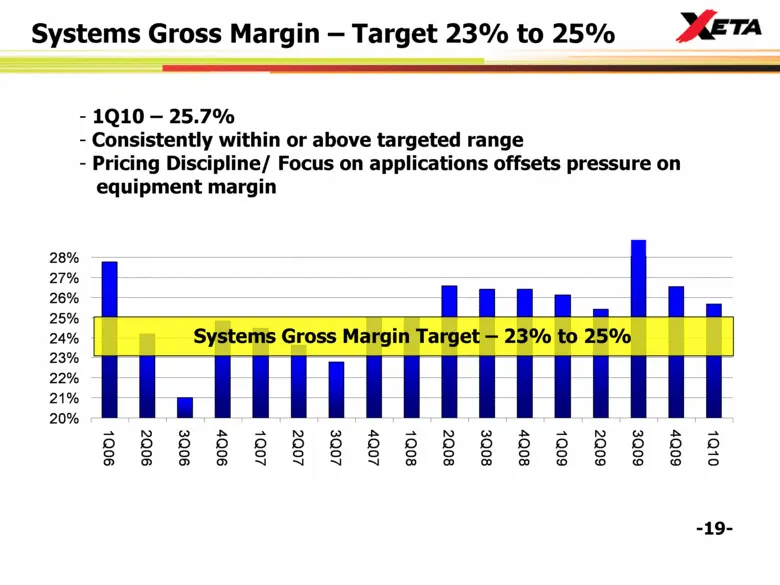
Systems Gross Margin Target – 23% to 25% 1Q10 – 25.7% Consistently within or above targeted range Pricing Discipline/ Focus on applications offsets pressure on equipment margin Systems Gross Margin – Target 23% to 25% 20% 21% 22% 23% 24% 25% 26% 27% 28% 1Q06 2Q06 3Q06 4Q06 1Q07 2Q07 3Q07 4Q07 1Q08 2
Slide 20: Services Gross Margin Target
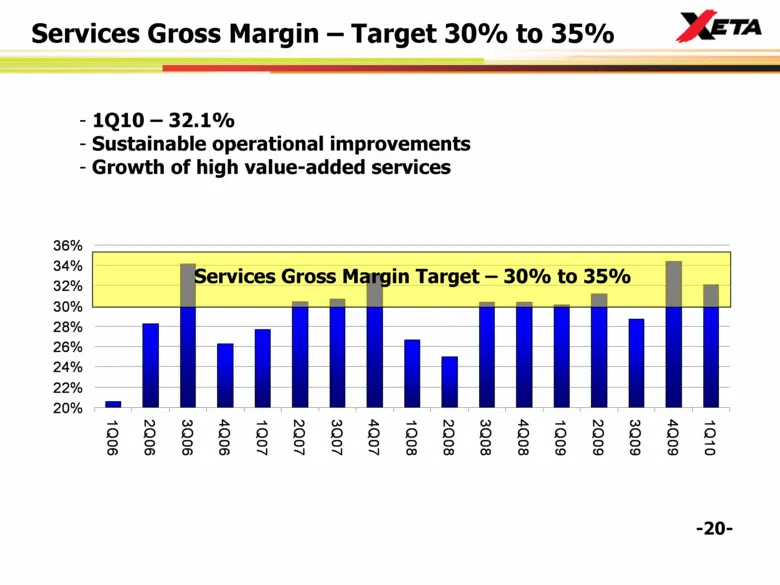
Services Gross Margin Target – 30% to 35% 1Q10 – 32.1% Sustainable operational improvements Growth of high value-added services Services Gross Margin – Target 30% to 35% 20% 22% 24% 26% 28% 30% 32% 34% 36% 1Q06 2Q06 3Q06 4Q06 1Q07 2Q07 3Q07 4Q07 1Q08 2Q08 3Q08 4Q08 1Q09 2Q09 3Q09 4Q09 1Q10
Slide 21: Overall Gross Margin Target
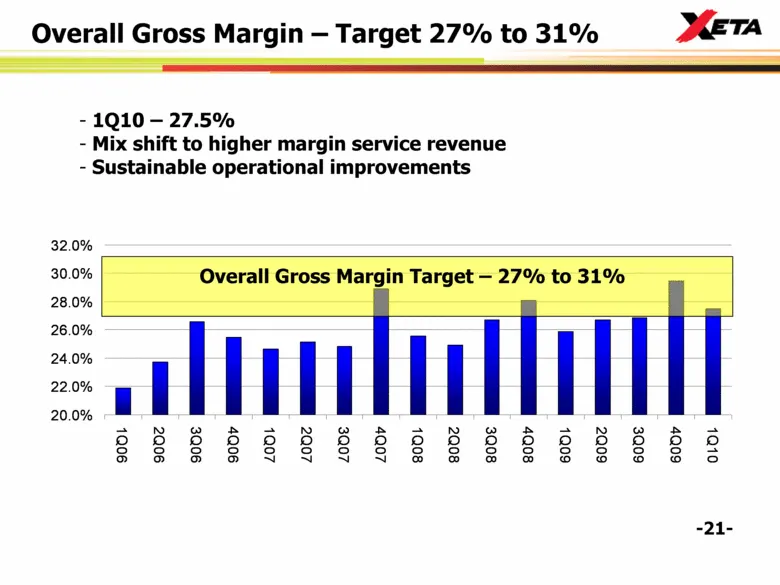
Overall Gross Margin Target – 27% to 31% 1Q10 – 27.5% Mix shift to higher margin service revenue Sustainable operational improvements Overall Gross Margin – Target 27% to 31% 20.0% 22.0% 24.0% 26.0% 28.0% 30.0% 32.0% 1Q06 2Q06 3Q06 4Q06 1Q07 2Q07 3Q07 4Q07 1Q08 2Q08 3Q08 4Q08 1Q09 2Q09 3Q09 4Q09 1Q1
Slide 22: Operating Expense Target
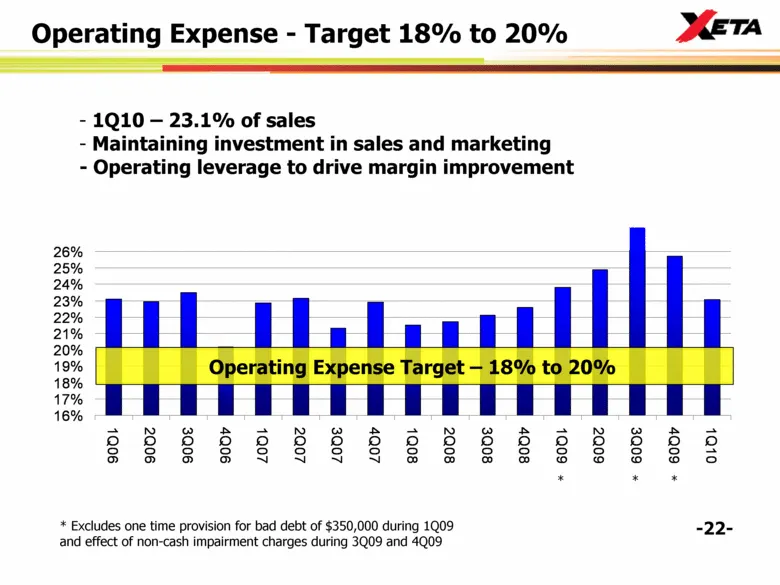
Operating Expense Target – 18% to 20% 1Q10 – 23.1% of sales Maintaining investment in sales and marketing - Operating leverage to drive margin improvement * Excludes one time provision for bad debt of $350,000 during 1Q09 and effect of non-cash impairment charges during 3Q09 and 4Q09 * * * Operating
Slide 23: EBITDA Margin Target
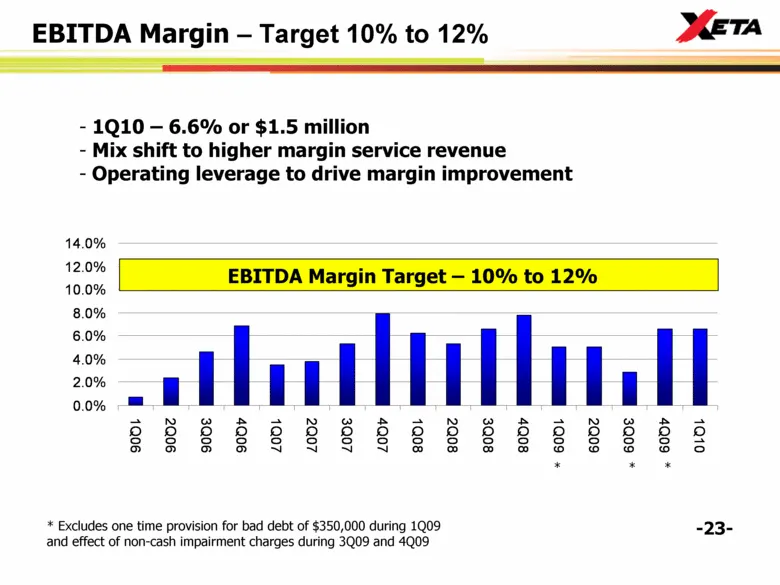
EBITDA Margin Target – 10% to 12% * 1Q10 – 6.6% or $1.5 million Mix shift to higher margin service revenue Operating leverage to drive margin improvement * Excludes one time provision for bad debt of $350,000 during 1Q09 and effect of non-cash impairment charges during 3Q09 and 4Q09 * * EBITDA Margi
Slide 24: Financials – Balance Sheet
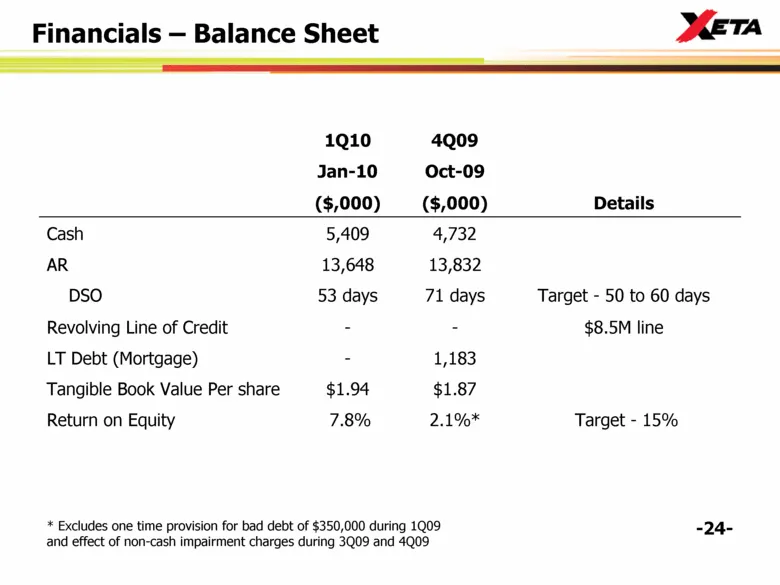
Financials – Balance Sheet * Excludes one time provision for bad debt of $350,000 during 1Q09 and effect of non-cash impairment charges during 3Q09 and 4Q09 1Q10 4Q09 Jan-10 Oct-09 ($,000) ($,000) Details Cash 5,409 4,732 AR 13,648 13,832 DSO 53 days 71 days Target - 50 to 60 days Revolving Line of
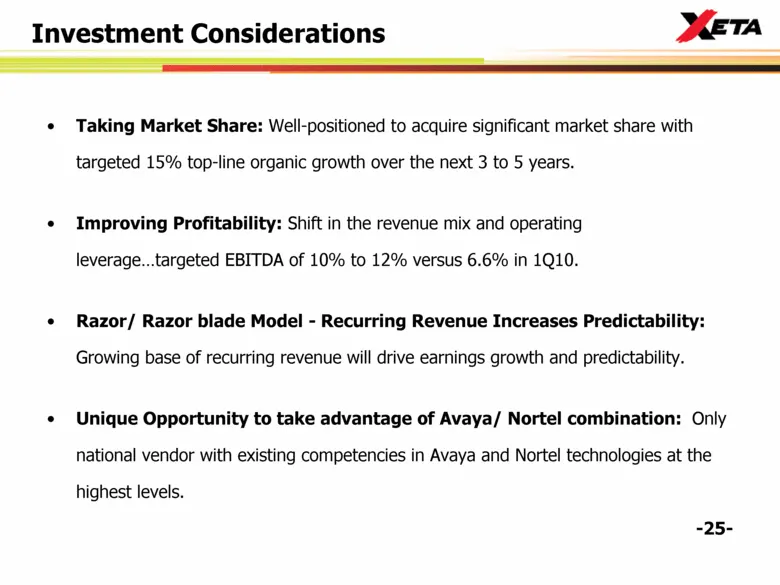
Slide 25: Investment Considerations
Taking Market Share: Well-positioned to acquire significant market share with targeted 15% top-line organic growth over the next 3 to 5 years. Improving Profitability: Shift in the revenue mix and operating leverage targeted EBITDA of 10% to 12% versus 6.6% in 1Q10. Razor/ Razor blade Model - Recurr
Slide 26: ROTH 22nd Annual Growth Stock Conference
April 2007 Investor Presentation ROTH 22nd Annual Growth Stock Conference March 17, 2010
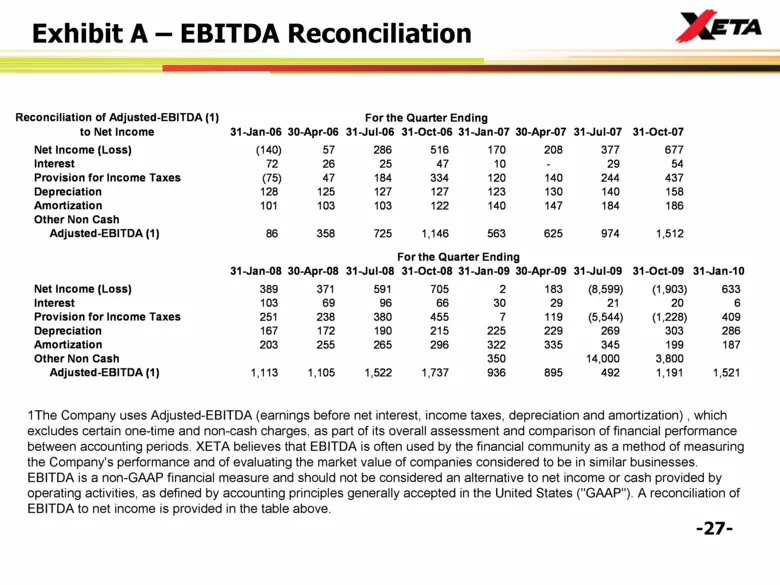
Slide 27: Exhibit A – EBITDA Reconciliation
Exhibit A – EBITDA Reconciliation 1The Company uses Adjusted-EBITDA (earnings before net interest, income taxes, depreciation and amortization) , which excludes certain one-time and non-cash charges, as part of its overall assessment and comparison of financial performance between accounting periods
Source: SEC EDGAR · 8-K filed Mar 17, 2010
More decks from Xeta Technologies Inc
 Southwest IDEAS Conference 201025 slides · Nov 10, 2010
 Midwest IDEAS Conference 201025 slides · Aug 31, 2010
 Southwestern Showcase Investor Conference (November 2008)25 slides · Nov 19, 2008
 B. Riley & Co. Investor Conference 200824 slides · Apr 2, 2008
 Investor Presentation (November 2007)22 slides · Nov 14, 2007