Railamerica — Avondale Partners Conference 2005
26 slides from Railamerica's conference presentation, Jan 31, 2005
Slide 1: Avondale Partners January 31 - February 1, 2005 RailAmerica
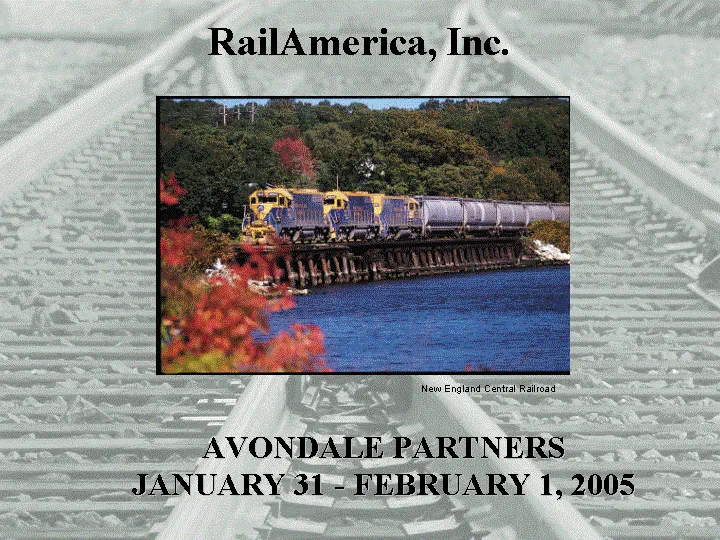
AVONDALE PARTNERS JANUARY 31 - FEBRUARY 1, 2005 RailAmerica, Inc. New England Central Railroad
Slide 2: Forward Looking Statements and Forecasts
Forward Looking Statements and Forecasts This presentation contains forward-looking statements, forecasts, and information regarding future events and the future performance of RailAmerica that involve risks and uncertainties that could cause actual results and actions to differ materially, includin
Slide 3: Corporate Review
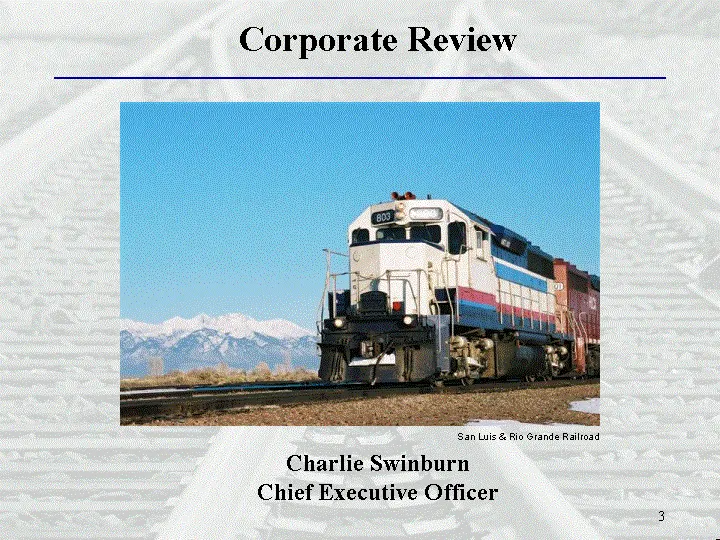
Corporate Review Charlie Swinburn Chief Executive Officer San Luis & Rio Grande Railroad San Luis & Rio Grande Railroad
Slide 4: Company Overview
Company Overview A leading short line and regional rail service provider Successful record of acquiring and integrating railroads Over last 11 years completed 28 acquisitions, including 61 railroads, totaling over $700 million in aggregate purchase price Presently own/lease 44 railroads operating ap
Slide 5: RailAmerica Operations
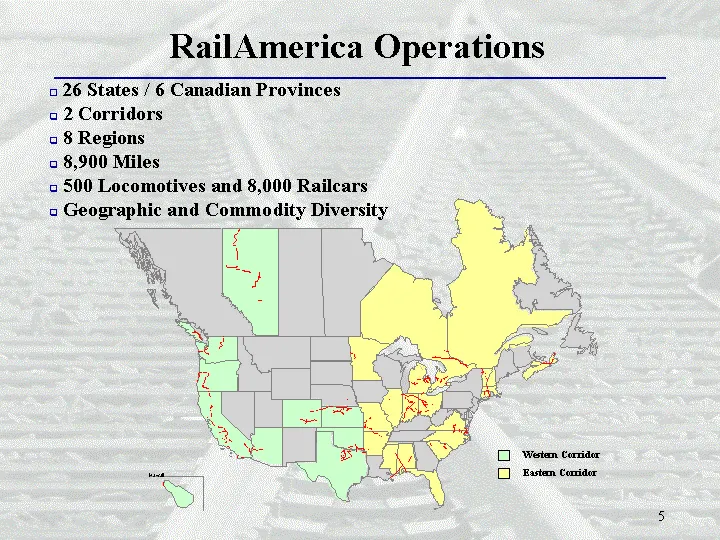
RailAmerica Operations 26 States / 6 Canadian Provinces 2 Corridors 8 Regions 8,900 Miles 500 Locomotives and 8,000 Railcars Geographic and Commodity Diversity Hawaii Western Corridor Eastern Corridor
Slide 6: Diversified Operations
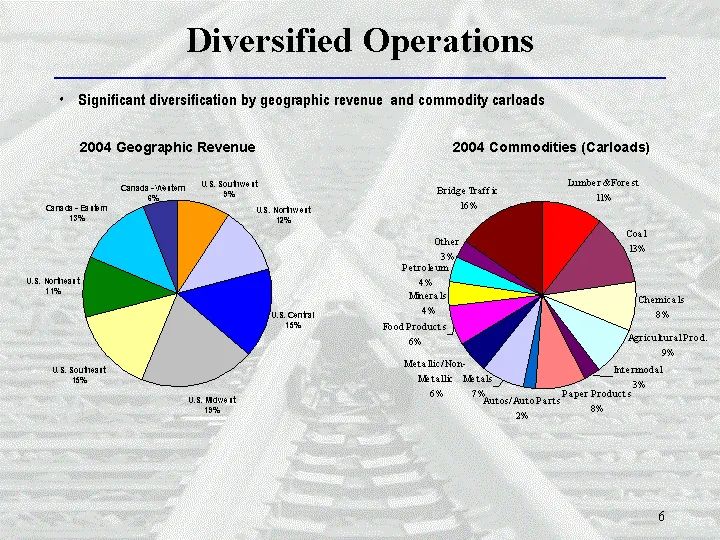
Diversified Operations 2004 Geographic Revenue 2004 Commodities (Carloads) Significant diversification by geographic revenue and commodity carloads U.S. Southwest U.S. Northwest U.S. Central U.S. Midwest U.S. Southeast U.S. Northeast Canada - Eastern Canada - Western East 0.094 0.12 0.16 0.2 0.15 0.
Slide 7: Safety Record
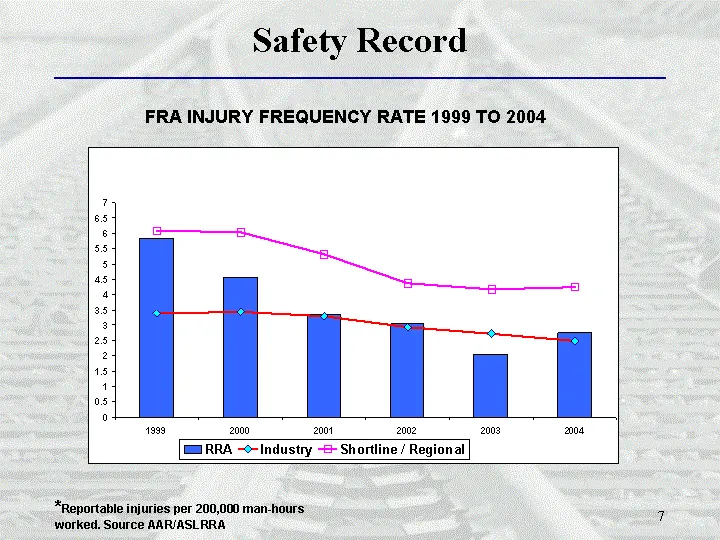
Safety Record FRA INJURY FREQUENCY RATE 1999 TO 2004 *Reportable injuries per 200,000 man-hours worked. Source AAR/ASLRRA
Slide 8: 2004 Significant Events
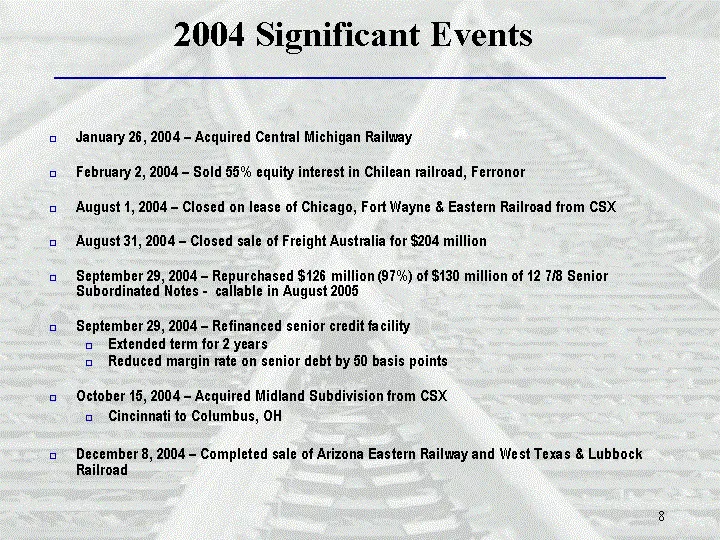
2004 Significant Events January 26, 2004 - Acquired Central Michigan Railway February 2, 2004 - Sold 55% equity interest in Chilean railroad, Ferronor August 1, 2004 - Closed on lease of Chicago, Fort Wayne & Eastern Railroad from CSX August 31, 2004 - Closed sale of Freight Australia for $204 milli
Slide 9: 2005 Priorities
2005 Priorities Provide superior customer service Maintain a safe and rewarding work environment Lever the strengths of our personnel Increase shareholder value
Slide 10: Revenue Growth Goal
Revenue Growth Goal Revenue Growth - Targeting 10% per year Targeting 5% average organic revenue growth per year Economic growth Service initiatives for existing customers New customers on current railroads Pricing and fuel surcharges Distribution services Targeting 5% acquisition growth per year Po
Slide 11: 2005 Target Revenue Growth
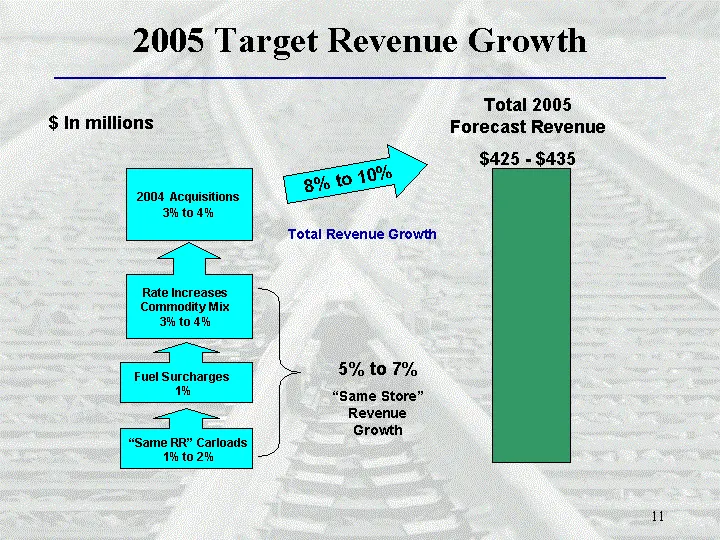
2005 Target Revenue Growth Total Revenue Growth $ In millions $425 - $435 2004 Acquisitions 3% to 4% 8% to 10% Rate Increases Commodity Mix 3% to 4% Fuel Surcharges 1% "Same RR" Carloads 1% to 2% 5% to 7% "Same Store" Revenue Growth Total 2005 Forecast Revenue
Slide 12: Strategic Direction
Strategic Direction Divested non-North American operations Focus on North America - safe and profitable operations Continue balance sheet improvement Working capital Capital structure Continue to grow organically and through profitable acquisitions Employee development Training Succession planning
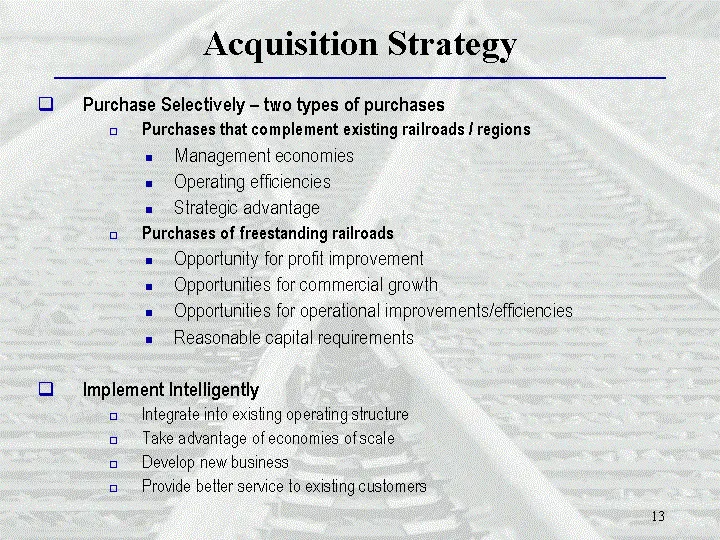
Slide 13: Acquisition Strategy
Acquisition Strategy Purchase Selectively - two types of purchases Purchases that complement existing railroads / regions Management economies Operating efficiencies Strategic advantage Purchases of freestanding railroads Opportunity for profit improvement Opportunities for commercial growth Opportu
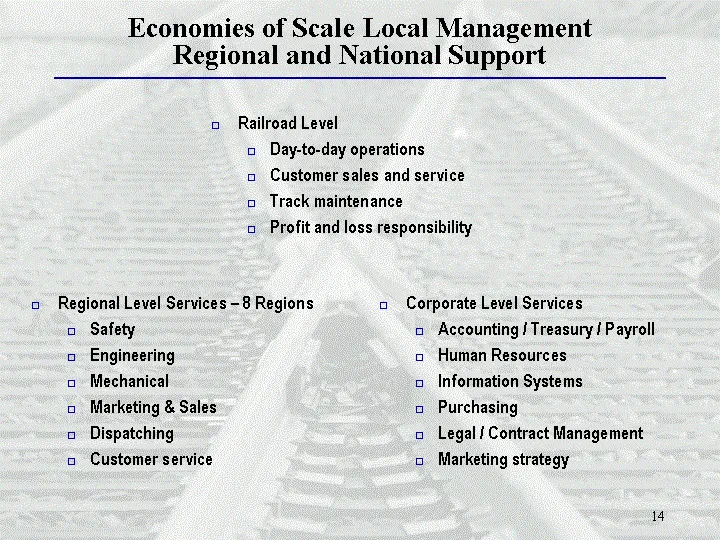
Slide 14: Economies of Scale
Economies of Scale Local Management Regional and National Support Regional Level Services - 8 Regions Safety Engineering Mechanical Marketing & Sales Dispatching Customer service Corporate Level Services Accounting / Treasury / Payroll Human Resources Information Systems Purchasing Legal / Contract
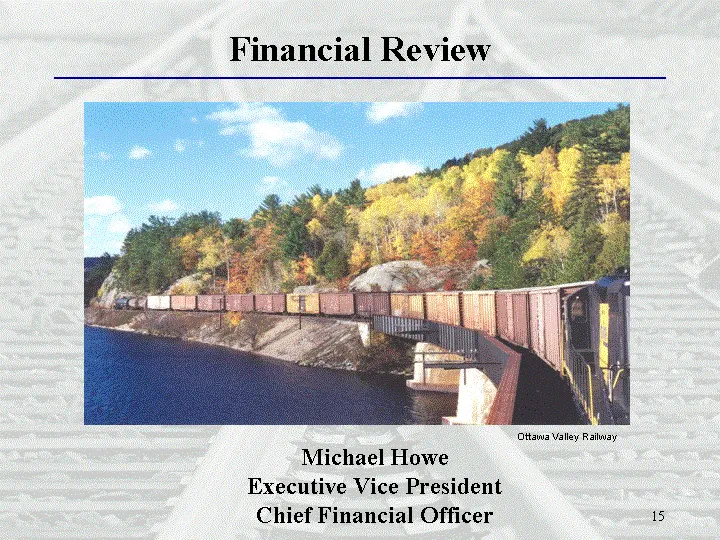
Slide 15: Financial Review
Financial Review Michael Howe Executive Vice President Chief Financial Officer Ottawa Valley Railway Ottawa Valley Railway
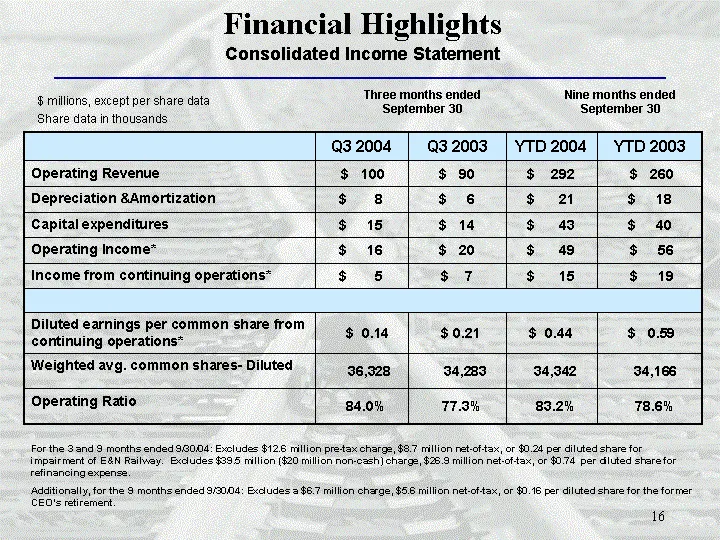
Slide 16: Financial Highlights: Consolidated Income Statement
Financial Highlights Consolidated Income Statement Q3 2004 Q3 2003 YTD 2004 YTD 2003 Operating Revenue $ 100 $ 90 $ 292 $ 260 Depreciation &Amortization $ 8 $ 6 $ 21 $ 18 Capital expenditures $ 15 $ 14 $ 43 $ 40 Operating Income* $ 16 $ 20 $ 49 $ 56 Income from continuing operations* $ 5 $ 7 $ 15 $
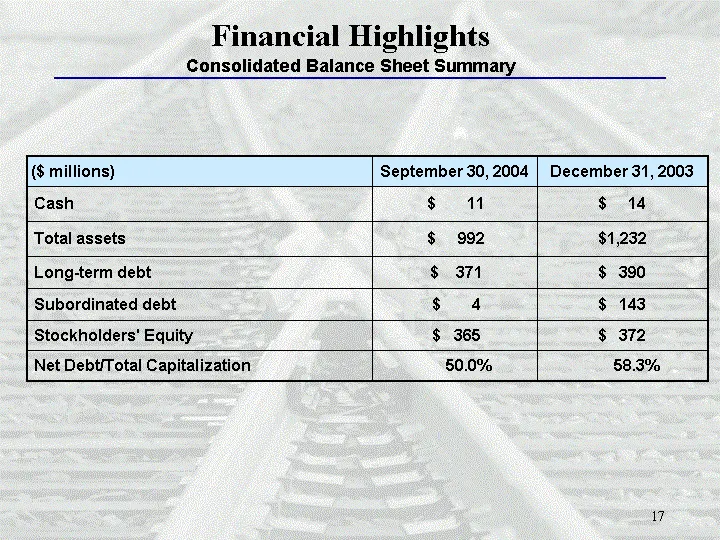
Slide 17: Financial Highlights: Consolidated Balance Sheet Summary
Financial Highlights Consolidated Balance Sheet Summary ($ millions) September 30, 2004 December 31, 2003 Cash $ 11 $ 14 Total assets $ 992 $1,232 Long-term debt $ 371 $ 390 Subordinated debt $ 4 $ 143 Stockholders' Equity $ 365 $ 372 Net Debt/Total Capitalization 50.0% 58.3%
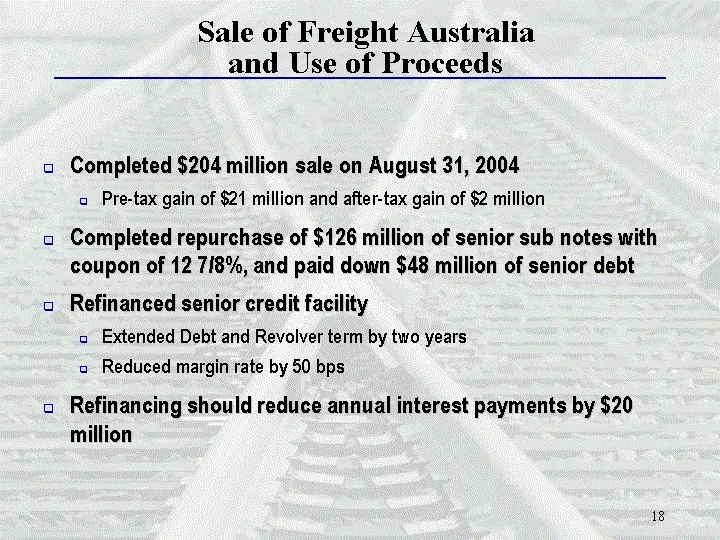
Slide 18: Sale of Freight Australia and Use of Proceeds
Sale of Freight Australia and Use of Proceeds Completed $204 million sale on August 31, 2004 Pre-tax gain of $21 million and after-tax gain of $2 million Completed repurchase of $126 million of senior sub notes with coupon of 12 7/8%, and paid down $48 million of senior debt Refinanced senior credit
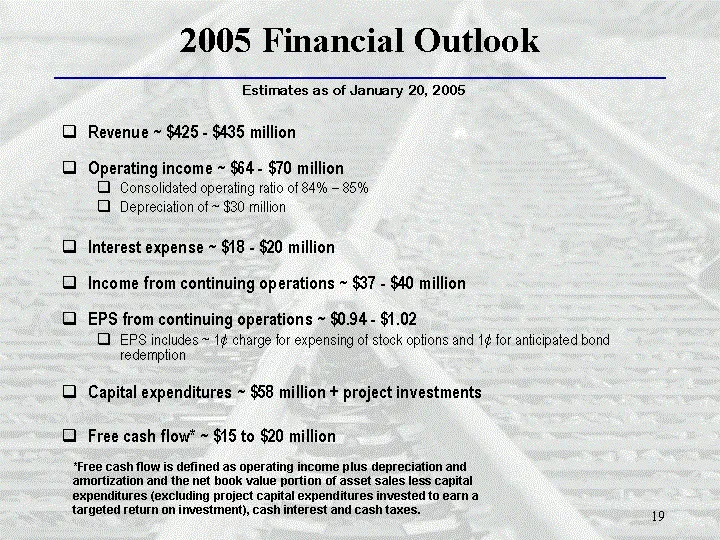
Slide 19: 2005 Financial Outlook
2005 Financial Outlook Revenue ~ $425 - $435 million Operating income ~ $64 - $70 million Consolidated operating ratio of 84% - 85% Depreciation of ~ $30 million Interest expense ~ $18 - $20 million Income from continuing operations ~ $37 - $40 million EPS from continuing operations ~ $0.94 - $1.02
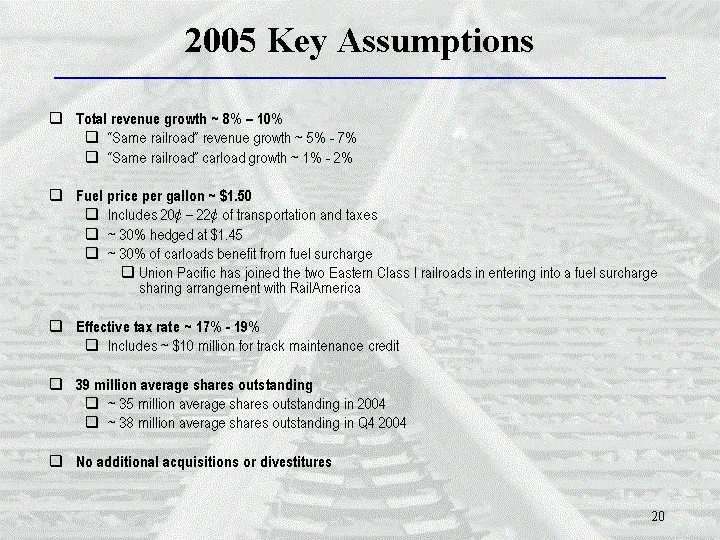
Slide 20: 2005 Key Assumptions
2005 Key Assumptions Total revenue growth ~ 8% - 10% "Same railroad" revenue growth ~ 5% - 7% "Same railroad" carload growth ~ 1% - 2% Fuel price per gallon ~ $1.50 Includes 20¢ - 22¢ of transportation and taxes ~ 30% hedged at $1.45 ~ 30% of carloads benefit from fuel surcharge Union Pacific has jo
Slide 21: Fuel Surcharge Revenue
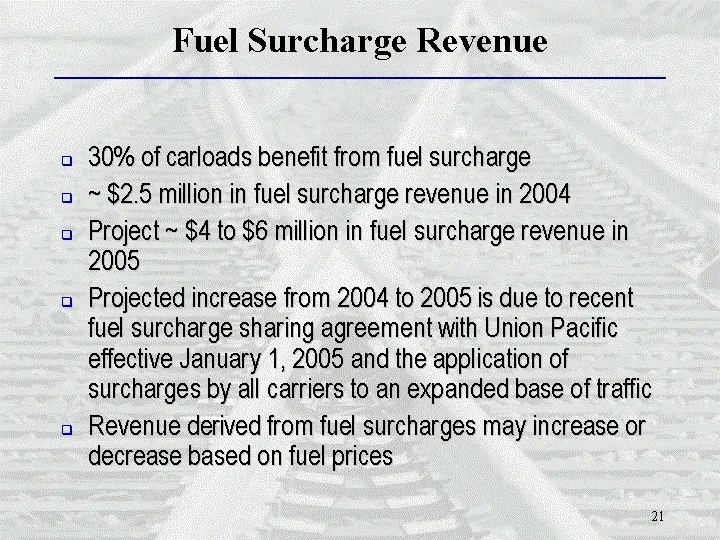
Fuel Surcharge Revenue 30% of carloads benefit from fuel surcharge ~ $2.5 million in fuel surcharge revenue in 2004 Project ~ $4 to $6 million in fuel surcharge revenue in 2005 Projected increase from 2004 to 2005 is due to recent fuel surcharge sharing agreement with Union Pacific effective January
Slide 22: American Jobs Creation Act of 2004
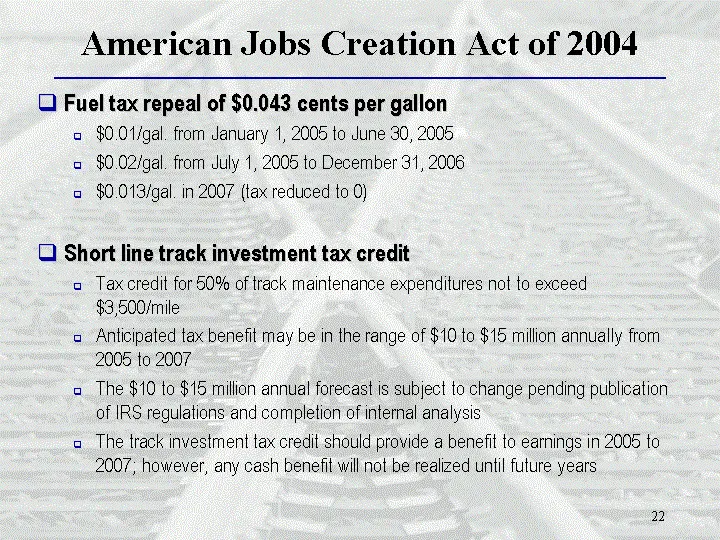
American Jobs Creation Act of 2004 Fuel tax repeal of $0.043 cents per gallon $0.01/gal. from January 1, 2005 to June 30, 2005 $0.02/gal. from July 1, 2005 to December 31, 2006 $0.013/gal. in 2007 (tax reduced to 0) Short line track investment tax credit Tax credit for 50% of track maintenance expen
Slide 23: First Quarter 2005 Outlook
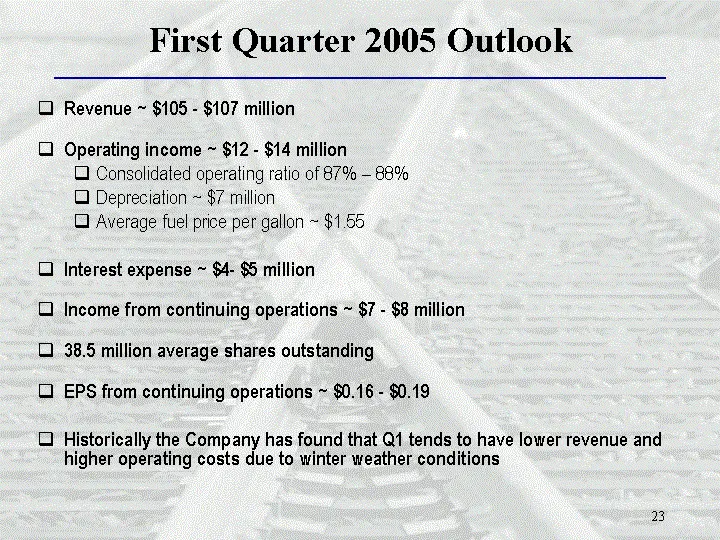
First Quarter 2005 Outlook Revenue ~ $105 - $107 million Operating income ~ $12 - $14 million Consolidated operating ratio of 87% - 88% Depreciation ~ $7 million Average fuel price per gallon ~ $1.55 Interest expense ~ $4- $5 million Income from continuing operations ~ $7 - $8 million 38.5 million a
Slide 24: Significant Risk Factors
Significant Risk Factors Continued Class I congestion and potential labor issues Inclement weather Fuel price volatility Slower than expected results from safety initiatives Weaker economic conditions
Slide 25: Investment Considerations
Investment Considerations Greater visibility provided through recent divestitures, capital structure improvements and fuel hedges/surcharges Strong revenue growth Strong economy Robust acquisition environment Growth opportunities through investment in commercial projects Strong balance sheet Achieve
Slide 26: Avondale Partners January 31 - February 1, 2005 RailAmerica
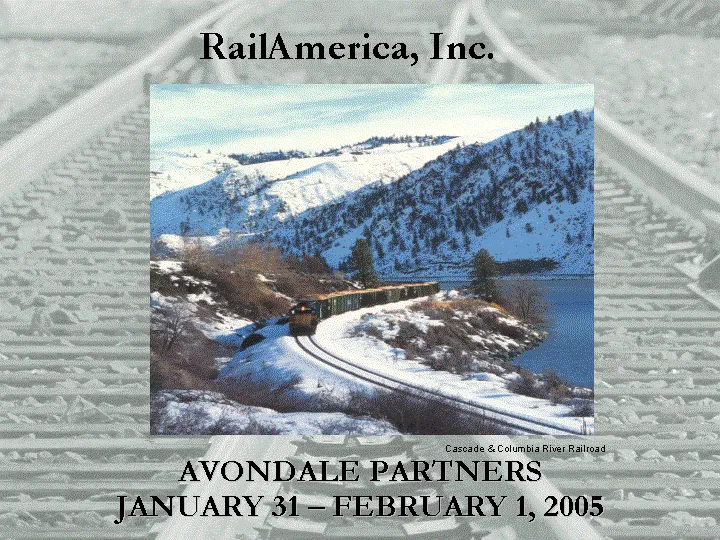
AVONDALE PARTNERS JANUARY 31 - FEBRUARY 1, 2005 RailAmerica, Inc. Cascade & Columbia River Railroad
Source: SEC EDGAR · 8-K filed Jan 31, 2005
More decks from Railamerica Inc
 Q2 2012 Earnings Presentation25 slides · Jul 25, 2012
 Q1 2012 Earnings Presentation29 slides · Apr 26, 2012
 Q4 2011 Earnings Presentation33 slides · Feb 9, 2012
 Q3 2011 Earnings Presentation28 slides · Oct 26, 2011
 Q2 2011 Earnings Presentation27 slides · Jul 28, 2011
 Q1 2011 Earnings Presentation28 slides · Apr 28, 2011