Furmanite — Q3 2013 Earnings Presentation
17 slides from Furmanite's earnings presentation, Nov 1, 2013
Slide 1: Furmanite Corporation Three and Nine Months Ended September 30, 2013
Furmanite Corporation THREE AND NINE MONTHS ENDED SEPTEMBER 30, 2013 Charles R. Cox, Chairman & CEO Joseph E. Milliron, President & COO Robert S. Muff, Principal Financial Officer
Slide 2: Forward-looking statements
Certain of the Company’s statements in this presentation are not purely historical, and as such are “forward-looking statements” within the meaning of the Private Securities Litigation Reform Act of 1995. These include statements regarding management’s plans, beliefs, expectations, intentions or pro
Slide 3: Furmanite Corporation – Charles R. Cox, Chairman & CEO
Furmanite Corporation THREE AND NINE MONTHS ENDED SEPTEMBER 30, 2013 Charles R. Cox, Chairman & CEO 3
Slide 4: 2013 Third Quarter Perspective
4 2013 Third Quarter Perspective • Continuing Overall Revenue and Earnings Growth • FTS Now Solidly On Board and “Linked In” • Orange Way Implementation in EMEA and APAC • Lots of Room for Growth and Improvement • Our Goal is to Make Our Transformation Global, Consistent and Permanent

Slide 5: 2013 – 2015 Strategic Update
5 2013 – 2015 Strategic Update • Committed to Continuing Substantial Global Growth • Growth in Both Market Share and Target Market Size • Technical Solutions and Program Management Capabilities • Both Organic and Acquisition Future Growth • Maintain Tight Focus on What WE Do Well • Continued Custome
Slide 6: Financial Review
Furmanite Corporation THREE AND NINE MONTHS ENDED SEPTEMBER 30, 2013 Financial Review Robert S. Muff, Principal Financial Officer 6
Slide 7: Condensed Consolidated Statements of Operations – Three Months
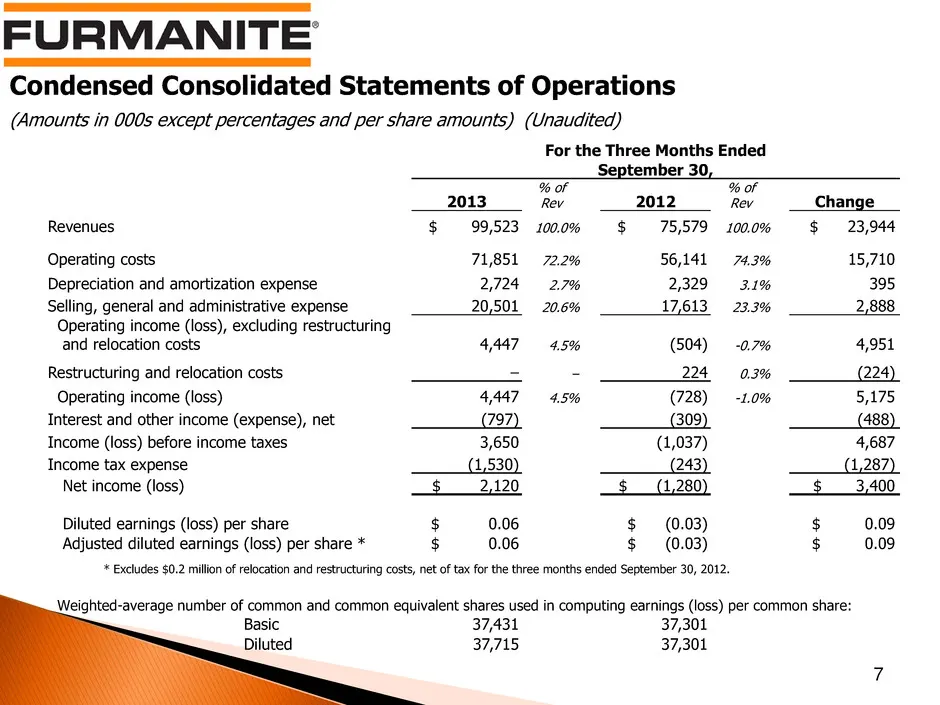
Condensed Consolidated Statements of Operations (Amounts in 000s except percentages and per share amounts) (Unaudited) 7 For the Three Months Ended September 30, 2013 % of Rev 2012 % of Rev Change Revenues $ 99,523 100.0% $ 75,579 100.0% $ 23,944 Operating costs 71,851 72.2% 56,141 74.3% 15,710 Depr
Slide 8: Condensed Consolidated Statements of Operations – Nine Months
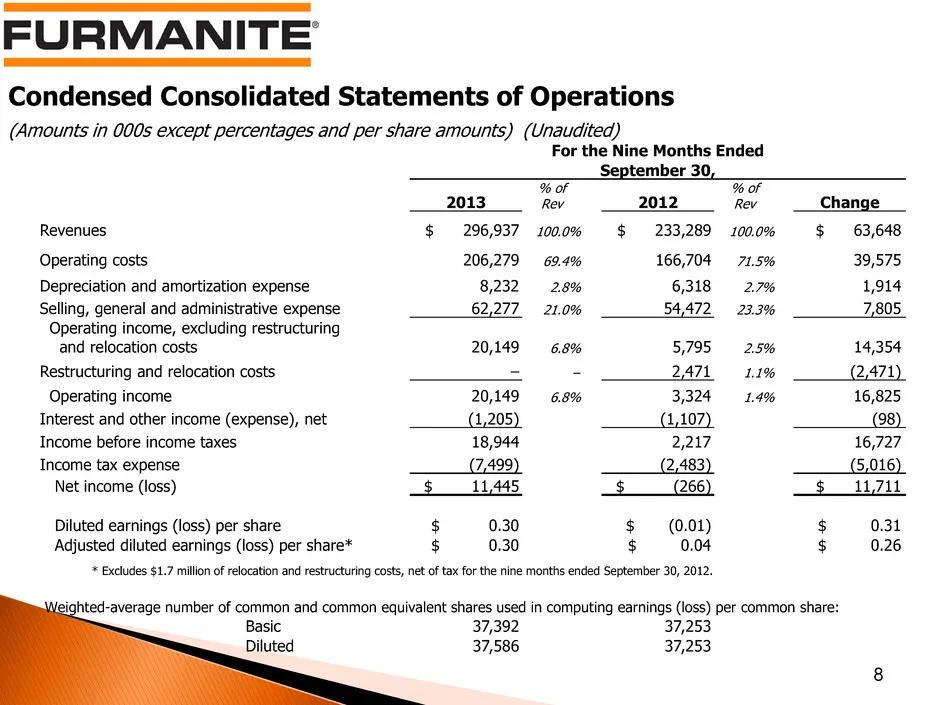
Condensed Consolidated Statements of Operations (Amounts in 000s except percentages and per share amounts) (Unaudited) 8 For the Nine Months Ended September 30, 2013 % of Rev 2012 % of Rev Change Revenues $ 296,937 100.0% $ 233,289 100.0% $ 63,648 Operating costs 206,279 69.4% 166,704 71.5% 39,575 D
Slide 9: Revenues Adjusted for Currency Rates
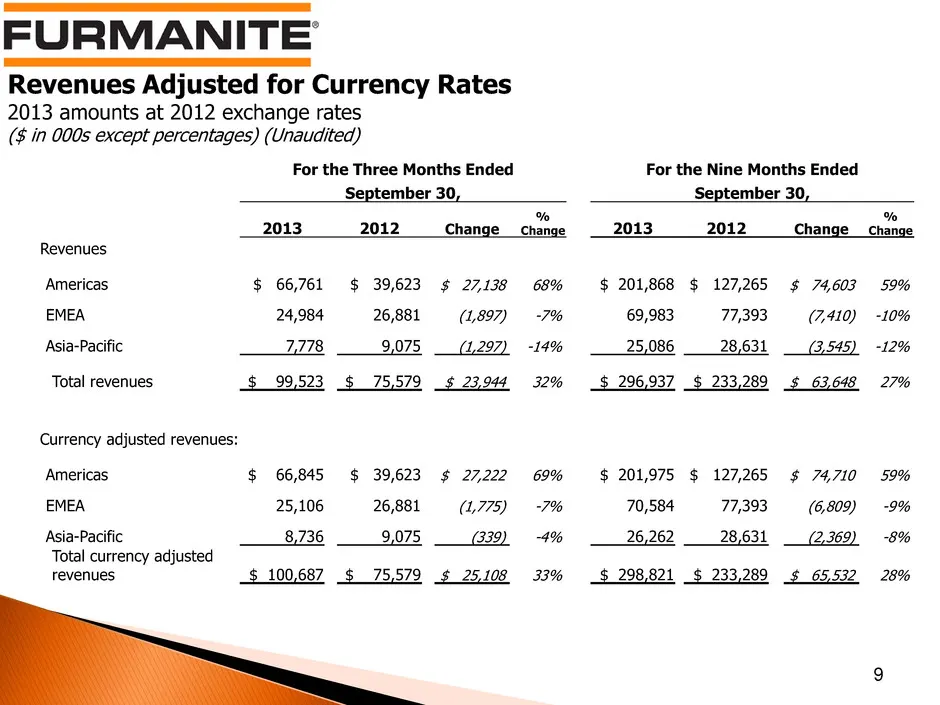
Revenues Adjusted for Currency Rates 2013 amounts at 2012 exchange rates ($ in 000s except percentages) (Unaudited) 9 For the Three Months Ended For the Nine Months Ended September 30, September 30, 2013 2012 Change % Change 2013 2012 Change % Change Revenues Americas $ 66,761 $ 39,623 $ 27,138 68%
Slide 10: Business Segment Data
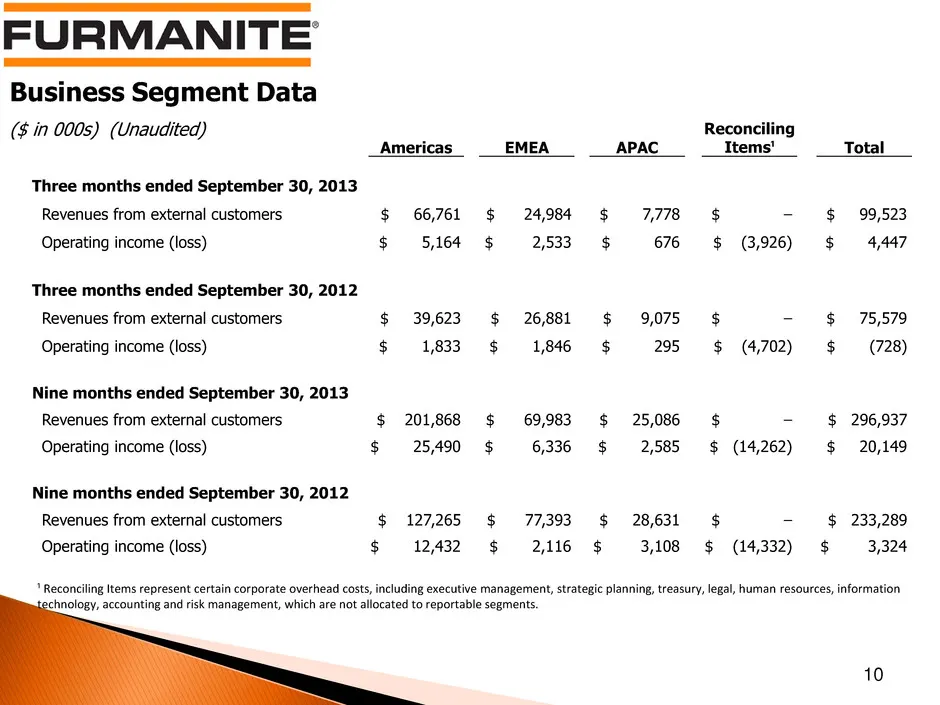
Business Segment Data ($ in 000s) (Unaudited) 10 Americas EMEA APAC Reconciling Items¹ Total Three months ended September 30, 2013 Revenues from external customers $ 66,761 $ 24,984 $ 7,778 $ – $ 99,523 Operating income (loss) $ 5,164 $ 2,533 $ 676 $ (3,926) $ 4,447 Three months ended September 30,
Slide 11: Condensed Consolidated Balance Sheets
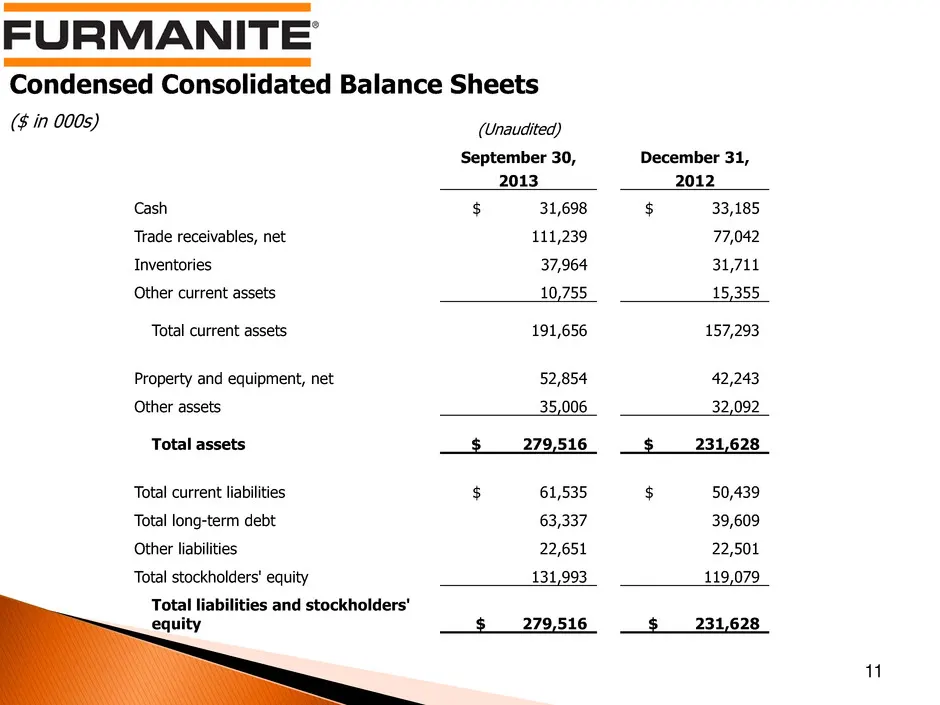
Condensed Consolidated Balance Sheets ($ in 000s) 11 (Unaudited) September 30, December 31, 2013 2012 Cash $ 31,698 $ 33,185 Trade receivables, net 111,239 77,042 Inventories 37,964 31,711 Other current assets 10,755 15,355 Total current assets 191,656 157,293 Property and equipment, net 52,854 42,2
Slide 12: Condensed Consolidated Statements of Cash Flows
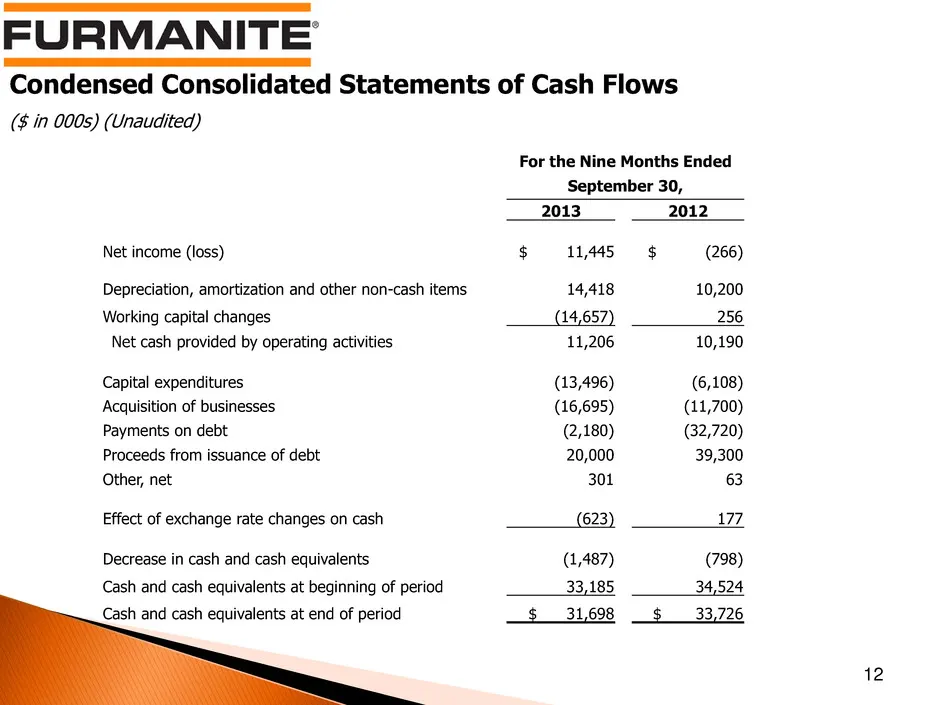
Condensed Consolidated Statements of Cash Flows ($ in 000s) (Unaudited) 12 For the Nine Months Ended September 30, 2013 2012 Net income (loss) $ 11,445 $ (266) Depreciation, amortization and other non-cash items 14,418 10,200 Working capital changes (14,657) 256 Net cash provided by operating activi
Slide 13: Operations Review
Furmanite Corporation THREE AND NINE MONTHS ENDED SEPTEMBER 30, 2013 Operations Review Joseph E. Milliron, President and Chief Operating Officer 13
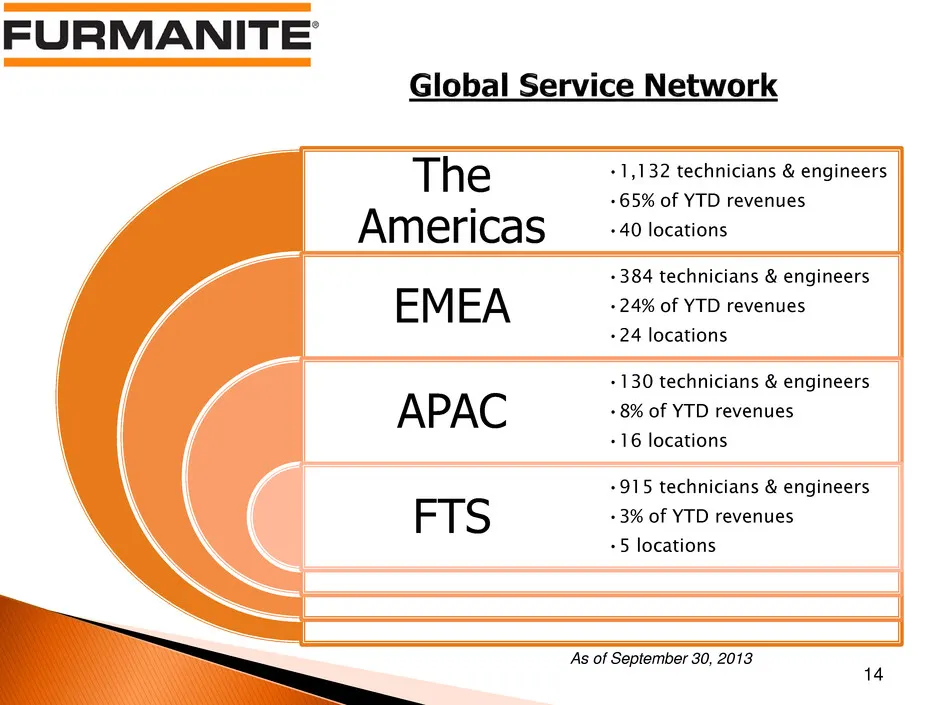
Slide 14: The Americas, EMEA, APAC, FTS
The Americas EMEA APAC FTS •1,132 technicians & engineers •65% of YTD revenues •40 locations •384 technicians & engineers •24% of YTD revenues •24 locations •130 technicians & engineers •8% of YTD revenues •16 locations •915 technicians & engineers •3% of YTD revenues •5 locations As of September 30
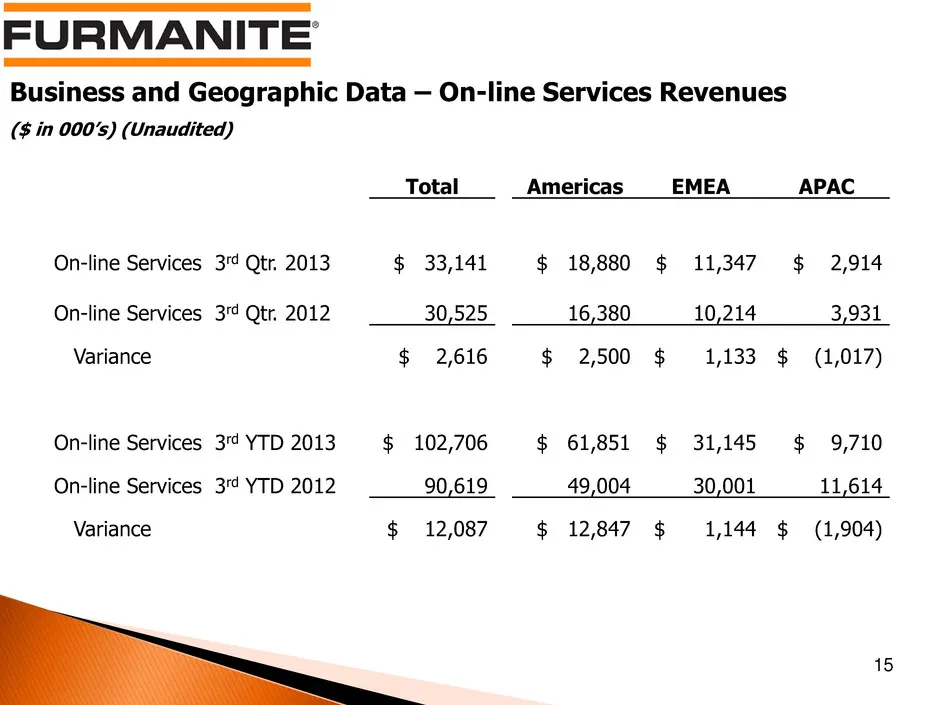
Slide 15: Business and Geographic Data – On-line Services Revenues
15 Total Americas EMEA APAC On-line Services 3rd Qtr. 2013 $ 33,141 $ 18,880 $ 11,347 $ 2,914 On-line Services 3rd Qtr. 2012 30,525 16,380 10,214 3,931 Variance $ 2,616 $ 2,500 $ 1,133 $ (1,017) On-line Services 3rd YTD 2013 $ 102,706 $ 61,851 $ 31,145 $ 9,710 On-line Services 3rd YTD 2012 90,619 49
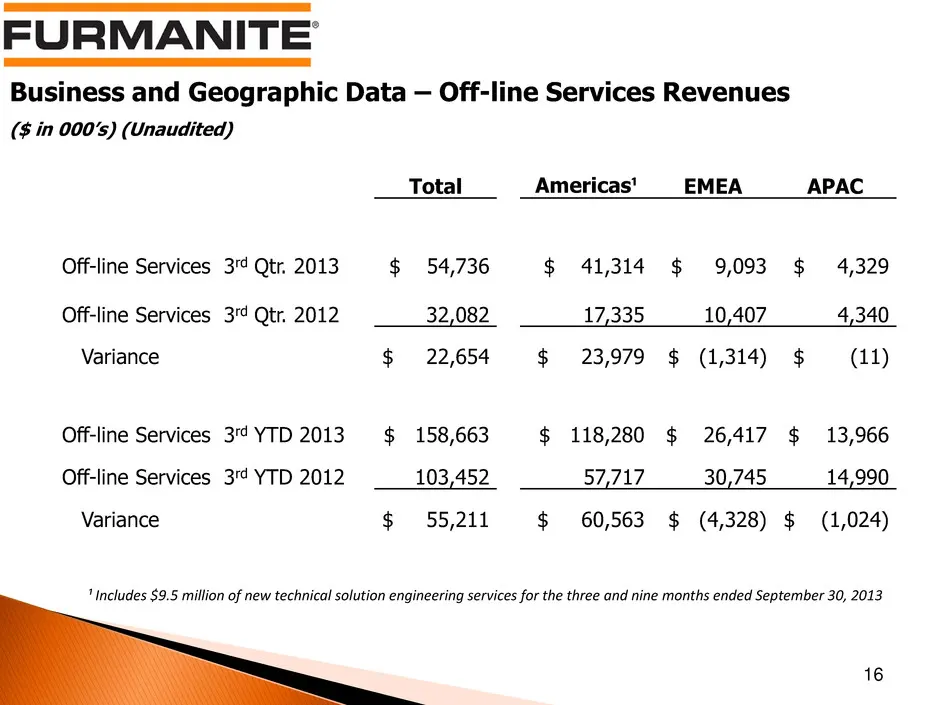
Slide 16: Business and Geographic Data – Off-line Services Revenues
Business and Geographic Data – Off-line Services Revenues ($ in 000’s) (Unaudited) 16 Total Americas¹ EMEA APAC Off-line Services 3rd Qtr. 2013 $ 54,736 $ 41,314 $ 9,093 $ 4,329 Off-line Services 3rd Qtr. 2012 32,082 17,335 10,407 4,340 Variance $ 22,654 $ 23,979 $ (1,314) $ (11) Off-line Services 3

Slide 17: Furmanite Corporation Review of 3Q 2013
Furmanite Corporation Review of 3Q 2013 November 1, 2013 www.furmanite.com 17
Source: SEC EDGAR · 8-K filed Nov 1, 2013
More decks from Furmanite Corp
 Merger or Acquisition (November 2015)13 slides · Nov 2, 2015
 Q2 2015 Earnings Presentation19 slides · Aug 4, 2015
 Q1 2015 Earnings Presentation16 slides · May 11, 2015
 Proxy Contest (April 2015)40 slides · Apr 2, 2015
 Proxy Contest (April 2015)29 slides · Apr 2, 2015
 Proxy Contest (March 2015)39 slides · Mar 30, 2015