Furmanite — Q4 2013 Earnings Presentation
16 slides from Furmanite's earnings presentation, Mar 7, 2014
Slide 1: Furmanite Corporation Quarter and Year Ended December 31, 2013
Furmanite Corporation QUARTER AND YEAR ENDED DECEMBER 31, 2013 Charles R. Cox, Chairman & CEO Joseph E. Milliron, President & COO Robert S. Muff, Chief Financial Officer
Slide 2: Forward-Looking Statements
Certain of the Company’s statements in this presentation are not purely historical, and as such are “forward-looking statements” within the meaning of the Private Securities Litigation Reform Act of 1995. These include statements regarding management’s plans, beliefs, expectations, intentions or pro
Slide 3: Furmanite Corporation – Charles R. Cox, Chairman & CEO
Furmanite Corporation QUARTER AND YEAR ENDED DECEMBER 31, 2013 Charles R. Cox, Chairman & CEO 3
Slide 4: Financial Review
Furmanite Corporation QUARTER AND YEAR ENDED DECEMBER 31, 2013 Financial Review Robert S. Muff, Chief Financial Officer 4
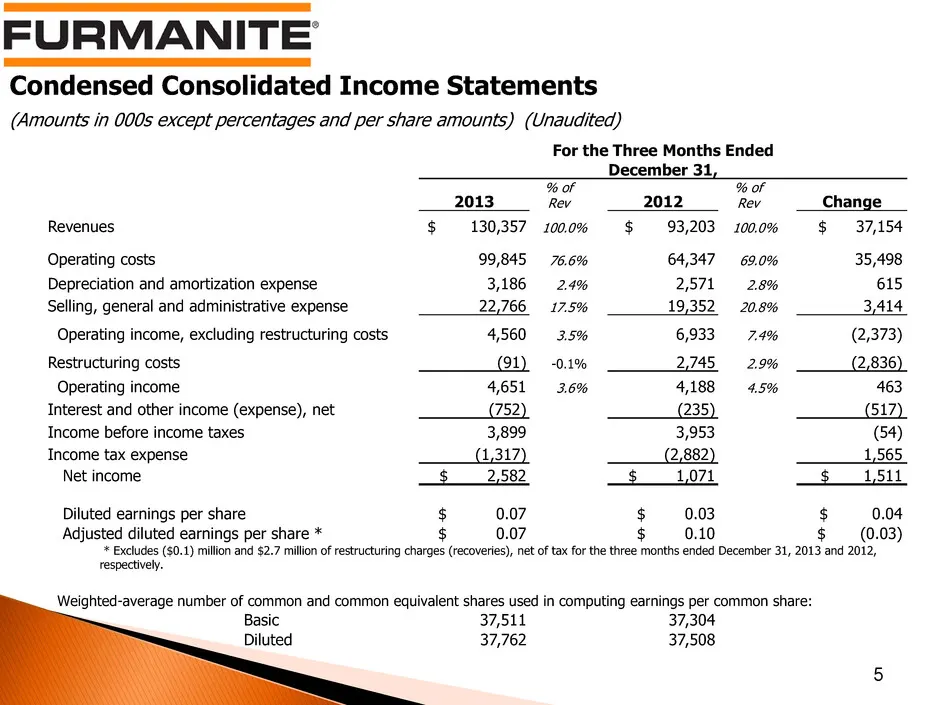
Slide 5: Condensed Consolidated Income Statements – Three Months
Condensed Consolidated Income Statements (Amounts in 000s except percentages and per share amounts) (Unaudited) 5 For the Three Months Ended December 31, 2013 % of Rev 2012 % of Rev Change Revenues $ 130,357 100.0% $ 93,203 100.0% $ 37,154 Operating costs 99,845 76.6% 64,347 69.0% 35,498 Depreciatio
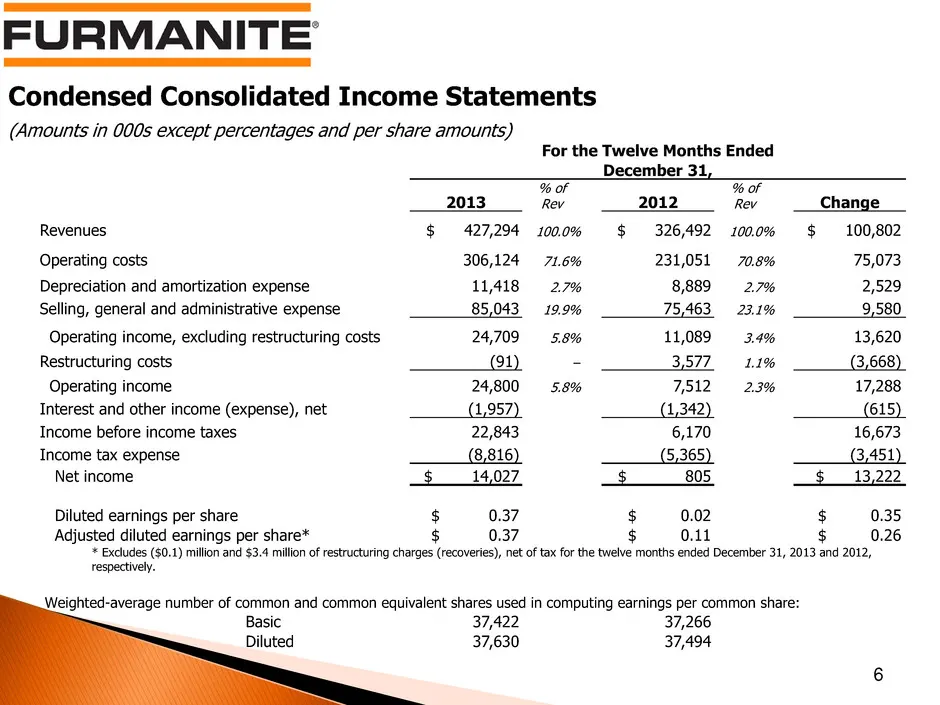
Slide 6: Condensed Consolidated Income Statements – Twelve Months
Condensed Consolidated Income Statements (Amounts in 000s except percentages and per share amounts) 6 For the Twelve Months Ended December 31, 2013 % of Rev 2012 % of Rev Change Revenues $ 427,294 100.0% $ 326,492 100.0% $ 100,802 Operating costs 306,124 71.6% 231,051 70.8% 75,073 Depreciation and a
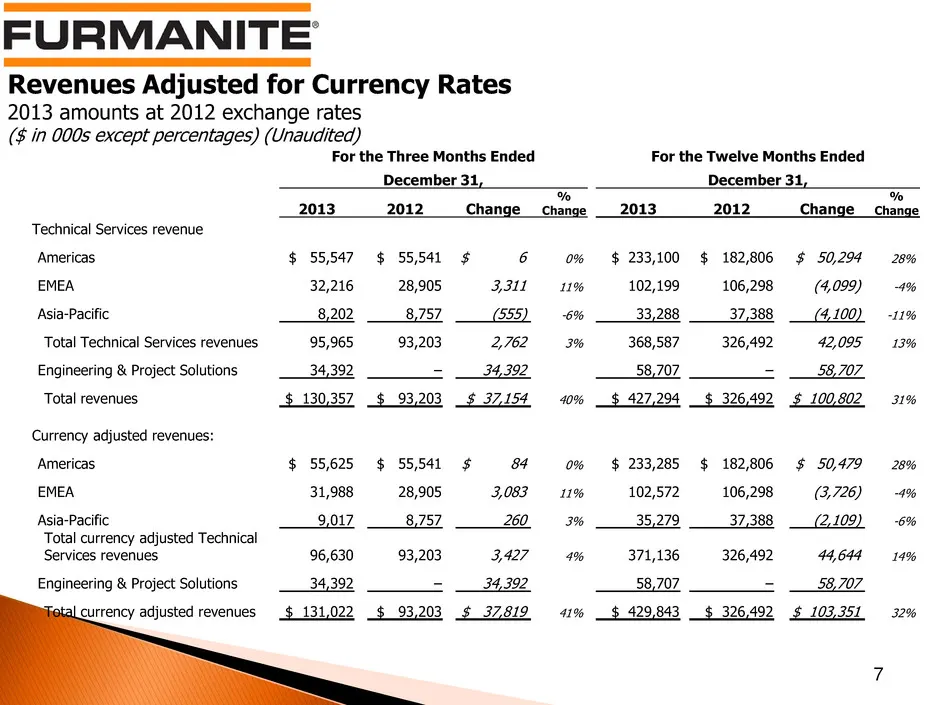
Slide 7: Revenues Adjusted for Currency Rates
Revenues Adjusted for Currency Rates 2013 amounts at 2012 exchange rates ($ in 000s except percentages) (Unaudited) 7 For the Three Months Ended For the Twelve Months Ended December 31, December 31, 2013 2012 Change % Change 2013 2012 Change % Change Technical Services revenue Americas $ 55,547 $ 55
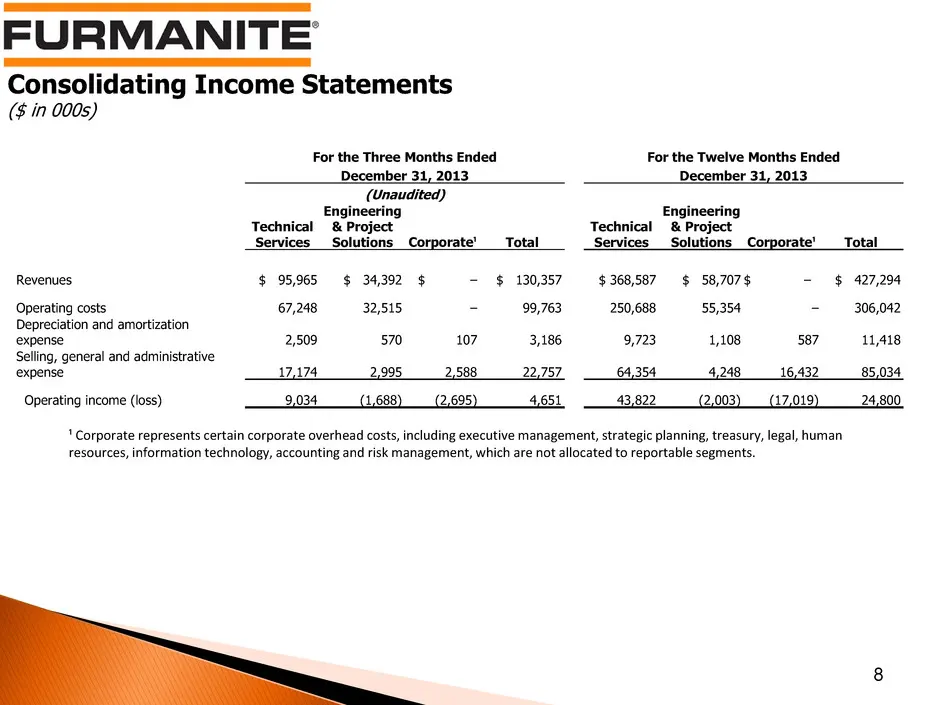
Slide 8: Consolidating Income Statements
Consolidating Income Statements ($ in 000s) 8 For the Three Months Ended For the Twelve Months Ended December 31, 2013 December 31, 2013 (Unaudited) Technical Services Engineering & Project Solutions Corporate¹ Total Technical Services Engineering & Project Solutions Corporate¹ Total Revenues $ 95,9
Slide 9: Business Segment Data
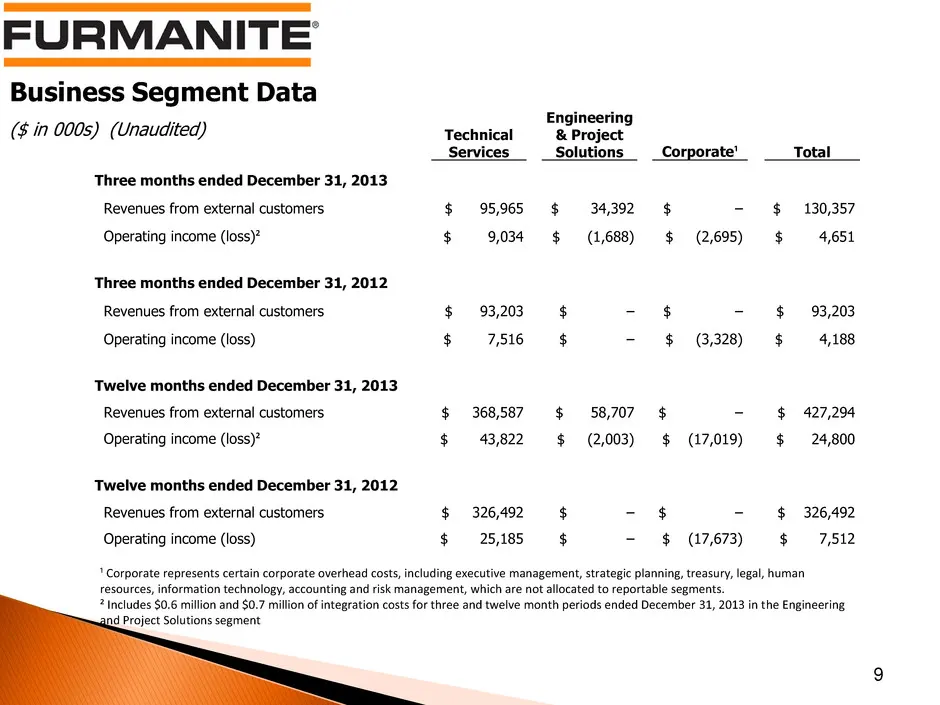
Business Segment Data ($ in 000s) (Unaudited) 9 Technical Services Engineering & Project Solutions Corporate¹ Total Three months ended December 31, 2013 Revenues from external customers $ 95,965 $ 34,392 $ – $ 130,357 Operating income (loss)² $ 9,034 $ (1,688) $ (2,695) $ 4,651 Three months ended De
Slide 10: Condensed Consolidated Balance Sheets
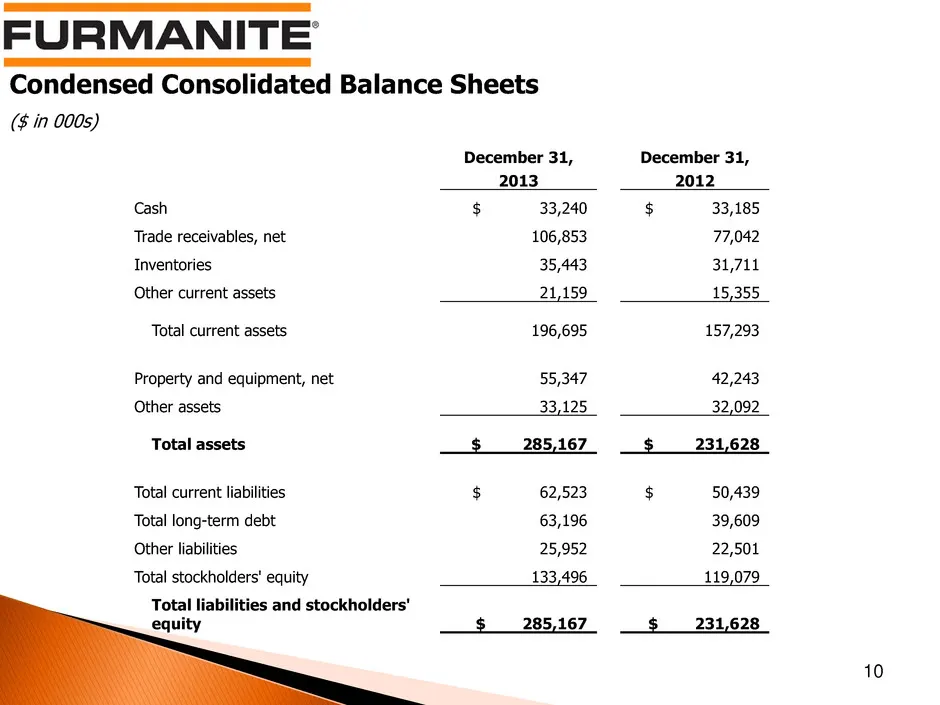
Condensed Consolidated Balance Sheets ($ in 000s) 10 December 31, December 31, 2013 2012 Cash $ 33,240 $ 33,185 Trade receivables, net 106,853 77,042 Inventories 35,443 31,711 Other current assets 21,159 15,355 Total current assets 196,695 157,293 Property and equipment, net 55,347 42,243 Other asse
Slide 11: Condensed Consolidated Statements of Cash Flows
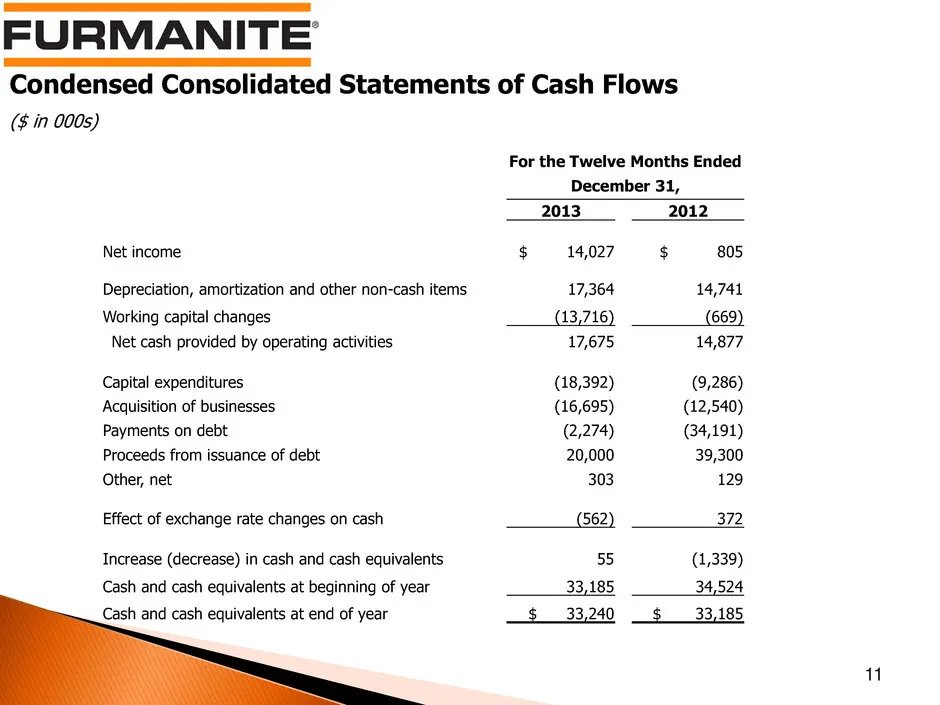
Condensed Consolidated Statements of Cash Flows ($ in 000s) 11 For the Twelve Months Ended December 31, 2013 2012 Net income $ 14,027 $ 805 Depreciation, amortization and other non-cash items 17,364 14,741 Working capital changes (13,716) (669) Net cash provided by operating activities 17,675 14,877
Slide 12: Operations Review
Furmanite Corporation QUARTER AND YEAR ENDED DECEMBER 31, 2013 Operations Review Joseph E. Milliron, President and Chief Operating Officer 12
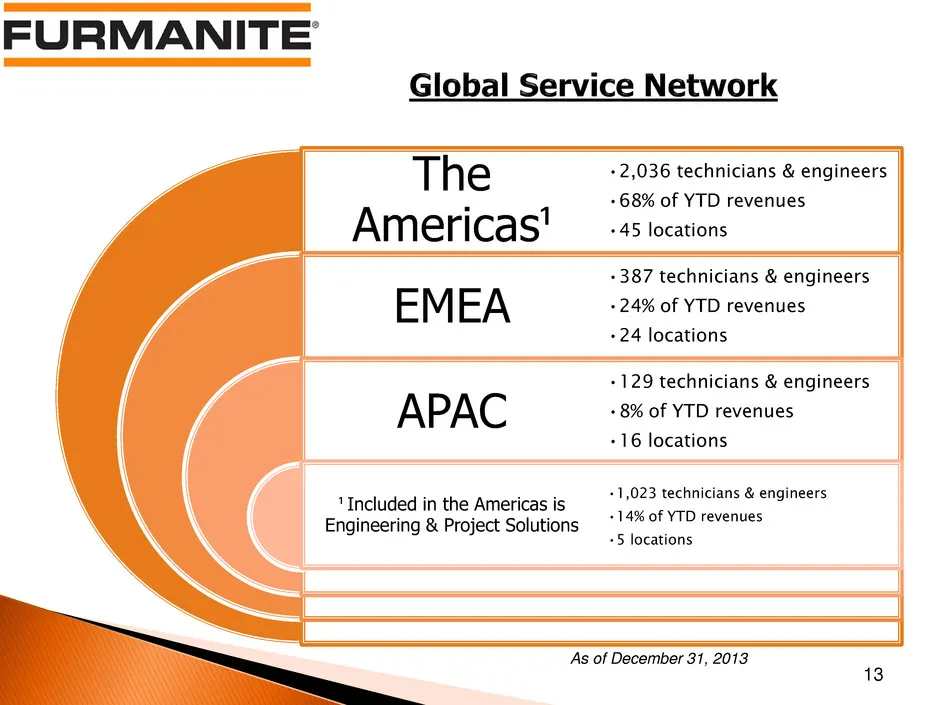
Slide 13: The Americas, EMEA, APAC
The Americas¹ EMEA APAC ¹ Included in the Americas is Engineering & Project Solutions •2,036 technicians & engineers •68% of YTD revenues •45 locations •387 technicians & engineers •24% of YTD revenues •24 locations •129 technicians & engineers •8% of YTD revenues •16 locations •1,023 technicians &
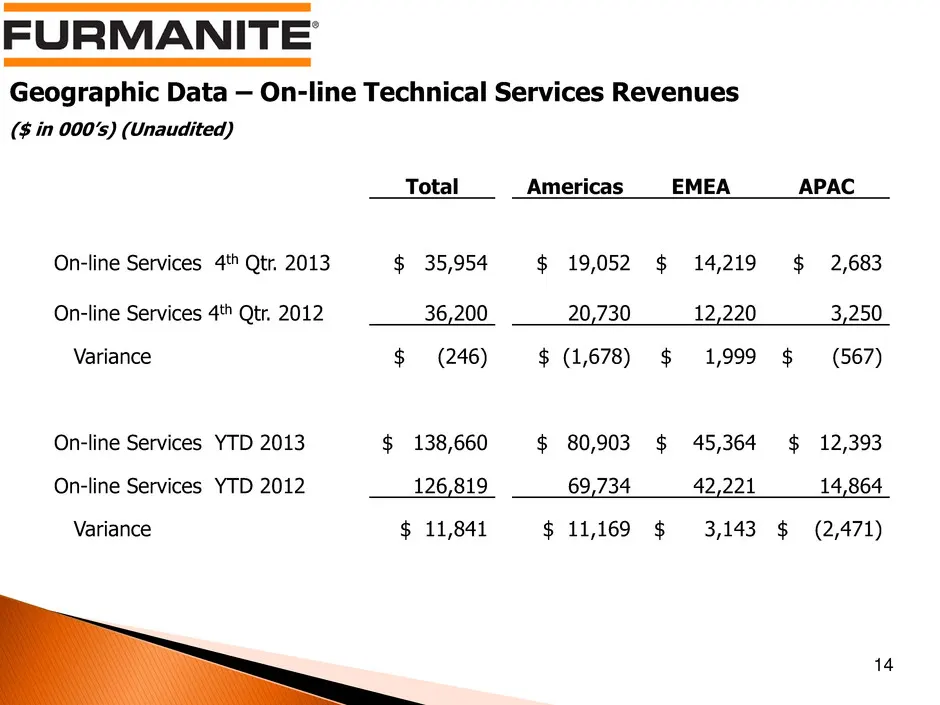
Slide 14: Geographic Data – On-line Technical Services Revenues
14 Geographic Data – On-line Technical Services Revenues ($ in 000’s) (Unaudited) Total Americas EMEA APAC On-line Services 4th Qtr. 2013 $ 35,954 $ 19,052 $ 14,219 $ 2,683 On-line Services 4th Qtr. 2012 36,200 20,730 12,220 3,250 Variance $ (246) $ (1,678) $ 1,999 $ (567) On-line Services YTD 2013
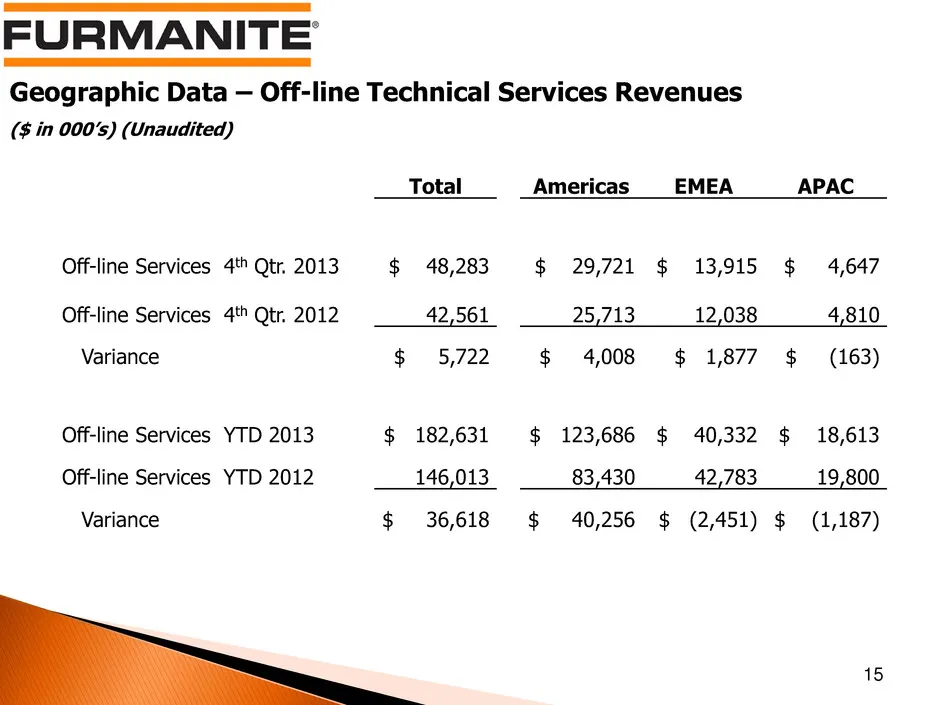
Slide 15: Geographic Data – Off-line Technical Services Revenues
Geographic Data – Off-line Technical Services Revenues ($ in 000’s) (Unaudited) 15 Total Americas EMEA APAC Off-line Services 4th Qtr. 2013 $ 48,283 $ 29,721 $ 13,915 $ 4,647 Off-line Services 4th Qtr. 2012 42,561 25,713 12,038 4,810 Variance $ 5,722 $ 4,008 $ 1,877 $ (163) Off-line Services YTD 201
Slide 16: Furmanite Corporation Review of 4Q 2013
Furmanite Corporation Review of 4Q 2013 March 7, 2014 www.furmanite.com 16
Source: SEC EDGAR · 8-K filed Mar 7, 2014
More decks from Furmanite Corp
 Merger or Acquisition (November 2015)13 slides · Nov 2, 2015
 Q2 2015 Earnings Presentation19 slides · Aug 4, 2015
 Q1 2015 Earnings Presentation16 slides · May 11, 2015
 Proxy Contest (April 2015)40 slides · Apr 2, 2015
 Proxy Contest (April 2015)29 slides · Apr 2, 2015
 Proxy Contest (March 2015)39 slides · Mar 30, 2015