INX — FY2007 Earnings Presentation
27 slides from INX's earnings presentation, Mar 6, 2008
Slide 1: 4th Quarter and Year Ended December 31, 2007 Financial Results
4th Quarter and Year Ended December 31, 2007 INX Inc. Nasdaq: INXI www.INXI.com March 6, 2008 Financial Results
Slide 2: Agenda For Conference Call
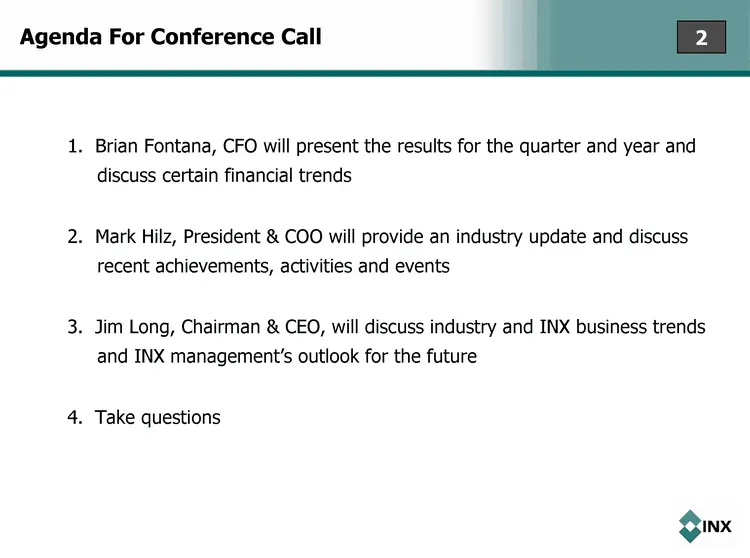
Agenda For Conference Call 1. Brian Fontana, CFO will present the results for the quarter and year and discuss certain financial trends 2. Mark Hilz, President & COO will provide an industry update and discuss recent achievements, activities and events 3. Jim Long, Chairman & CEO, will discuss indus
Slide 3: GAAP Reconciliation and Forward-Looking Statements
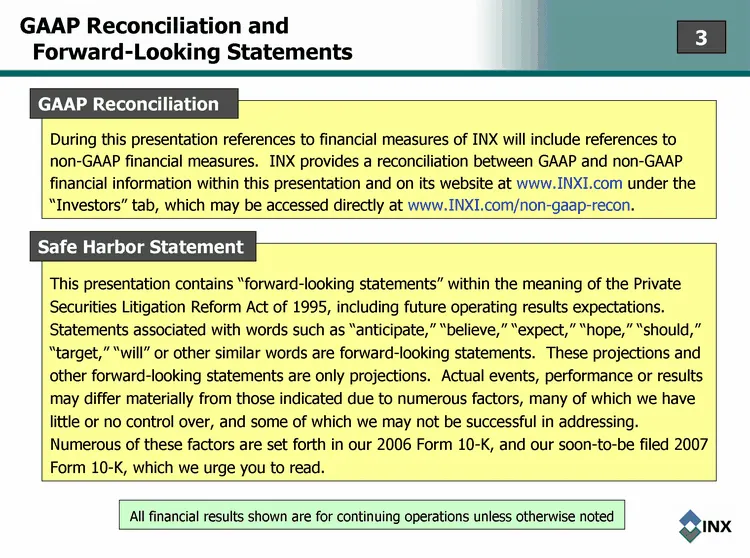
GAAP Reconciliation and Forward-Looking Statements This presentation contains "forward-looking statements" within the meaning of the Private Securities Litigation Reform Act of 1995, including future operating results expectations. Statements associated with words such as "anticipate," "believe," "e
Slide 4: Non-GAAP Financial Measures
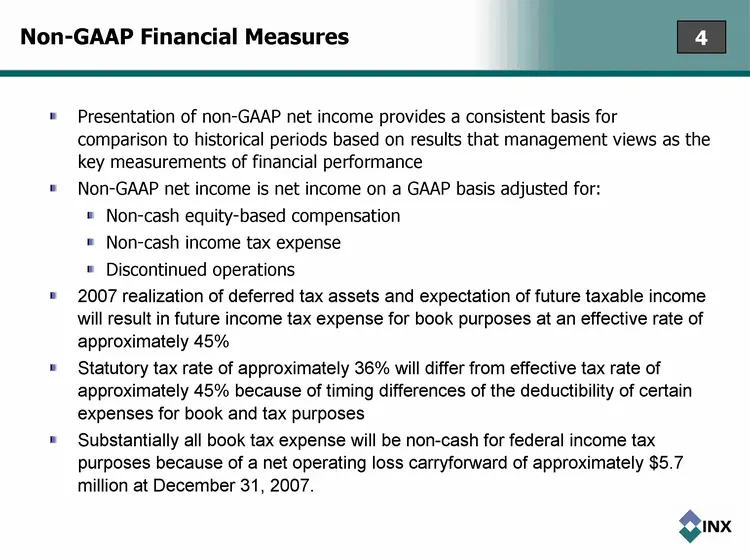
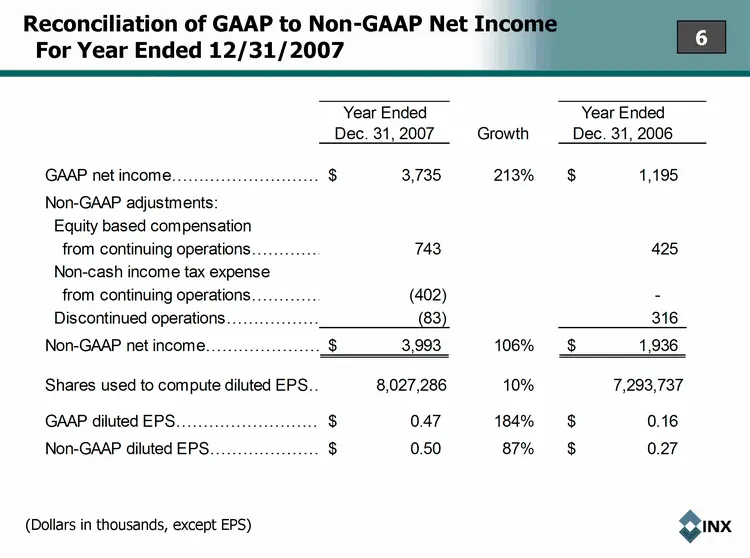
Non-GAAP Financial Measures Presentation of non-GAAP net income provides a consistent basis for comparison to historical periods based on results that management views as the key measurements of financial performance Non-GAAP net income is net income on a GAAP basis adjusted for: Non-cash equity-bas
Slide 5: Year Ended 12/31/2007 Results
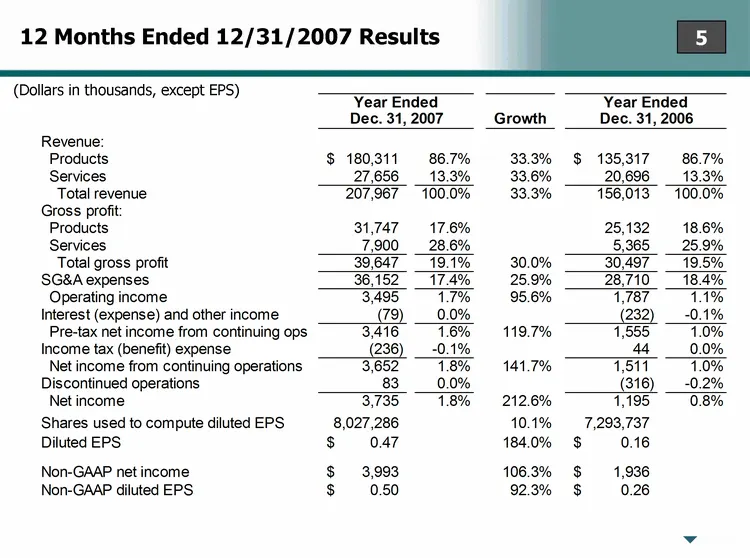
12 Months Ended 12/31/2007 Results (Dollars in thousands, except EPS)
Slide 6: Reconciliation of GAAP to Non-GAAP Net Income For Year Ended 12/31/2007
Reconciliation of GAAP to Non-GAAP Net Income For Year Ended 12/31/2007 (Dollars in thousands, except EPS)
Slide 7: Balance Sheet Data
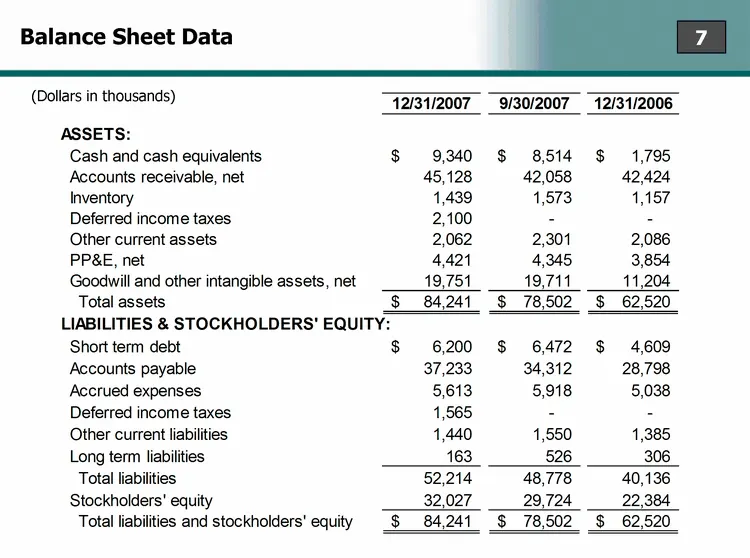
Balance Sheet Data (Dollars in thousands)
Slide 8: Product Sales For December Weaker Than Historical 4th Quarter Pattern
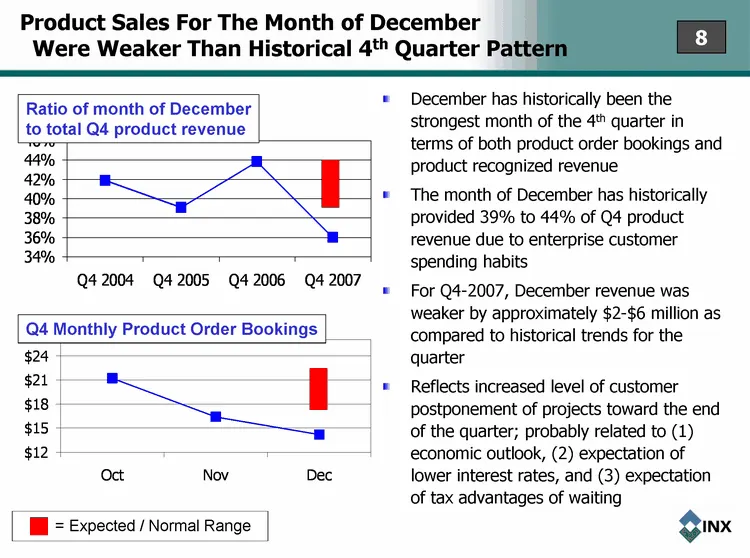
Oct Nov Dec Percent 21.2 16.4 14.2 Product Sales For The Month of December Were Weaker Than Historical 4th Quarter Pattern Q4 2004 Q4 2005 Q4 2006 Q4 2007 Percent 0.419 0.391 0.438 0.36 December has historically been the strongest month of the 4th quarter in terms of both product order bookings and
Slide 9: 4th Quarter Ended 12/31/2007 Results
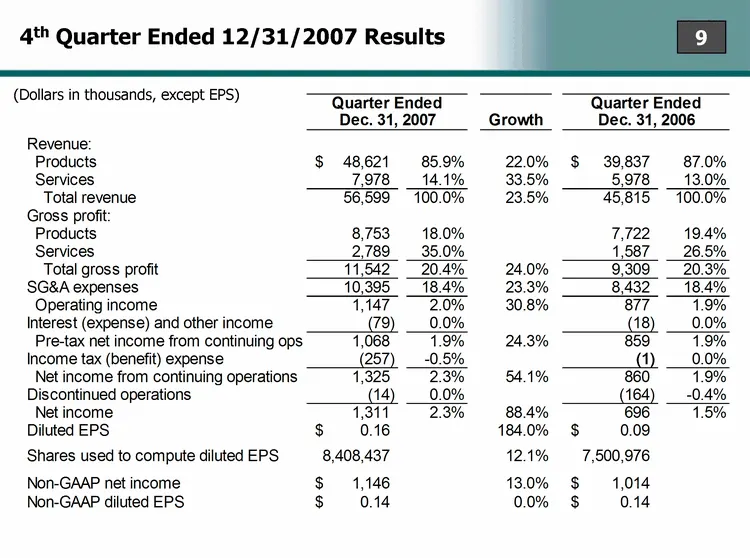
4th Quarter Ended 12/31/2007 Results (Dollars in thousands, except EPS)
Slide 10: Reconciliation of GAAP to Non-GAAP Net Income For 4th Quarter Ended 12/31/2007
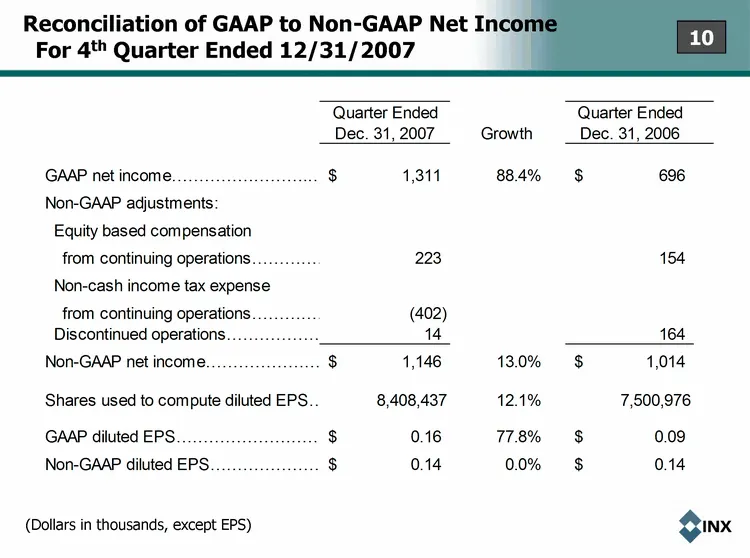
Reconciliation of GAAP to Non-GAAP Net Income For 4th Quarter Ended 12/31/2007 (Dollars in thousands, except EPS)
Slide 11: Gross Margin Product vs. Services
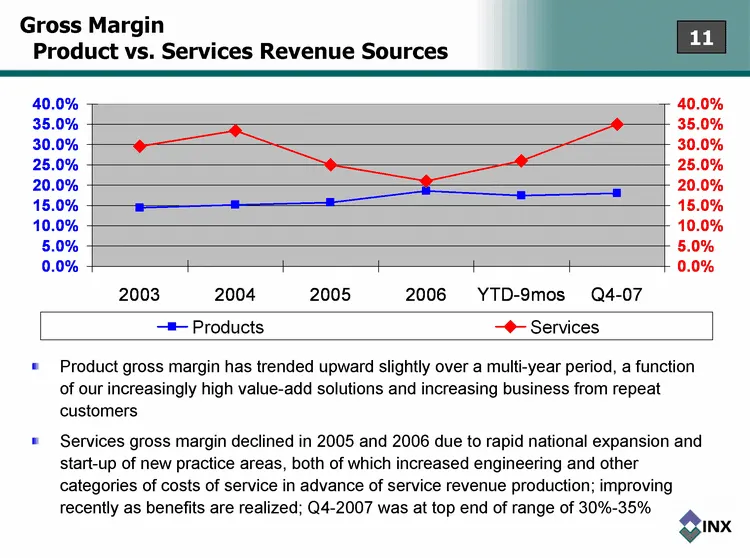
Gross Margin Product vs. Services Revenue Sources Product gross margin has trended upward slightly over a multi-year period, a function of our increasingly high value-add solutions and increasing business from repeat customers Services gross margin declined in 2005 and 2006 due to rapid national exp
Slide 12: Gross and Operating Profit Margin
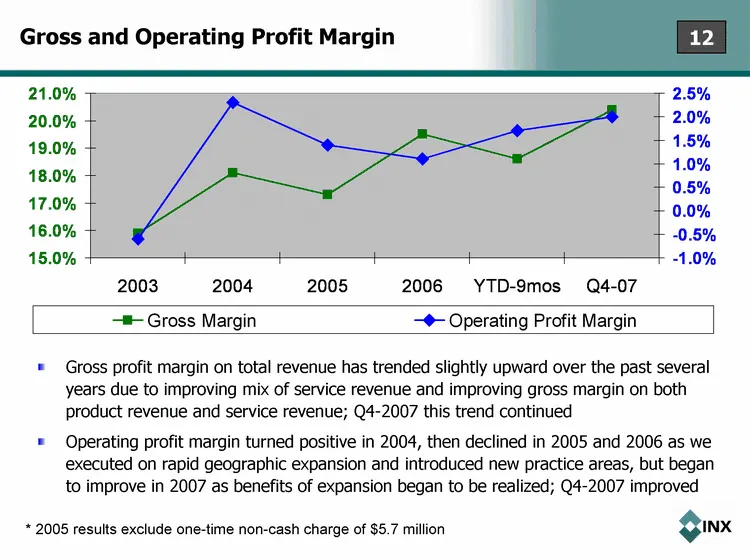
Gross and Operating Profit Margin Gross profit margin on total revenue has trended slightly upward over the past several years due to improving mix of service revenue and improving gross margin on both product revenue and service revenue; Q4-2007 this trend continued Operating profit margin turned p
Slide 13: Recent Achievements, Activities & Events
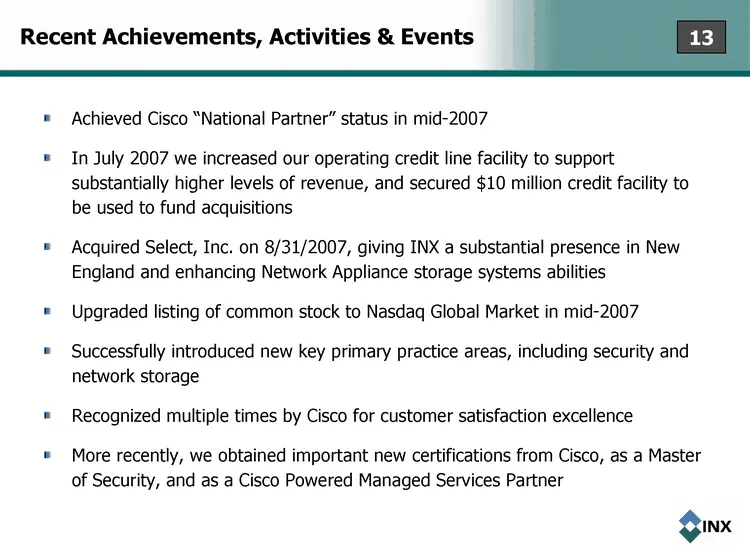
Recent Achievements, Activities & Events Achieved Cisco "National Partner" status in mid-2007 In July 2007 we increased our operating credit line facility to support substantially higher levels of revenue, and secured $10 million credit facility to be used to fund acquisitions Acquired Select, Inc.
Slide 14: INX and Industry Update
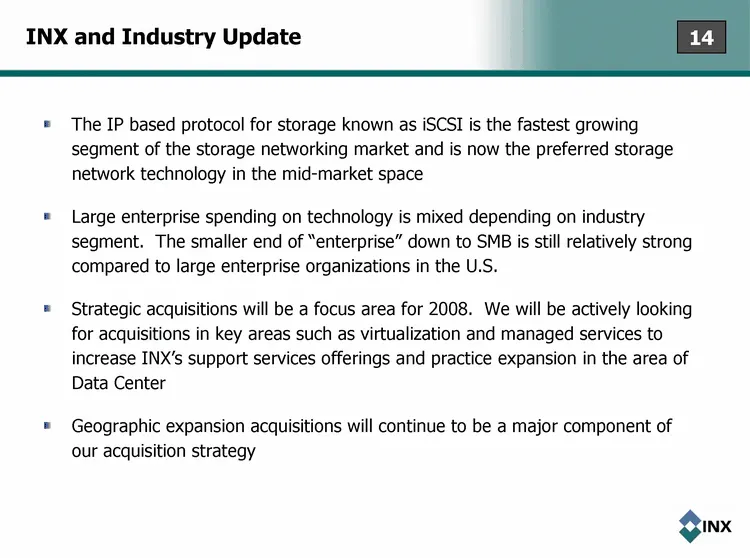
INX and Industry Update The IP based protocol for storage known as iSCSI is the fastest growing segment of the storage networking market and is now the preferred storage network technology in the mid-market space Large enterprise spending on technology is mixed depending on industry segment. The sma
Slide 15: Organic vs. Inorganic Revenue Growth
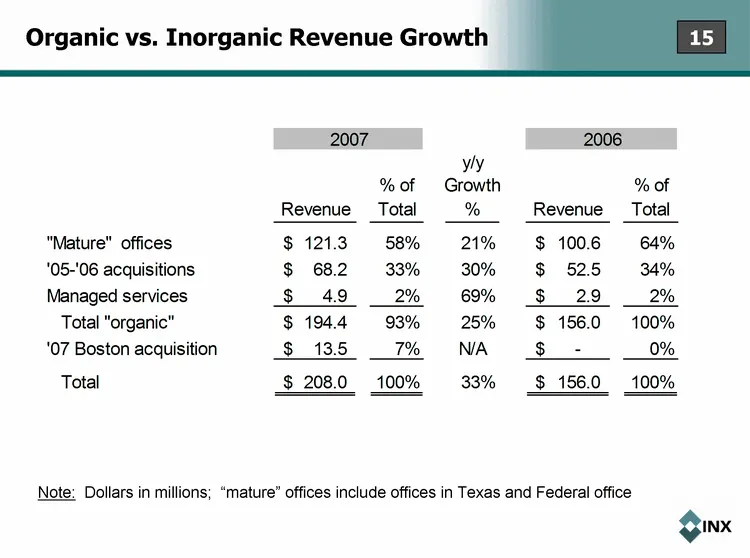
Organic vs. Inorganic Revenue Growth Note: Dollars in millions; "mature" offices include offices in Texas and Federal office
Slide 16: Product Category Mix
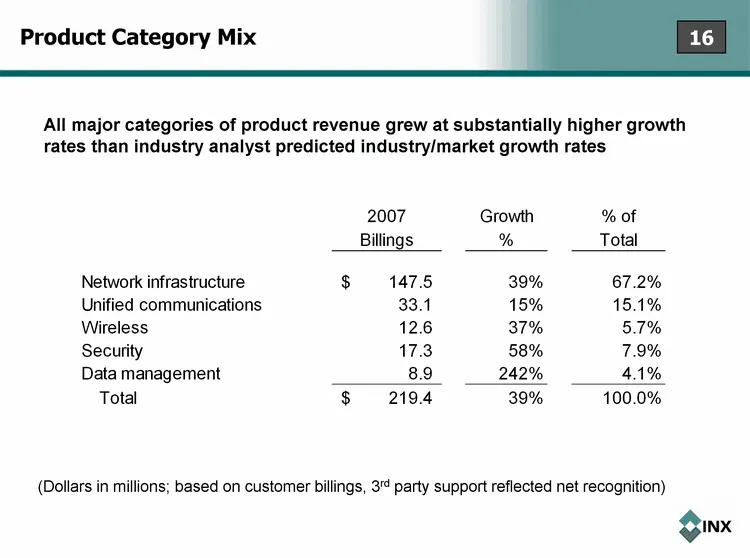
Product Category Mix (Dollars in millions; based on customer billings, 3rd party support reflected net recognition) All major categories of product revenue grew at substantially higher growth rates than industry analyst predicted industry/market growth rates
Slide 17: Customer Categories and Mix
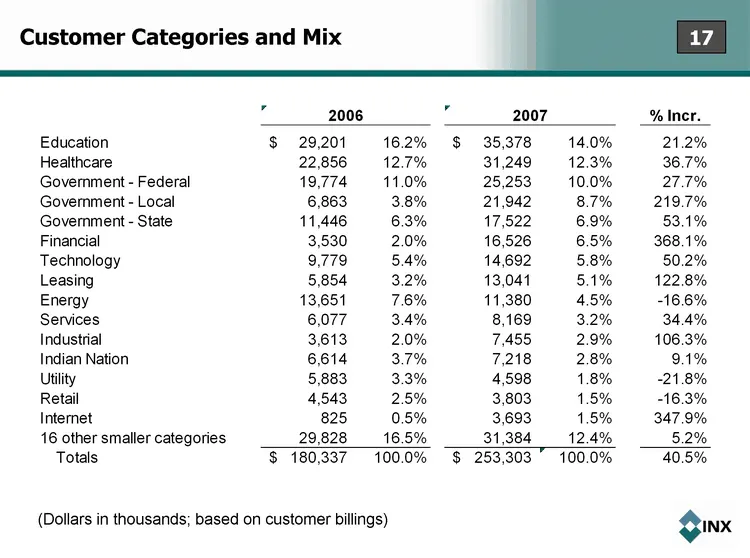
Customer Categories and Mix (Dollars in thousands; based on customer billings)
Slide 18: Certain Sub-Categories Of Customers
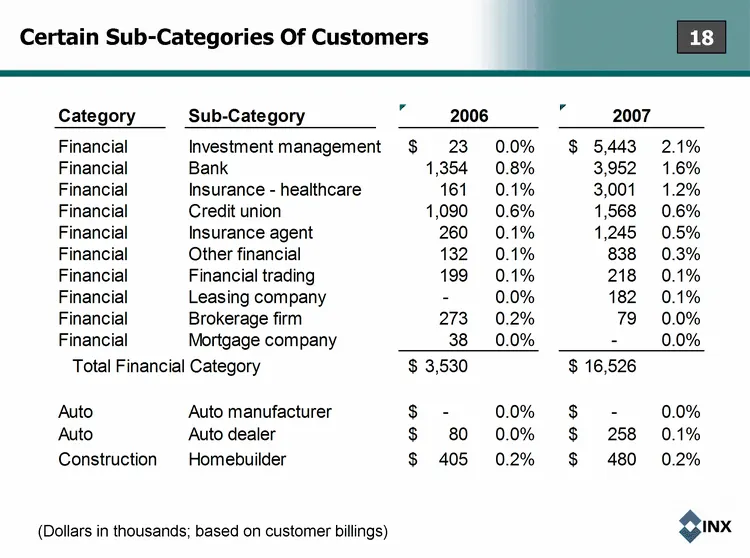
Certain Sub-Categories Of Customers (Dollars in thousands; based on customer billings)
Slide 19: Staffing Trends
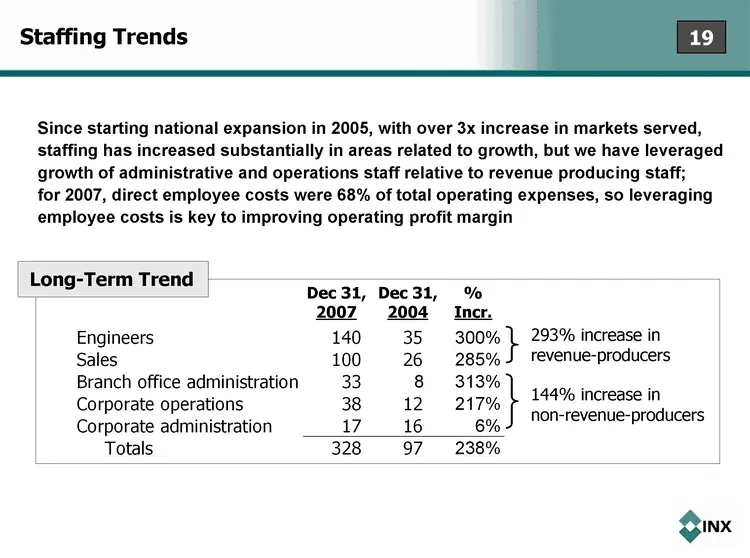
Staffing Trends Dec 31, 2004 144% increase in non-revenue-producers 293% increase in revenue-producers Dec 31, 2007 % Incr. Long-Term Trend Since starting national expansion in 2005, with over 3x increase in markets served, staffing has increased substantially in areas related to growth, but we have
Slide 20: Relevant Industry/Market Growth Prospects
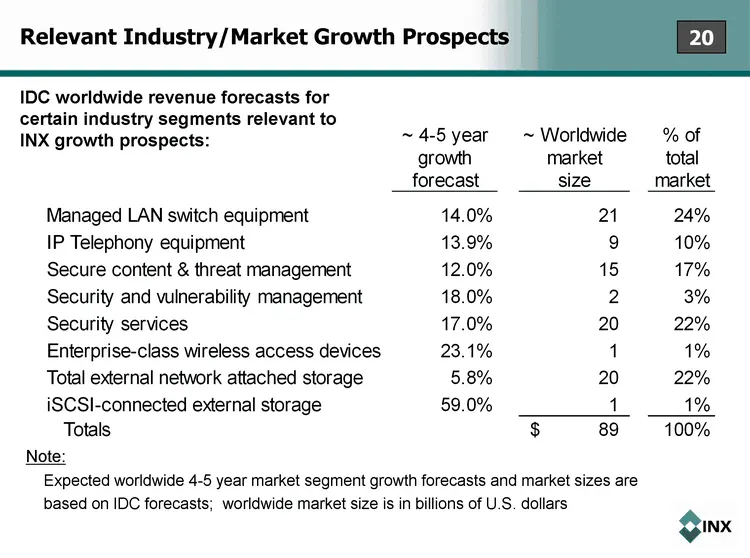
Relevant Industry/Market Growth Prospects IDC worldwide revenue forecasts for certain industry segments relevant to INX growth prospects: Expected worldwide 4-5 year market segment growth forecasts and market sizes are based on IDC forecasts; worldwide market size is in billions of U.S. dollars Note
Slide 21: Outlook - Revenue Growth
Outlook - Revenue Growth Growth of all categories of revenue are somewhat depressed recently due to economic uncertainty and the desire by customers to wait for lower interest rates, which conditions we believe will improve over the coming two quarters as interest rates bottom Growth of Unified Comm
Slide 22: Outlook - Industry/Market Segments And Organic Growth
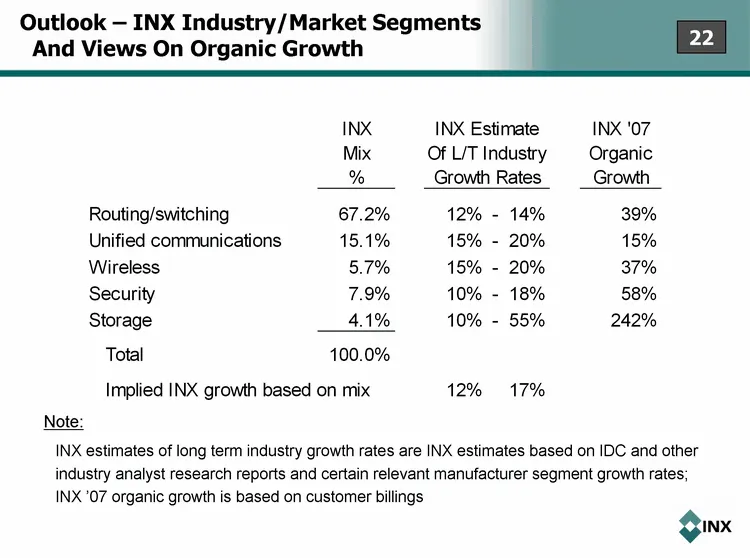
Outlook - INX Industry/Market Segments And Views On Organic Growth INX estimates of long term industry growth rates are INX estimates based on IDC and other industry analyst research reports and certain relevant manufacturer segment growth rates; INX '07 organic growth is based on customer billings
Slide 23: Outlook - Unified Communications Growth
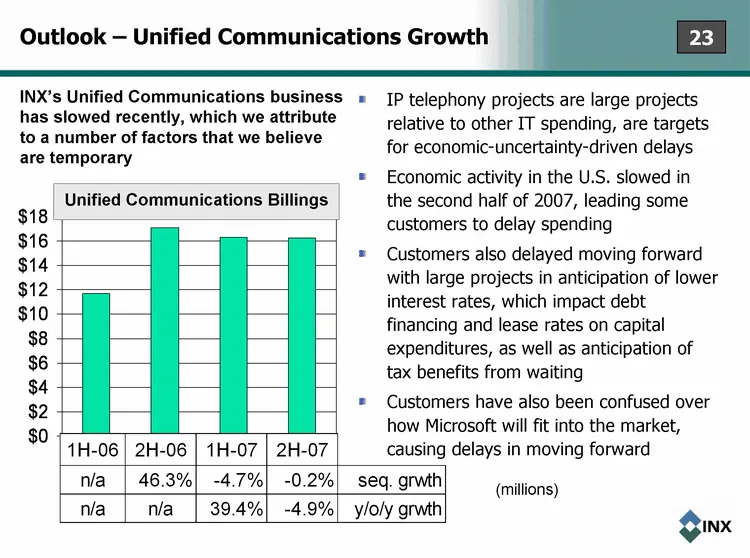
Outlook - Unified Communications Growth 1H-06 2H-06 1H-07 2H-07 East 11.696183 17.107203 16.30161 16.268241 INX's Unified Communications business has slowed recently, which we attribute to a number of factors that we believe are temporary IP telephony projects are large projects relative to other IT
Slide 24: Outlook - Gross Margin
Outlook - Gross Margin Gross margin on products: Continue to target 15%-19% on products, which range we have been within To the extent that the economy and industry remain weak for an extended period we could possibly see some margin pressure if competitors are desperate for revenue, but we do not c
Slide 25: Outlook - Operating Profit Margin
Outlook - Operating Profit Margin We continue to maintain a target for operating profit margin % in the range of 4% to 7%, which we expect to achieve primarily by: improving gross margin on service revenue as compared to 2007 levels, primarily from improving utilization of engineering resources and
Slide 26: Outlook For Q1-2008
Outlook For Q1-2008 The historical Q1 monthly pattern of product order bookings shows that either January or March is usually the largest month of the quarter, with February being the weakest month of the quarter For January and February together, product order bookings totaled $36 million, a y/y in
Slide 27: Summary
Summary Both full year 2007 results and Q4-2007 results reflect record revenue, gross profit, operating profit, net income, and Non-GAAP net income Q4-2007 total revenue was below the range we had expected when we set expectations in early November due to lower than expected product revenue, which w
Source: SEC EDGAR · 8-K filed Mar 6, 2008
More decks from INX Inc
 Merger or Acquisition (November 2011)10 slides · Nov 1, 2011
 Rodman & Renshaw Global Investment Conference 201120 slides · Sep 13, 2011
 Shareholder Meeting (July 2011)15 slides · Jul 19, 2011
 Q1 2011 Earnings Presentation15 slides · Jul 13, 2011
 FY2010 Earnings Presentation28 slides · Jun 6, 2011
 Corporate Update (November 2010)24 slides · Nov 10, 2010