Nick Scali Limited · ASX:NCK
Nick Scali — FY2006 Earnings Presentation
9 slides from Nick Scali's earnings presentation, August 2006
Slide 1: Results presentation – Year ended 30 June 2006
Results presentation Year ended 30 June 2006
Slide 2: FY'06 Highlights
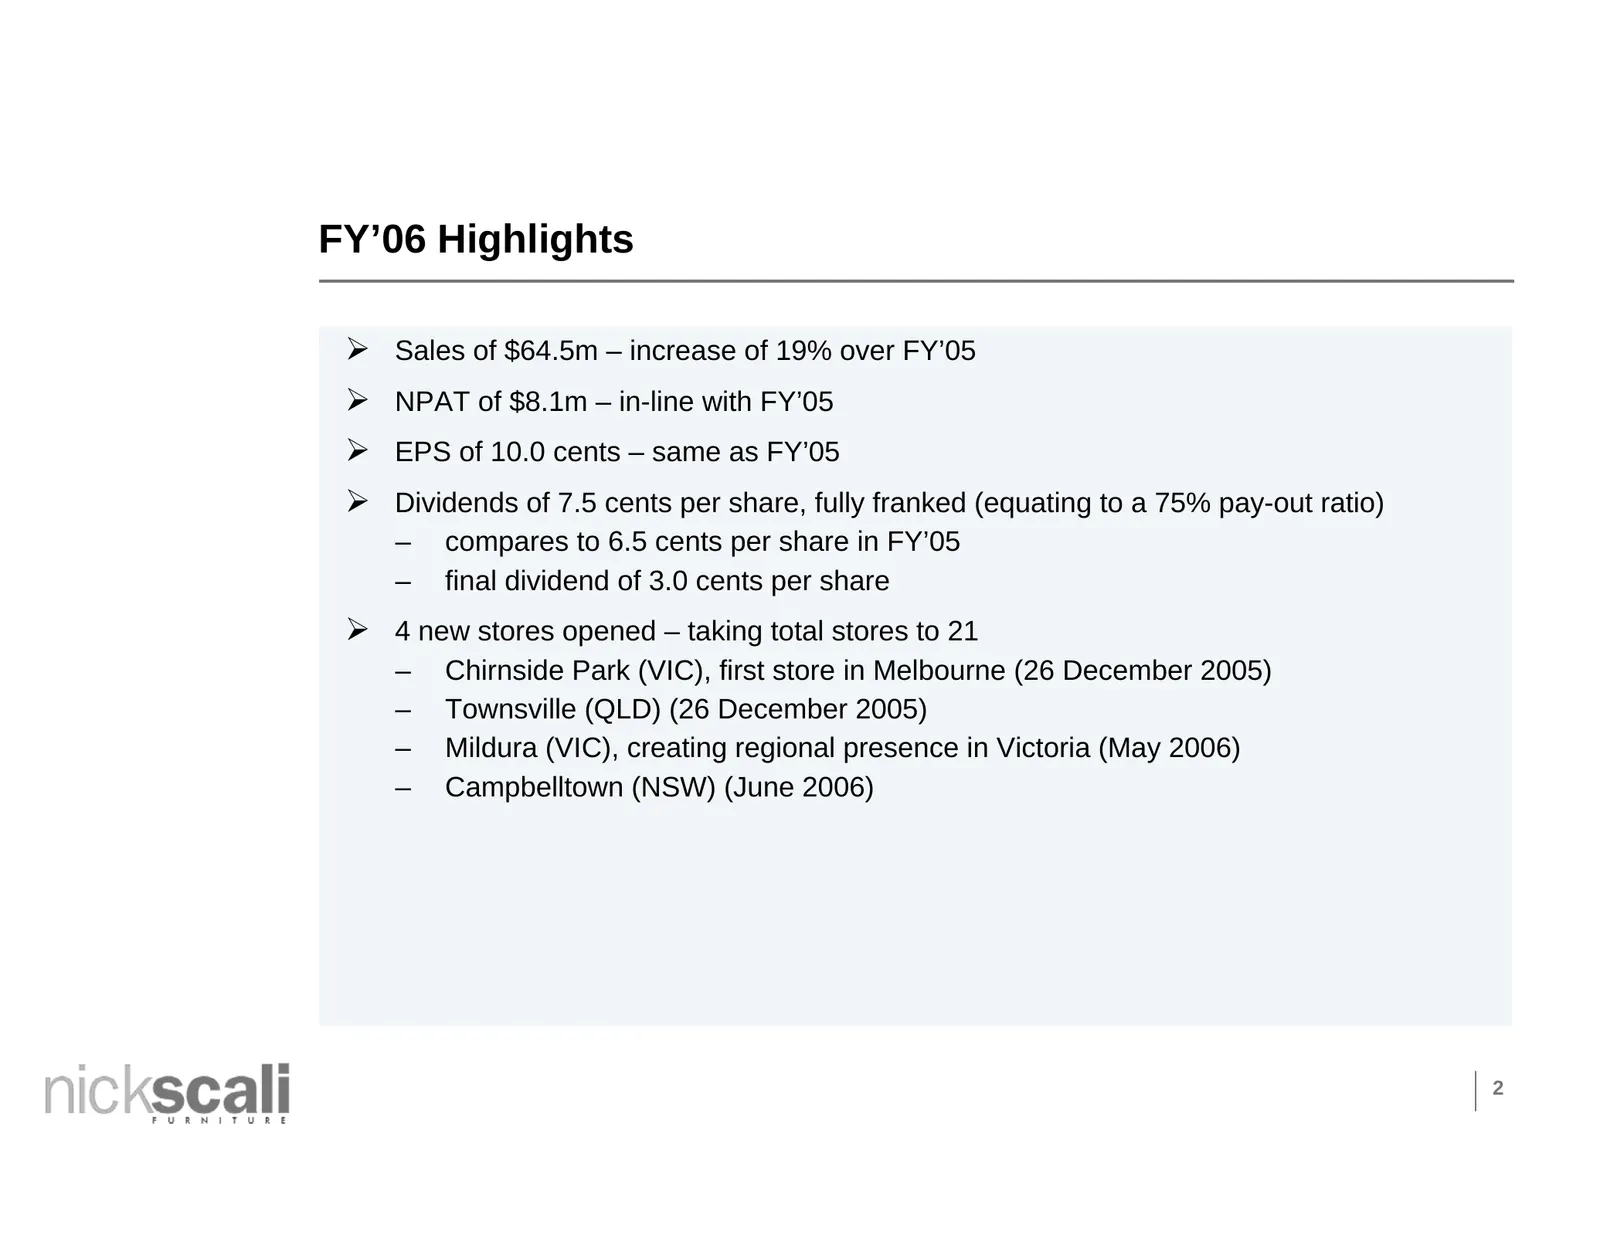
FY’06 Highlights ¾ Sales of $64.5m – increase of 19% over FY’05 ¾ NPAT of $8.1m – in-line with FY’05 ¾ EPS of 10.0 cents – same as FY’05 ¾ Dividends of 7.5 cents per share, fully franked (equating to a 75% pay-out ratio) – compares to 6.5 cents per share in FY’05 – final dividend of 3.0 cents per sh
Slide 3: FY'06 Profit
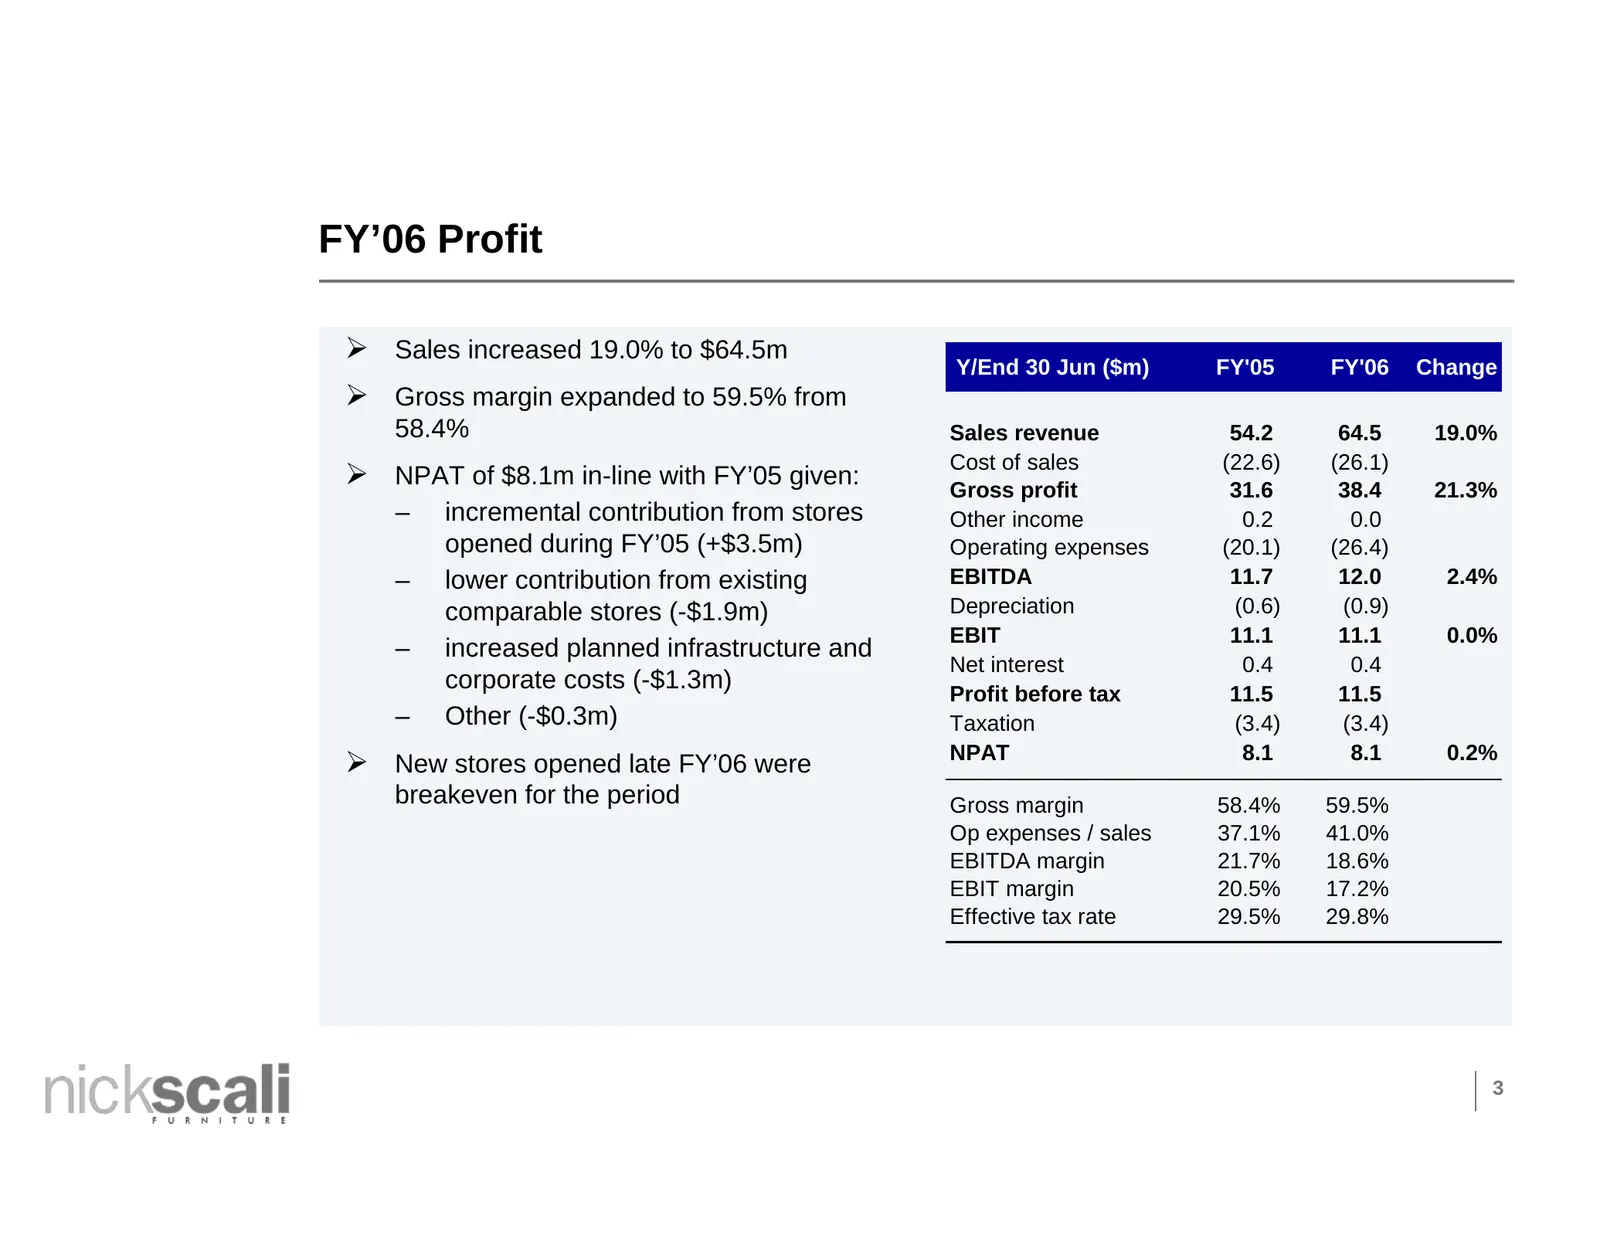
FY’06 Profit ¾ Sales increased 19.0% to $64.5m Y/End 30 Jun ($m) FY'05 FY'06 Change ¾ Gross margin expanded to 59.5% from 58.4% Sales revenue 54.2 64.5 19.0% Cost of sales (22.6) (26.1) ¾ NPAT of $8.1m in-line with FY’05 given: Gross profit 31.6 38.4 21.3% – incremental contribution from stores Othe
Slide 4: FY'06 Sales
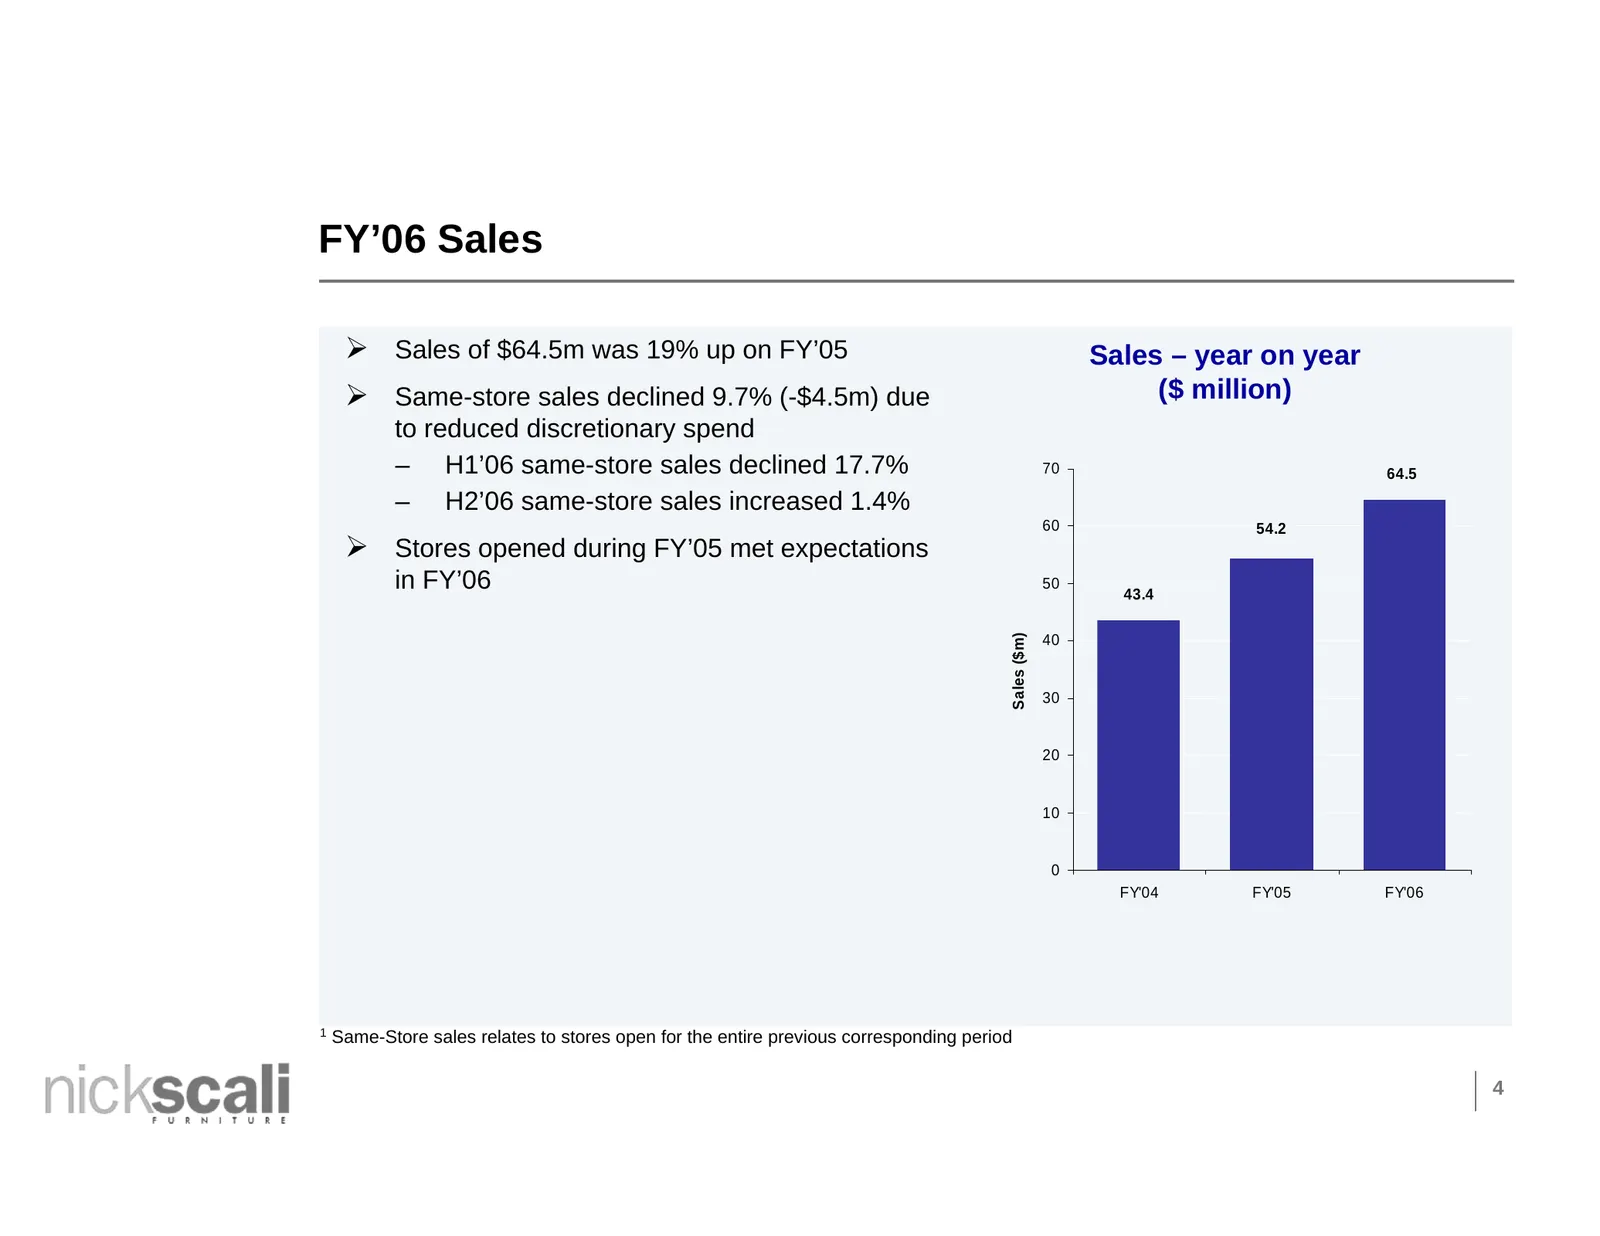
FY’06 Sales ¾ Sales of $64.5m was 19% up on FY’05 Sales – year on year ¾ Same-store sales declined 9.7% (-$4.5m) due ($ million) to reduced discretionary spend – H1’06 same-store sales declined 17.7% 70 64.5 – H2’06 same-store sales increased 1.4% 60 54.2 ¾ Stores opened during FY’05 met expectation
Slide 5: Operating Expense Analysis
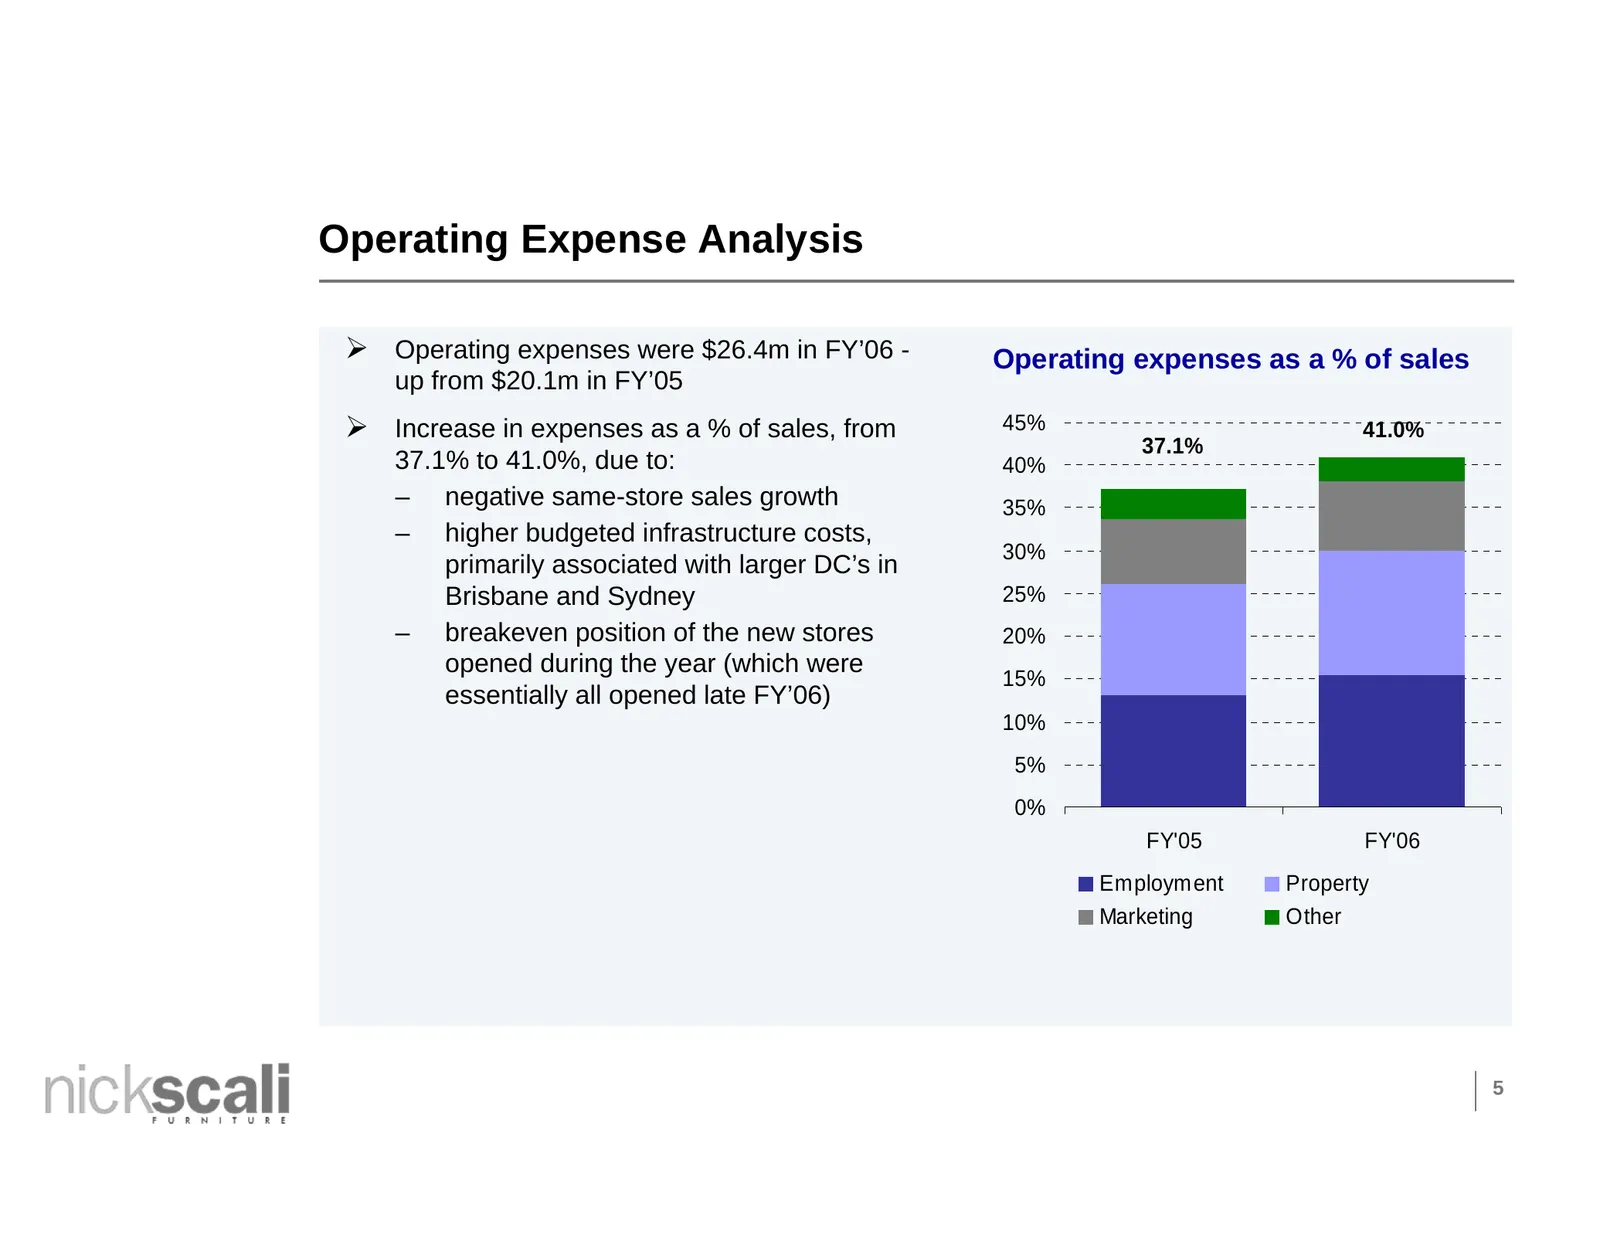
Operating Expense Analysis ¾ Operating expenses were $26.4m in FY’06 - Operating expenses as a % of sales up from $20.1m in FY’05 ¾ Increase in expenses as a % of sales, from 45% 41.0% 37.1% 37.1% to 41.0%, due to: 40% – negative same-store sales growth 35% – higher budgeted infrastructure costs, 30
Slide 6: Cash Flow
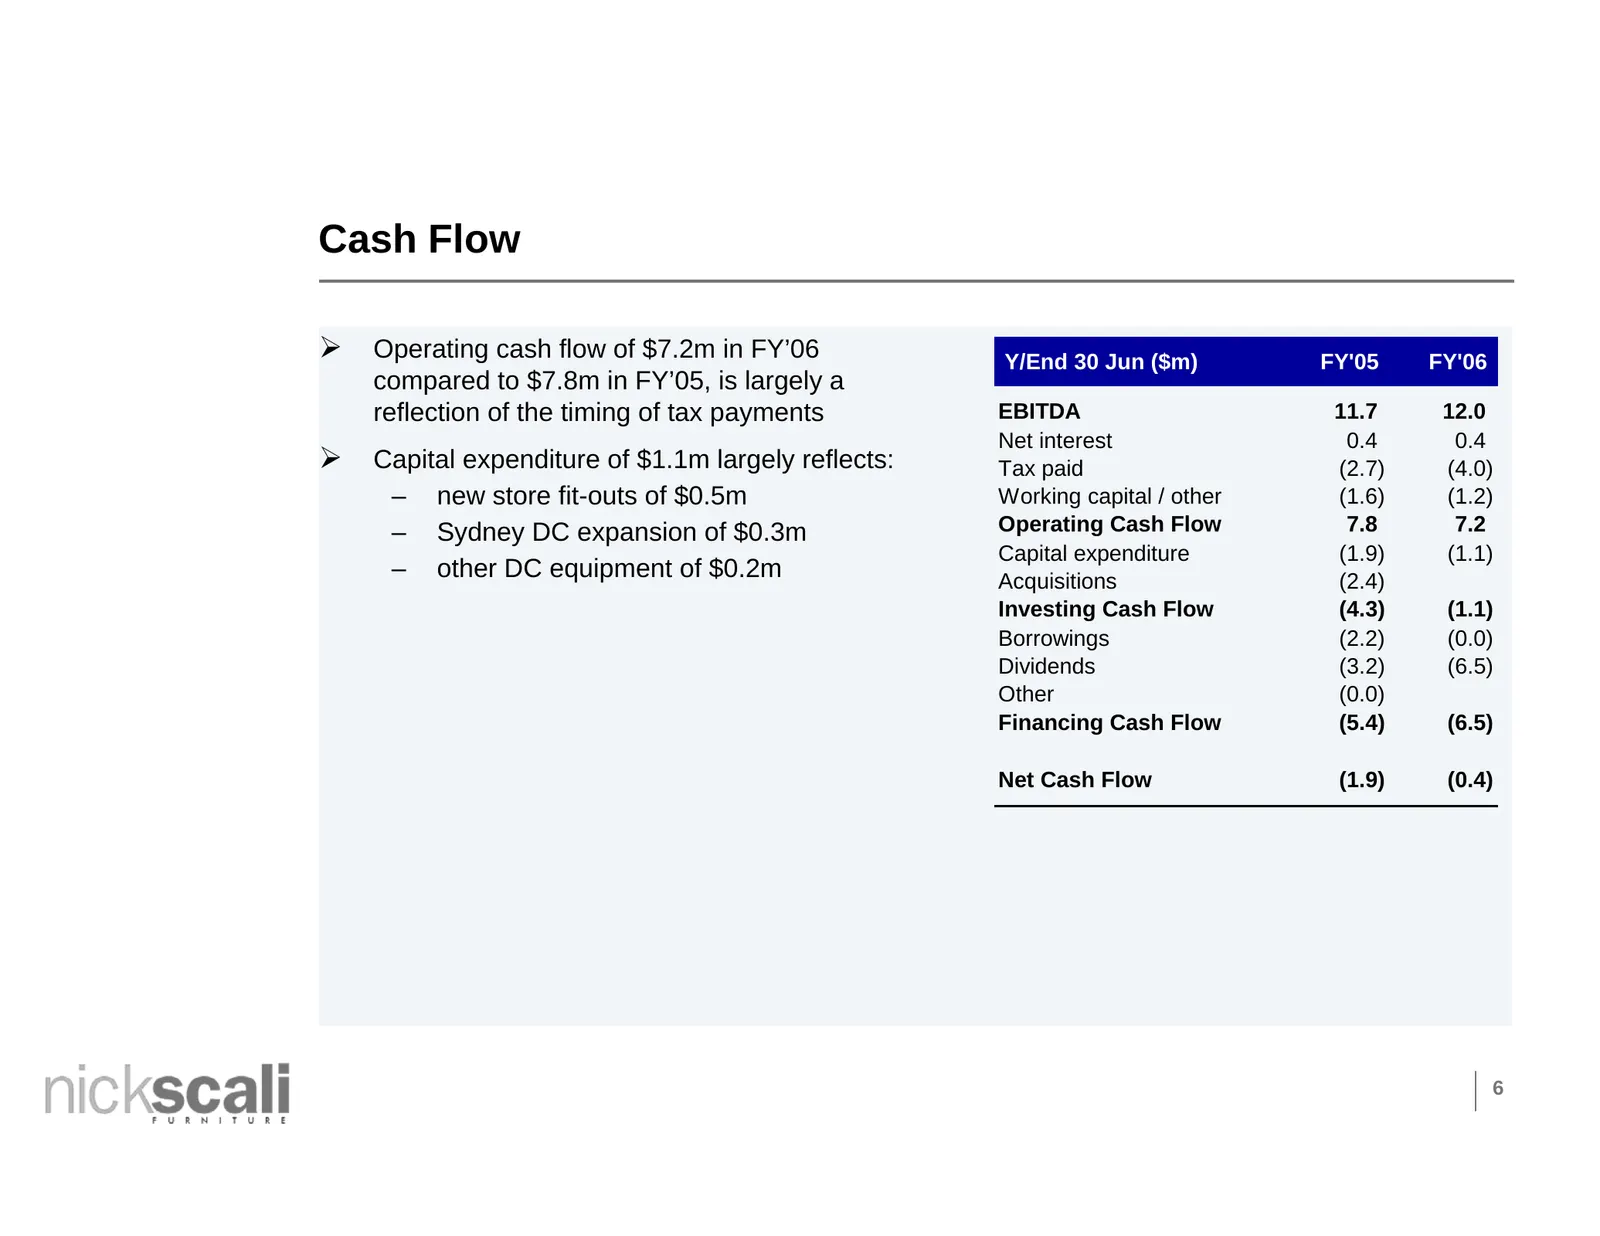
Cash Flow ¾ Operating cash flow of $7.2m in FY’06 Y/End 30 Jun ($m) FY'05 FY'06 compared to $7.8m in FY’05, is largely a reflection of the timing of tax payments EBITDA 11.7 12.0 Net interest 0.4 0.4 ¾ Capital expenditure of $1.1m largely reflects: Tax paid (2.7) (4.0) – new store fit-outs of $0.5m
Slide 7: Balance Sheet
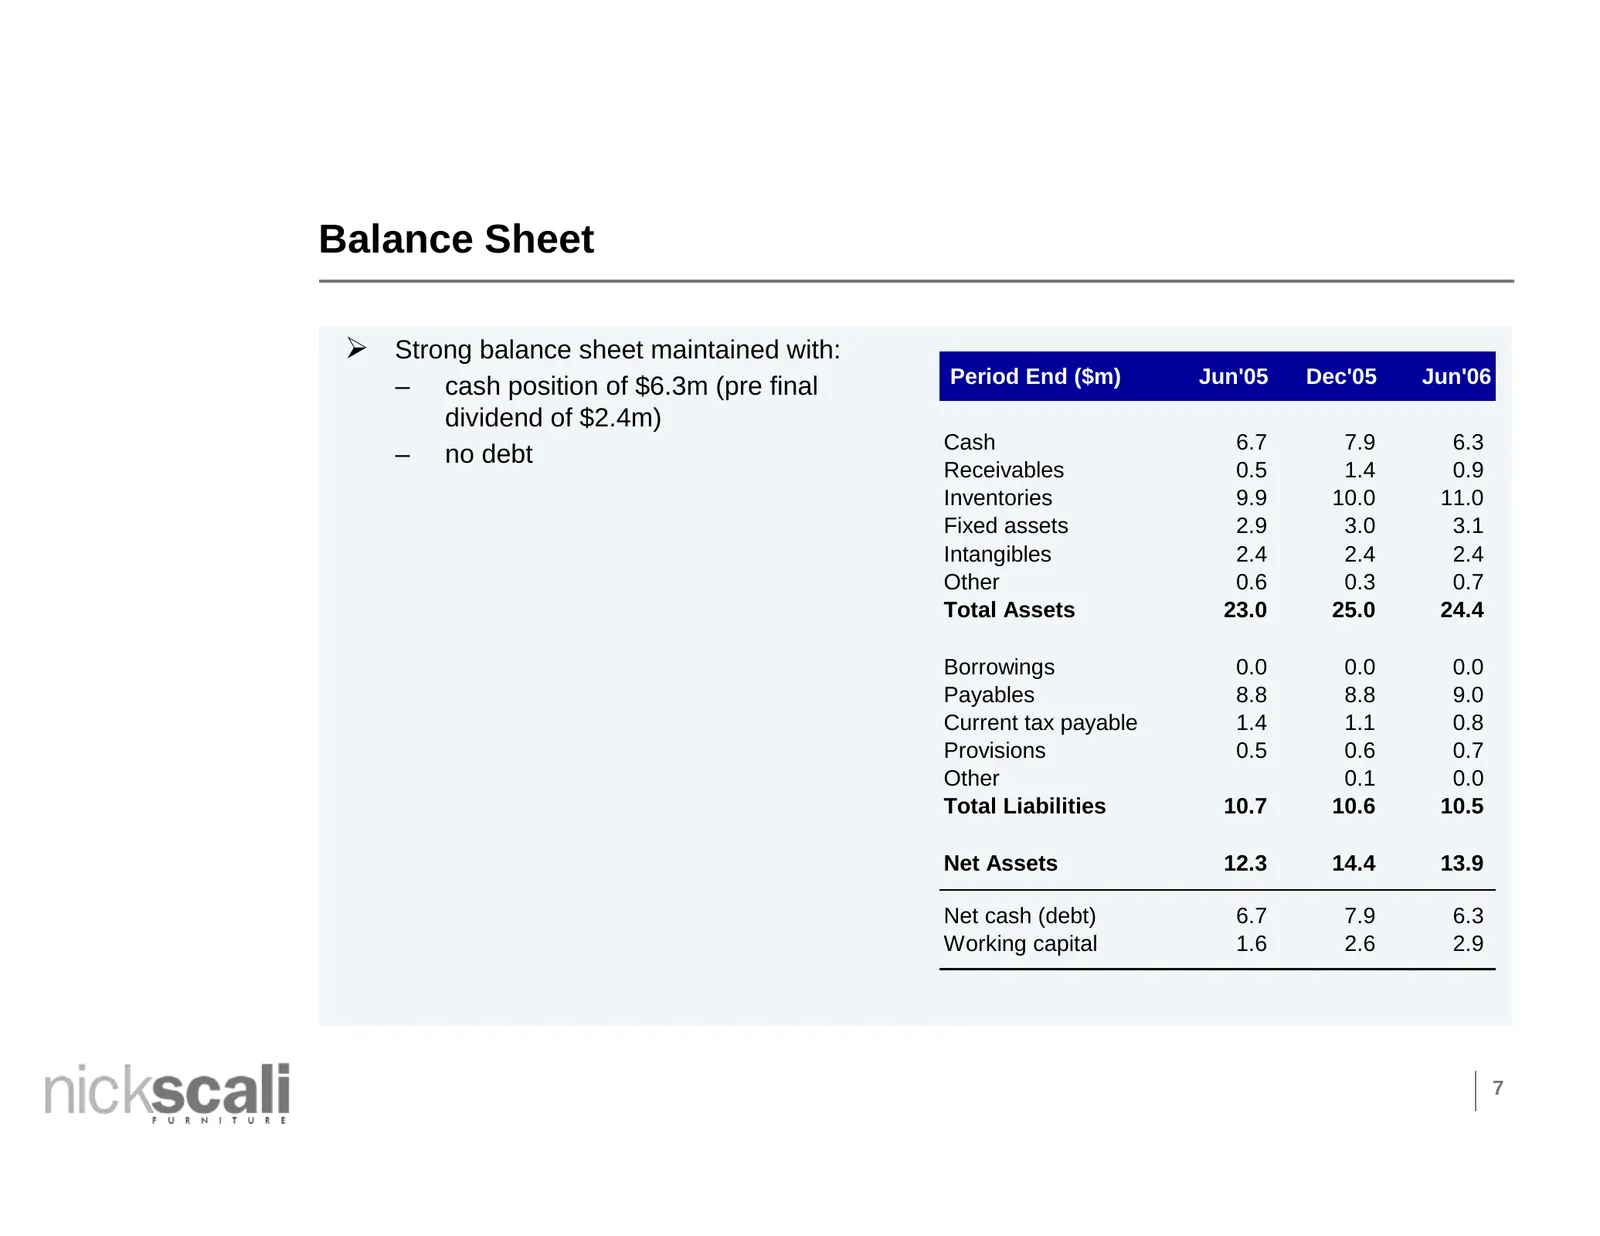
Balance Sheet ¾ Strong balance sheet maintained with: – cash position of $6.3m (pre final Period End ($m) Jun'05 Dec'05 Jun'06 dividend of $2.4m) Cash 6.7 7.9 6.3 – no debt Receivables 0.5 1.4 0.9 Inventories 9.9 10.0 11.0 Fixed assets 2.9 3.0 3.1 Intangibles 2.4 2.4 2.4 Other 0.6 0.3 0.7 Total Asse
Slide 8: Store Openings
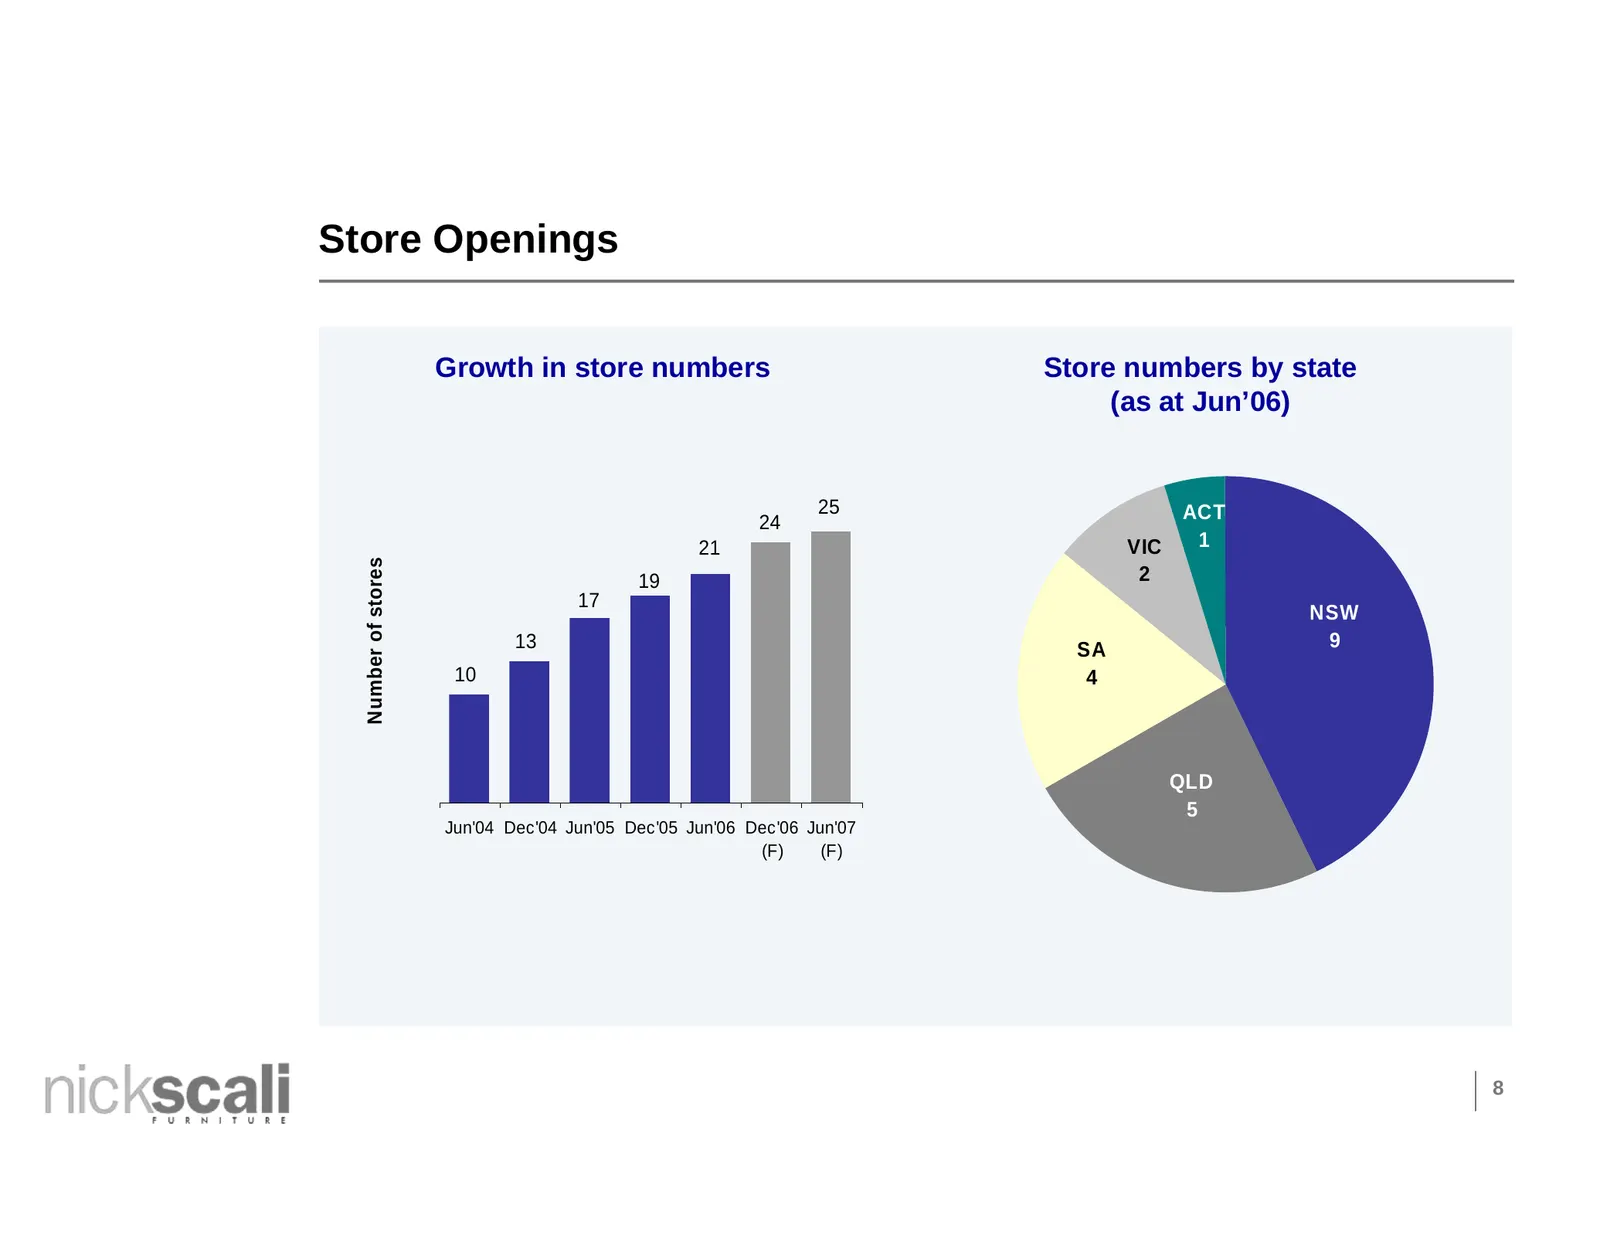
Store Openings Growth in store numbers Store numbers by state (as at Jun’06) 25 ACT 24 21 VIC 1 Number of stores 19 2 17 NSW 13 SA 9 10 4 QLD 5 Jun'04 Dec'04 Jun'05 Dec'05 Jun'06 Dec'06 Jun'07 (F) (F) 8
Slide 9: Forward Plans
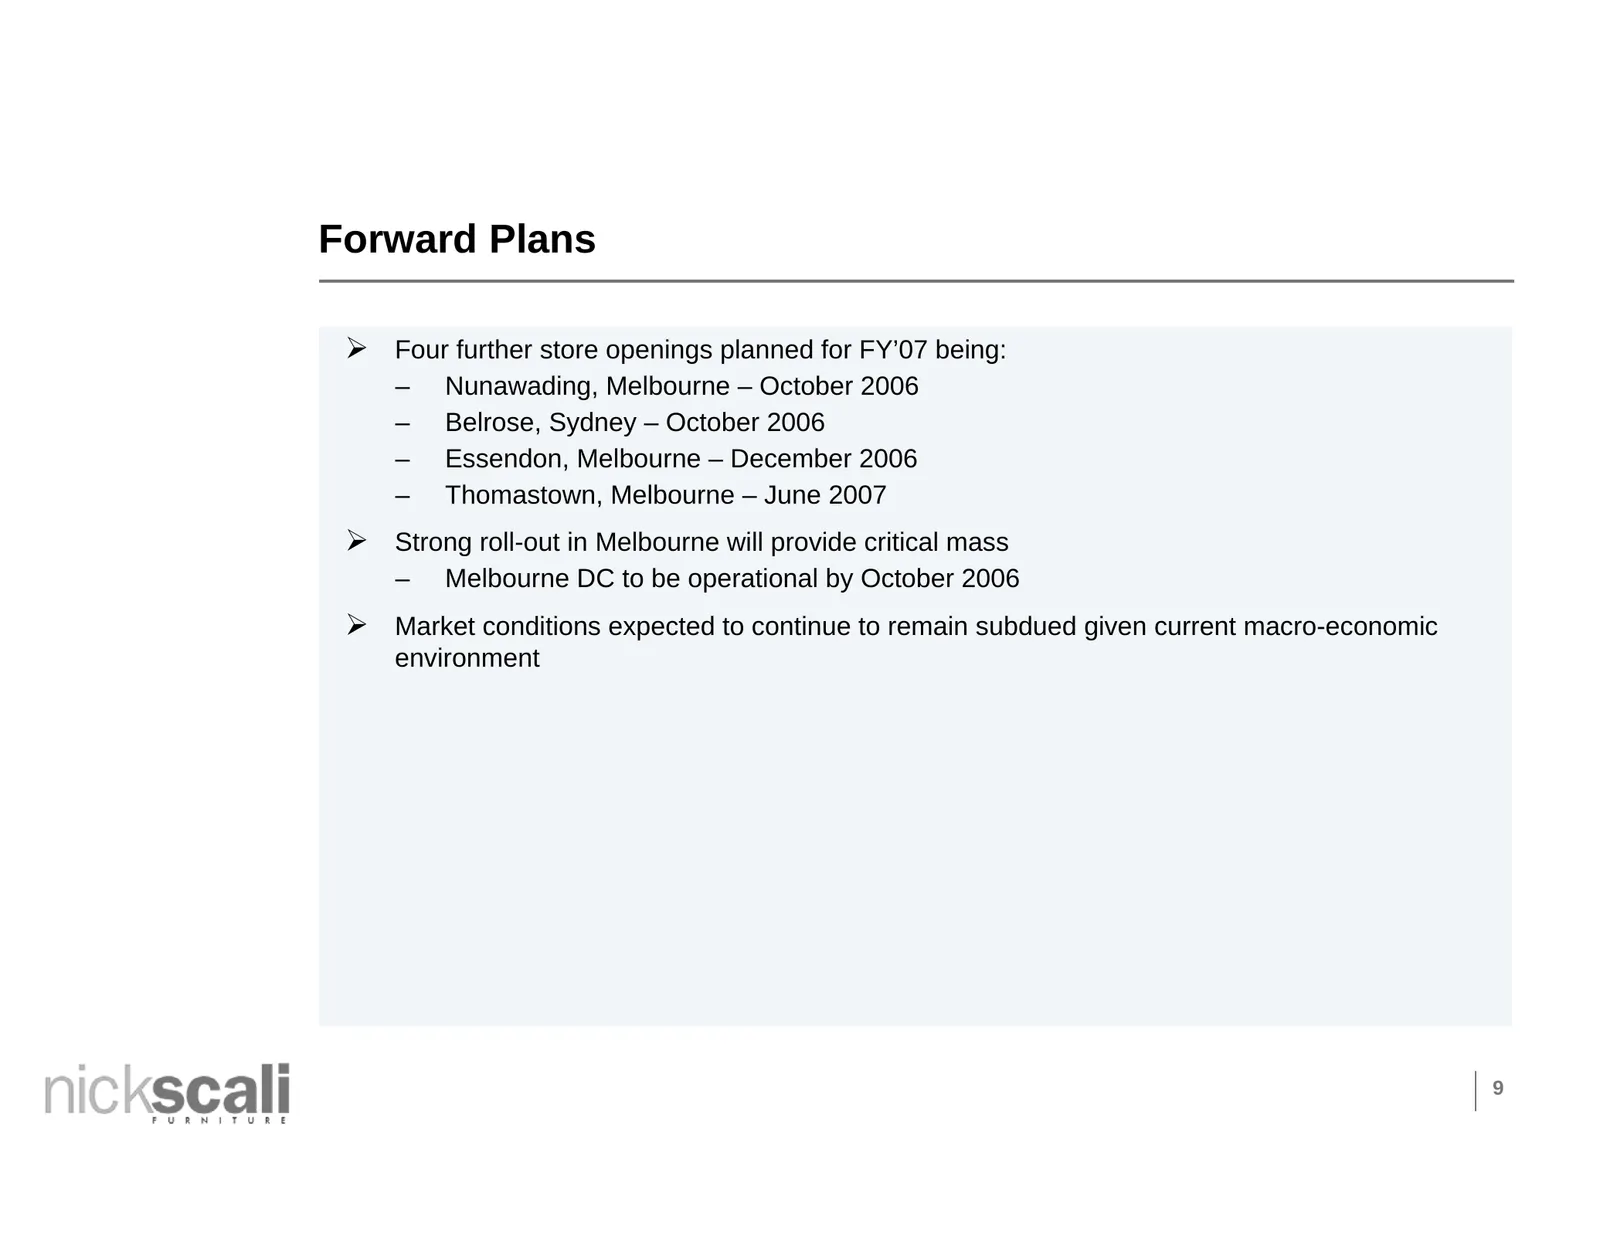
Forward Plans ¾ Four further store openings planned for FY’07 being: – Nunawading, Melbourne – October 2006 – Belrose, Sydney – October 2006 – Essendon, Melbourne – December 2006 – Thomastown, Melbourne – June 2007 ¾ Strong roll-out in Melbourne will provide critical mass – Melbourne DC to be operat
Source: Internet Archive copy of nickscali.com.au
More decks from Nick Scali Limited
 FY2026 Earnings Presentation17 slides · Aug 7, 2026
 Investor Presentation (February 2026)16 slides · Feb 13, 2026
 FY2025 Earnings Presentation18 slides · Aug 8, 2025
 Investor Presentation (February 2025)17 slides · Feb 7, 2025
 FY2024 Earnings Presentation17 slides · Aug 9, 2024
 Investor Presentation (April 2024)42 slides · Apr 24, 2024