Science Group PLC · LSE:SAG
Science — Sagentia Group — H1 2014 Earnings Presentation
15 slides from Science's earnings presentation, July 2014
Slide 1: Interim Results Presentation July 2014
Interim Results Presentation July 2014 Martyn Ratcliffe Chairman Rebecca Hemsted Finance Director
Slide 2: Science and Technology consultancy
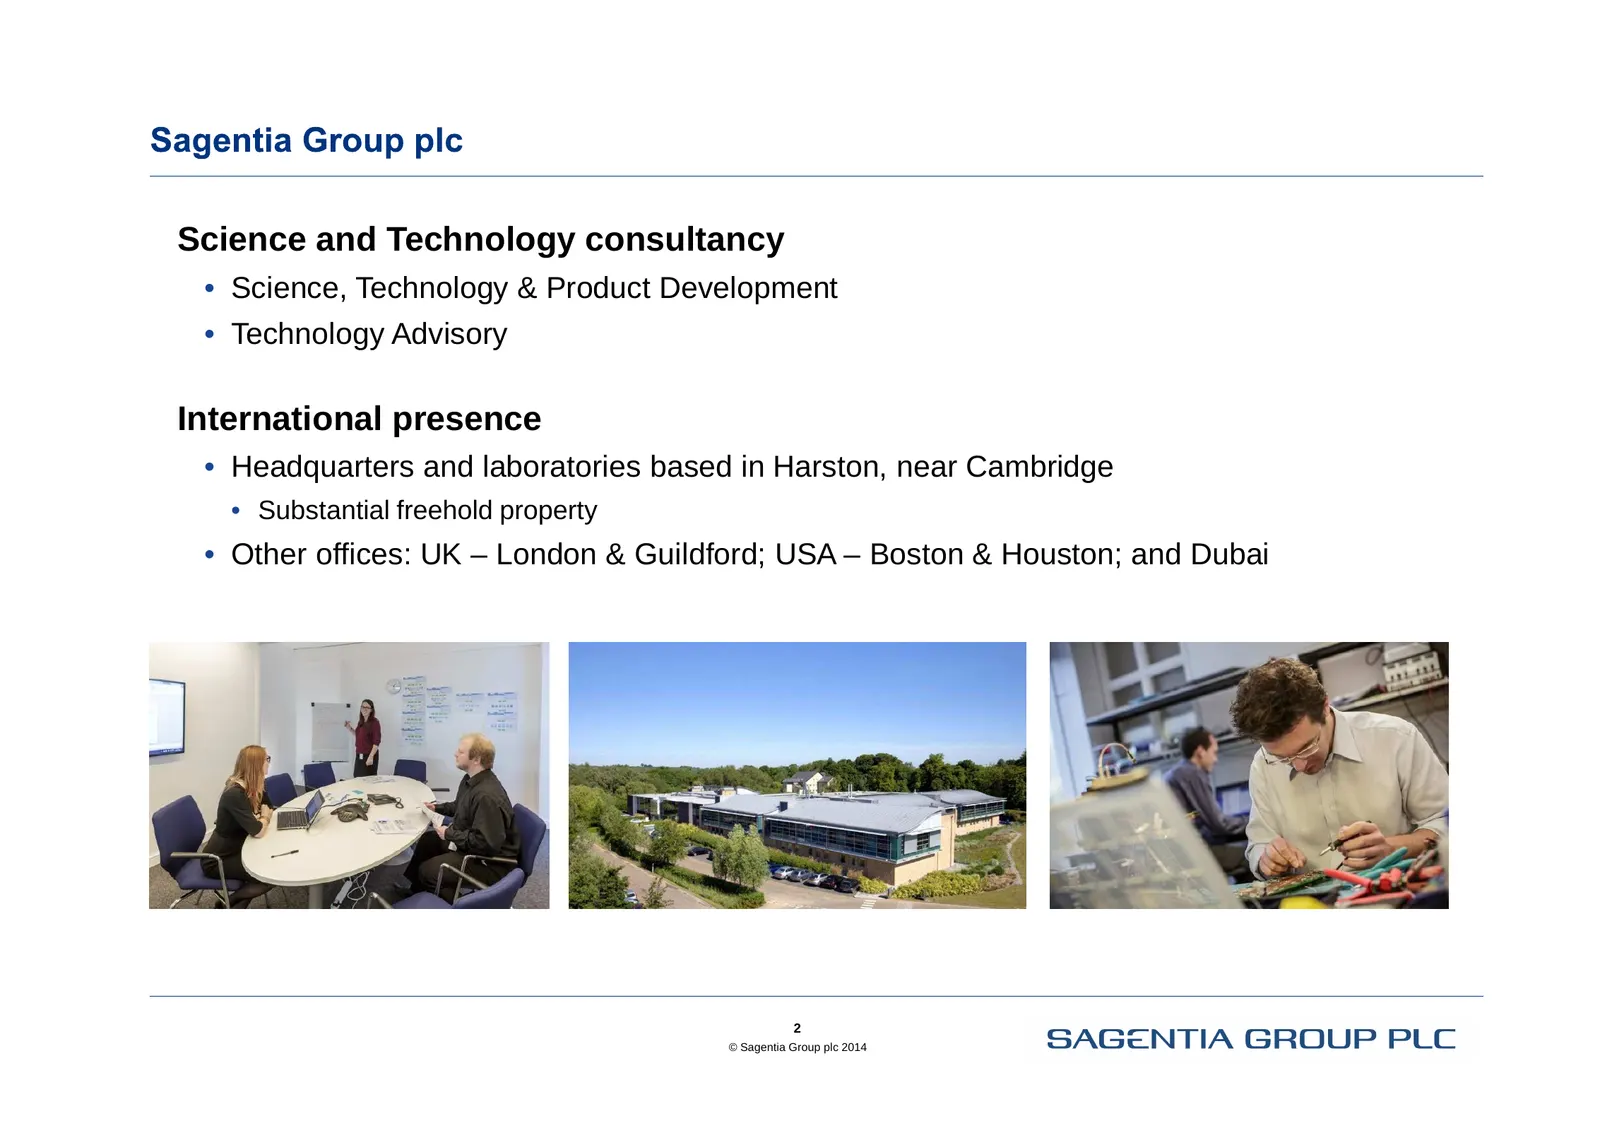
Science and Technology consultancy • Science, Technology & Product Development • Technology Advisory International presence • Headquarters and laboratories based in Harston, near Cambridge • Substantial freehold property • Other offices: UK – London & Guildford; USA – Boston & Houston; and Dubai 2 ©
Slide 3: Satisfactory operating performance in difficult FX environment
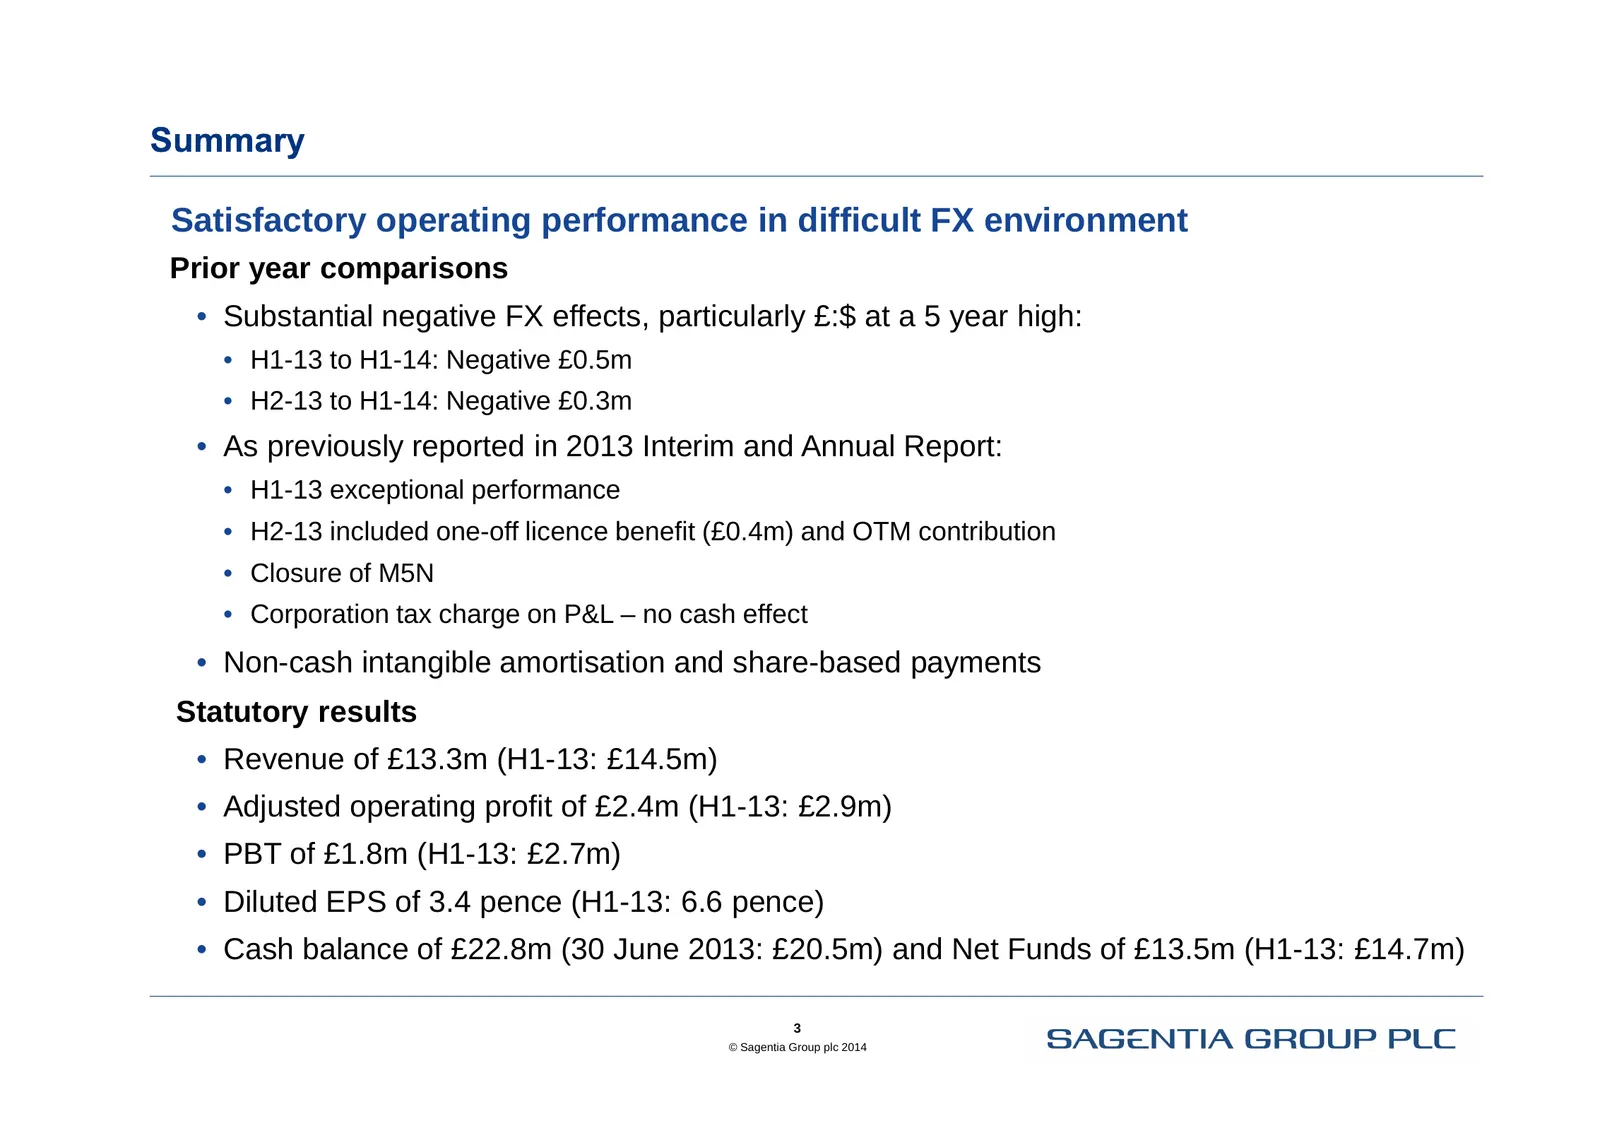
Satisfactory operating performance in difficult FX environment Prior year comparisons • Substantial negative FX effects, particularly £:$ at a 5 year high: • H1-13 to H1-14: Negative £0.5m • H2-13 to H1-14: Negative £0.3m • As previously reported in 2013 Interim and Annual Report: • H1-13 exceptiona
Slide 4: GBP/USD and GBP/EUR exchange rates
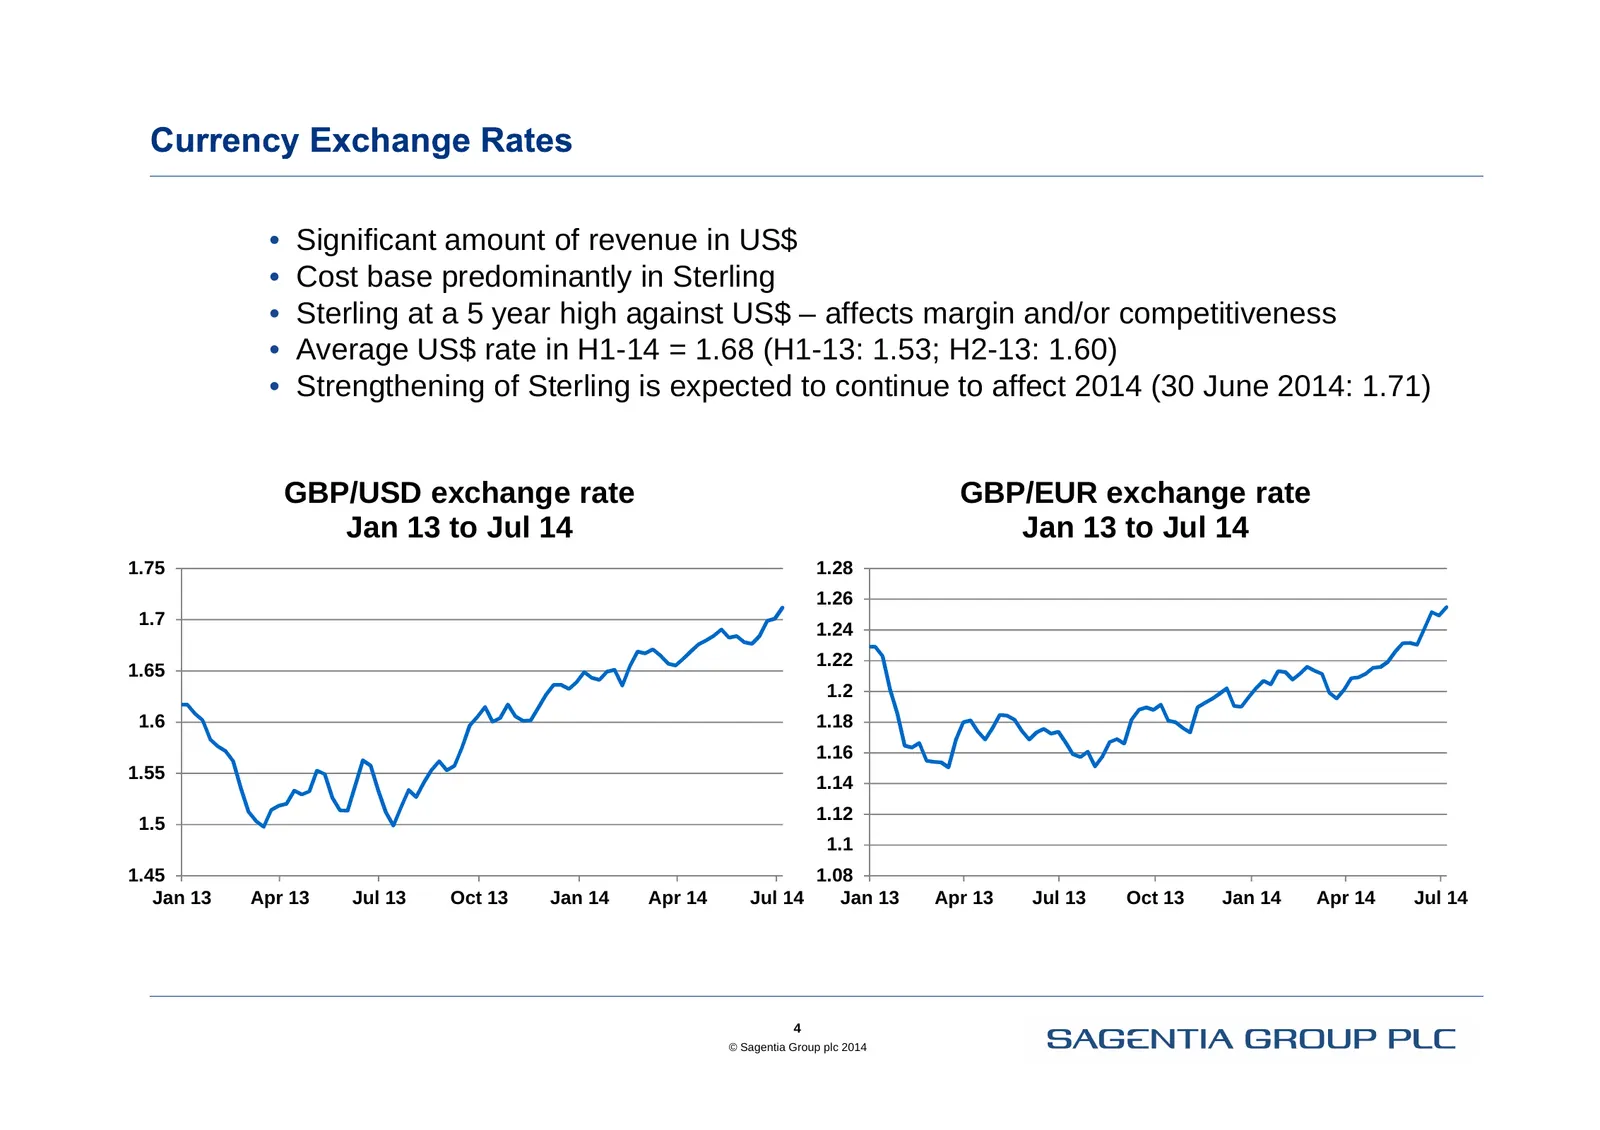
• Significant amount of revenue in US$ • Cost base predominantly in Sterling • Sterling at a 5 year high against US$ – affects margin and/or competitiveness • Average US$ rate in H1-14 = 1.68 (H1-13: 1.53; H2-13: 1.60) • Strengthening of Sterling is expected to continue to affect 2014 (30 June 2014:
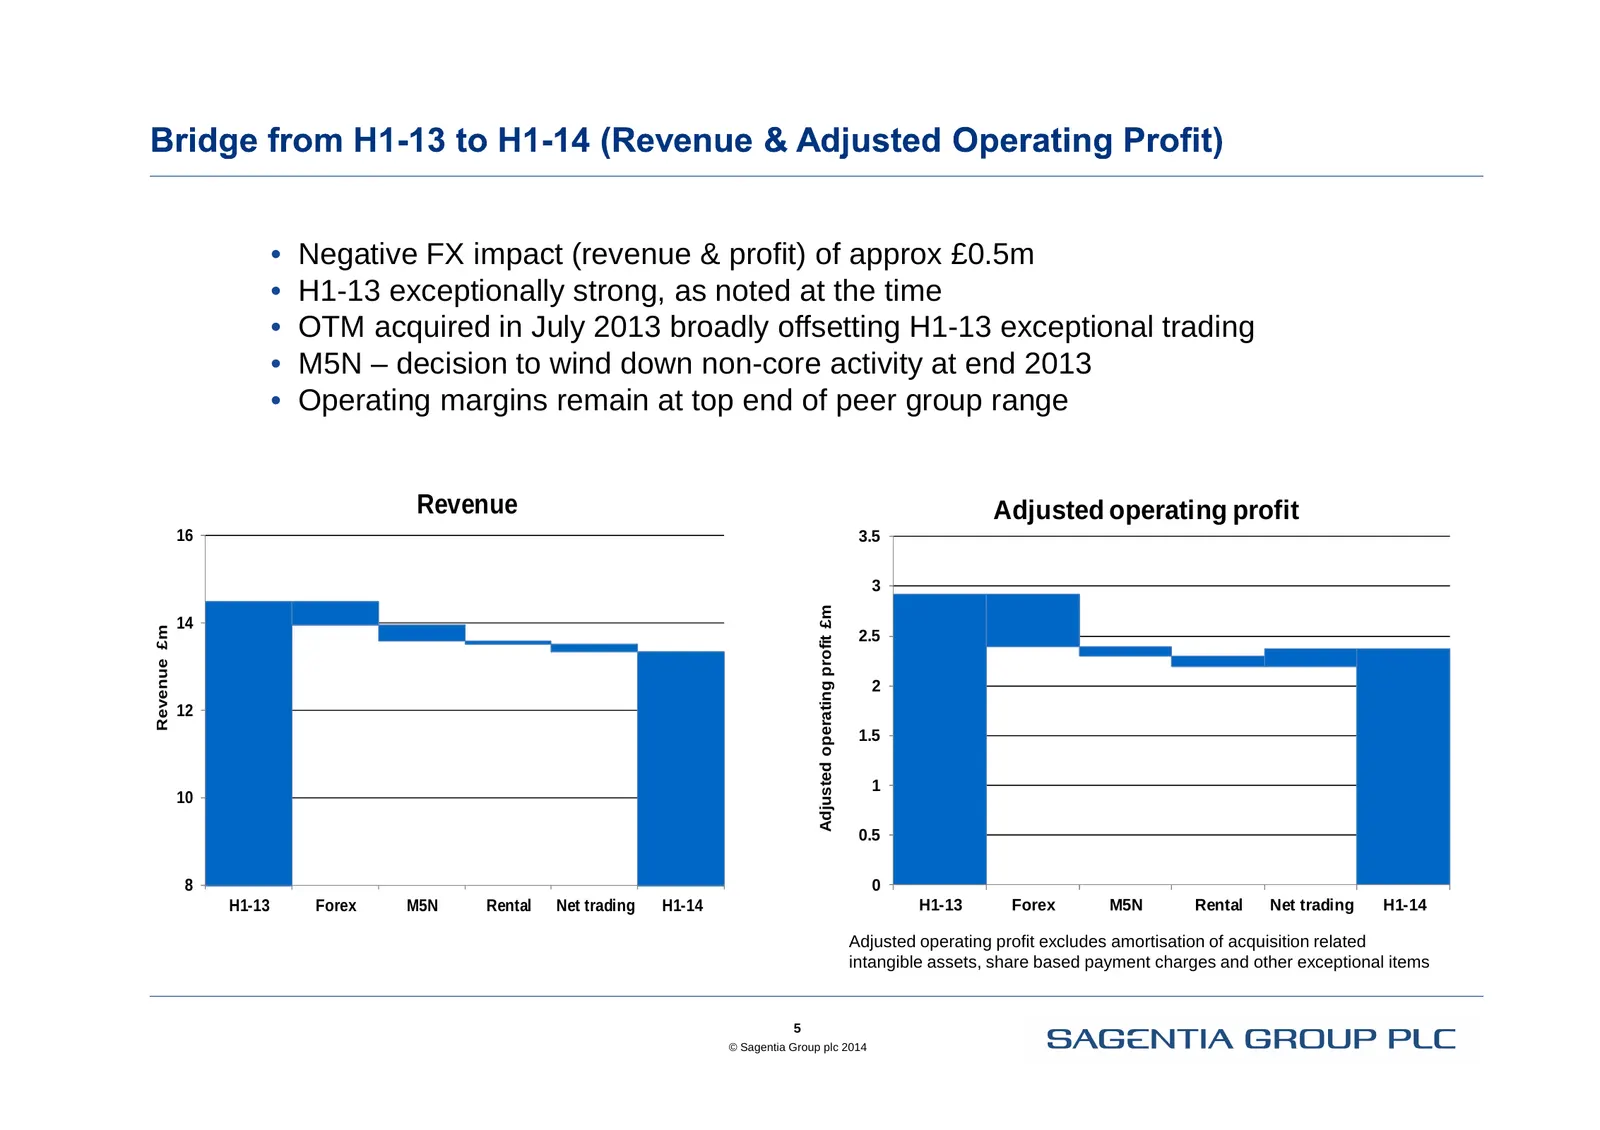
Slide 5: H1-13 to H1-14 revenue and adjusted operating profit bridge
• Negative FX impact (revenue & profit) of approx £0.5m • H1-13 exceptionally strong, as noted at the time • OTM acquired in July 2013 broadly offsetting H1-13 exceptional trading • M5N – decision to wind down non-core activity at end 2013 • Operating margins remain at top end of peer group range Re
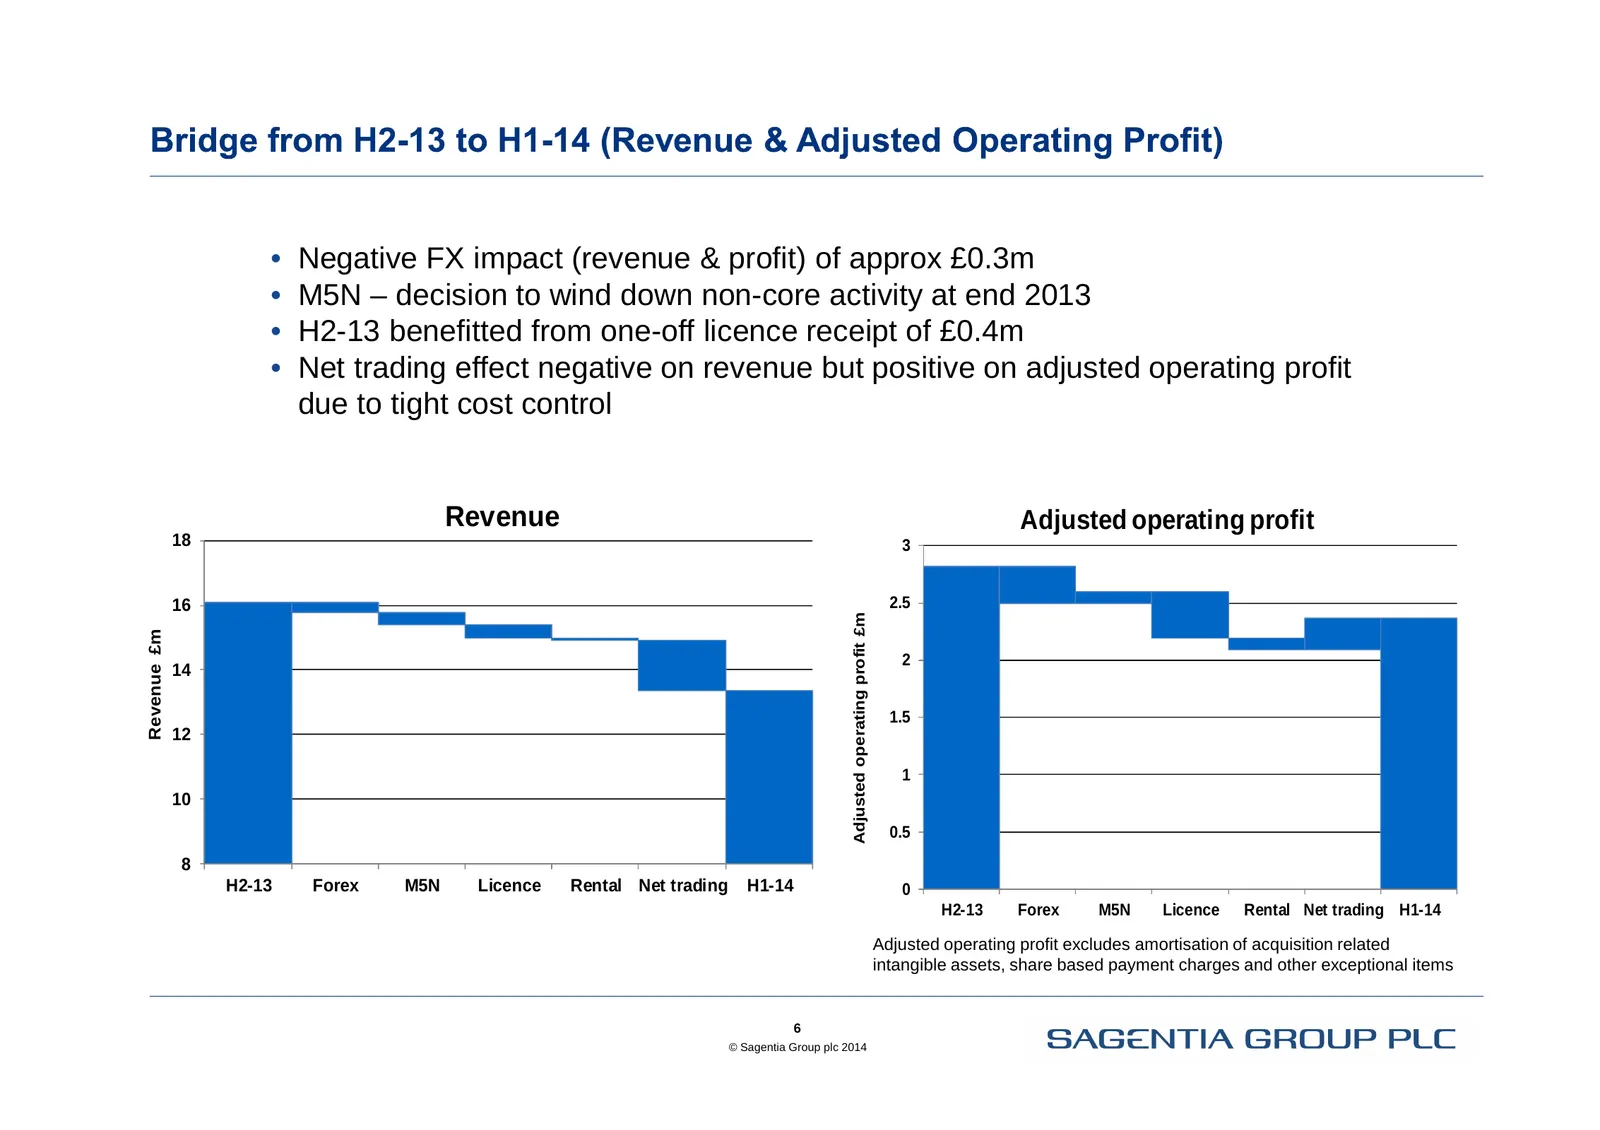
Slide 6: H2-13 to H1-14 revenue and adjusted operating profit bridge
• Negative FX impact (revenue & profit) of approx £0.3m • M5N – decision to wind down non-core activity at end 2013 • H2-13 benefitted from one-off licence receipt of £0.4m • Net trading effect negative on revenue but positive on adjusted operating profit due to tight cost control Revenue Adjusted o
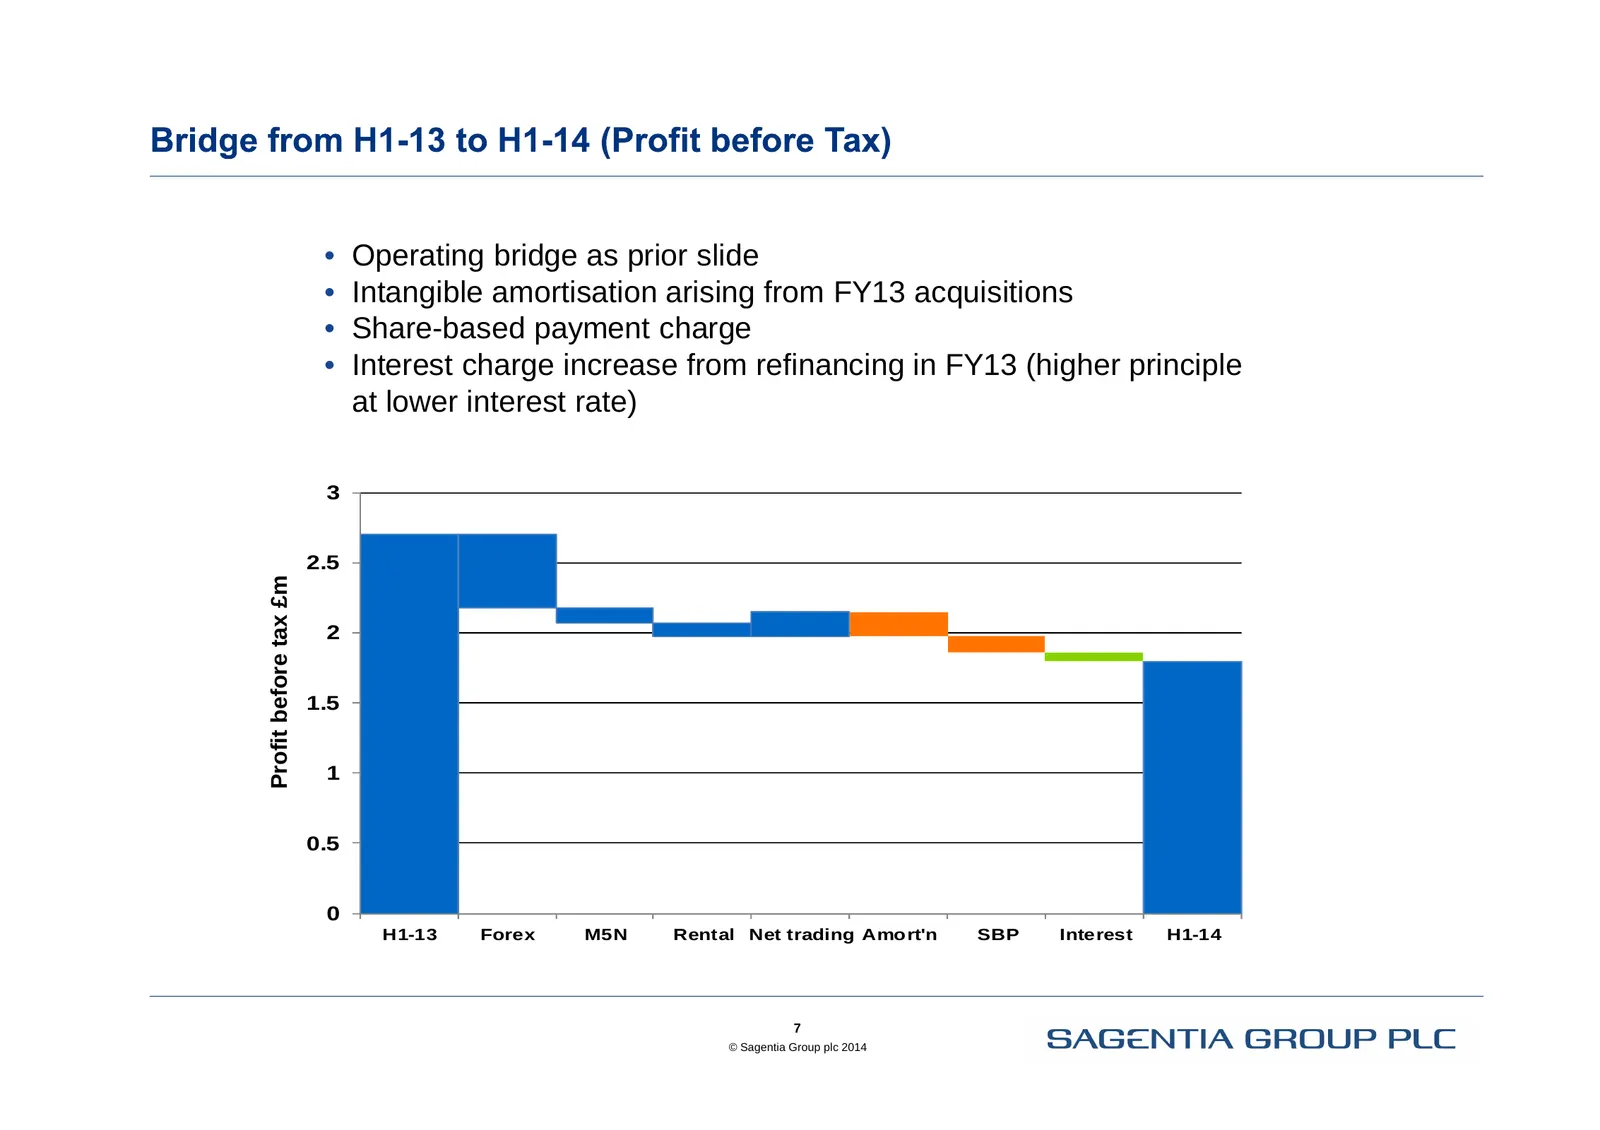
Slide 7: Profit before tax £m
• Operating bridge as prior slide • Intangible amortisation arising from FY13 acquisitions • Share-based payment charge • Interest charge increase from refinancing in FY13 (higher principle at lower interest rate) 3 2.5 Profit before tax £m 2 1.5 1 0.5 0 H1-13 Forex M5N Rental Net trading Amort'n SB
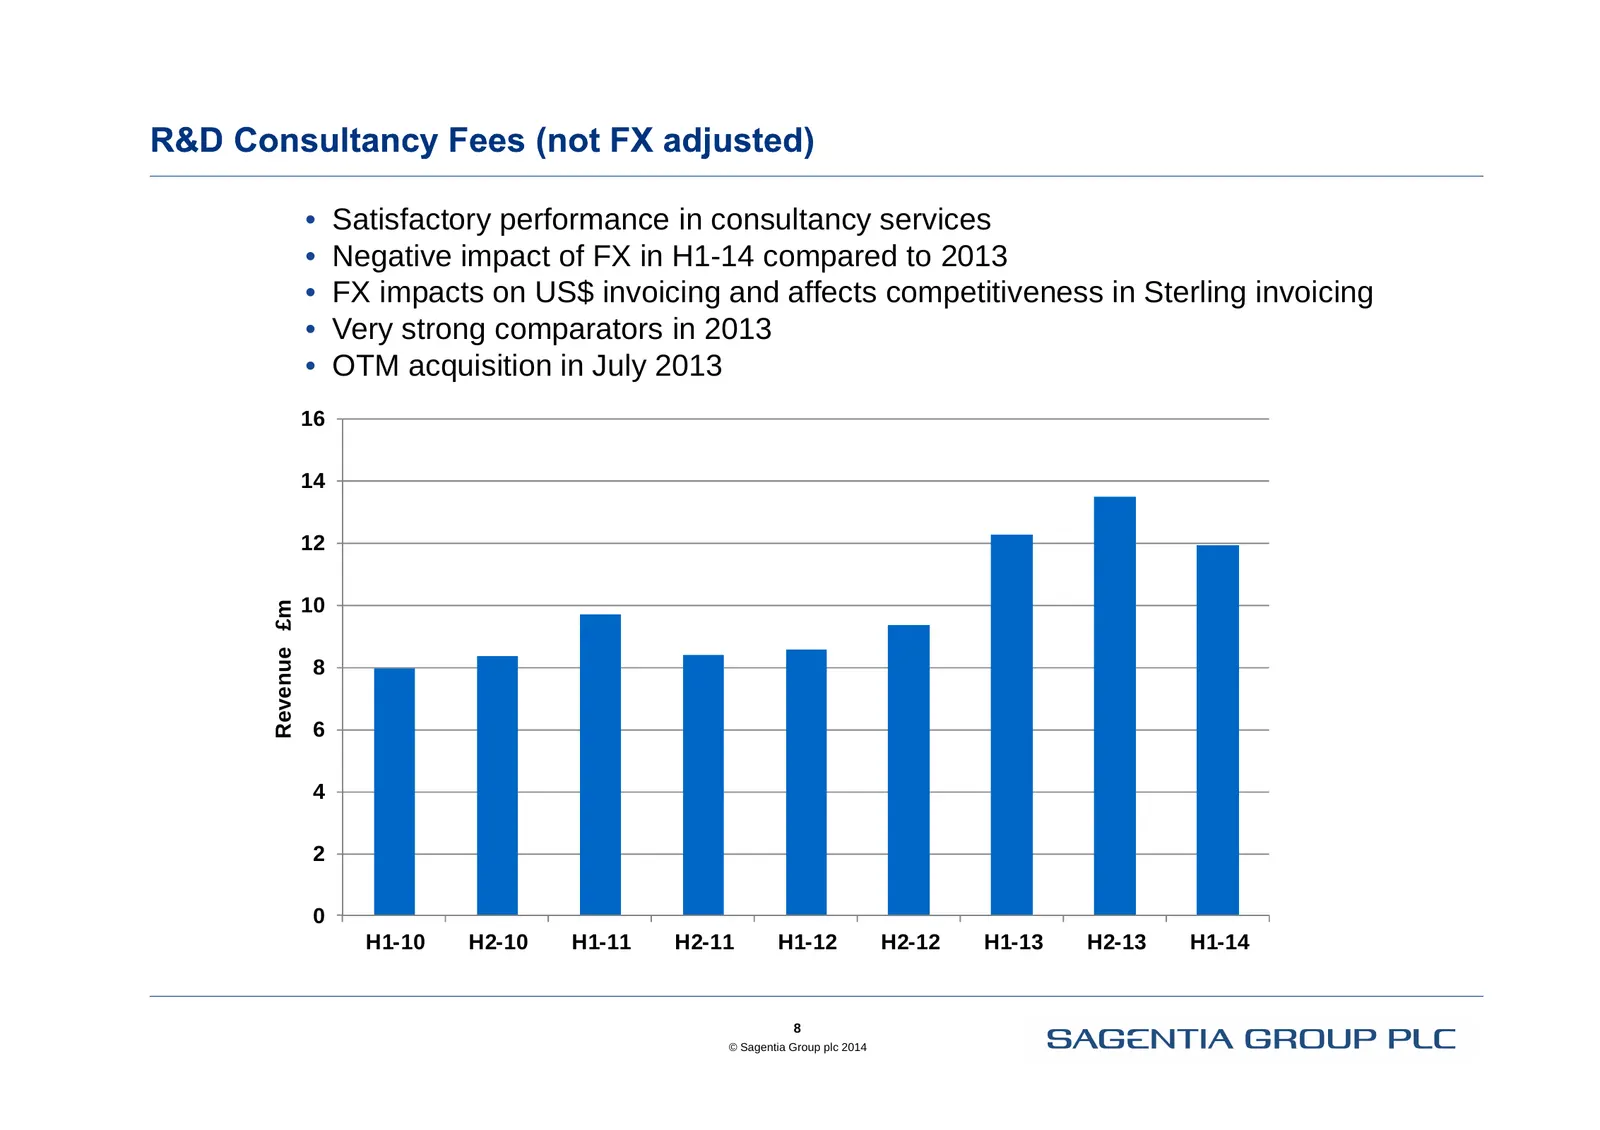
Slide 8: Revenue £m
• Satisfactory performance in consultancy services • Negative impact of FX in H1-14 compared to 2013 • FX impacts on US$ invoicing and affects competitiveness in Sterling invoicing • Very strong comparators in 2013 • OTM acquisition in July 2013 16 14 12 10 Revenue £m 8 6 4 2 0 H1-10 H2-10 H1-11 H2-
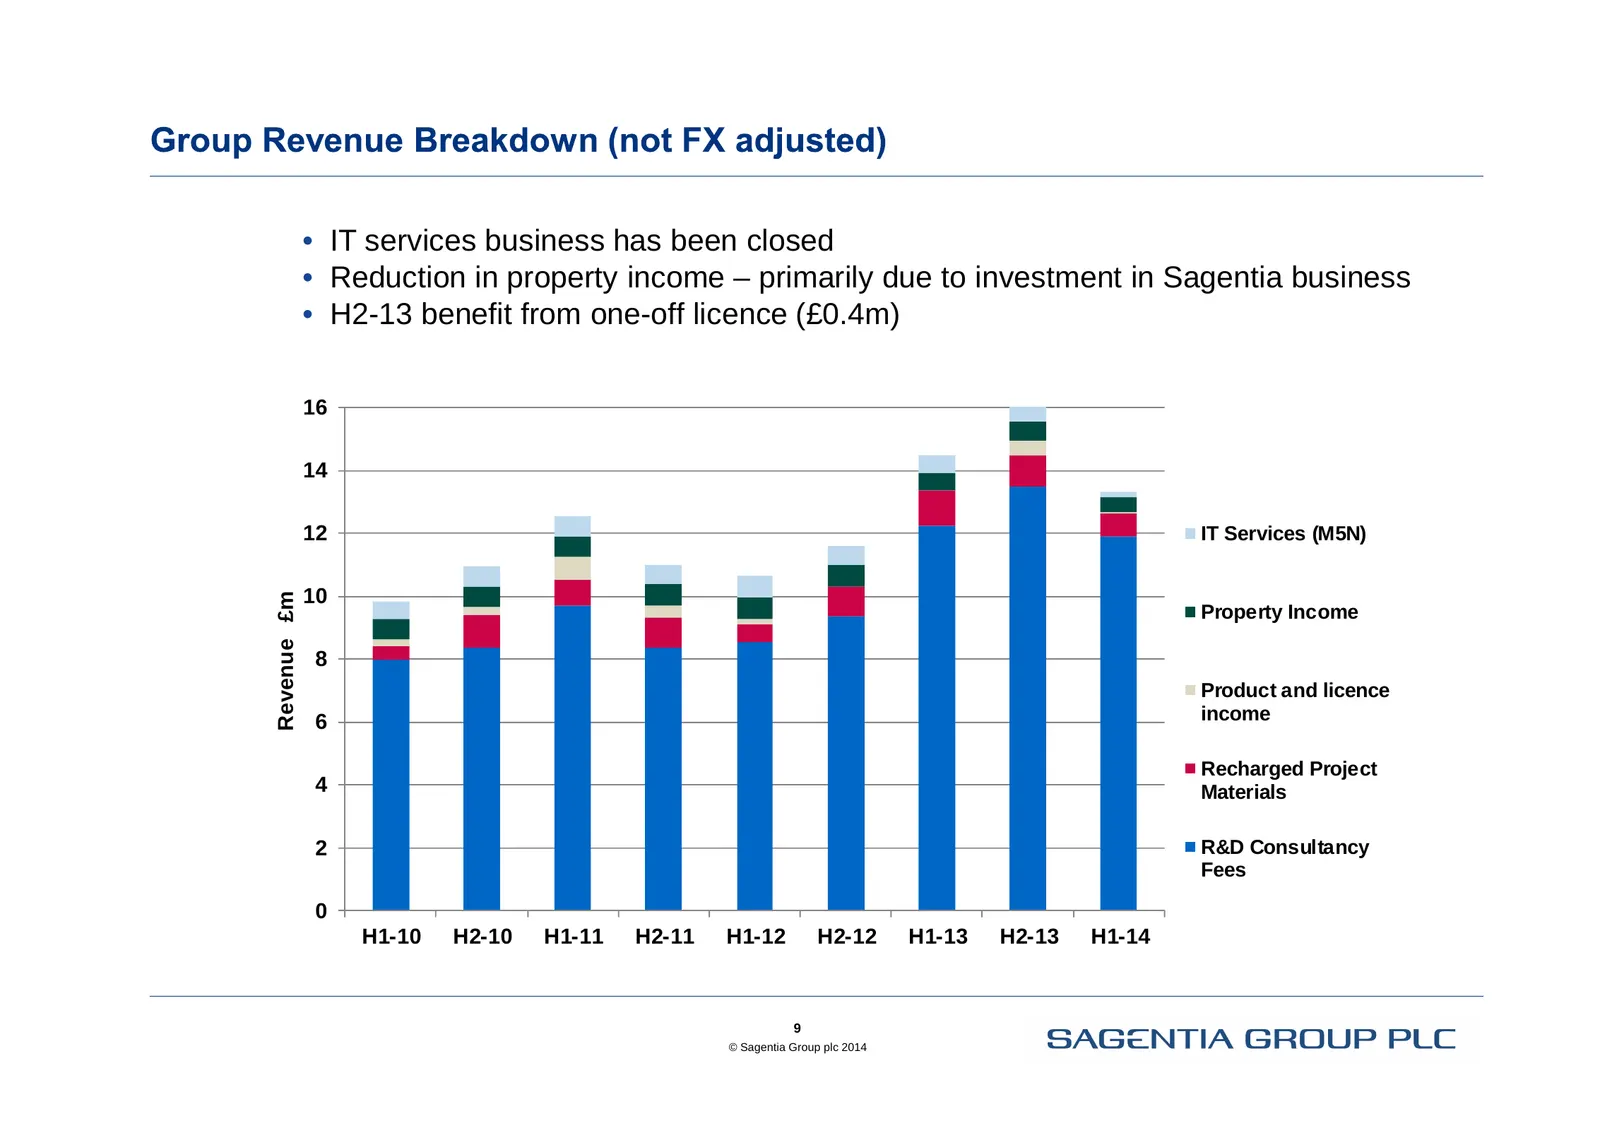
Slide 9: Revenue by type £m
• IT services business has been closed • Reduction in property income – primarily due to investment in Sagentia business • H2-13 benefit from one-off licence (£0.4m) 16 14 12 IT Services (M5N) 10 Revenue £m Property Income 8 Product and licence 6 income Recharged Project 4 Materials 2 R&D Consultanc
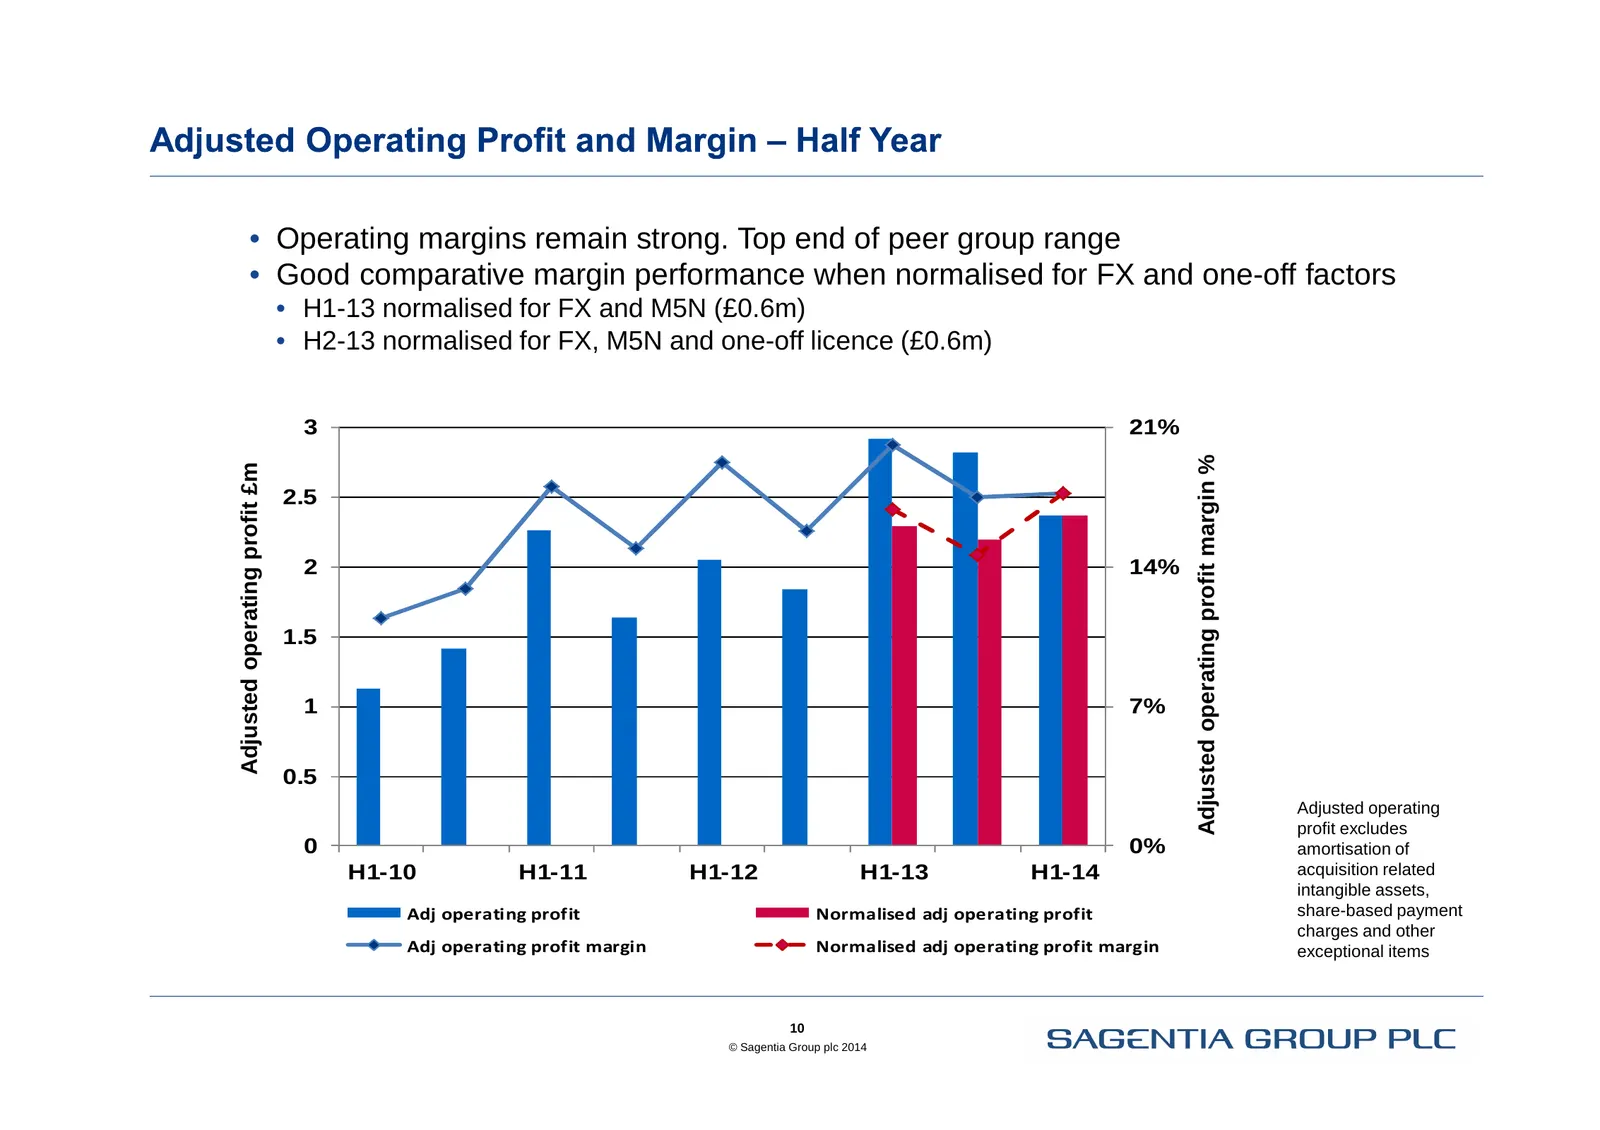
Slide 10: Adjusted operating profit margin
• Operating margins remain strong. Top end of peer group range • Good comparative margin performance when normalised for FX and one-off factors • H1-13 normalised for FX and M5N (£0.6m) • H2-13 normalised for FX, M5N and one-off licence (£0.6m) 3 21% Adjusted operating profit margin % Adjusted opera
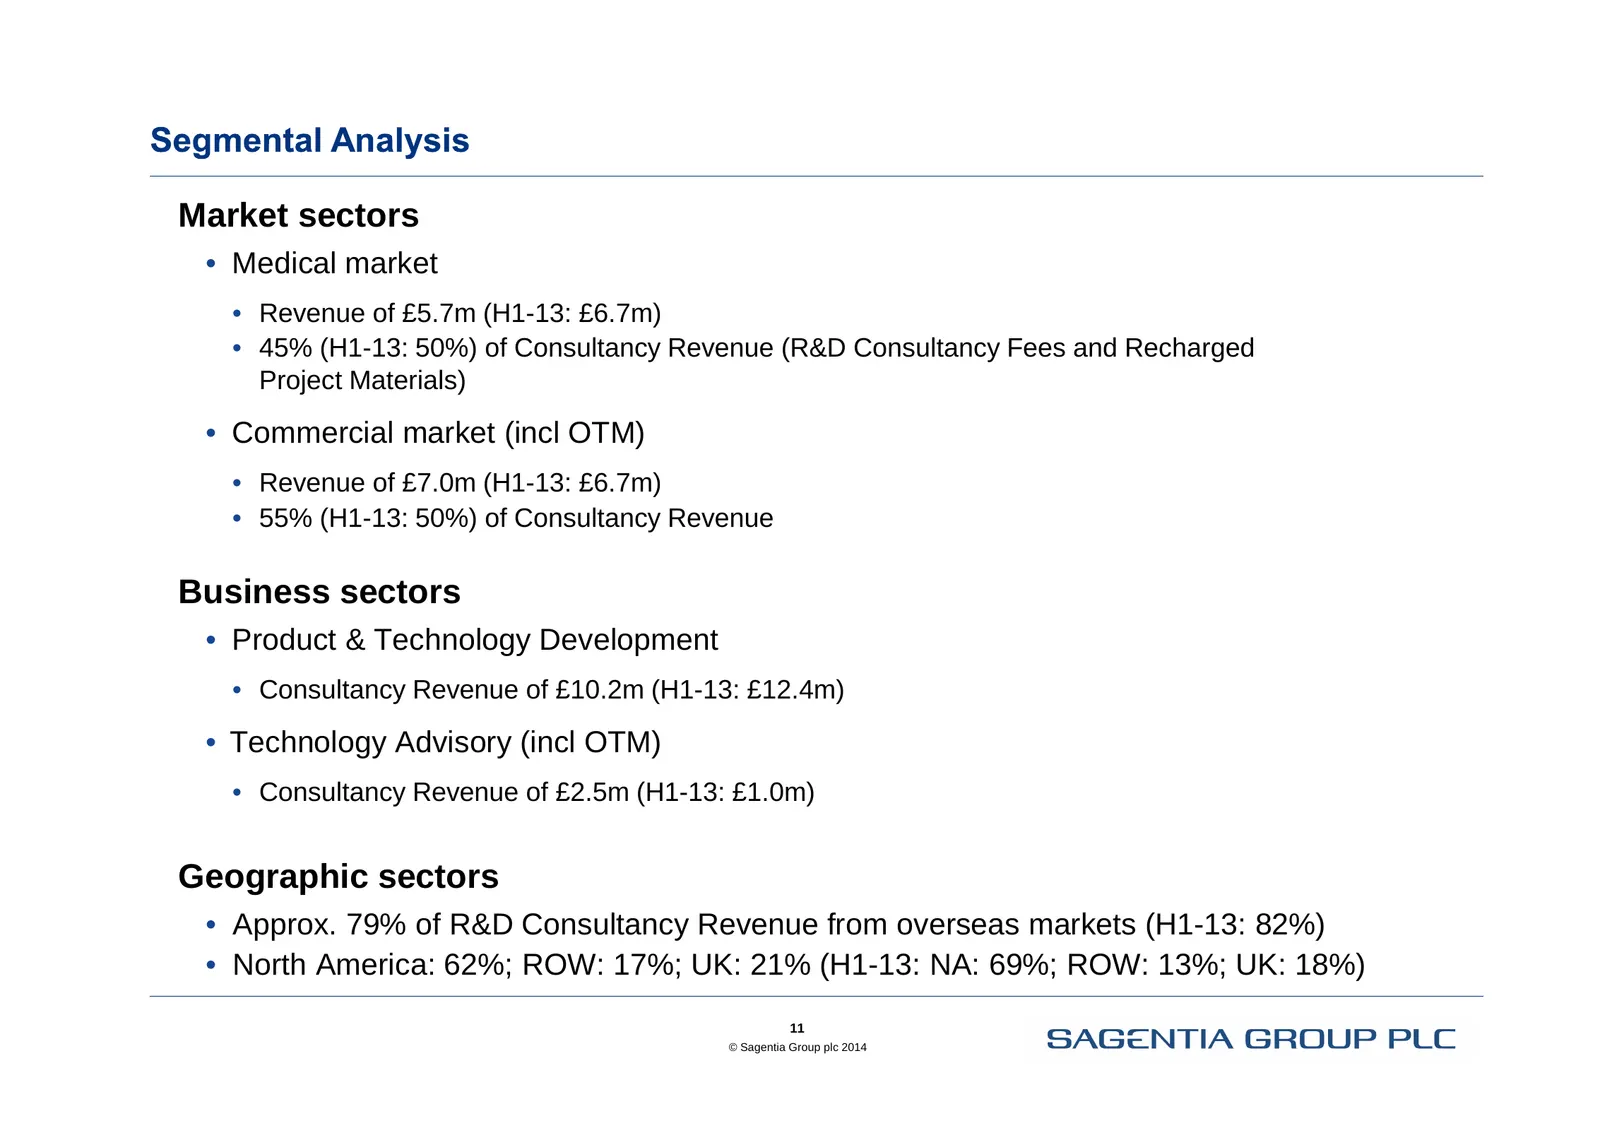
Slide 11: Market, business and geographic sectors
Market sectors • Medical market • Revenue of £5.7m (H1-13: £6.7m) • 45% (H1-13: 50%) of Consultancy Revenue (R&D Consultancy Fees and Recharged Project Materials) • Commercial market (incl OTM) • Revenue of £7.0m (H1-13: £6.7m) • 55% (H1-13: 50%) of Consultancy Revenue Business sectors • Product & T
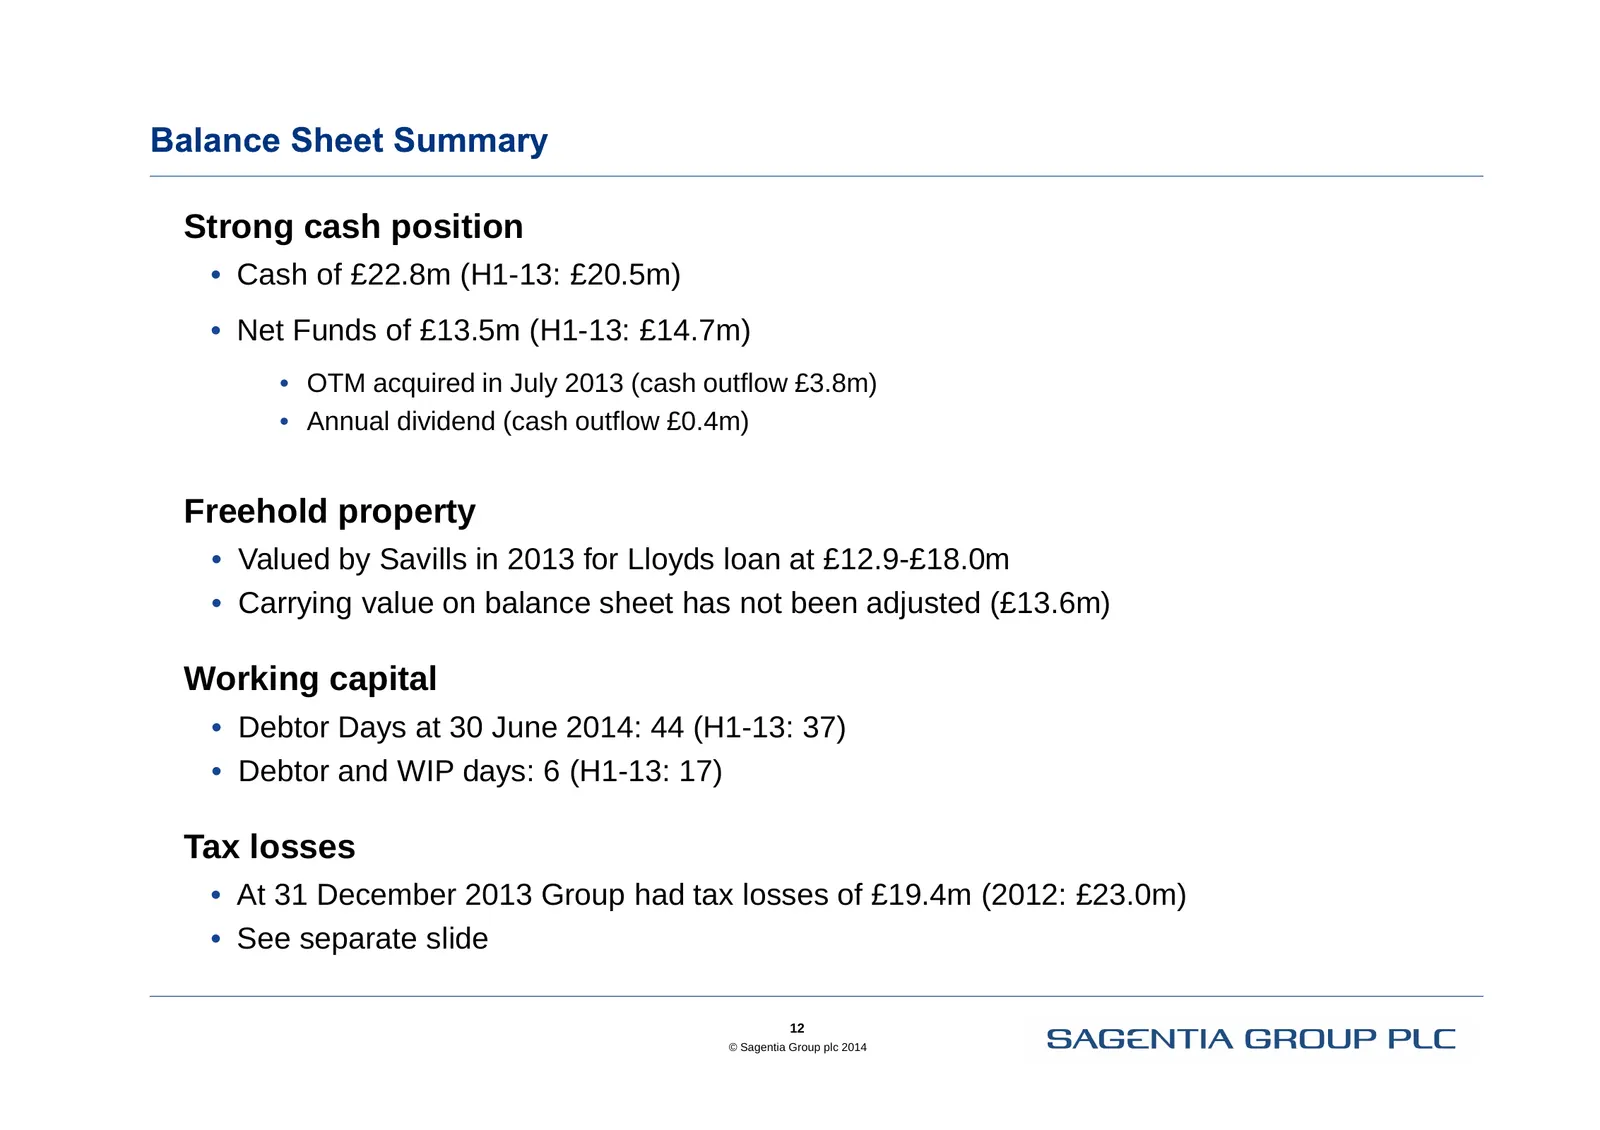
Slide 12: Strong cash position, freehold property, working capital
Strong cash position • Cash of £22.8m (H1-13: £20.5m) • Net Funds of £13.5m (H1-13: £14.7m) • OTM acquired in July 2013 (cash outflow £3.8m) • Annual dividend (cash outflow £0.4m) Freehold property • Valued by Savills in 2013 for Lloyds loan at £12.9-£18.0m • Carrying value on balance sheet has not
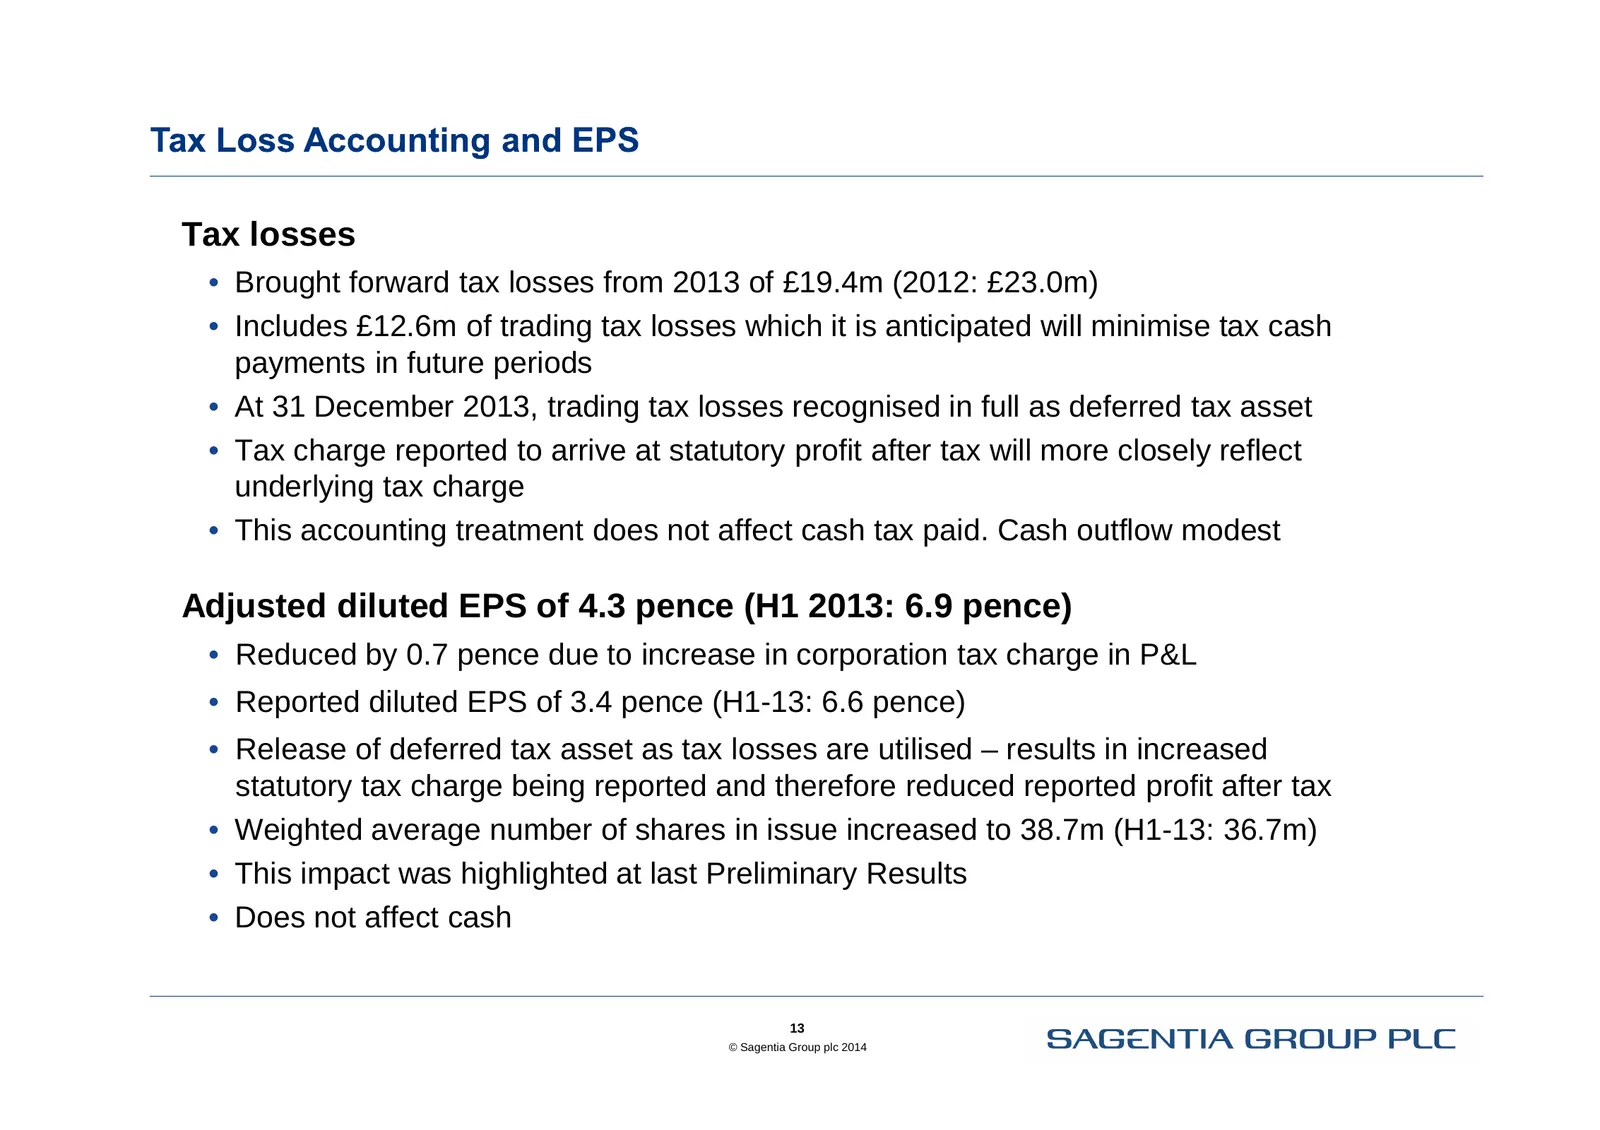
Slide 13: Tax losses and adjusted diluted EPS
Tax losses • Brought forward tax losses from 2013 of £19.4m (2012: £23.0m) • Includes £12.6m of trading tax losses which it is anticipated will minimise tax cash payments in future periods • At 31 December 2013, trading tax losses recognised in full as deferred tax asset • Tax charge reported to arr
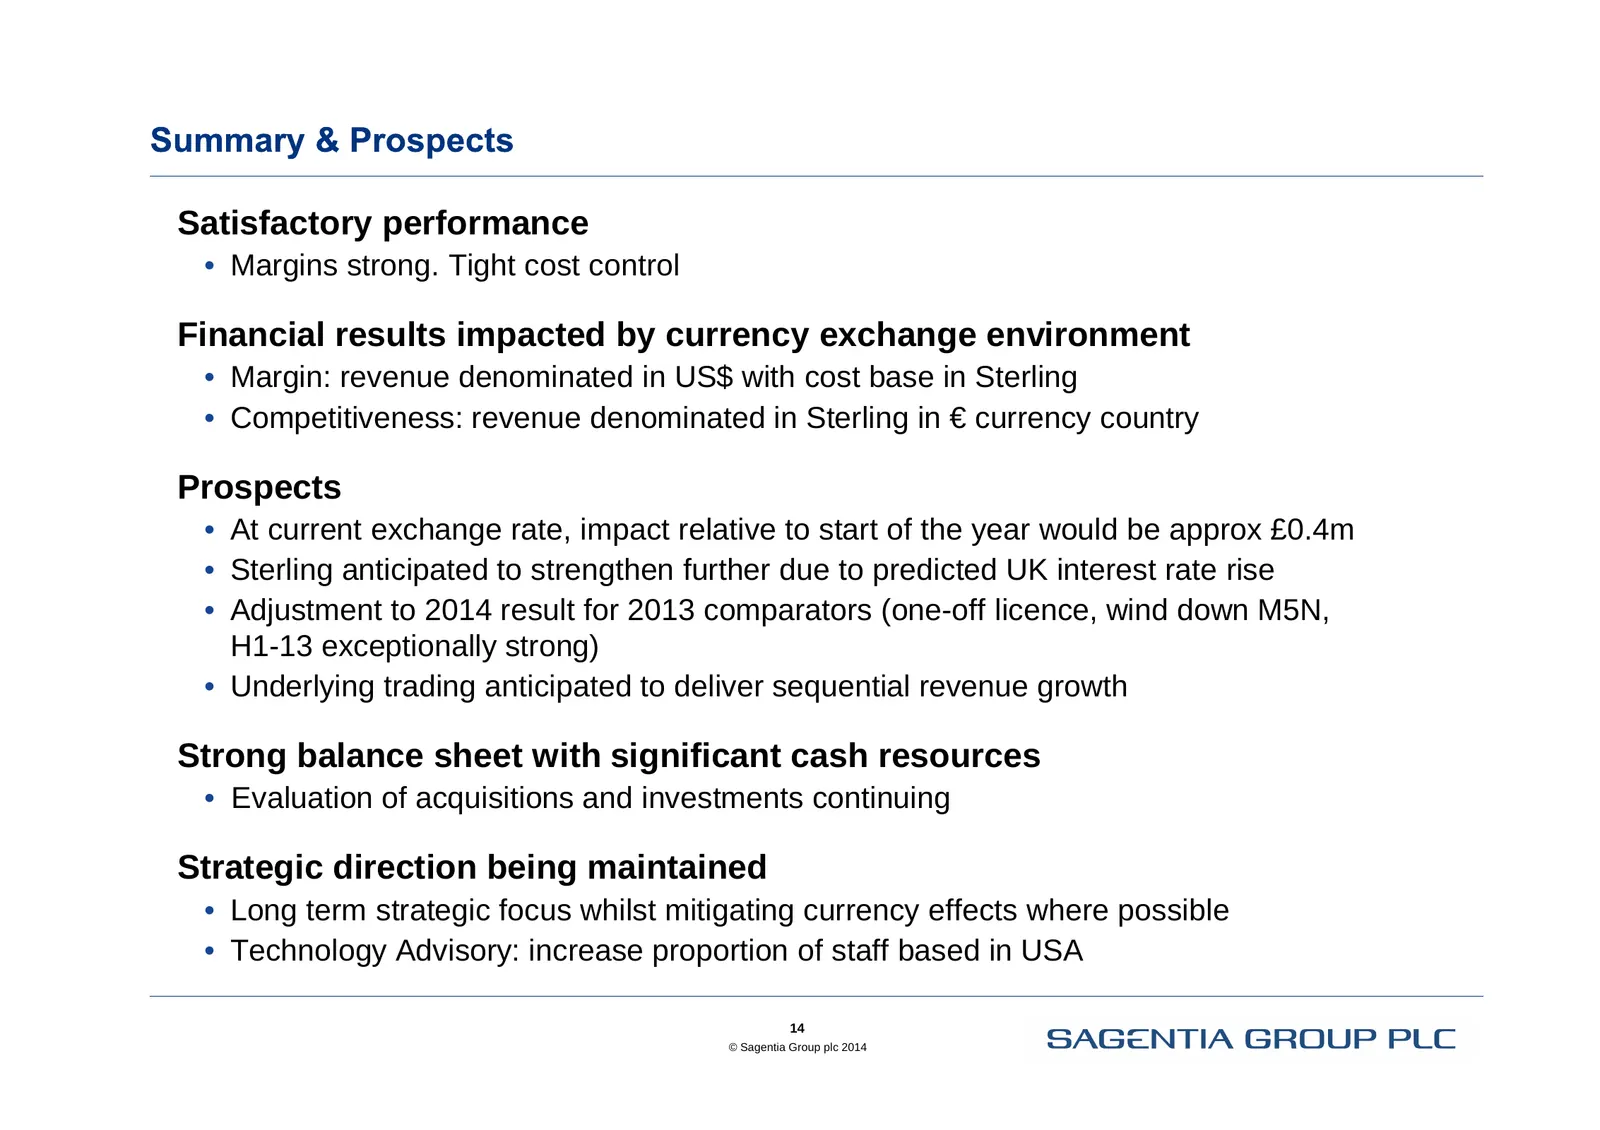
Slide 14: Satisfactory performance and prospects
Satisfactory performance • Margins strong. Tight cost control Financial results impacted by currency exchange environment • Margin: revenue denominated in US$ with cost base in Sterling • Competitiveness: revenue denominated in Sterling in € currency country Prospects • At current exchange rate, imp

Slide 15: Sagentia is listed on the London Stock Exchange
www.sagentia.com info@sagentia.com Sagentia is listed on the London Stock Exchange (SAG.L) SAGENTIA GROUP PLC
Source: Internet Archive copy of sciencegroup.com
More decks from Science Group PLC
 FY2025 Earnings Presentation18 slides · Mar 17, 2026
 Leatherhead Food Research — Technical Presentation (March 2026)37 slides · Mar 4, 2026
 H1 2025 Earnings Presentation12 slides · Jul 28, 2025
 FY2024 Earnings Presentation16 slides · Mar 24, 2025
 H1 2024 Earnings Presentation10 slides · Jul 23, 2024
 FY2023 Earnings Presentation19 slides · Mar 21, 2024