Entegra Financial — Shareholder Meeting (May 2016)
27 slides from Entegra Financial's shareholder meeting presentation, May 19, 2016
Slide 1: Shareholder Meeting May 19, 2016
Shareholder Meeting May 19, 2016
Slide 2: Forward Looking Statements
Information in this presentation may contain “forward - looking statements” . Such statements involve known and unknown risks, uncertainties and other factors that may cause actual results to differ materially . Forward - looking statements are often characterized by the use of qualifying words such
Slide 3: Financial Data
• All data throughout the presentation is in thousands, except per share data • Any reference to Q1 and Q1 pro - forma data refers to March 31, 2016 and is unaudited Financial Data
Slide 4: Strategic Update
Strategic Update
Slide 5: Successful Rebranding
Successful Rebranding 5 No Geographical Boundaries Value Based Message
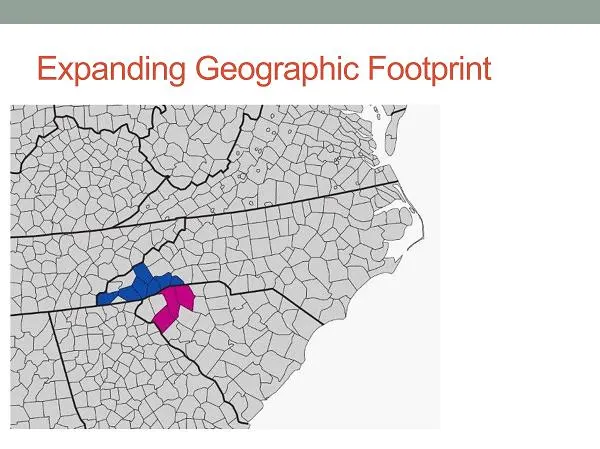
Slide 6: Expanding Geographic Footprint
Expanding Geographic Footprint
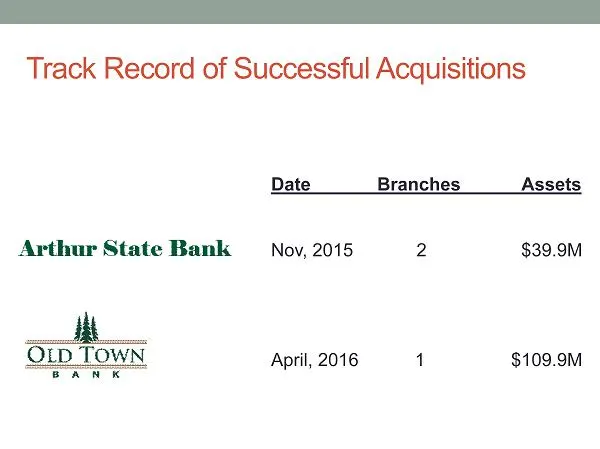
Slide 7: Track Record of Successful Acquisitions
Track Record of Successful Acquisitions Date Branches Assets Nov, 2015 2 $39.9M April, 2016 1 $109.9M
Slide 8: ASB Acquisition – Positive Results to Date
ASB Acquisition – Positive Results to Date Deposit Growth - $2.9M (7.2%) Q1 2016 Income - $115k
Slide 9: Strategic Plan Execution
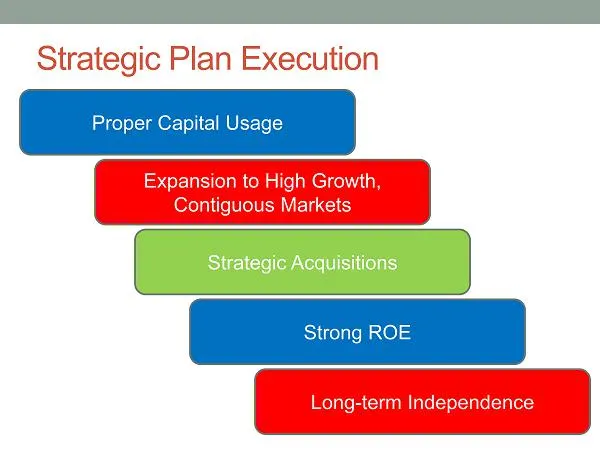
Strategic Plan Execution Long - term Independence Strong ROE Strategic Acquisitions Expansion to High Growth, Contiguous Markets Proper Capital Usage
Slide 10: Deposit Share in Legacy Markets
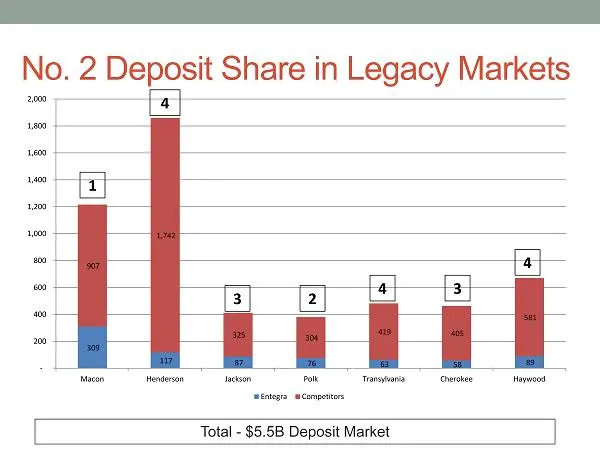
No. 2 Deposit Share in Legacy Markets 309 117 87 76 63 58 89 907 1,742 325 304 419 405 581 - 200 400 600 800 1,000 1,200 1,400 1,600 1,800 2,000 Macon Henderson Jackson Polk Transylvania Cherokee Haywood Entegra Competitors 1 4 3 2 4 3 4 Total - $5.5B Deposit Market
Slide 11: Significant Opportunity in Upstate SC
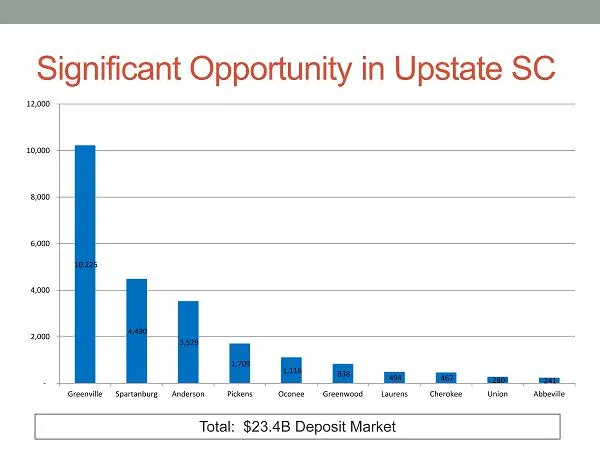
Significant Opportunity in Upstate SC 10,225 4,490 3,529 1,709 1,116 838 494 467 280 241 - 2,000 4,000 6,000 8,000 10,000 12,000 Greenville Spartanburg Anderson Pickens Oconee Greenwood Laurens Cherokee Union Abbeville Total: $23.4B Deposit Market
Slide 12: Financial Overview
Financial Overview
Slide 13: Well Capitalized & Room to Grow
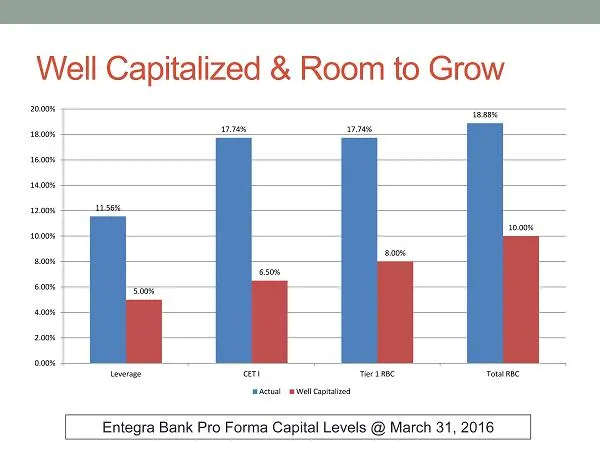
Well Capitalized & Room to Grow Entegra Bank Pro Forma Capital Levels @ March 31, 2016 11.56% 17.74% 17.74% 18.88% 5.00% 6.50% 8.00% 10.00% 0.00% 2.00% 4.00% 6.00% 8.00% 10.00% 12.00% 14.00% 16.00% 18.00% 20.00% Leverage CET I Tier 1 RBC Total RBC Actual Well Capitalized
Slide 14: Consistent Asset Growth
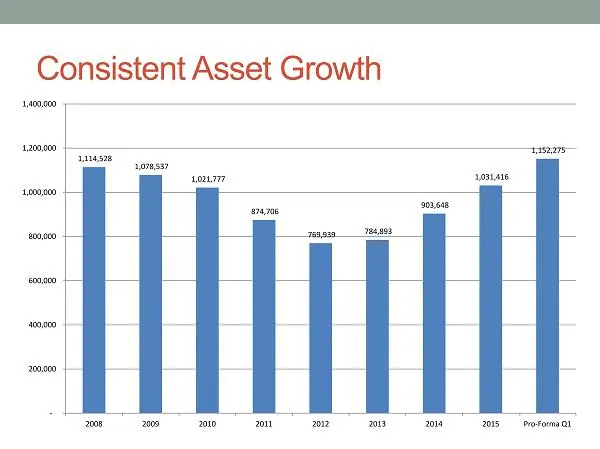
Consistent Asset Growth 1,114,528 1,078,537 1,021,777 874,706 769,939 784,893 903,648 1,031,416 1,152,275 - 200,000 400,000 600,000 800,000 1,000,000 1,200,000 1,400,000 2008 2009 2010 2011 2012 2013 2014 2015 Pro - Forma Q1
Slide 15: Steady Loan Growth
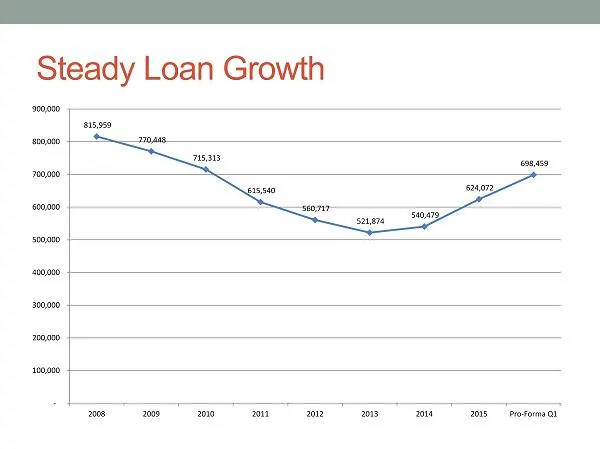
Steady Loan Growth 815,959 770,448 715,313 615,540 560,717 521,874 540,479 624,072 698,459 - 100,000 200,000 300,000 400,000 500,000 600,000 700,000 800,000 900,000 2008 2009 2010 2011 2012 2013 2014 2015 Pro - Forma Q1
Slide 16: But With A Much Lower Risk Profile
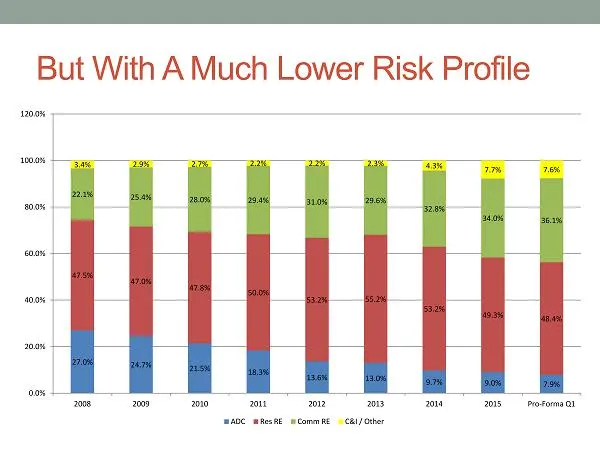
But With A Much Lower Risk Profile 27.0% 24.7% 21.5% 18.3% 13.6% 13.0% 9.7% 9.0% 7.9% 47.5% 47.0% 47.8% 50.0% 53.2% 55.2% 53.2% 49.3% 48.4% 22.1% 25.4% 28.0% 29.4% 31.0% 29.6% 32.8% 34.0% 36.1% 3.4% 2.9% 2.7% 2.2% 2.2% 2.3% 4.3% 7.7% 7.6% 0.0% 20.0% 40.0% 60.0% 80.0% 100.0% 120.0% 2008 2009 2010 201
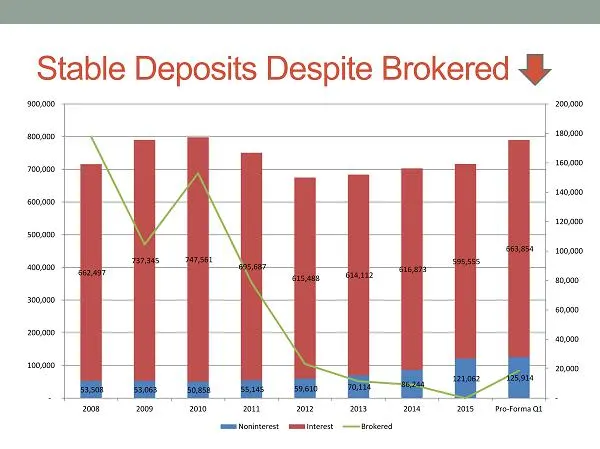
Slide 17: Stable Deposits Despite Brokered
Stable Deposits Despite Brokered 53,508 53,063 50,858 55,145 59,610 70,114 86,244 121,062 125,914 662,497 737,345 747,561 695,687 615,488 614,112 616,873 595,555 663,854 - 20,000 40,000 60,000 80,000 100,000 120,000 140,000 160,000 180,000 200,000 - 100,000 200,000 300,000 400,000 500,000 600,000 70
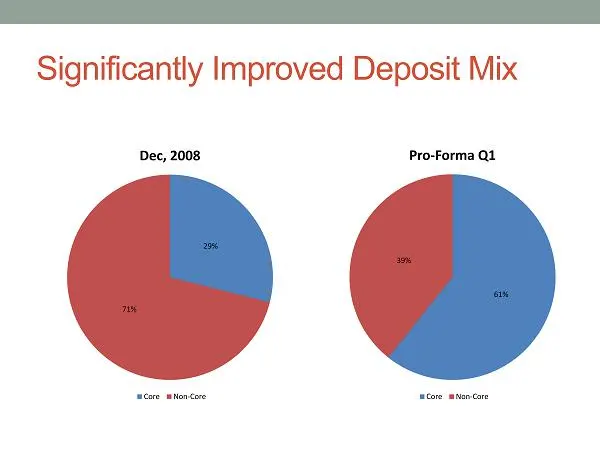
Slide 18: Significantly Improved Deposit Mix
Significantly Improved Deposit Mix 29% 71% Dec, 2008 Core Non - Core 61% 39% Pro - Forma Q1 Core Non - Core
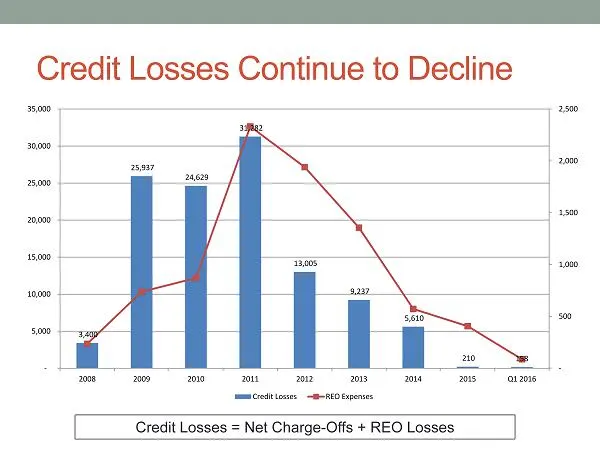
Slide 19: Credit Losses Continue to Decline
Credit Losses Continue to Decline Credit Losses = Net Charge - Offs + REO Losses 3,400 25,937 24,629 31,282 13,005 9,237 5,610 210 158 - 500 1,000 1,500 2,000 2,500 - 5,000 10,000 15,000 20,000 25,000 30,000 35,000 2008 2009 2010 2011 2012 2013 2014 2015 Q1 2016 Credit Losses REO Expenses
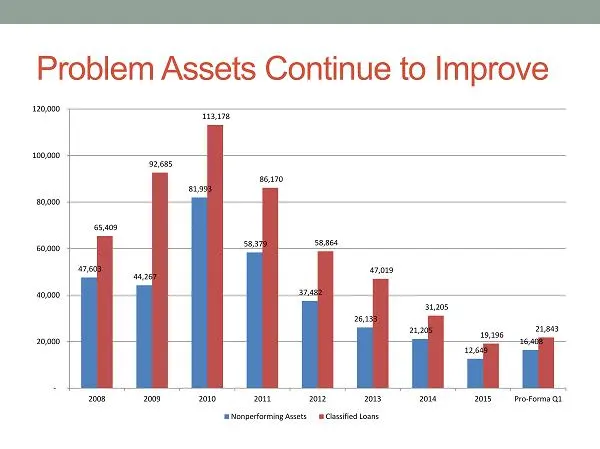
Slide 20: Problem Assets Continue to Improve
Problem Assets Continue to Improve 47,603 44,267 81,993 58,379 37,482 26,133 21,205 12,649 16,408 65,409 92,685 113,178 86,170 58,864 47,019 31,205 19,196 21,843 - 20,000 40,000 60,000 80,000 100,000 120,000 2008 2009 2010 2011 2012 2013 2014 2015 Pro - Forma Q1 Nonperforming Assets Classified Loans
Slide 21: Strong Growth in Margin Income
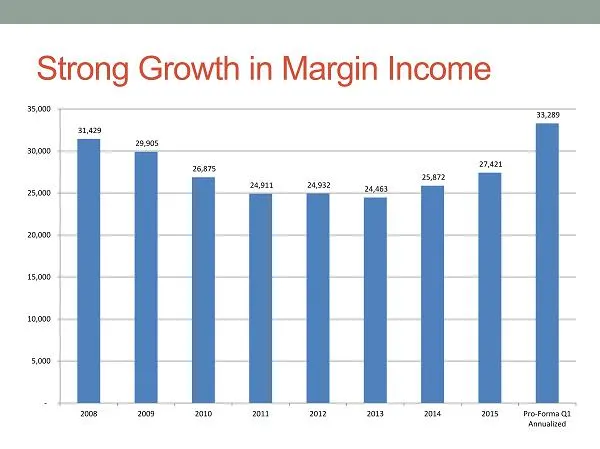
Strong Growth in Margin Income 31,429 29,905 26,875 24,911 24,932 24,463 25,872 27,421 33,289 - 5,000 10,000 15,000 20,000 25,000 30,000 35,000 2008 2009 2010 2011 2012 2013 2014 2015 Pro - Forma Q1 Annualized
Slide 22: Improving Net Interest Margin
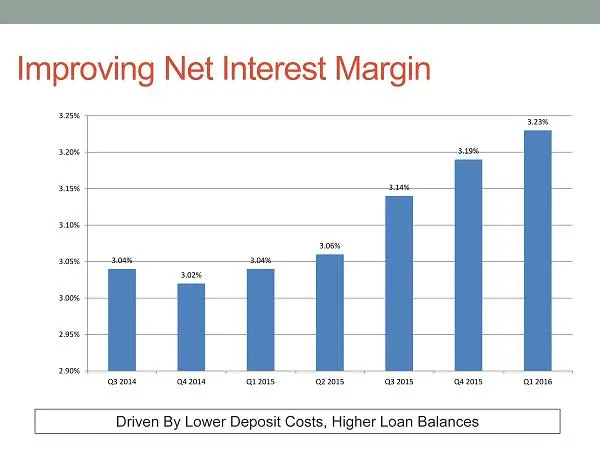
Improving Net Interest Margin 3.04% 3.02% 3.04% 3.06% 3.14% 3.19% 3.23% 2.90% 2.95% 3.00% 3.05% 3.10% 3.15% 3.20% 3.25% Q3 2014 Q4 2014 Q1 2015 Q2 2015 Q3 2015 Q4 2015 Q1 2016 Driven By Lower Deposit Costs, Higher Loan Balances
Slide 23: Focus on SBA Gains & Deposit Fees
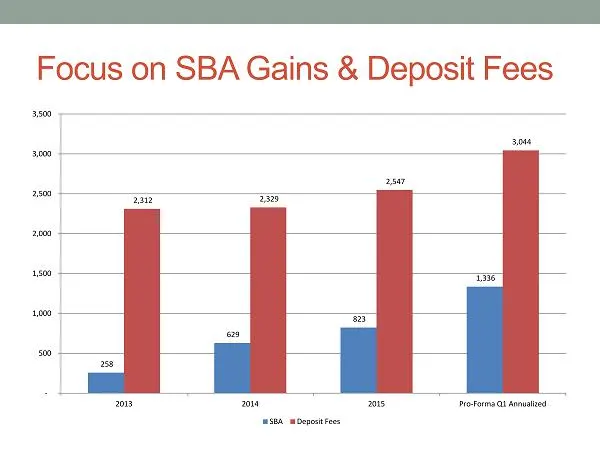
Focus on SBA Gains & Deposit Fees 258 629 823 1,336 2,312 2,329 2,547 3,044 - 500 1,000 1,500 2,000 2,500 3,000 3,500 2013 2014 2015 Pro - Forma Q1 Annualized SBA Deposit Fees
Slide 24: Realistic ROE Growth Targets
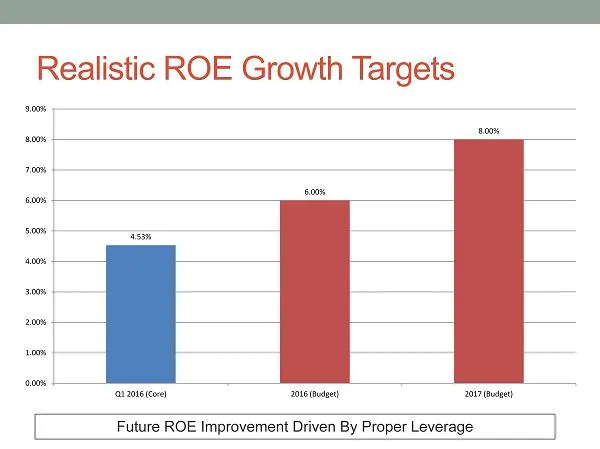
Realistic ROE Growth Targets 4.53% 6.00% 8.00% 0.00% 1.00% 2.00% 3.00% 4.00% 5.00% 6.00% 7.00% 8.00% 9.00% Q1 2016 (Core) 2016 (Budget) 2017 (Budget) Future ROE Improvement Driven By Proper Leverage
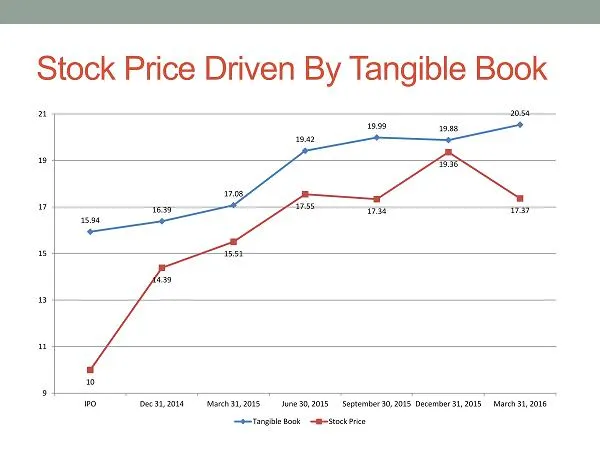
Slide 25: Stock Price Driven By Tangible Book
Stock Price Driven By Tangible Book 15.94 16.39 17.08 19.42 19.99 19.88 20.54 10 14.39 15.51 17.55 17.34 19.36 17.37 9 11 13 15 17 19 21 IPO Dec 31, 2014 March 31, 2015 June 30, 2015 September 30, 2015 December 31, 2015 March 31, 2016 Tangible Book Stock Price
Slide 26: Summary
Summary
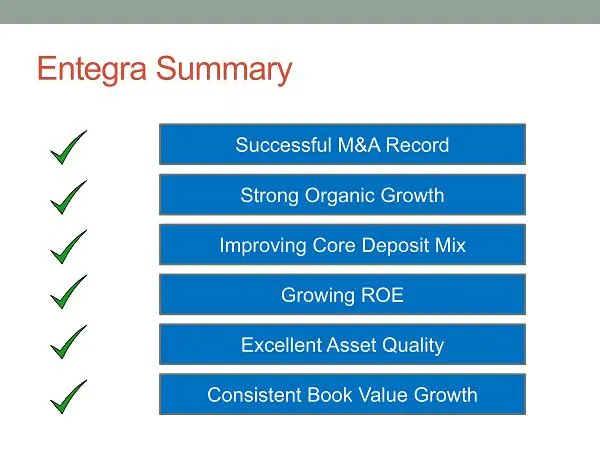
Slide 27: Entegra Summary
Entegra Summary Successful M&A Record Strong Organic Growth Growing ROE Excellent Asset Quality Consistent Book Value Growth Improving Core Deposit Mix
Source: SEC EDGAR · 8-K filed May 19, 2016
More decks from Entegra Financial Corp
 Merger or Acquisition (February 2019)21 slides · Feb 6, 2019
 Q4 2018 Earnings Presentation17 slides · Jan 24, 2019
 Merger or Acquisition (January 2019)25 slides · Jan 16, 2019
 Q3 2018 Earnings Presentation14 slides · Oct 18, 2018
 Investor Presentation (September 2018)48 slides · Sep 17, 2018
 Q2 2018 Earnings Presentation10 slides · Jul 19, 2018