Chemours Company (the) · NYSE:CC
Chemours Company (the) — Q1 2024 Earnings Presentation
16 slides from Chemours Company (the)'s earnings presentation, May 1, 2024

Slide 1: First Quarter 2024 Earnings Presentation
First Quarter 2024 Earnings Presentation April 30, 2024
Slide 2: Safe Harbor Statement and Other Matters
Safe Harbor Statement and Other Matters This presentation contains forward-looking statements, within the meaning of Section 27A of the Securities Act of 1933 and Section 21E of the Securities Exchange Act of 1934, which involve risks and uncertainties. Forward-looking statements provide current exp
Slide 3: First Quarter 2024 Financial Summary
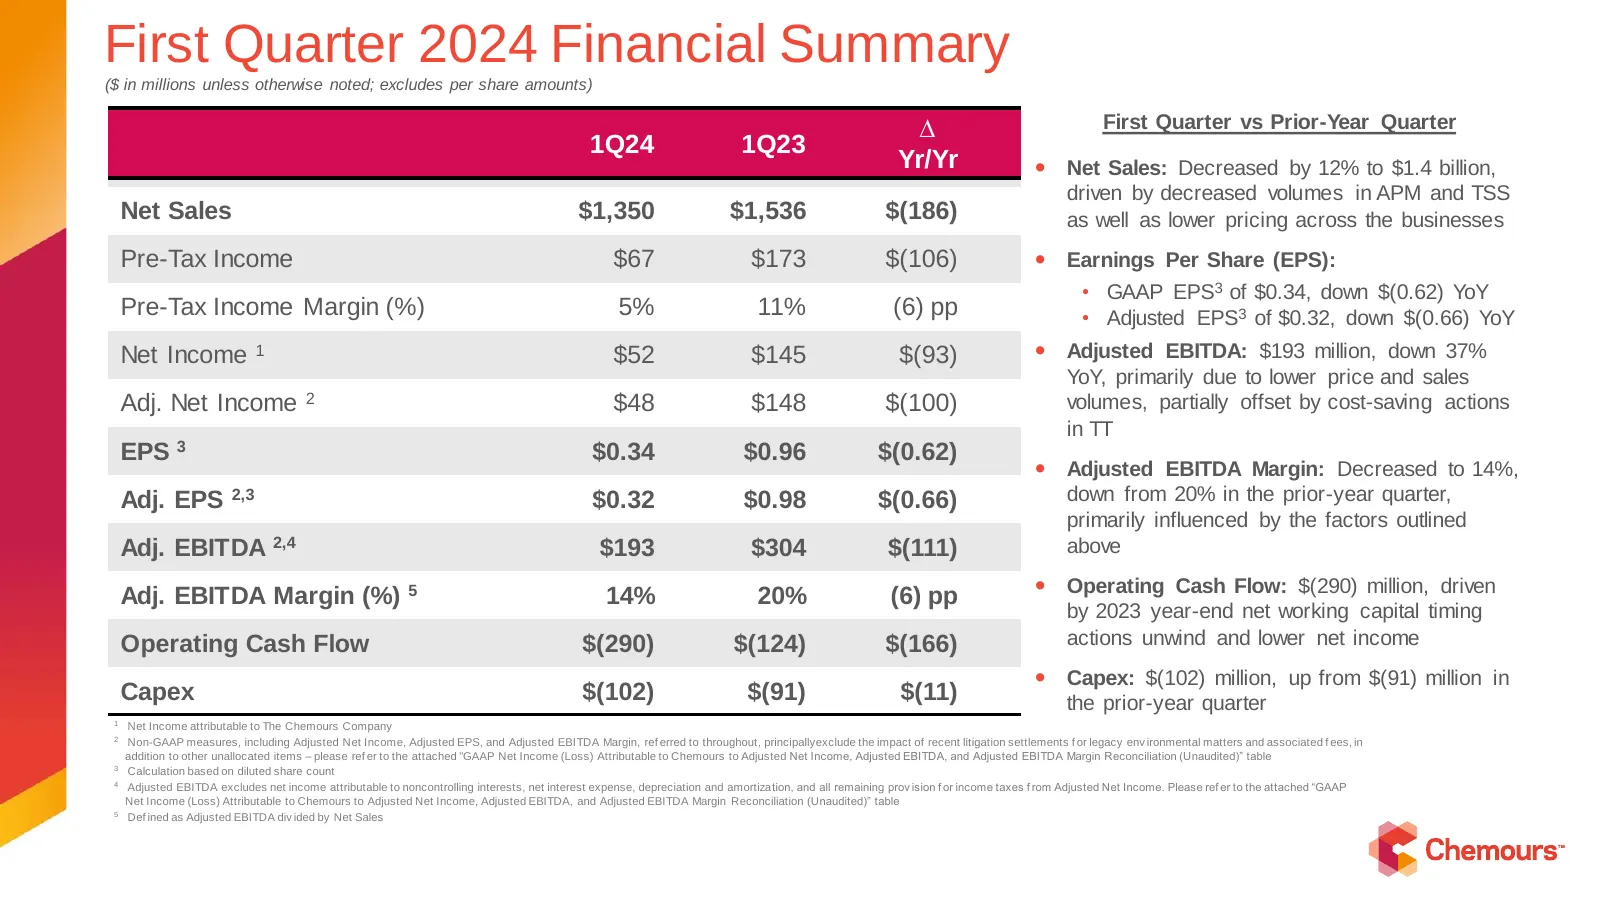
First Quarter 2024 Financial Summary ($ in millions unless otherwise noted; excludes per share amounts) ∆ First Quarter vs Prior-Year Quarter 1Q24 1Q23 Yr/Yr Net Sales: Decreased by 12% to $1.4 billion, driven by decreased volumes in APM and TSS Net Sales $1,350 $1,536 $(186) as well as lower pric
Slide 4: Adjusted EBITDA Bridge: 1Q24 versus 1Q23
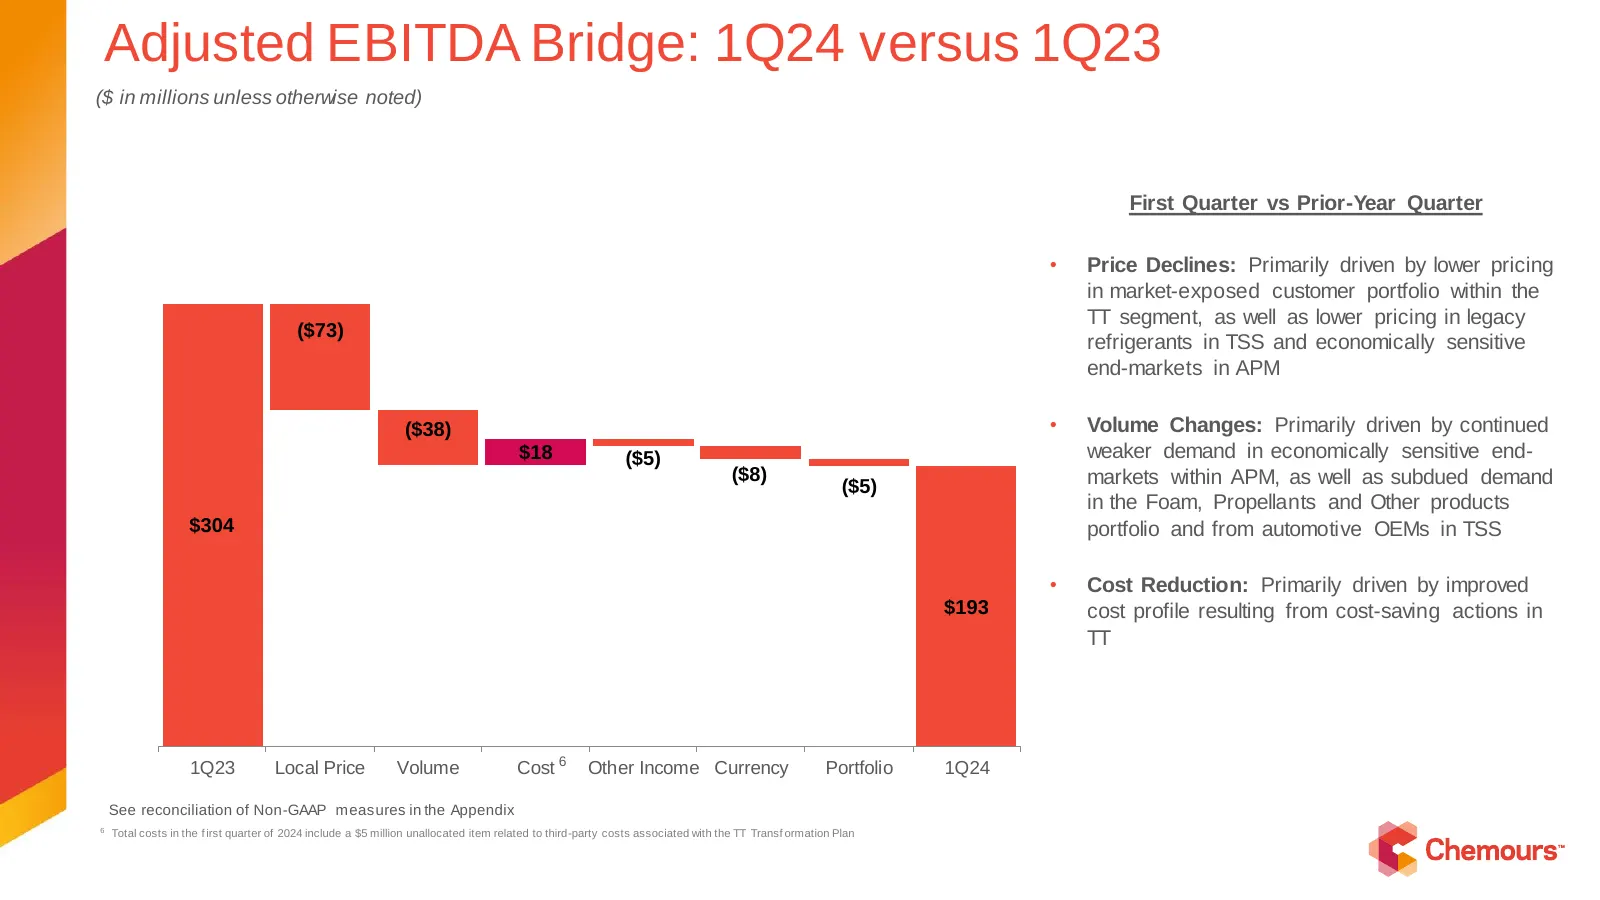
Adjusted Adjusted EBITDA EBITDA Bridge: Bridge: 1Q24 versus 4Q22versus 4Q21 1Q23 ($ in millions unless otherwise noted) First Quarter vs Prior-Year Quarter • Price Declines: Primarily driven by lower pricing in market-exposed customer portfolio within the TT segment, as well as lower pricing in lega
Slide 5: Liquidity Position as of March 31, 2024
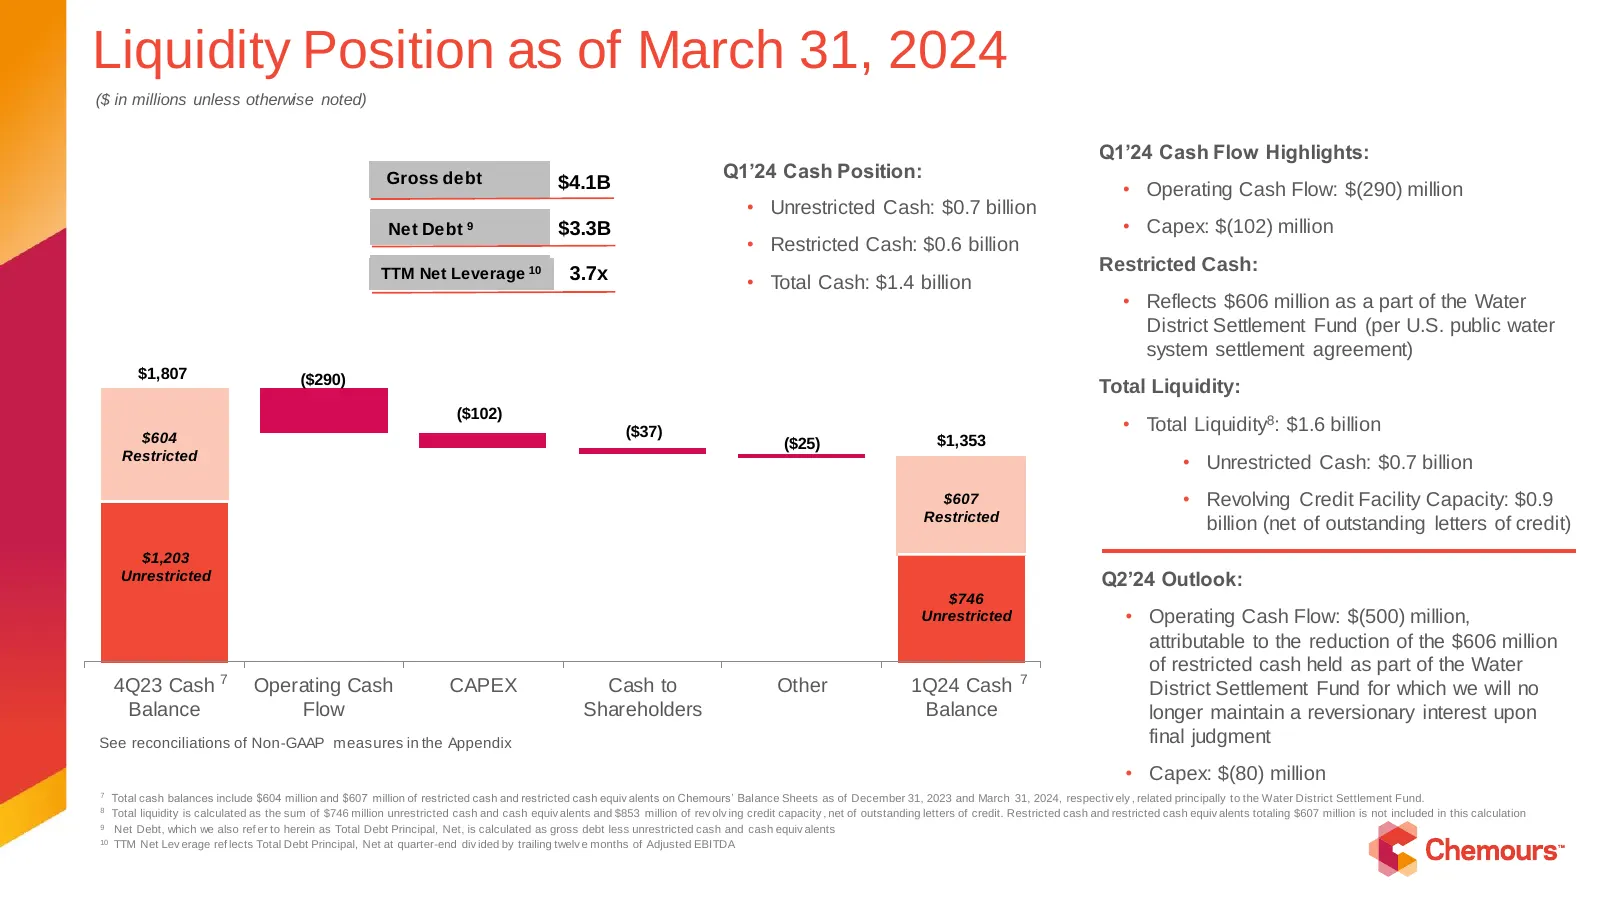
Liquidity Position as of March 31, 2024 Liquidity Position Adjusted EBITDA Bridge: 4Q22 versus 4Q21 ($ in millions unless otherwise noted) Q1’24 Cash Flow Highlights: Gross debt Q1’24 Cash Position: $4.1B • Operating Cash Flow: $(290) million • Unrestricted Cash: $0.7 billion Net Debt 9 $3.3B • Cape

Slide 6: Segment Performance
Segment Performance
Slide 7: Titanium Technologies (TT) Business Summary
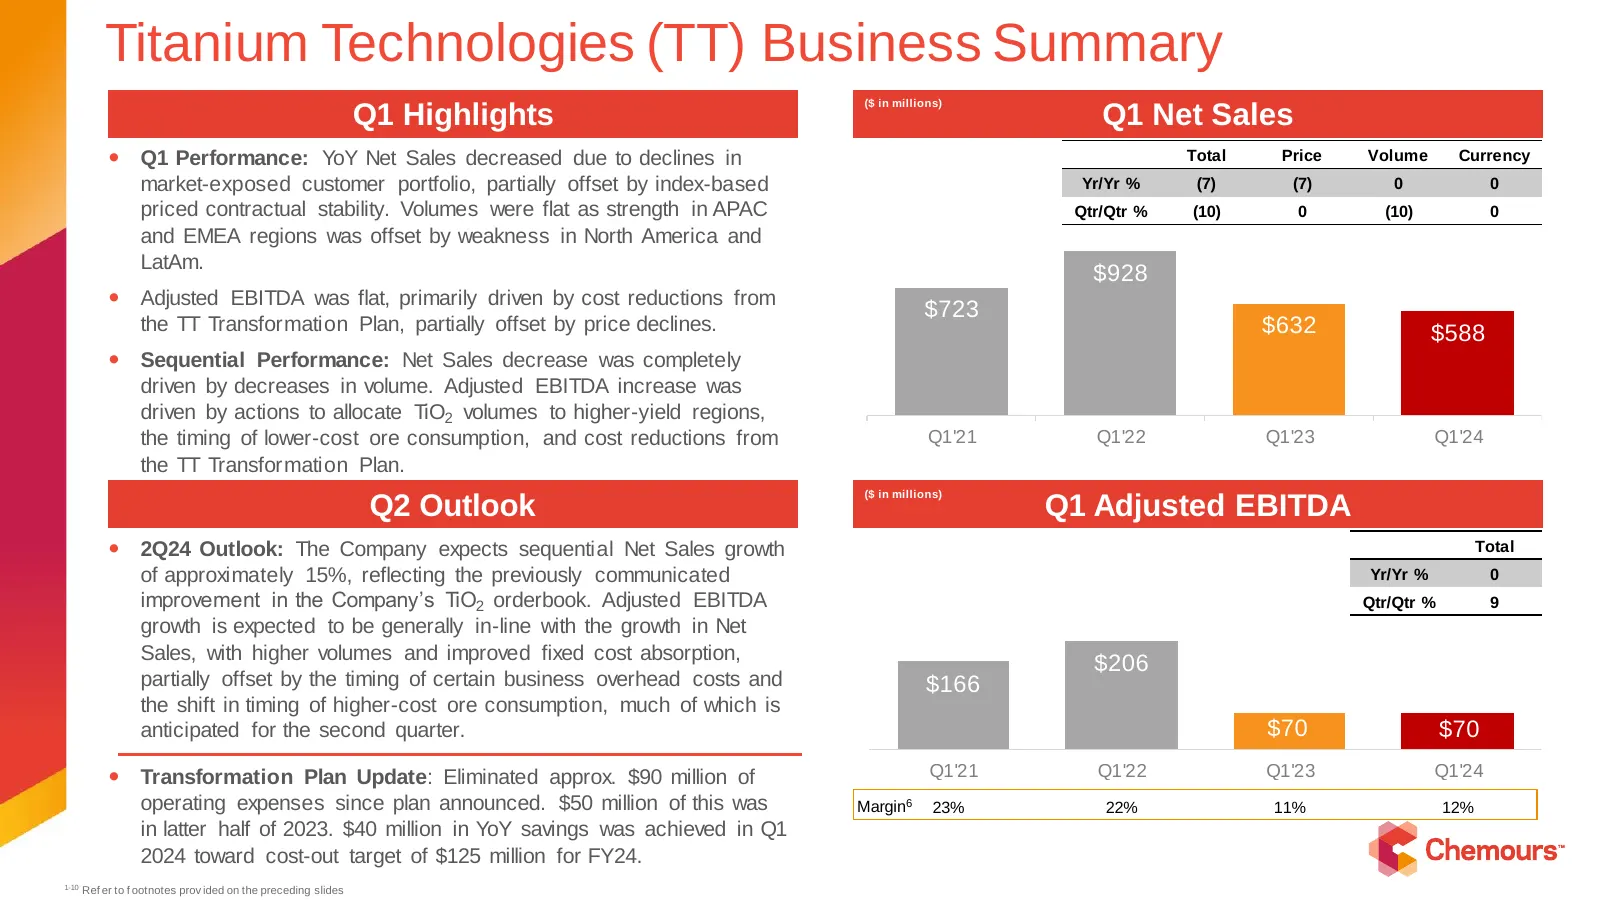
Titanium Technologies (TT) Business Summary ($ in millions) Q1 Highlights Q1 Net Sales Q1 Performance: YoY Net Sales decreased due to declines in Total Price Volume Currency market-exposed customer portfolio, partially offset by index-based Yr/Yr % (7) (7) 0 0 priced contractual stability. Volumes
Slide 8: Thermal & Specialized Solutions (TSS) Business Summary
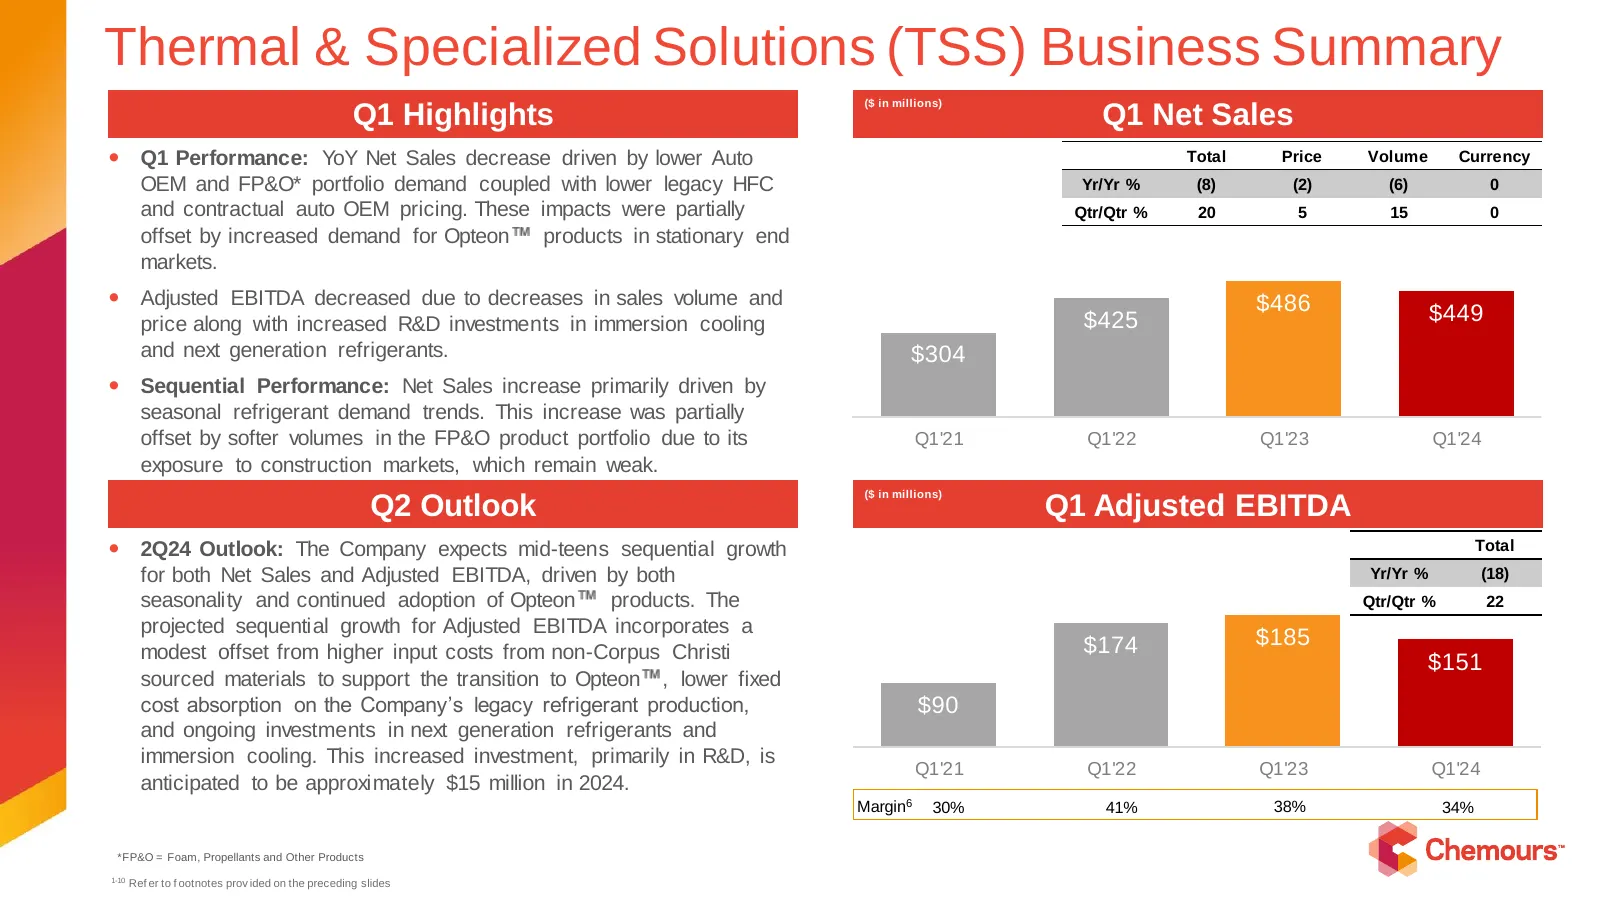
Thermal & Specialized Solutions (TSS) Business Summary ($ ($ in in millions) Q1 Highlights millions) Q1 Net Sales Q1 Performance: YoY Net Sales decrease driven by lower Auto Total Price Volume Currency OEM and FP&O* portfolio demand coupled with lower legacy HFC Yr/Yr % (8) (2) (6) 0 and contractu
Slide 9: Thermal & Specialized Solutions – Business Summary
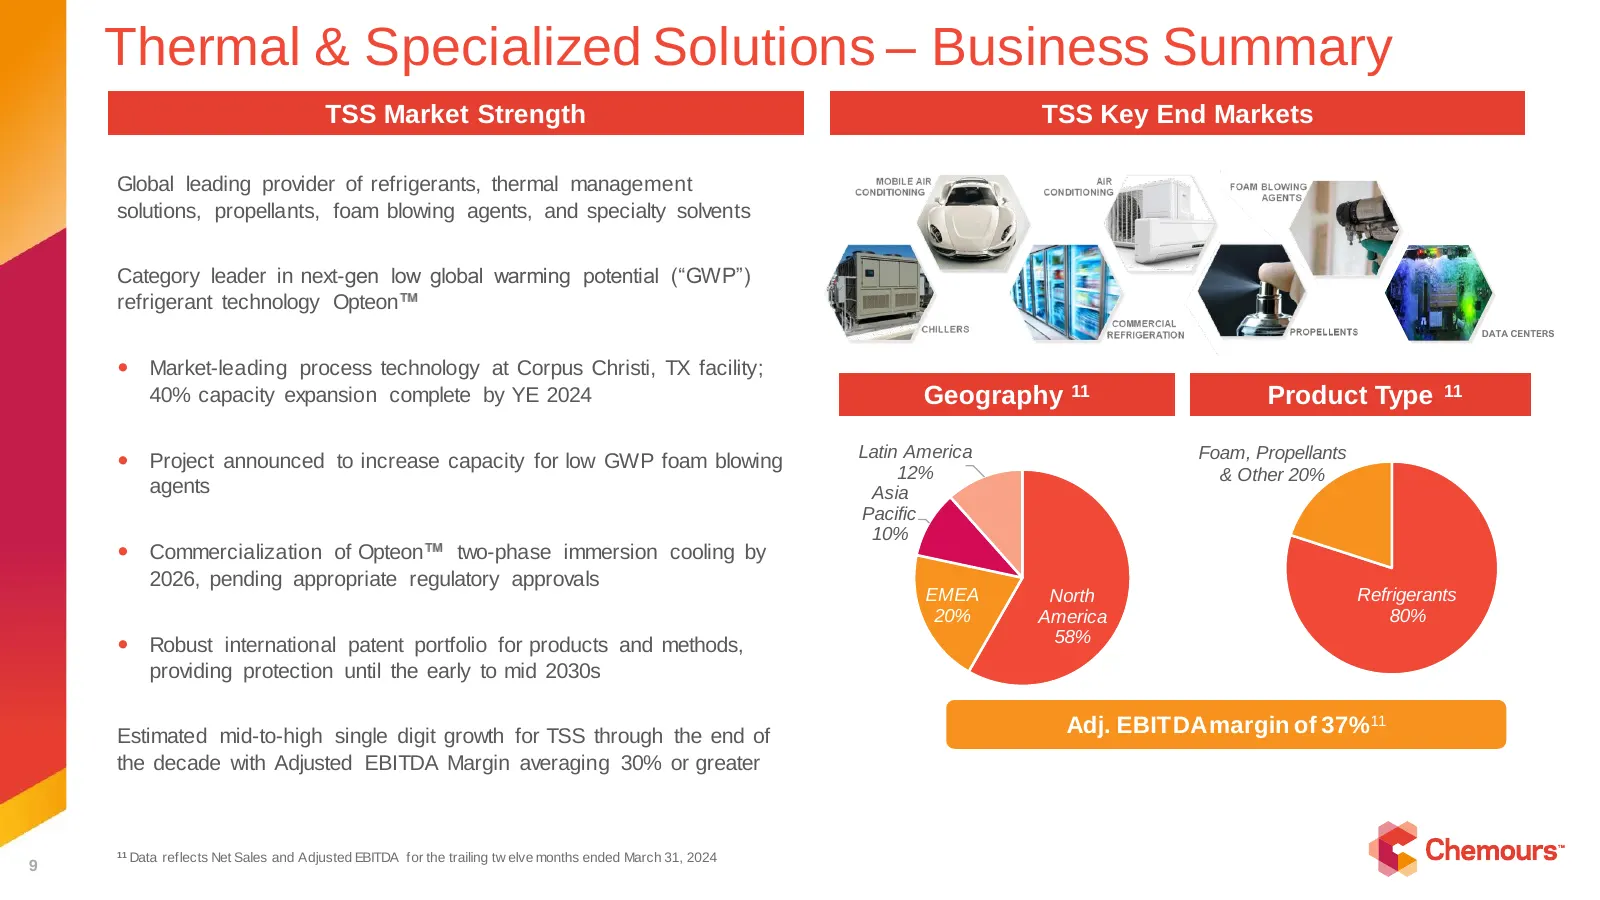
Thermal & Specialized Solutions – Business Summary TSS Market Strength TSS Key End Markets Global leading provider of refrigerants, thermal management solutions, propellants, foam blowing agents, and specialty solvents Category leader in next-gen low global warming potential (“GWP”) refrigerant tech
Slide 10: Two-Phased Data Center Immersion Cooling with Opteon
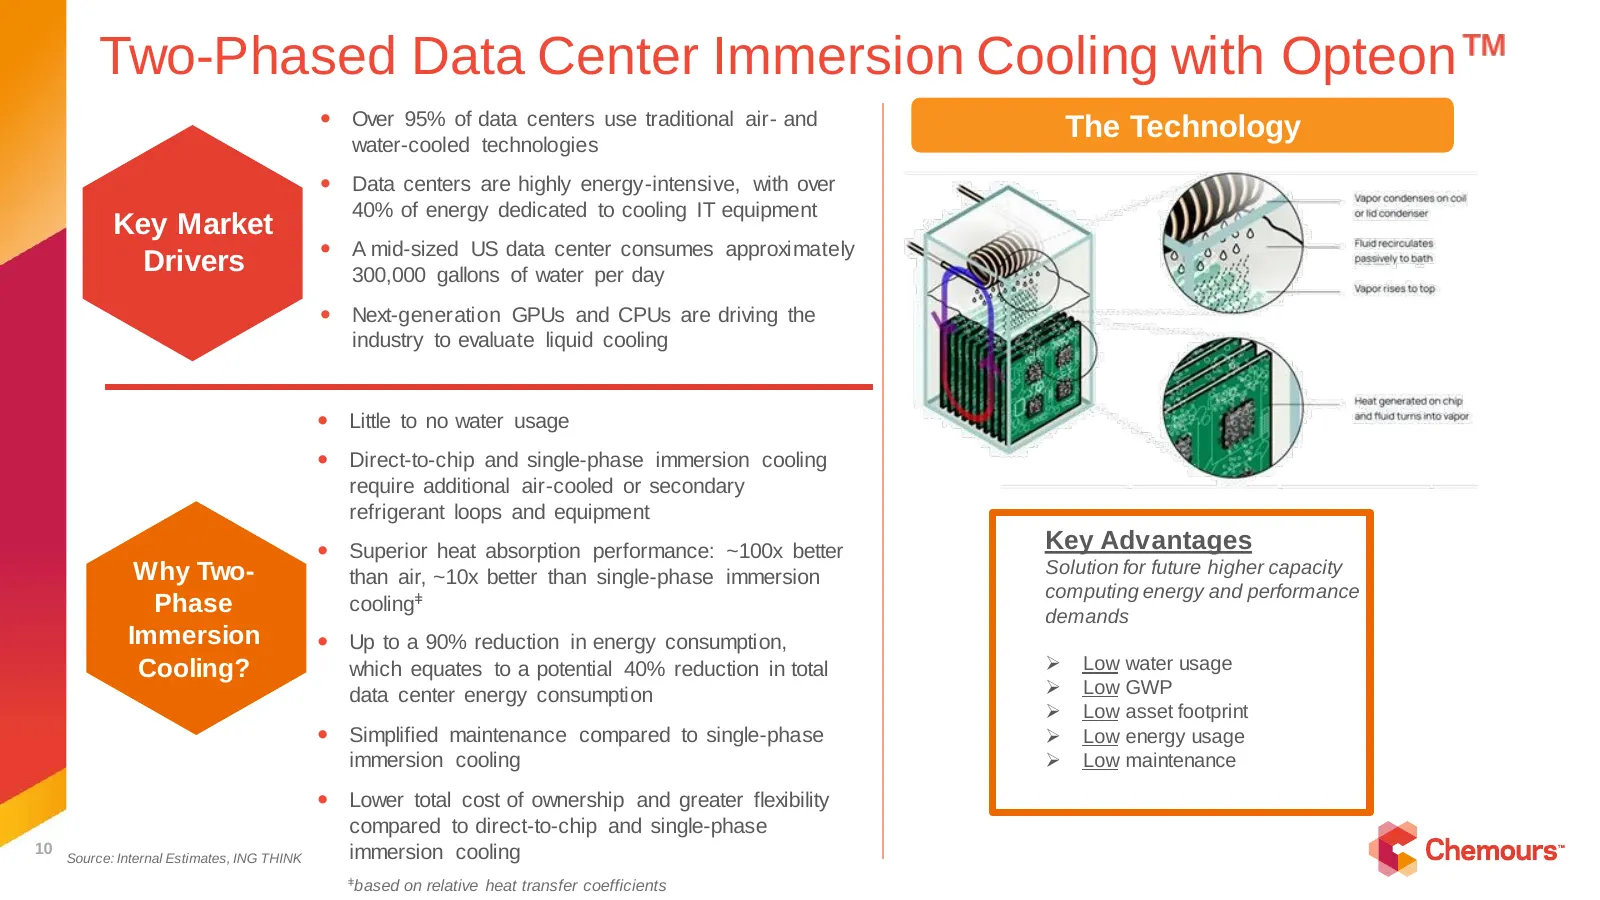
Two-Phased Data Center Immersion Cooling with Opteon Over 95% of data centers use traditional air- and water-cooled technologies The Technology Data centers are highly energy-intensive, with over 40% of energy dedicated to cooling IT equipment Key Market A mid-sized US data center consumes app
Slide 11: Advanced Performance Materials (APM) Business Summary
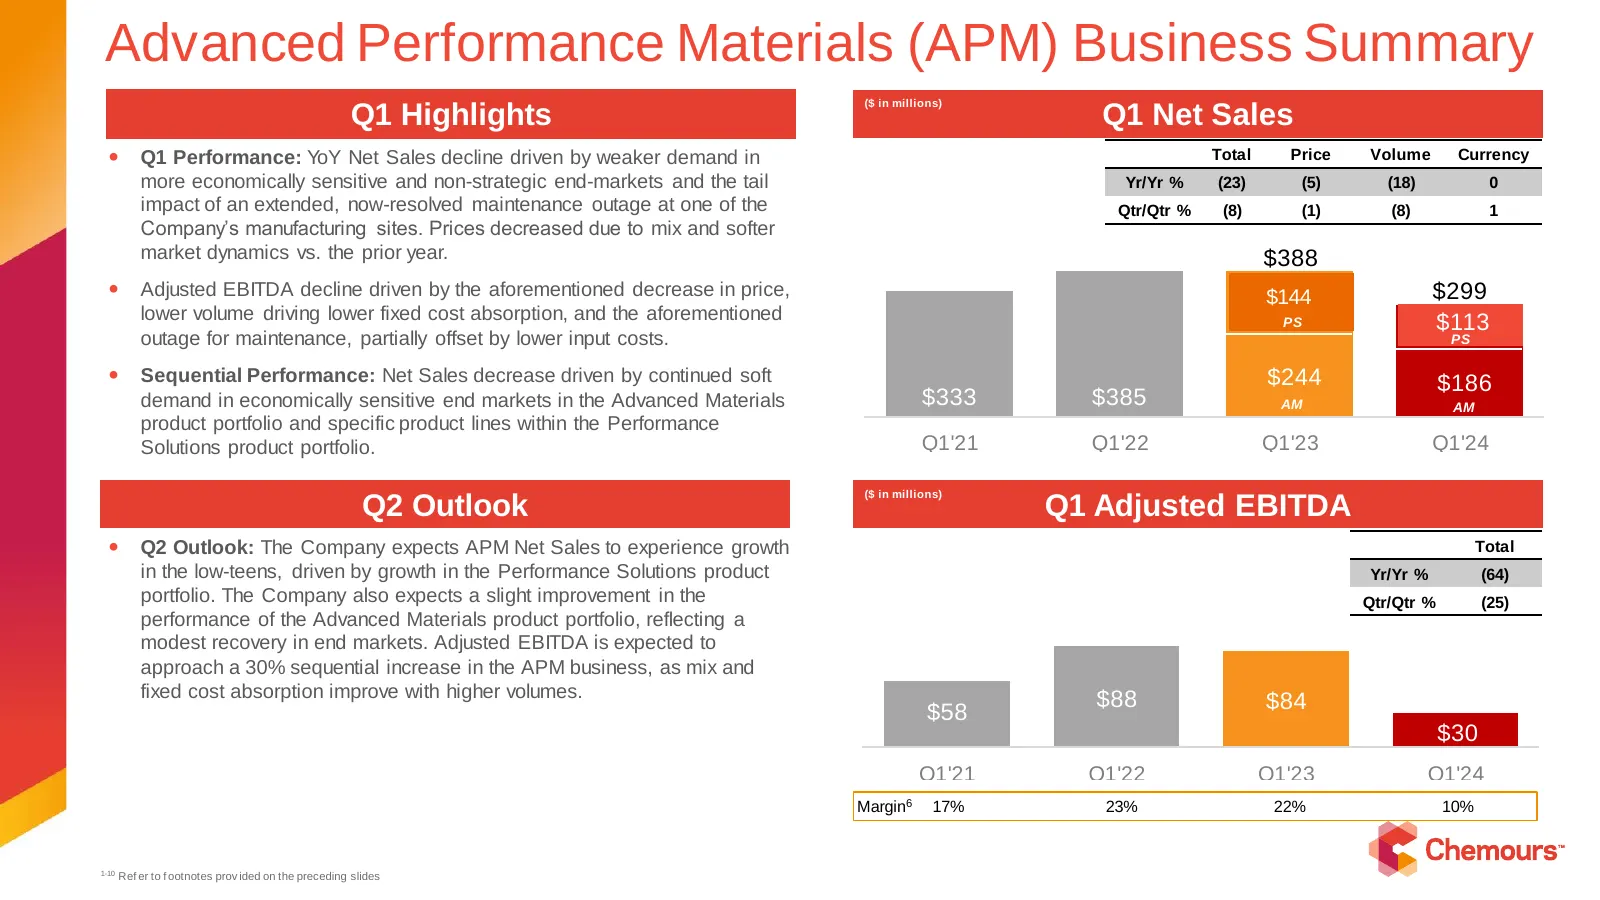
Advanced Performance Materials (APM) Business Summary ($ in millions) Q1 Highlights Q1 Net Sales Q1 Performance: YoY Net Sales decline driven by weaker demand in Total Price Volume Currency more economically sensitive and non-strategic end-markets and the tail Yr/Yr % (23) (5) (18) 0 impact of an

Slide 12: Appendix
Appendix
Slide 13: Segment Net Sales and Adjusted EBITDA (Unaudited)
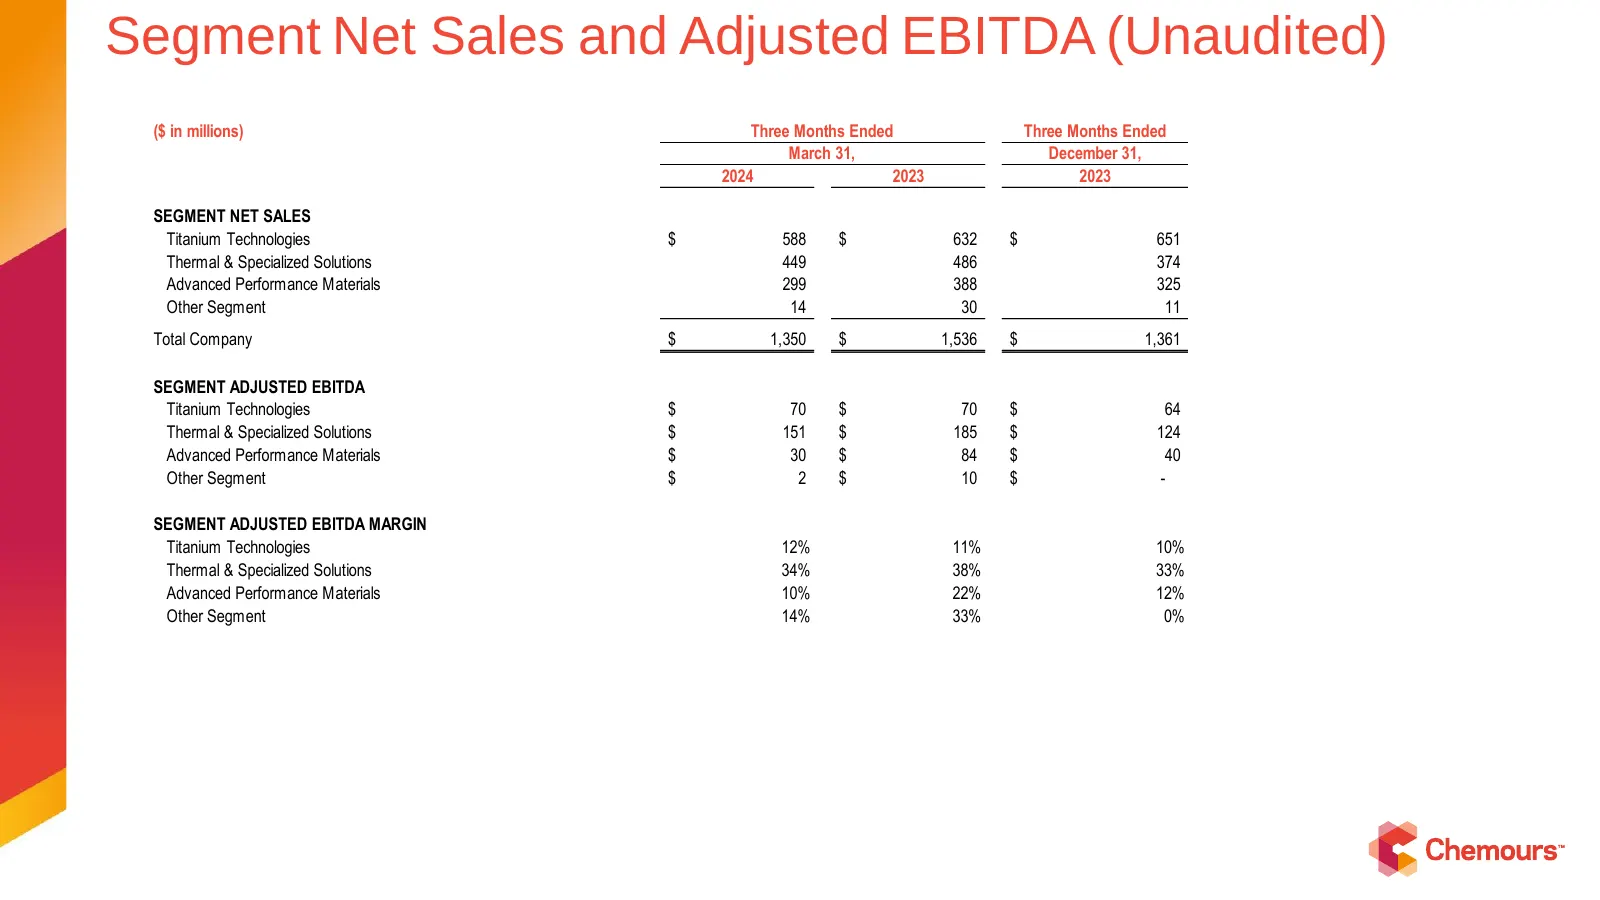
Segment Net Sales and Adjusted EBITDA (Unaudited) ($ in millions) Three Months Ended Three Months Ended March 31, December 31, 2024 2023 2023 SEGMENT NET SALES Titanium Technologies $ 588 $ 632 $ 651 Thermal & Specialized Solutions 449 486 374 Advanced Performance Materials 299 388 325 Other Segment
Slide 14: GAAP Net Income to Adjusted Net Income, Adjusted EBITDA Reconciliation (Page 1/2)
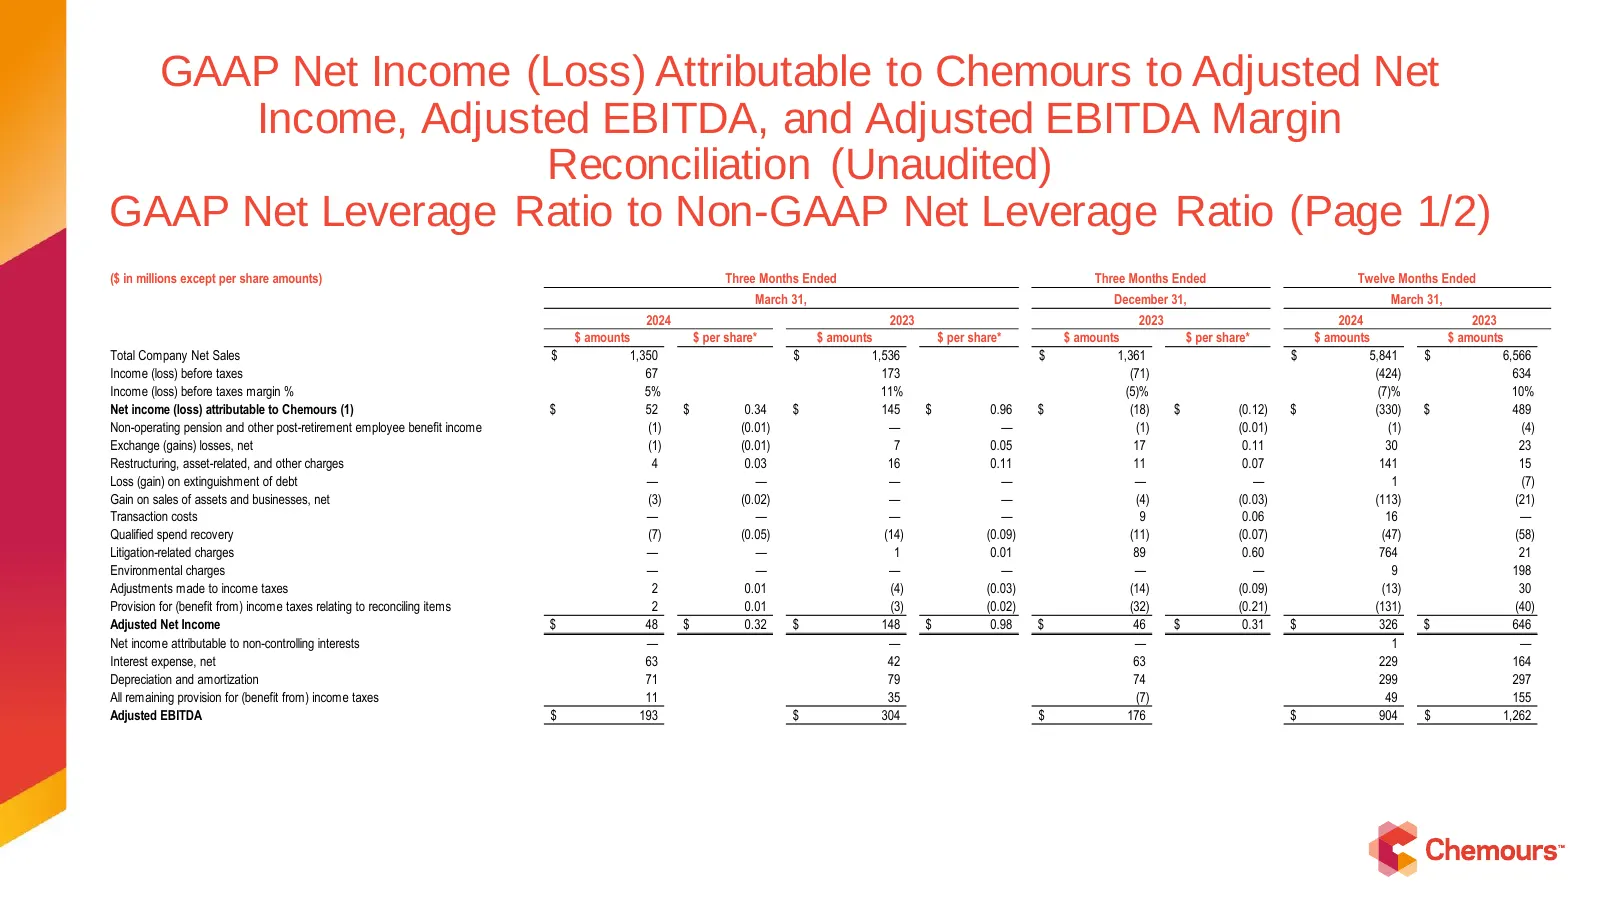
GAAP Net Income (Loss) Attributable to Chemours to Adjusted Net Income, Adjusted EBITDA, and Adjusted EBITDA Margin Reconciliation (Unaudited) GAAP Net Leverage Ratio to Non-GAAP Net Leverage Ratio (Page 1/2) ($ in millions except per share amounts) Three Months Ended Three Months Ended Twelve Month
Slide 15: GAAP Net Income to Adjusted Net Income, Adjusted EBITDA Reconciliation (Page 2/2)
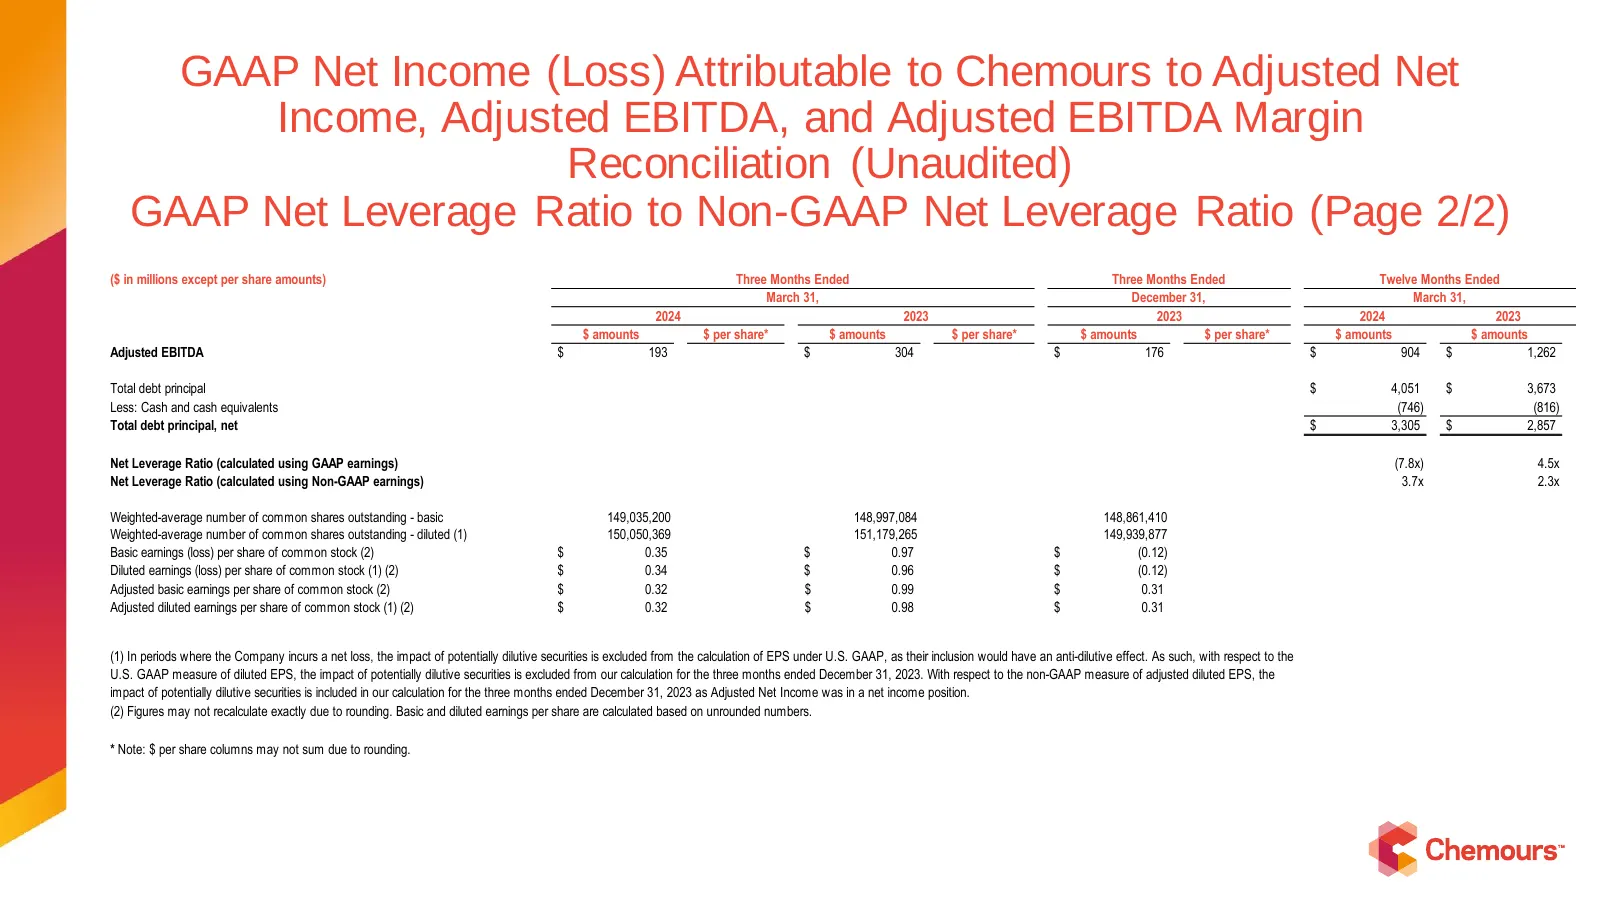
GAAP Net Income (Loss) Attributable to Chemours to Adjusted Net Income, Adjusted EBITDA, and Adjusted EBITDA Margin Reconciliation (Unaudited) GAAP Net Leverage Ratio to Non-GAAP Net Leverage Ratio (Page 2/2) ($ in millions except per share amounts) Three Months Ended Three Months Ended Twelve Month

Slide 16: Thank you!
Thank you!
Source: 6ix earnings call
More decks from Chemours Company (the)
 Q3 2026 Earnings Presentation27 slides · Nov 3, 2026
 Investor Presentation (September 2026)34 slides · Sep 9, 2026
 The Chemours Company — Investor Presentation (September 2026)34 slides · September 2026
 The Chemours Company — Q2 2026 Earnings Presentation26 slides · Aug 5, 2026
 Q1 2026 Earnings Presentation24 slides · May 6, 2026
 The Chemours Company — Technical Presentation (April 2026)54 slides · Apr 13, 2026