Archstone Smith Trust — NAREIT November 2004
52 slides from Archstone Smith Trust's conference presentation, Nov 17, 2004

Slide 1: Archstone-Smith NAREIT November 2004
Table of Contents Exhibit 99.1 Archstone-Smith NAREIT November 2004 1
Slide 2: Safe harbor language
Table of Contents Safe harbor language In addition to historical information, this presentation contains forward-looking statements and information under the federal securities law. These statements are based on current expectations, estimates and projections about the industry and markets in which

Slide 3: Archstone-Smith profile
Table of Contents Archstone-Smith profile Apartment communities(1) 240 Apartment units(1) 83,400 Equity market capitalization $8.2 billion Total market capitalization $12.3 billion Forbes 200 Global Ranking 956 Top apartment company in Fortune’s Most Admired Companies List (1) Includes operating uni
Slide 4: Total shareholder returns
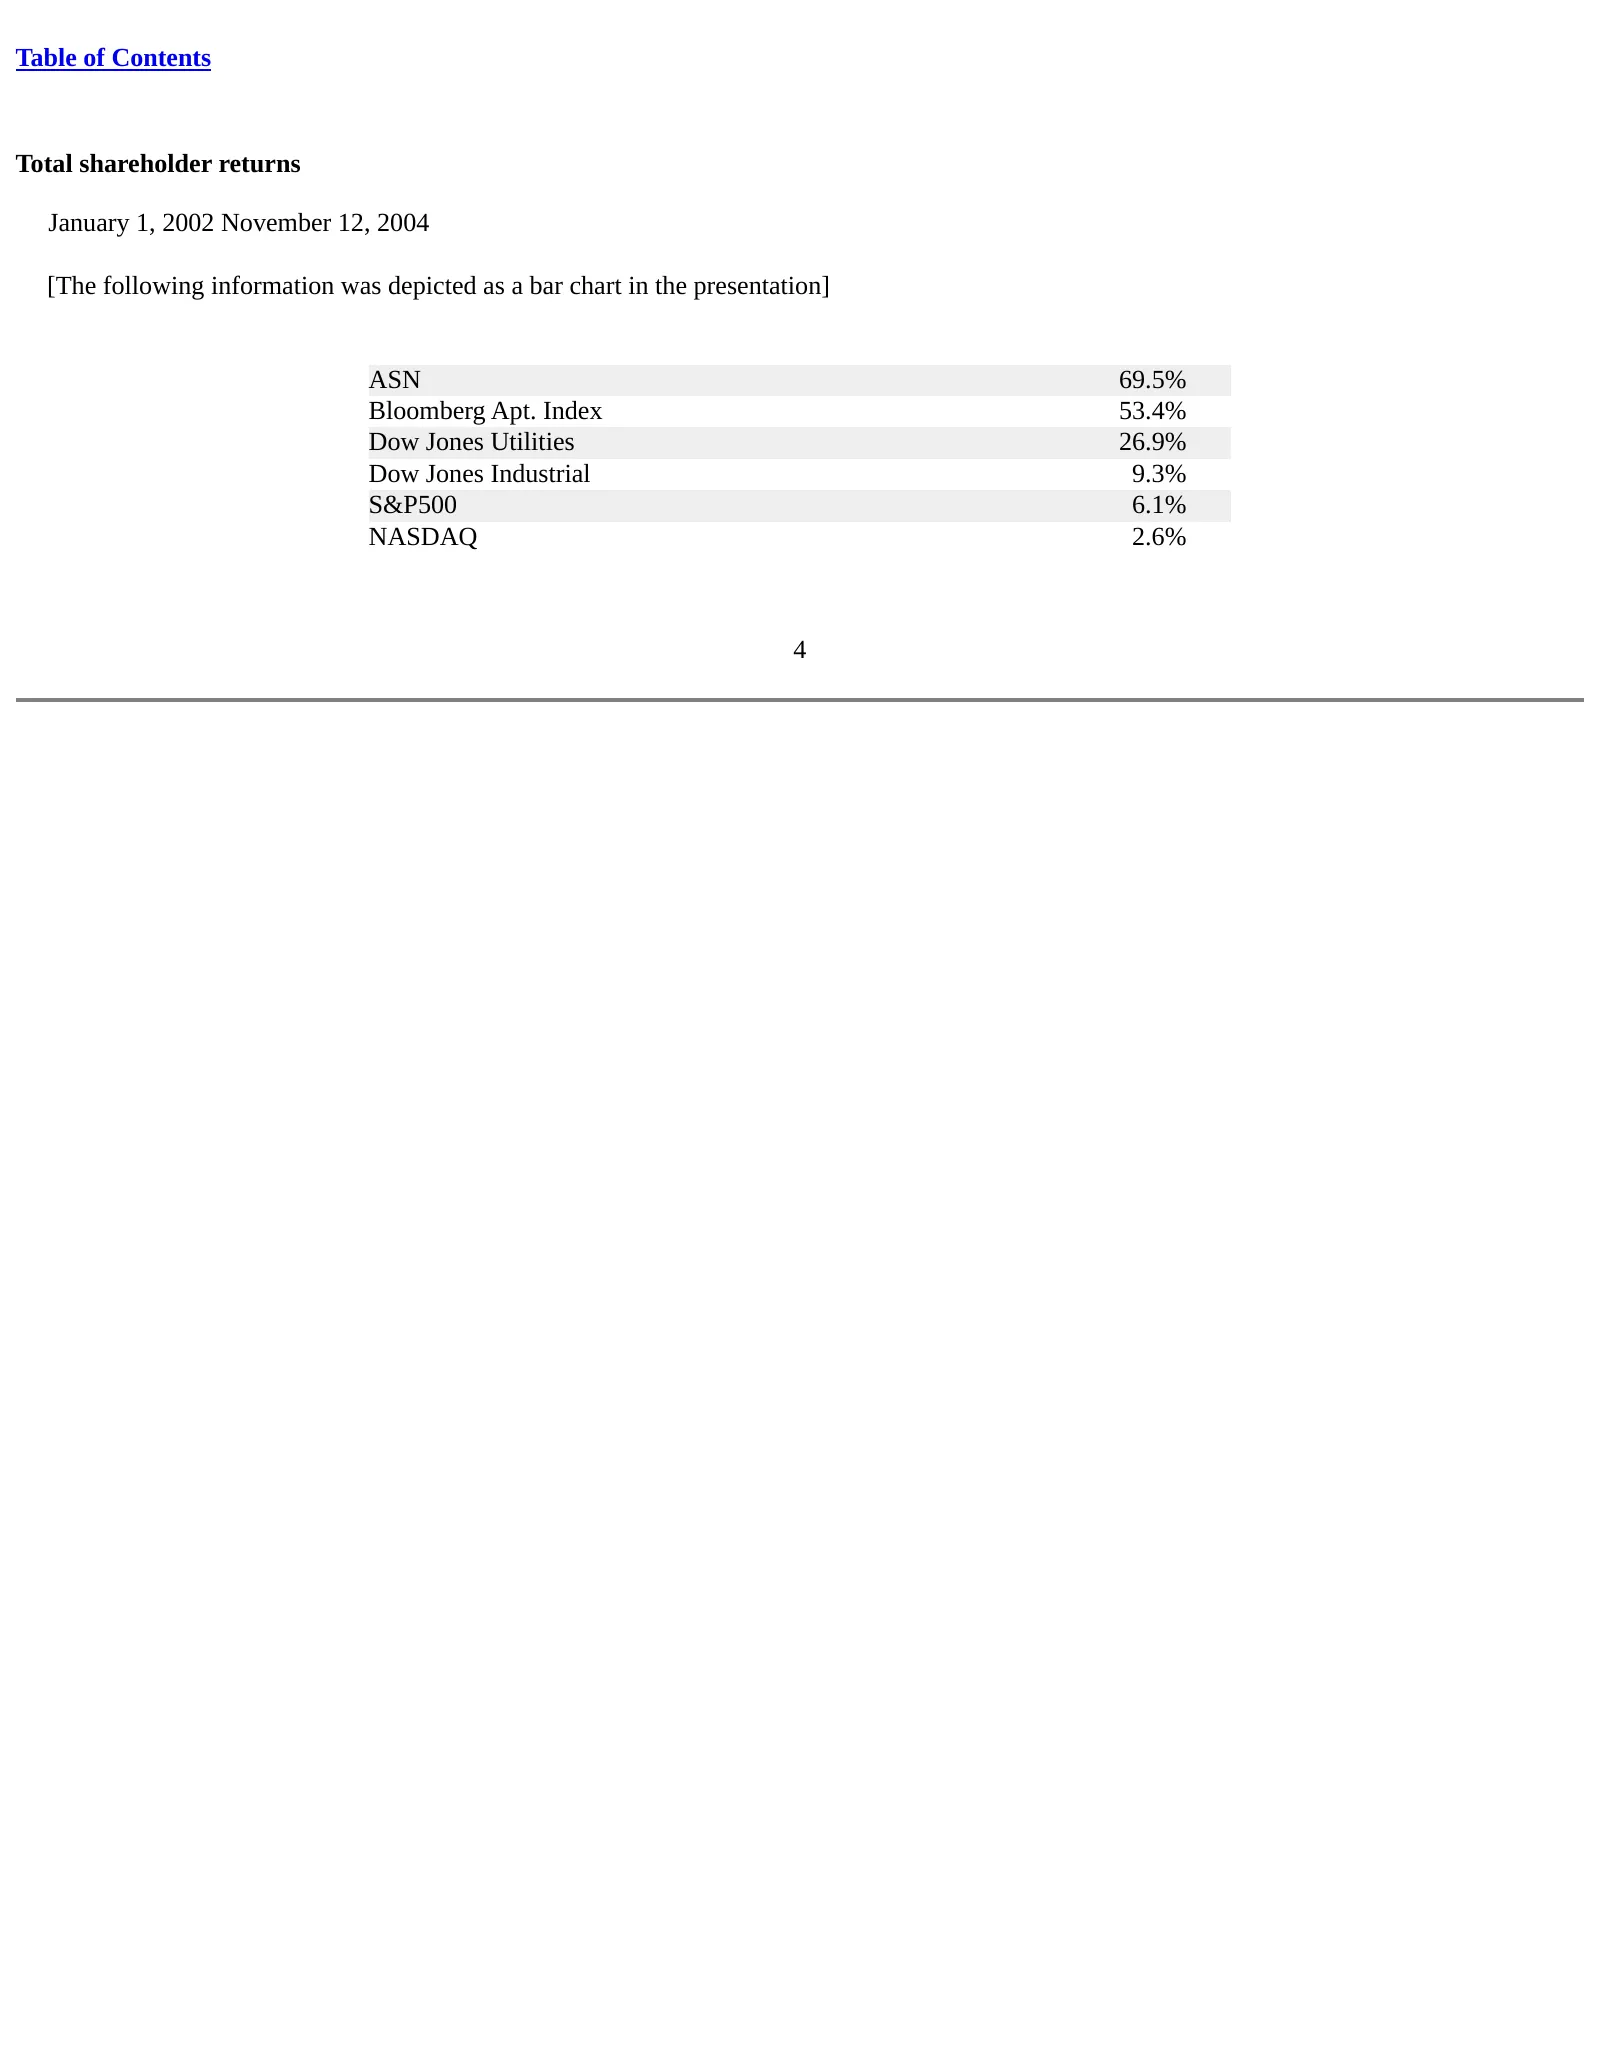
Table of Contents Total shareholder returns January 1, 2002 November 12, 2004 [The following information was depicted as a bar chart in the presentation] ASN 69.5% Bloomberg Apt. Index 53.4% Dow Jones Utilities 26.9% Dow Jones Industrial 9.3% S&P500 6.1% NASDAQ 2.6% 4
Slide 5: Deep and experienced management team
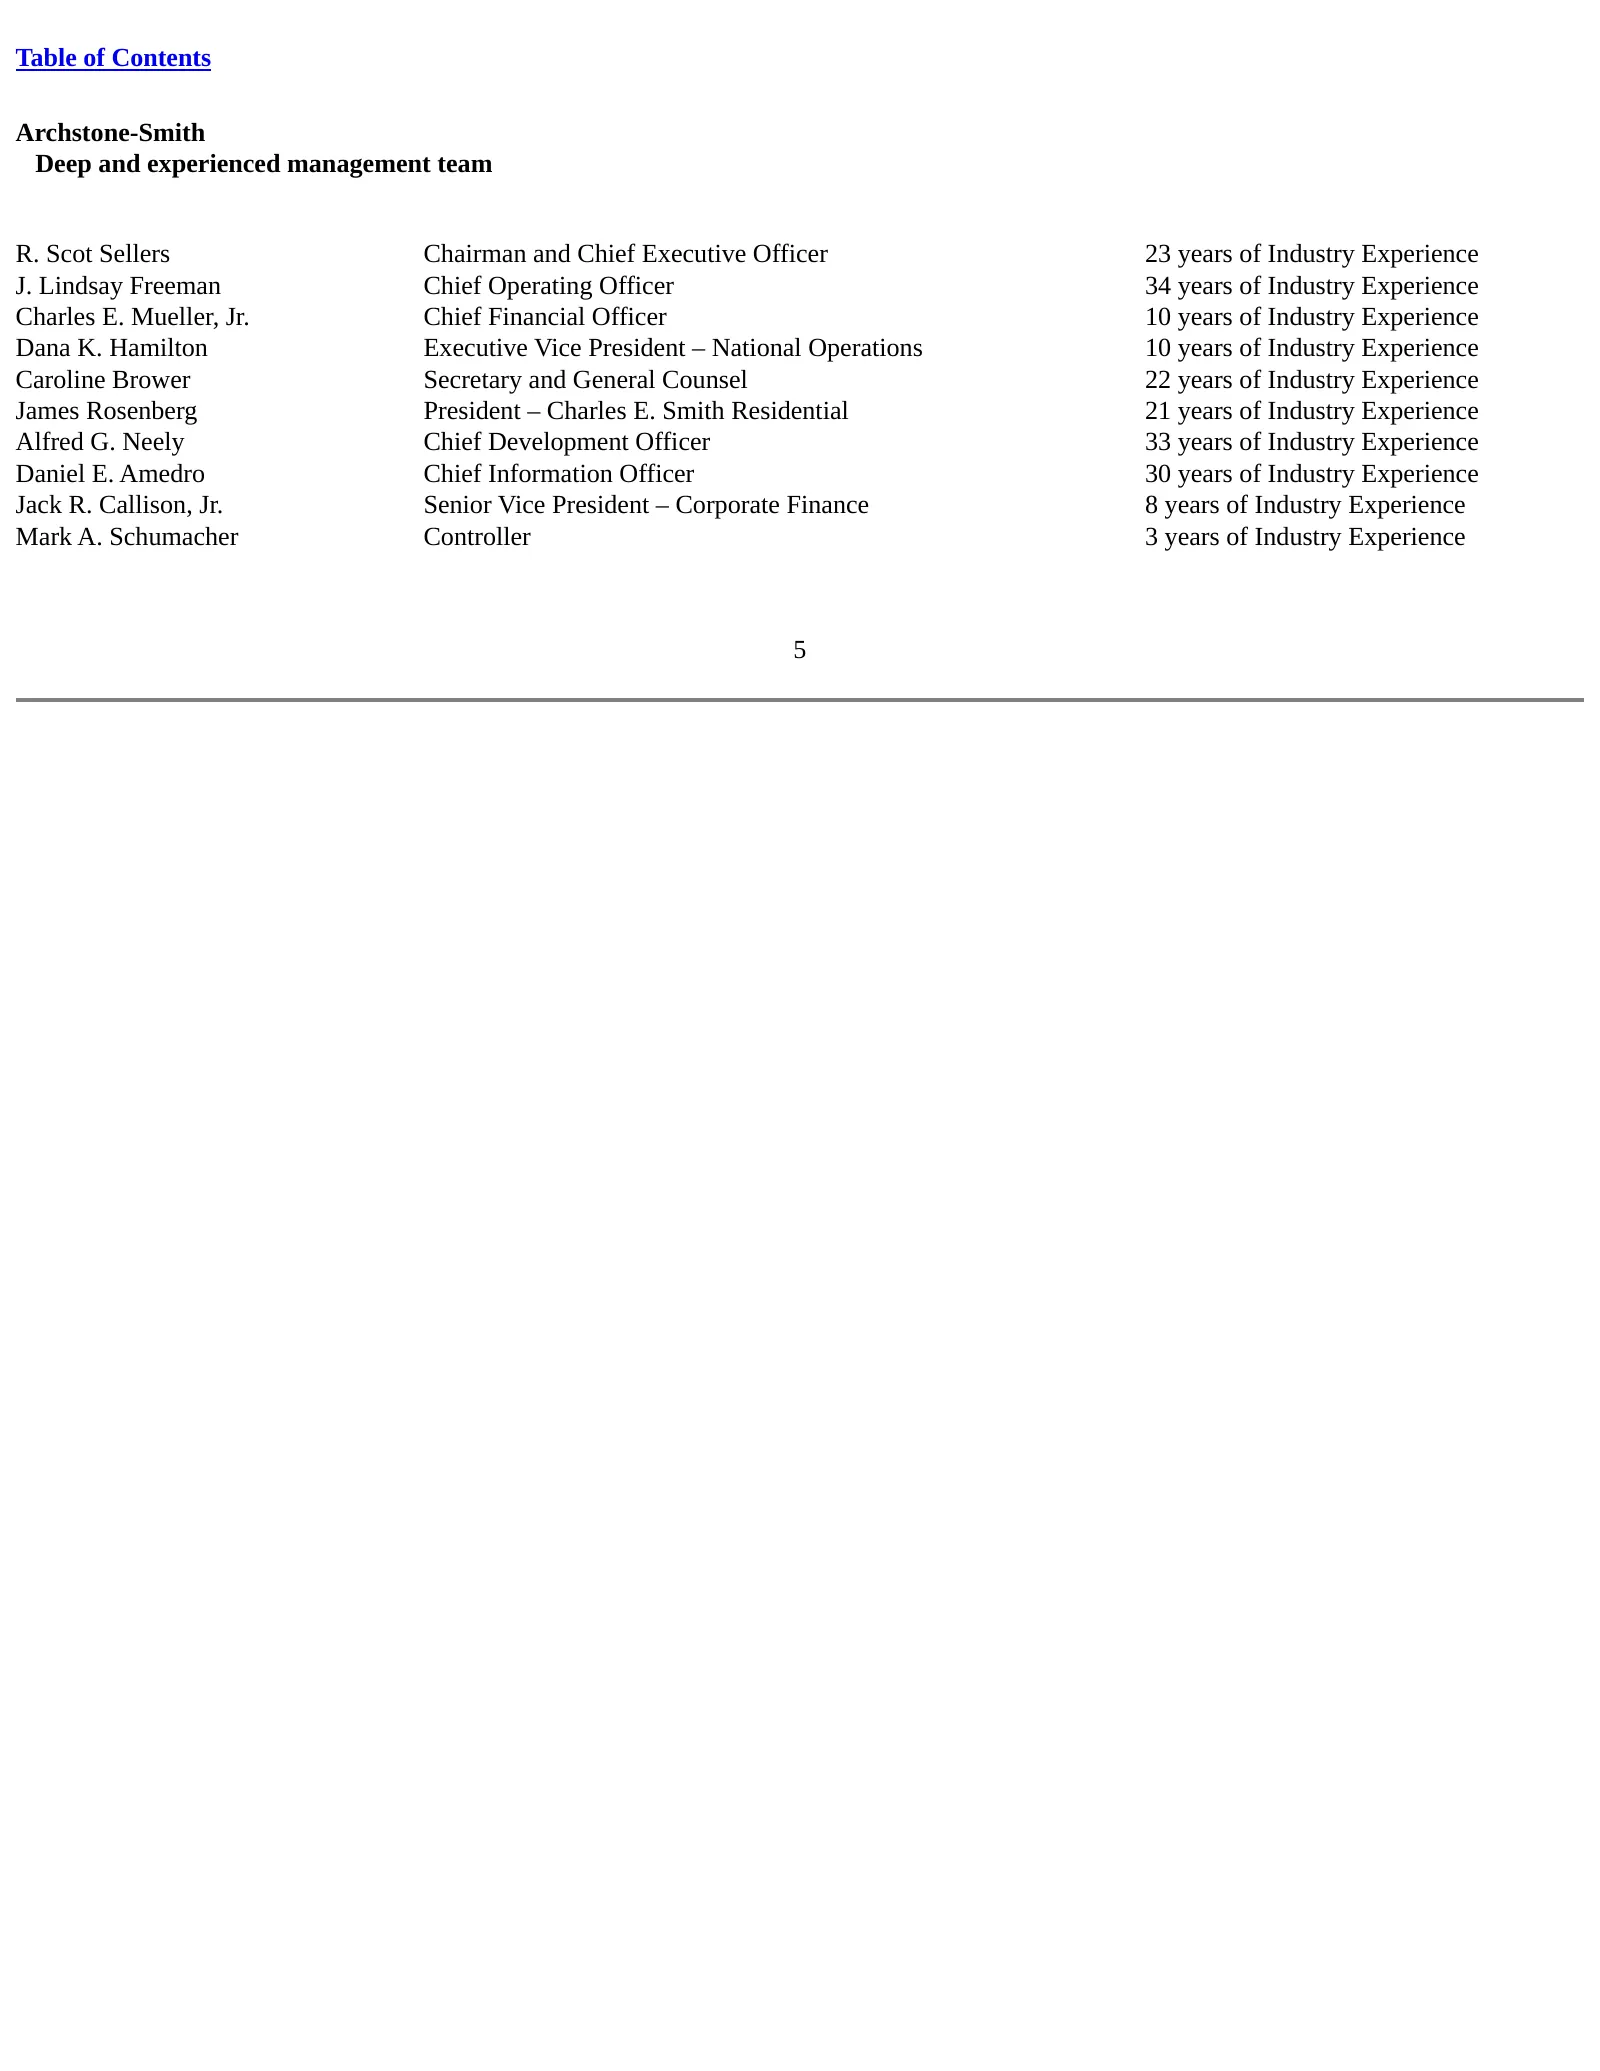
Table of Contents Archstone-Smith Deep and experienced management team R. Scot Sellers Chairman and Chief Executive Officer 23 years of Industry Experience J. Lindsay Freeman Chief Operating Officer 34 years of Industry Experience Charles E. Mueller, Jr. Chief Financial Officer 10 years of Industry
Slide 6: Irreplaceable Portfolio
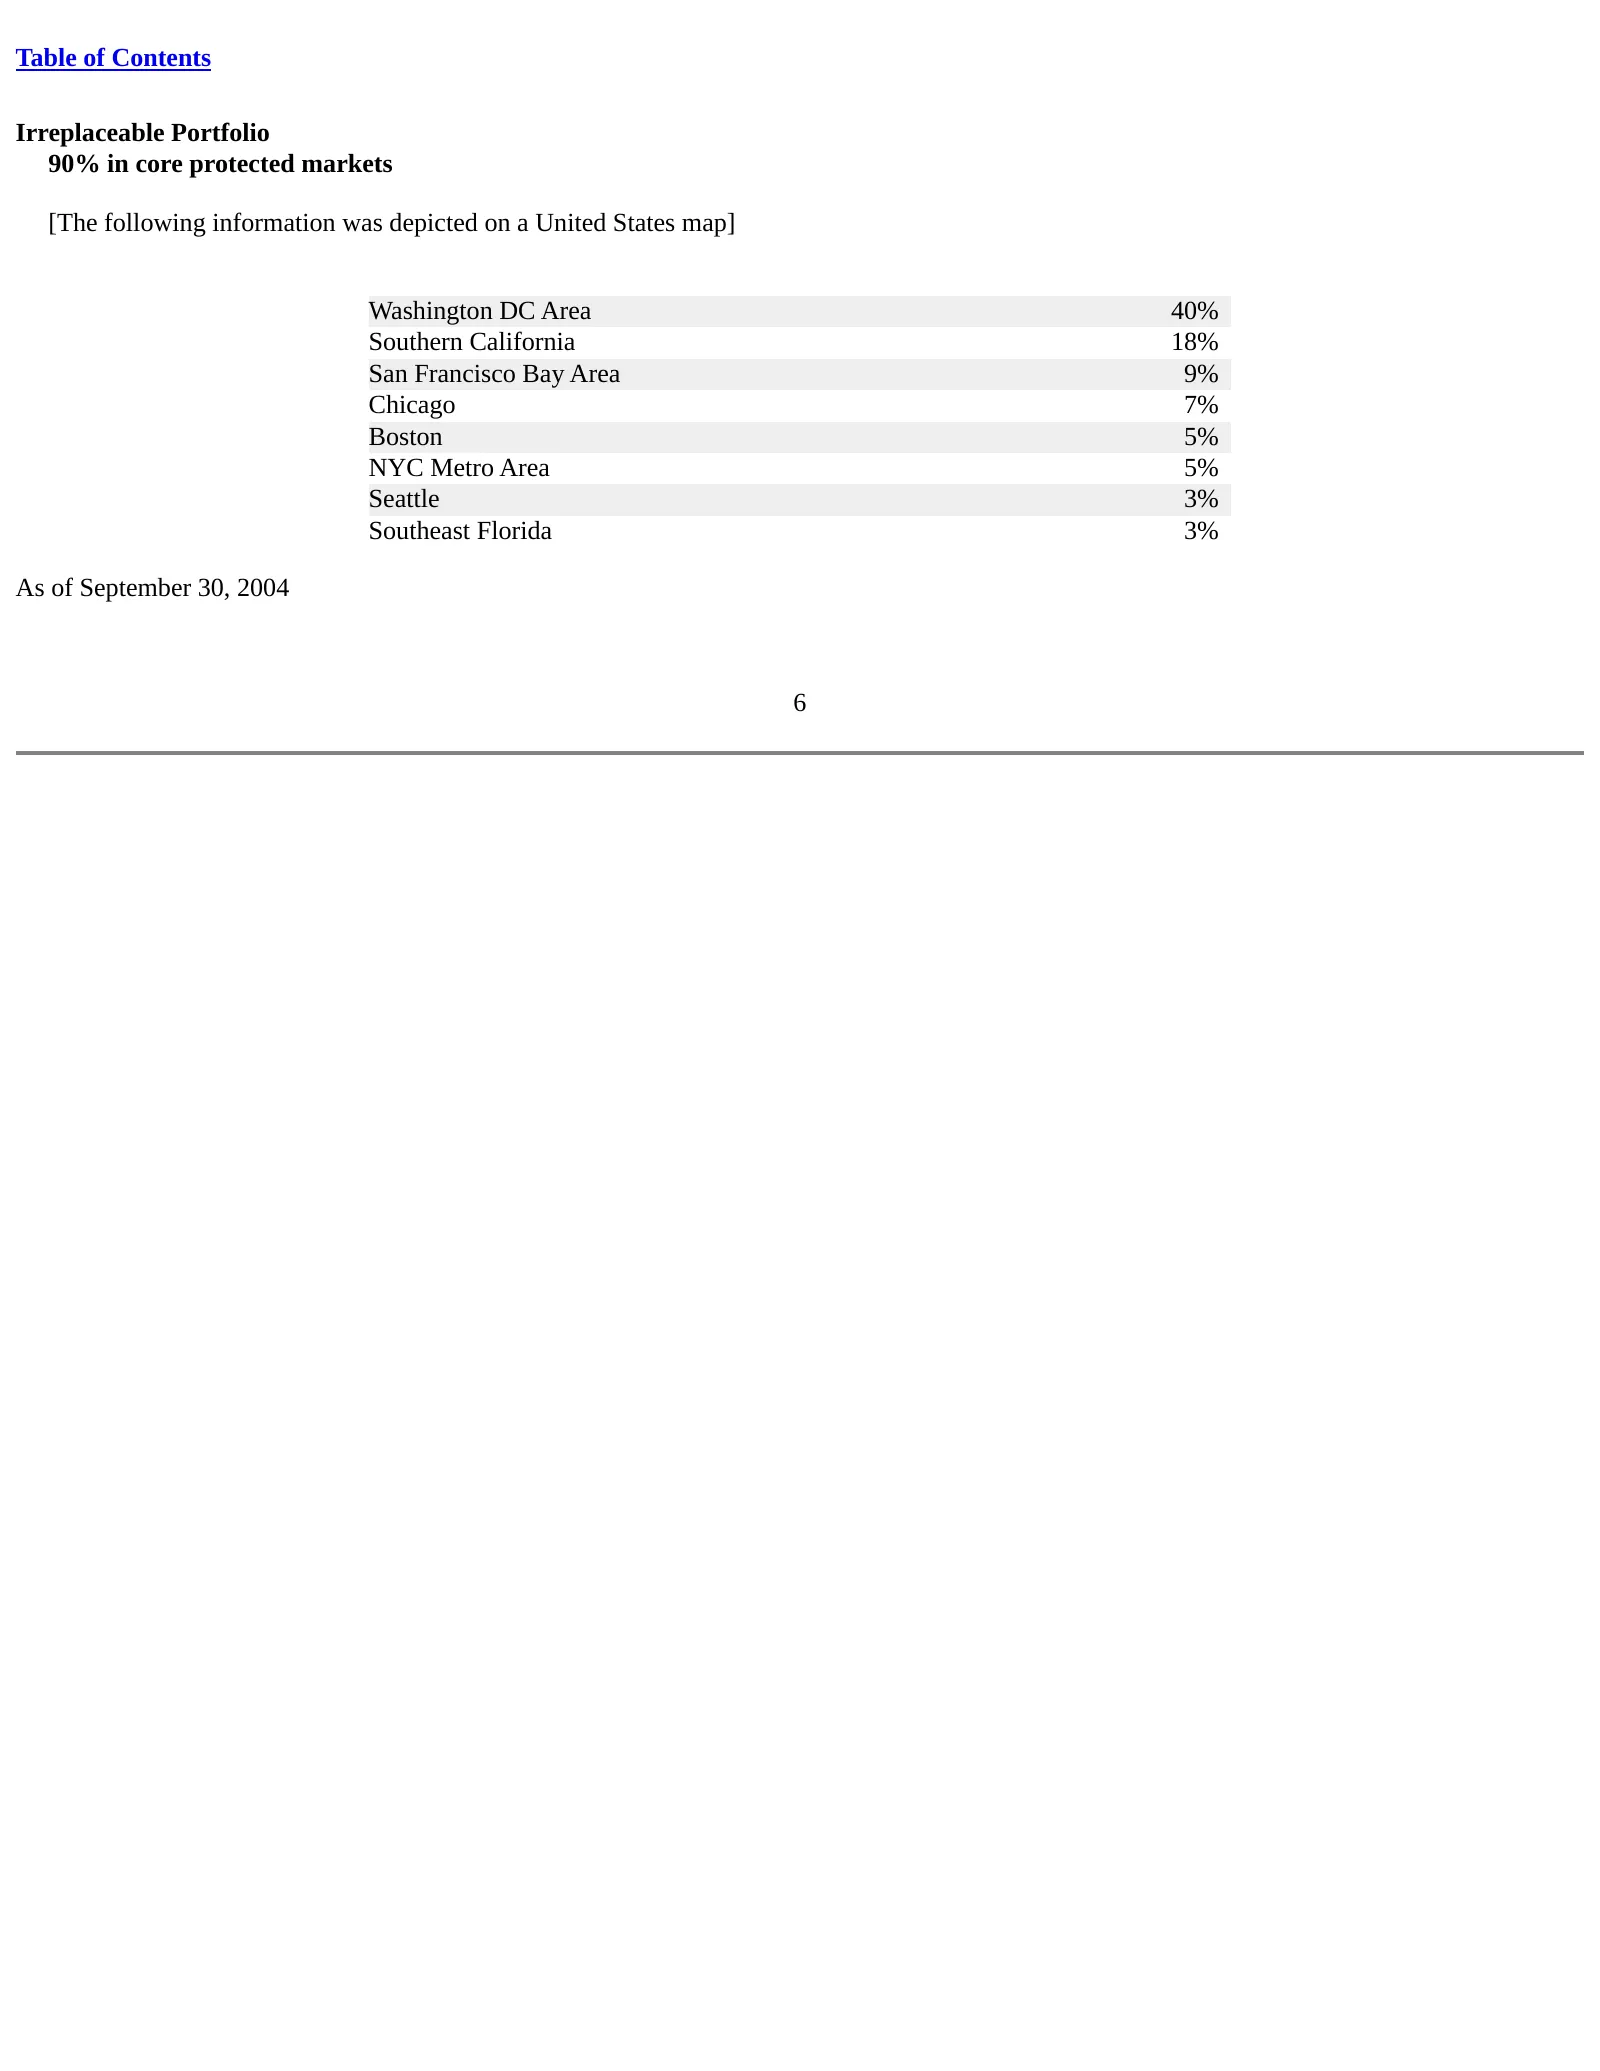
Table of Contents Irreplaceable Portfolio 90% in core protected markets [The following information was depicted on a United States map] Washington DC Area 40% Southern California 18% San Francisco Bay Area 9% Chicago 7% Boston 5% NYC Metro Area 5% Seattle 3% Southeast Florida 3% As of September 30,
Slide 7: Renting vs. owning in our core markets
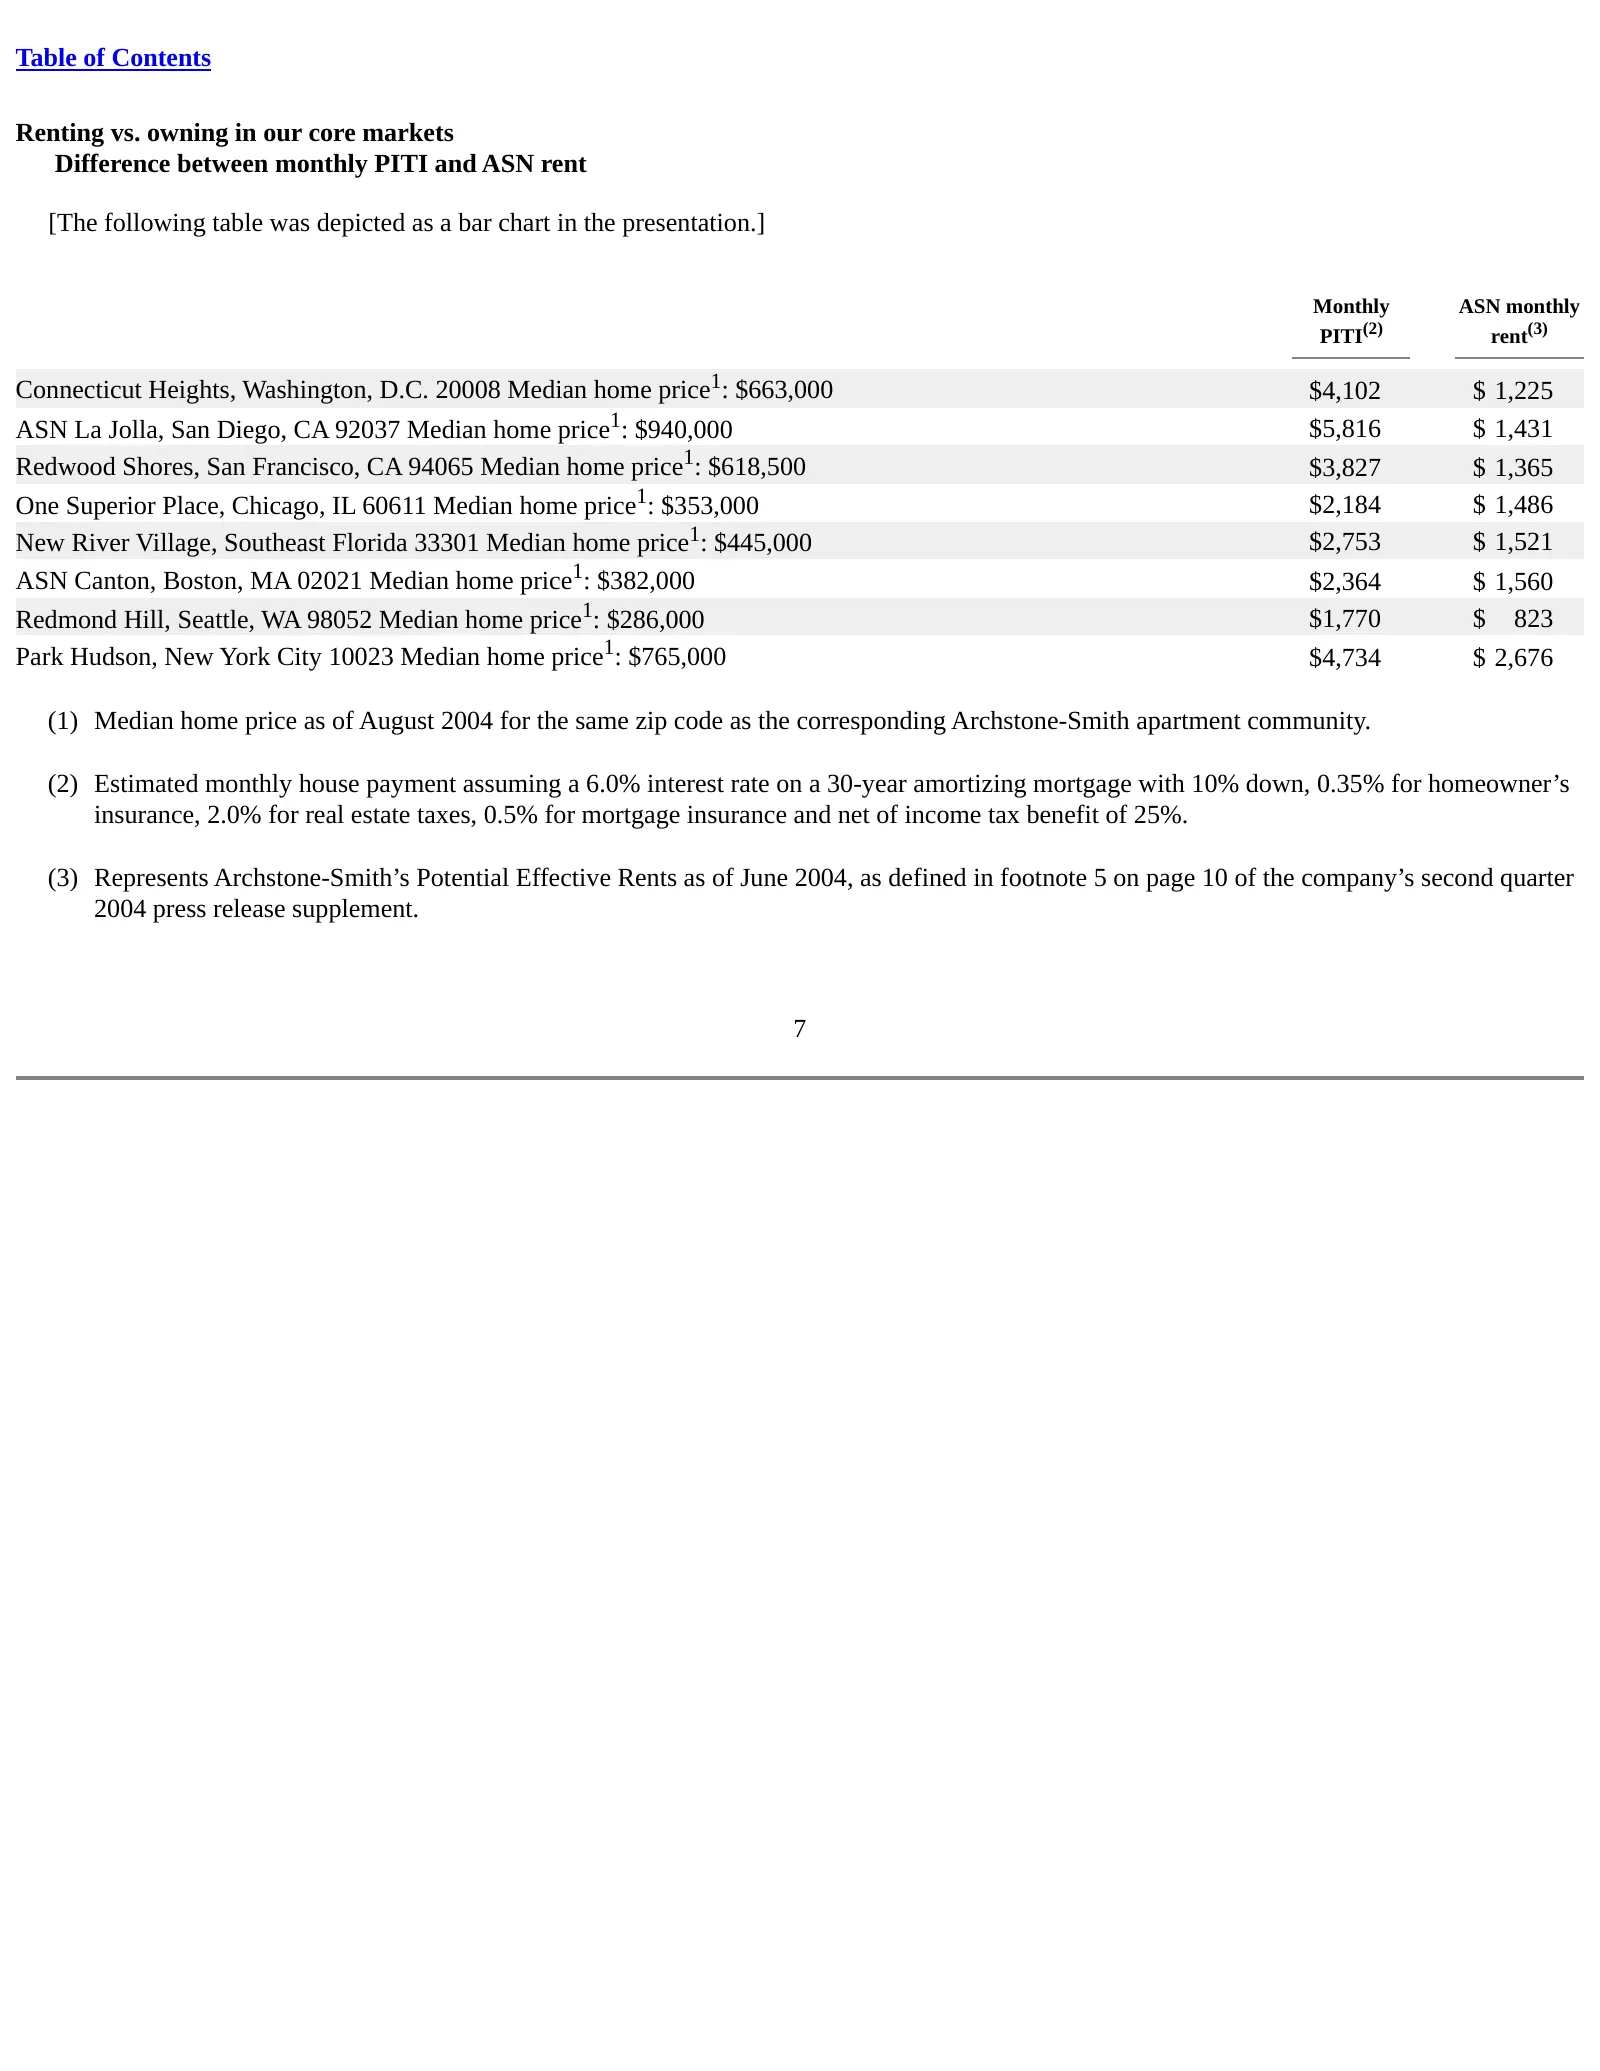
Table of Contents Renting vs. owning in our core markets Difference between monthly PITI and ASN rent [The following table was depicted as a bar chart in the presentation.] Monthly ASN monthly PITI(2) rent(3) Connecticut Heights, Washington, D.C. 20008 Median home price1: $663,000 $4,102 $ 1,225 ASN
Slide 8: Protected markets matter
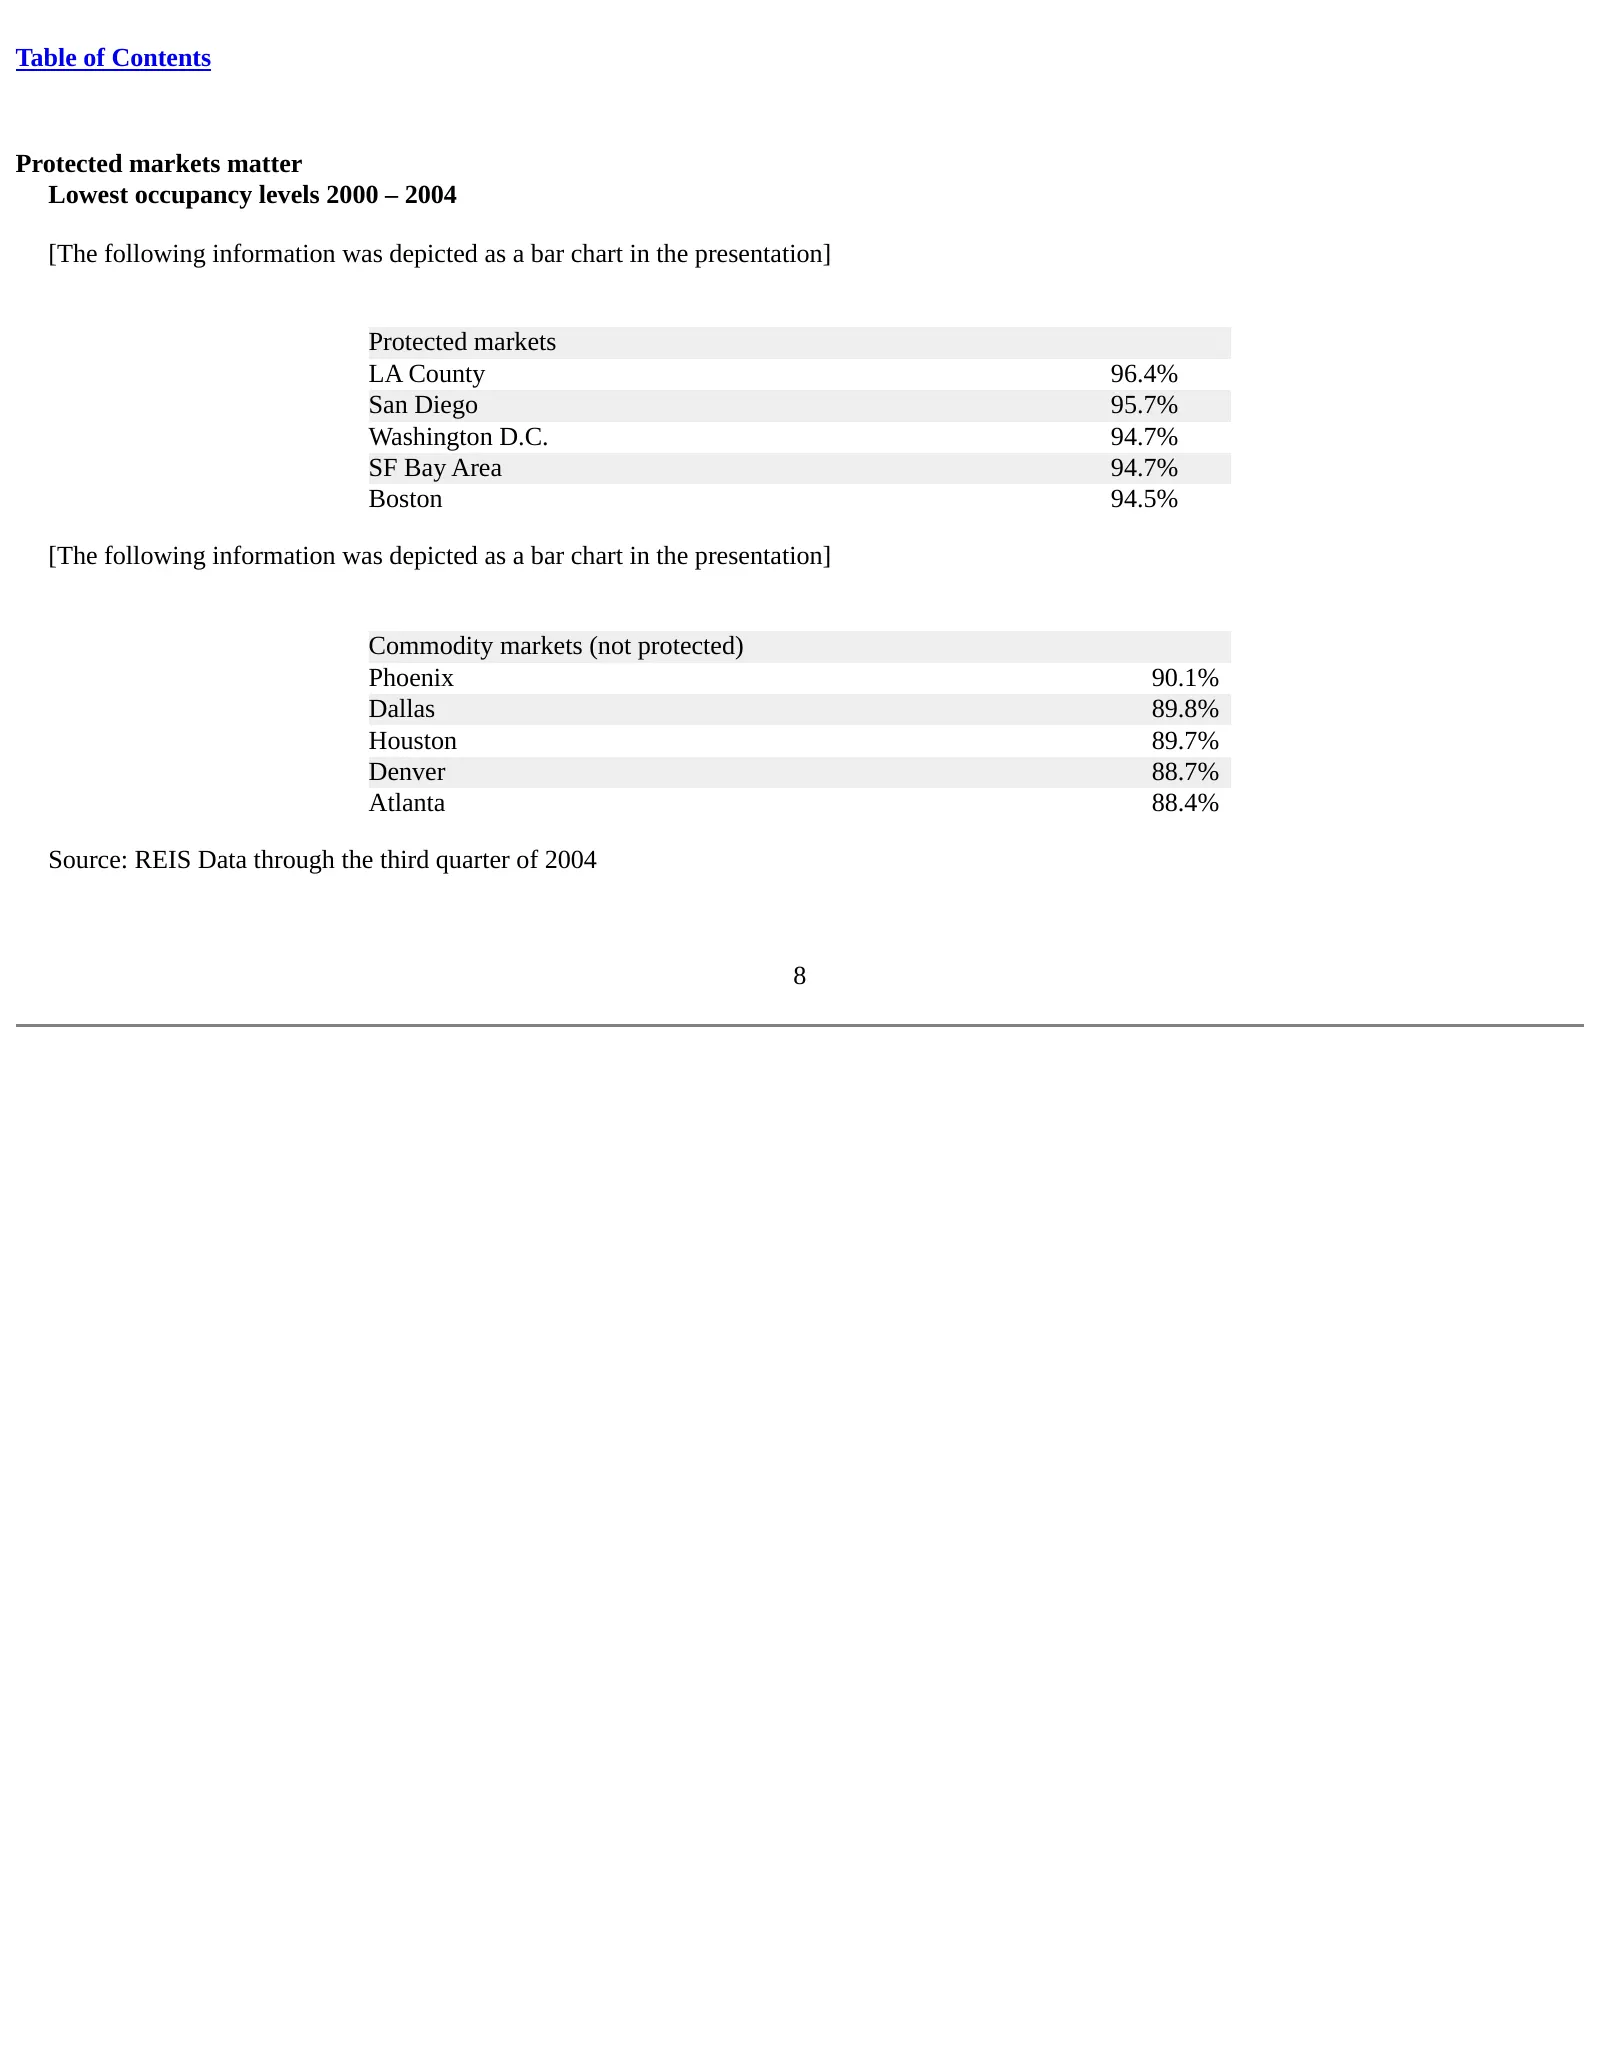
Table of Contents Protected markets matter Lowest occupancy levels 2000 – 2004 [The following information was depicted as a bar chart in the presentation] Protected markets LA County 96.4% San Diego 95.7% Washington D.C. 94.7% SF Bay Area 94.7% Boston 94.5% [The following information was depicted as
Slide 9: IRR matters!
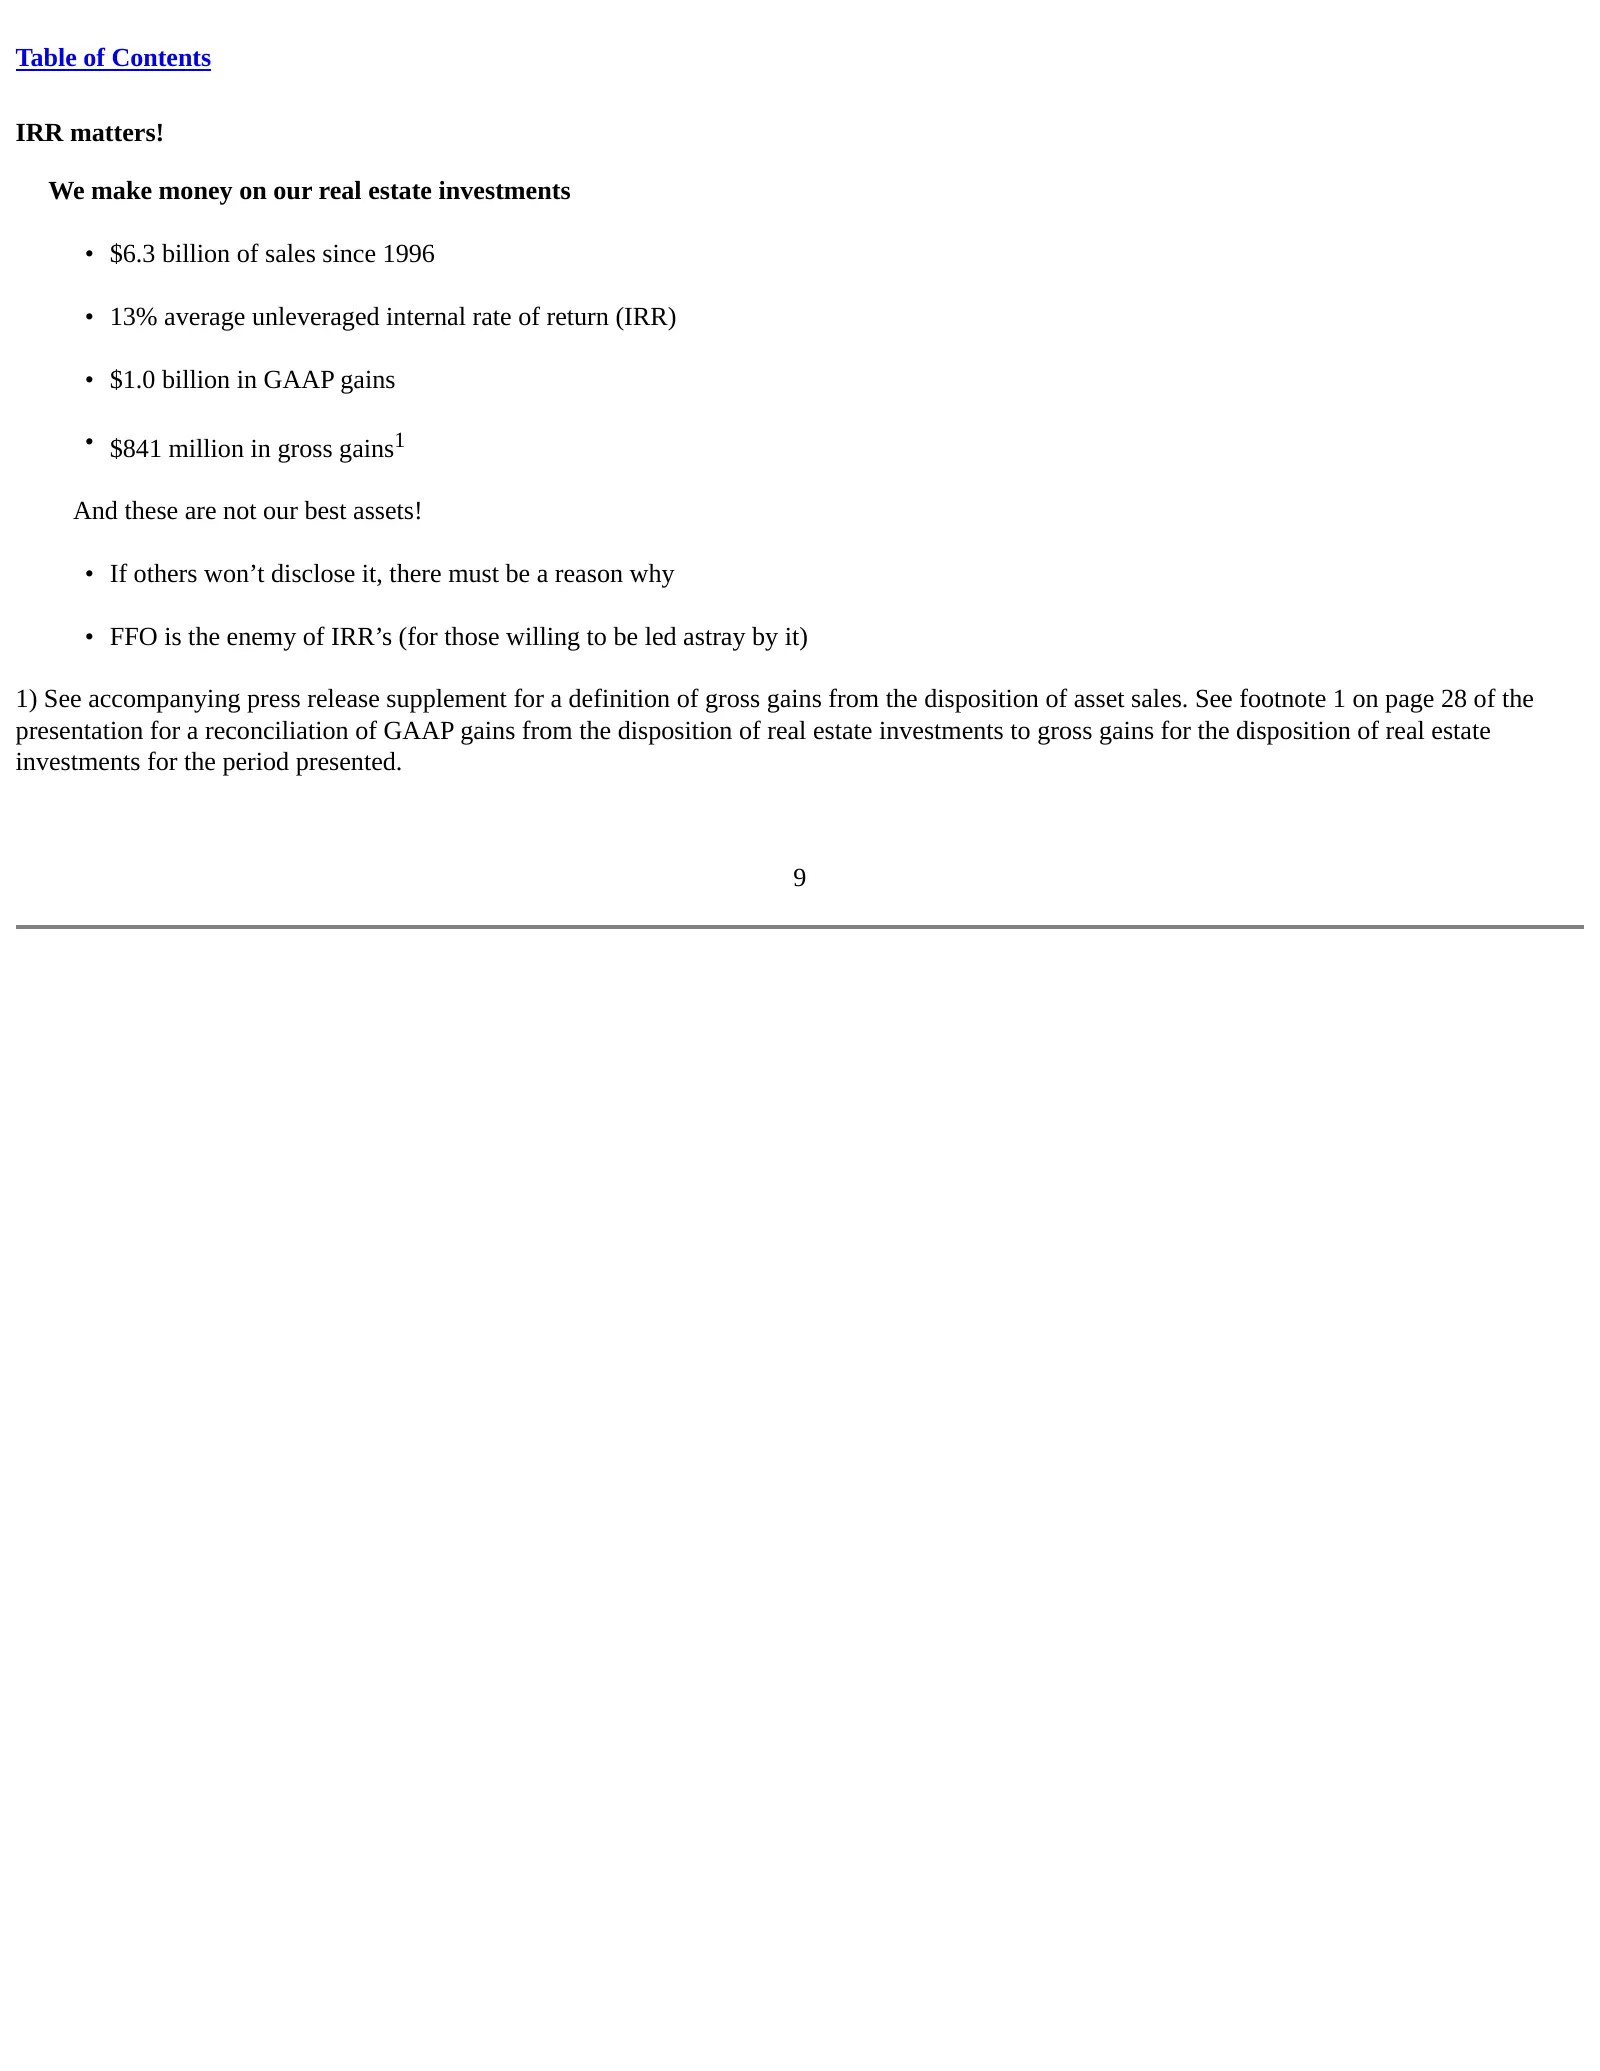
Table of Contents IRR matters! We make money on our real estate investments • $6.3 billion of sales since 1996 • 13% average unleveraged internal rate of return (IRR) • $1.0 billion in GAAP gains • $841 million in gross gains1 And these are not our best assets! • If others won’t disclose it, there m

Slide 10: Demonstrating embedded value
Table of Contents Demonstrating embedded value • We have identified over $4.5 billion of our assets that management believes would currently sell at a 4.5% capitalization rate – or lower Photos of: The Sonoma, Manhattan; Lofts 590, Washington D.C.; Archstone Torrey Hills, San Diego; Archstone Hoboke
Slide 11: Condo-conversion opportunity – potential special dividend
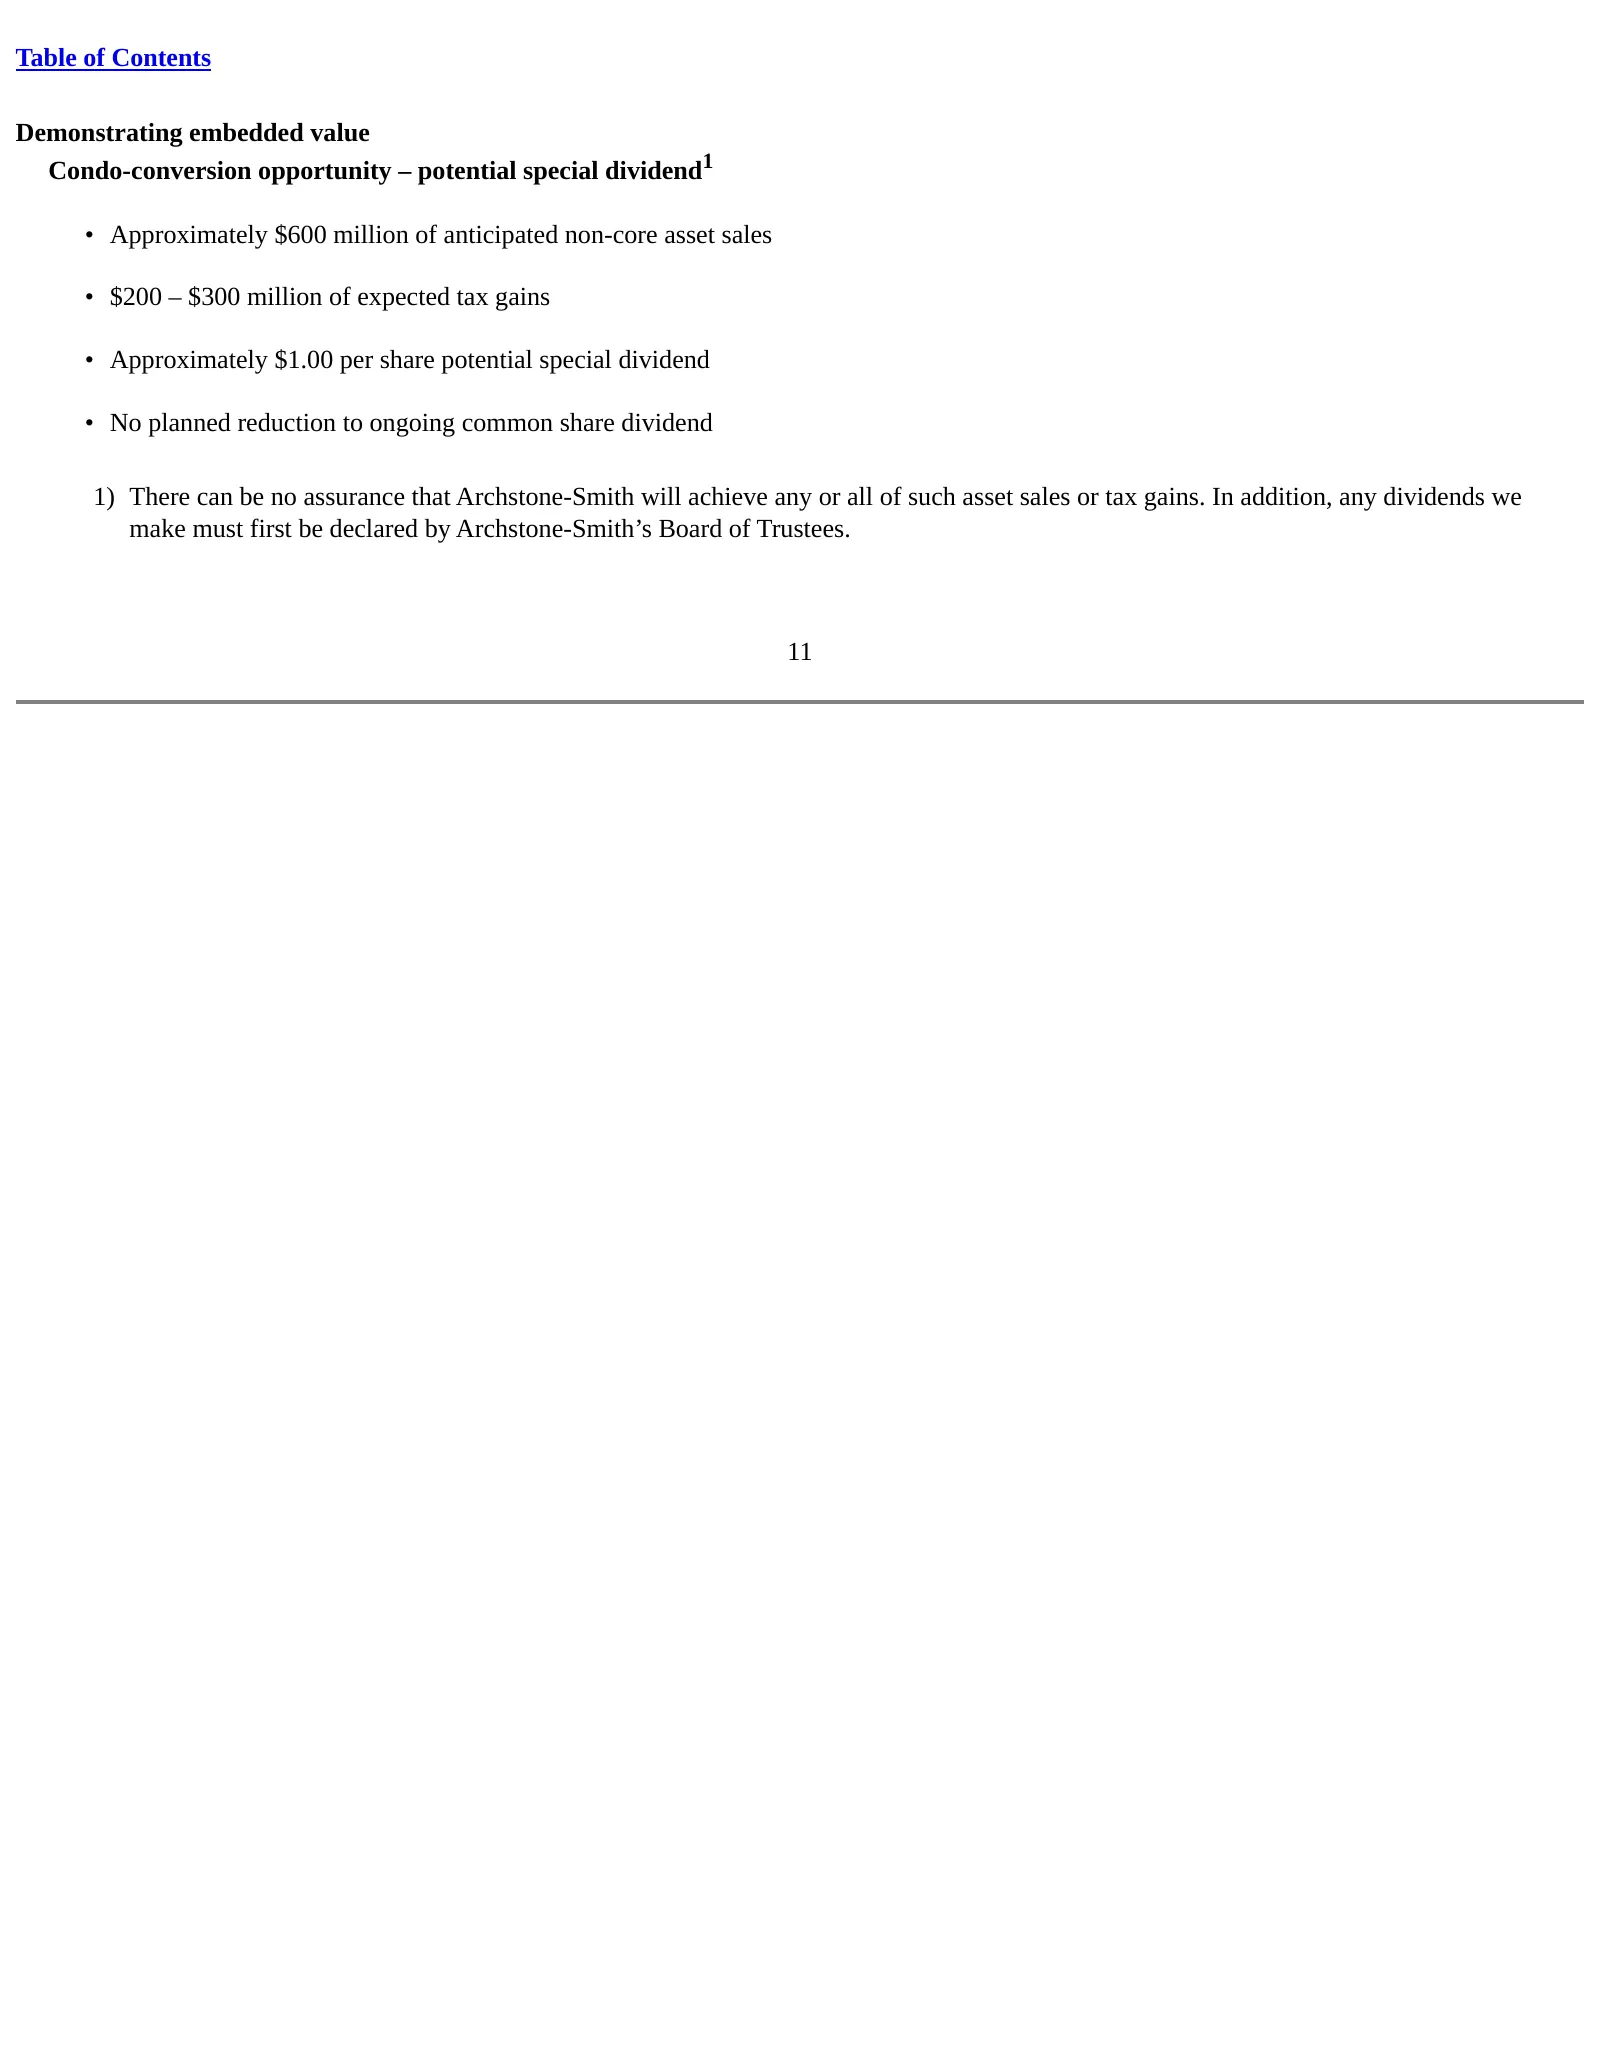
Table of Contents Demonstrating embedded value Condo-conversion opportunity – potential special dividend1 • Approximately $600 million of anticipated non-core asset sales • $200 – $300 million of expected tax gains • Approximately $1.00 per share potential special dividend • No planned reduction to
Slide 12: Update on asset sales to condominium converters
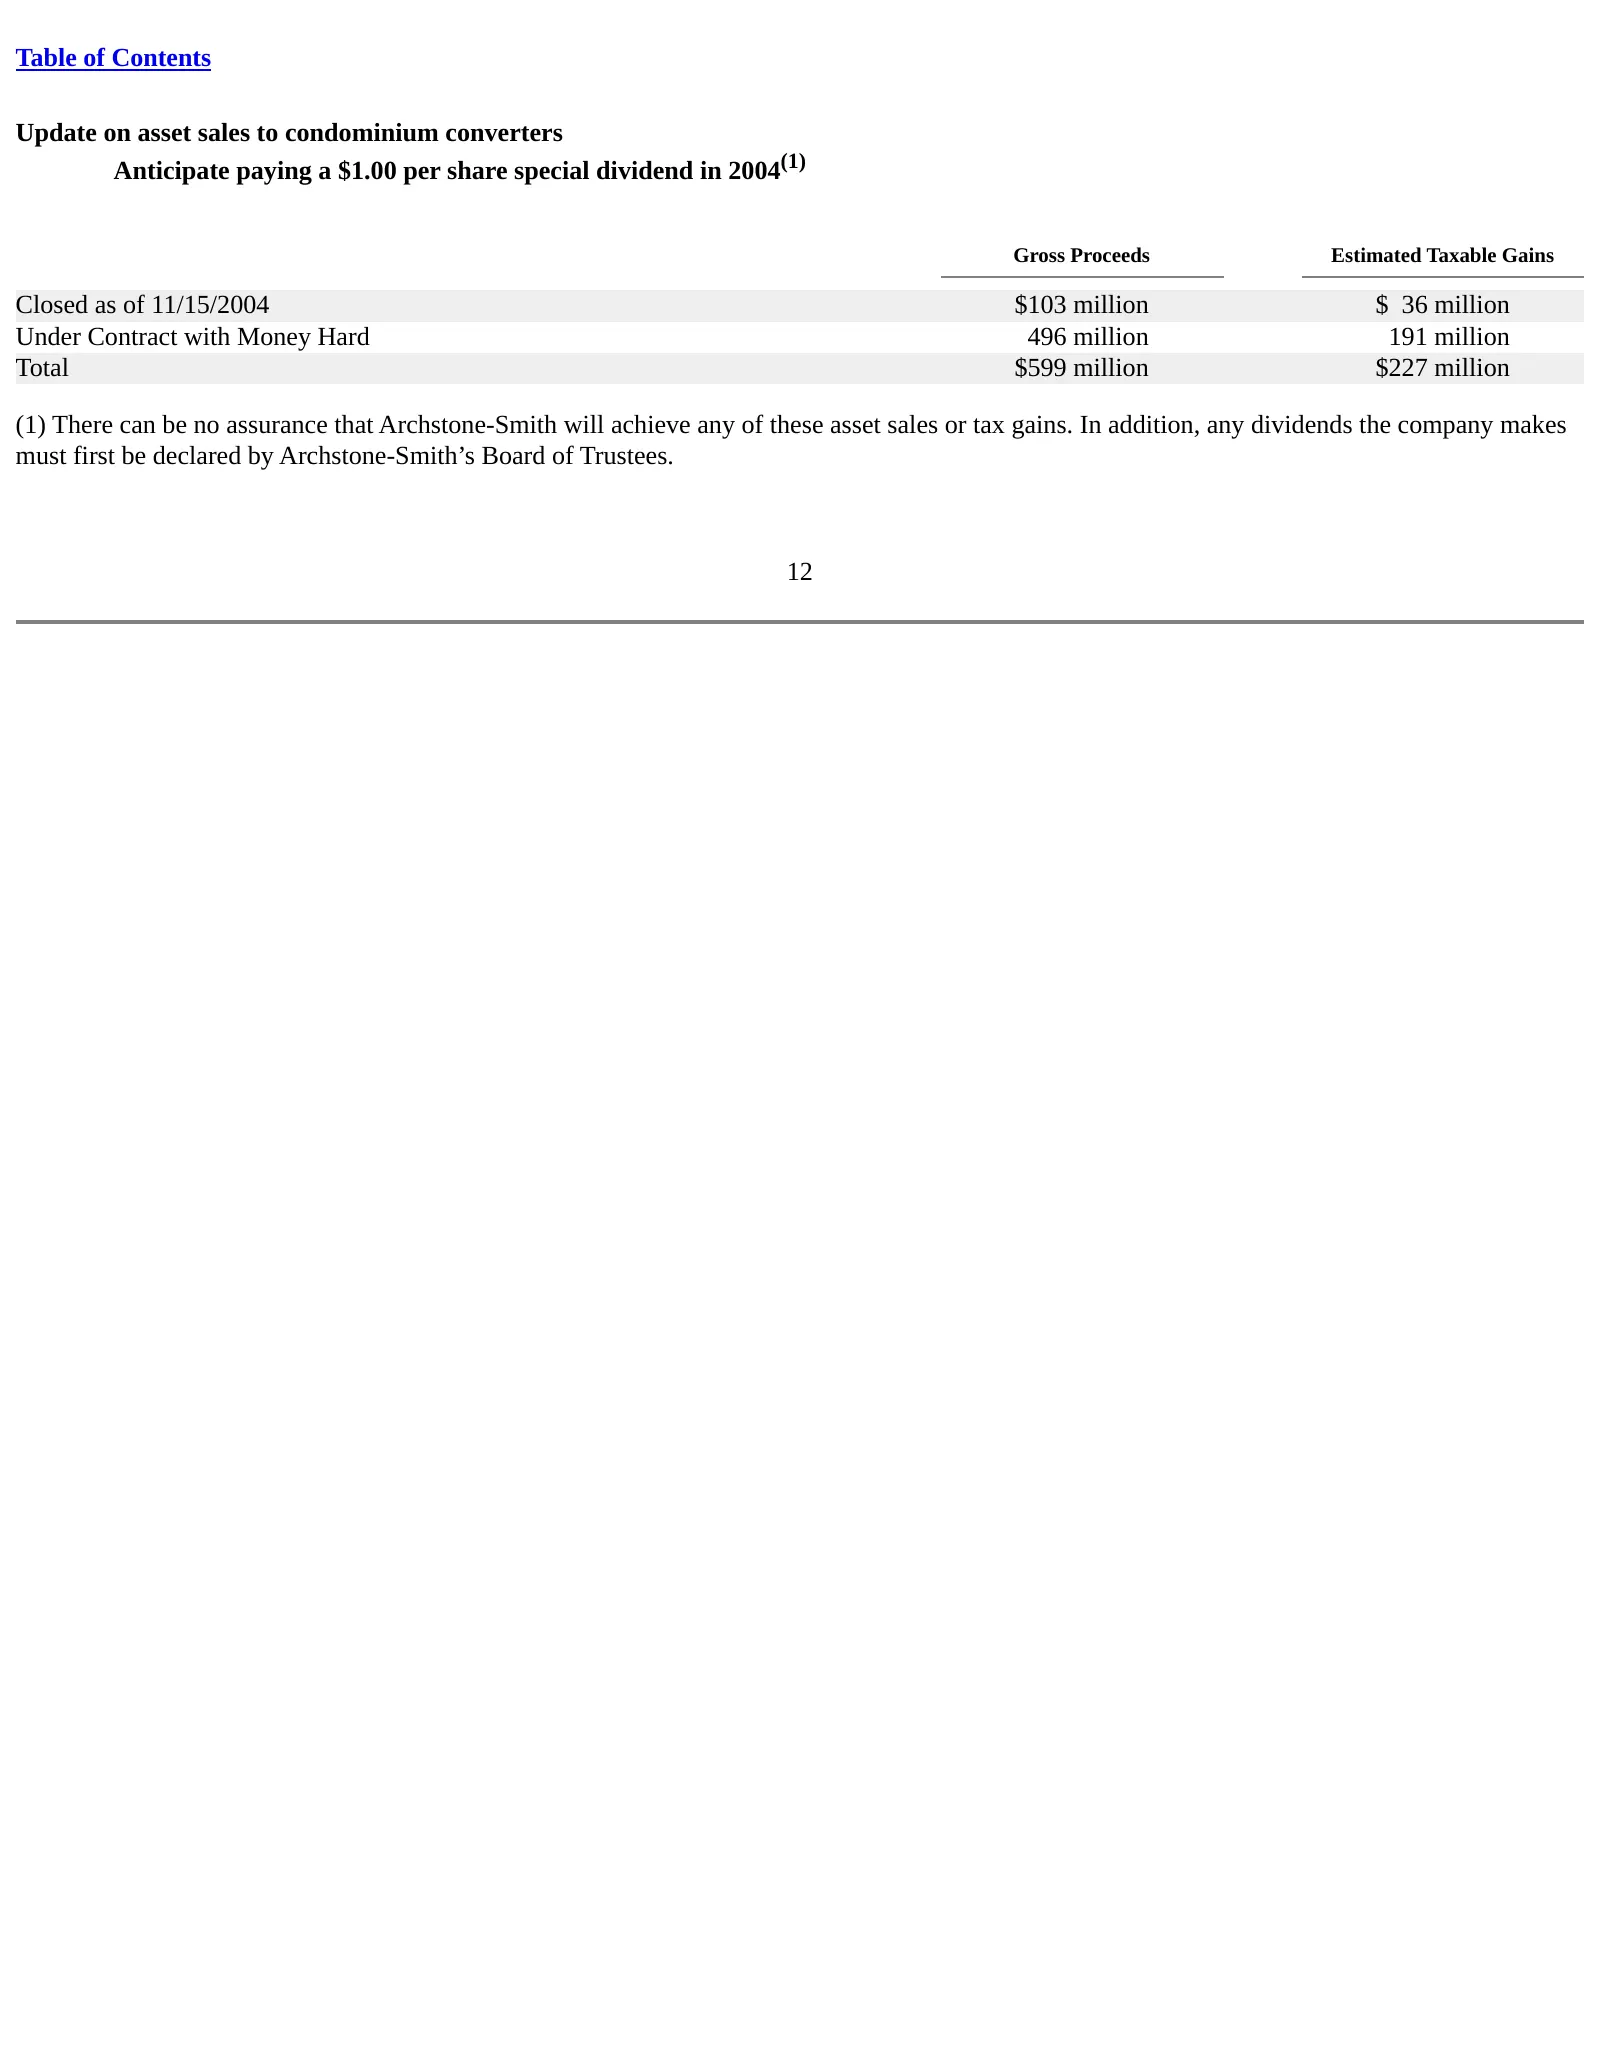
Table of Contents Update on asset sales to condominium converters Anticipate paying a $1.00 per share special dividend in 2004(1) Gross Proceeds Estimated Taxable Gains Closed as of 11/15/2004 $103 million $ 36 million Under Contract with Money Hard 496 million 191 million Total $599 million $227 mi
Slide 13: Ameriton creates significant value for our company
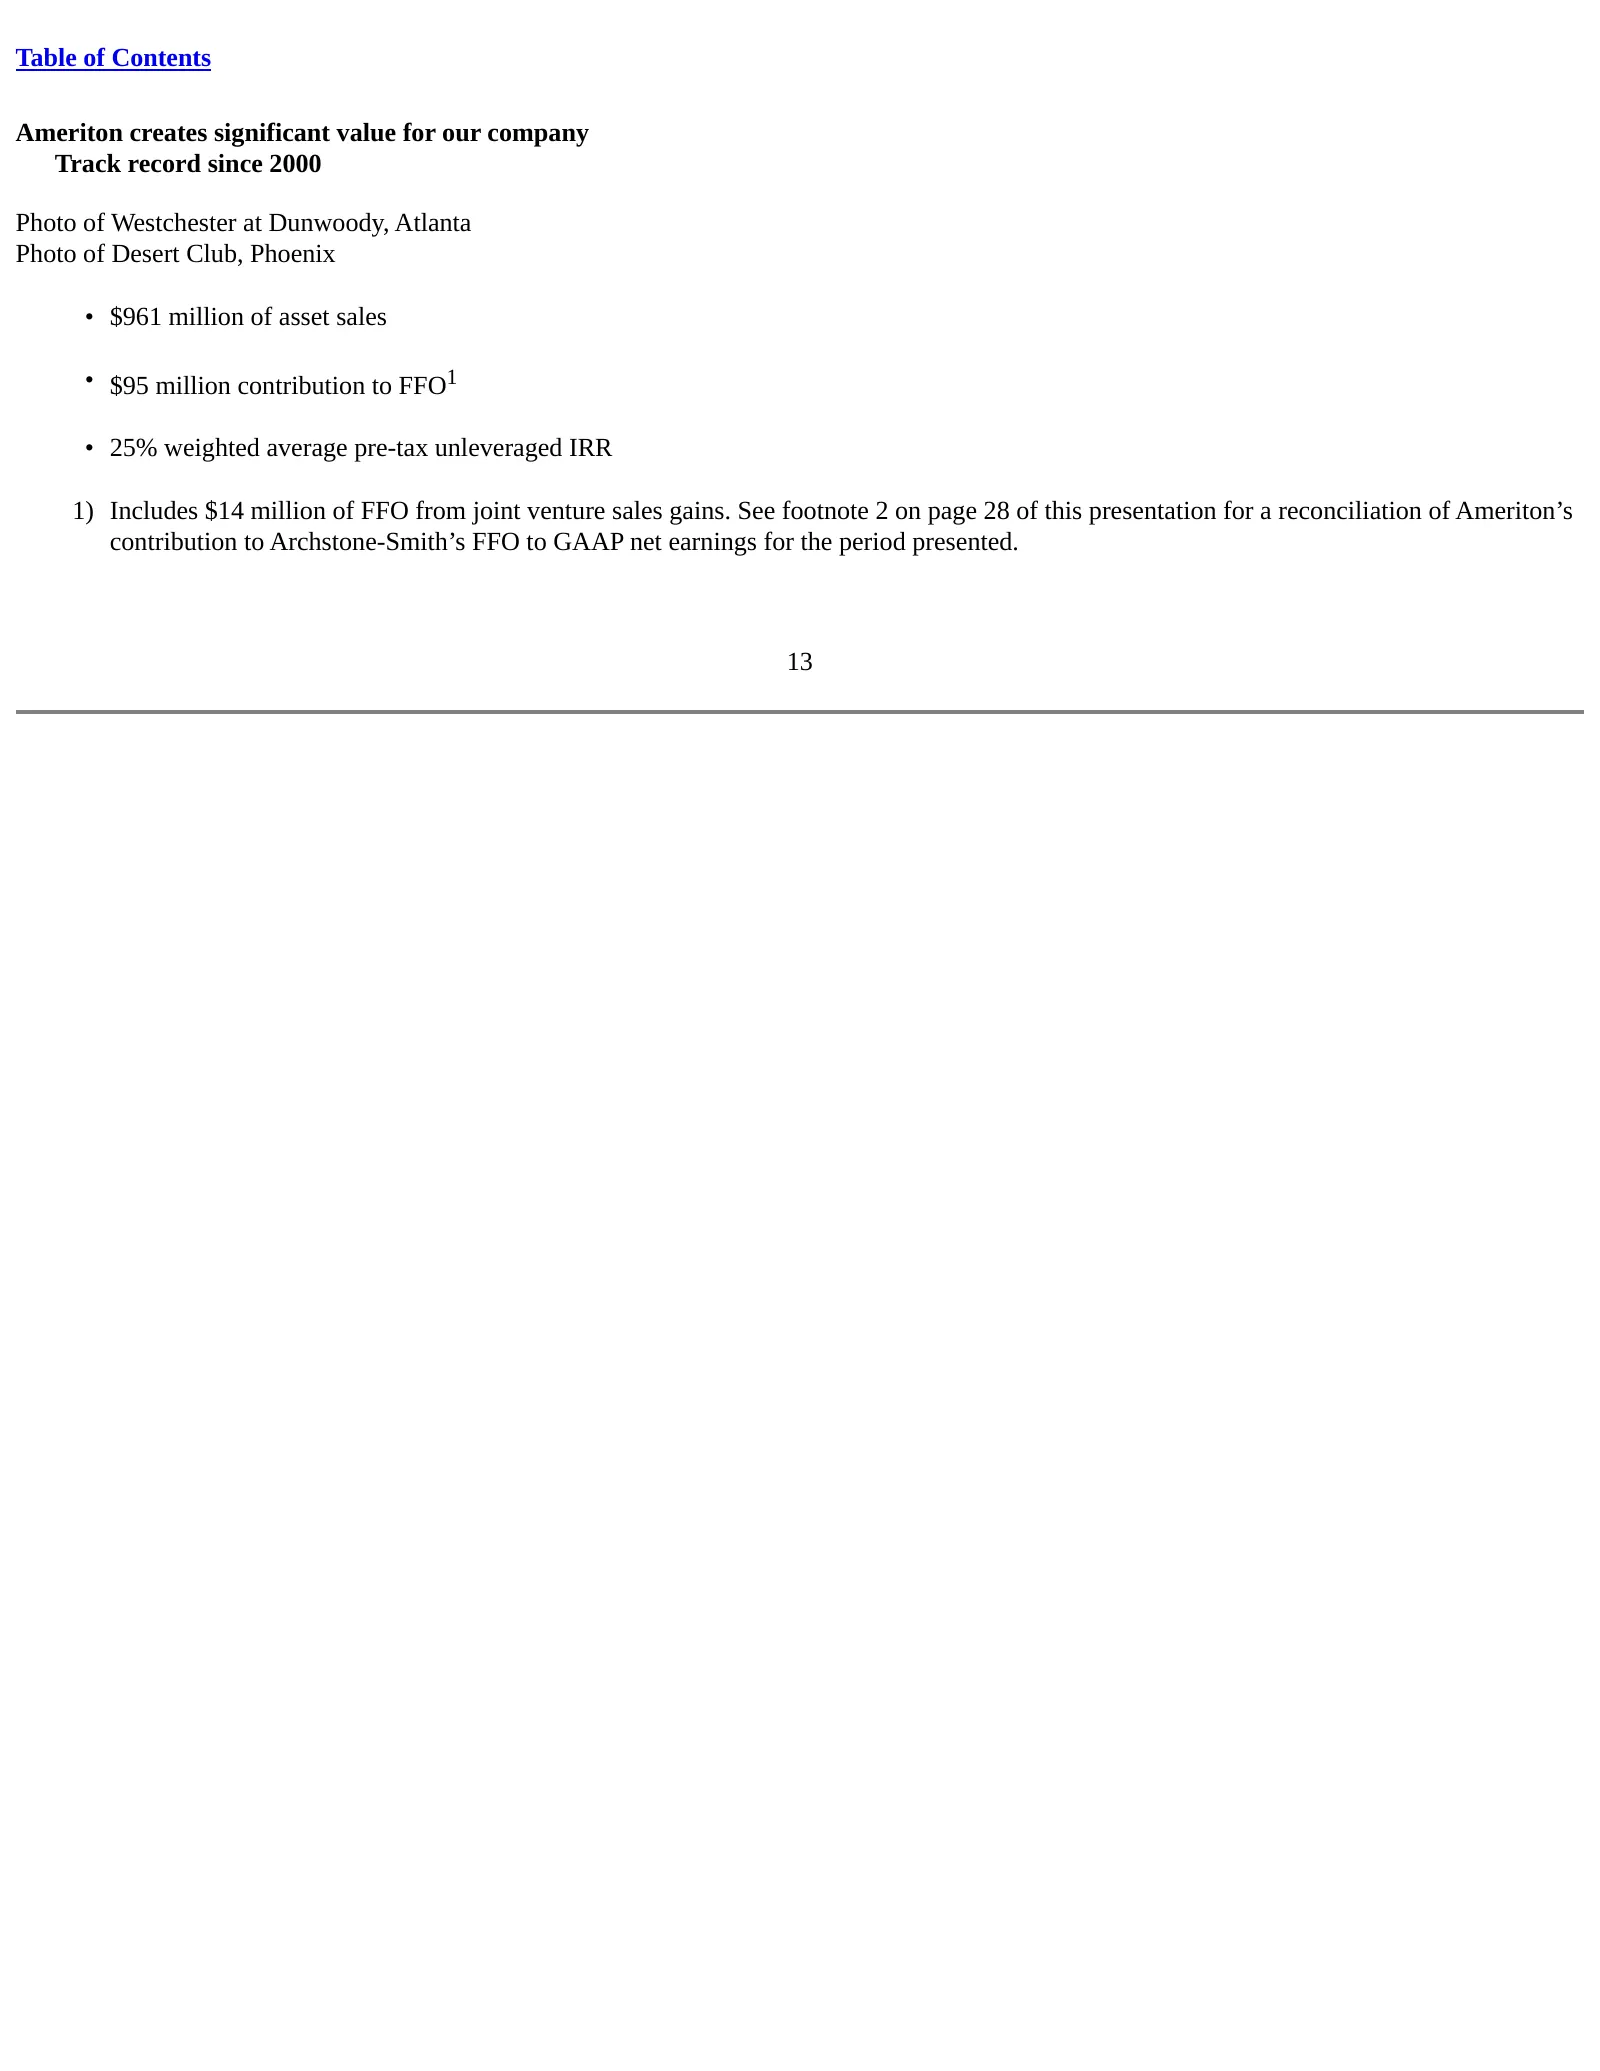
Table of Contents Ameriton creates significant value for our company Track record since 2000 Photo of Westchester at Dunwoody, Atlanta Photo of Desert Club, Phoenix • $961 million of asset sales • $95 million contribution to FFO1 • 25% weighted average pre-tax unleveraged IRR 1) Includes $14 million
Slide 14: Operations matters! Reported same-store NOI growth
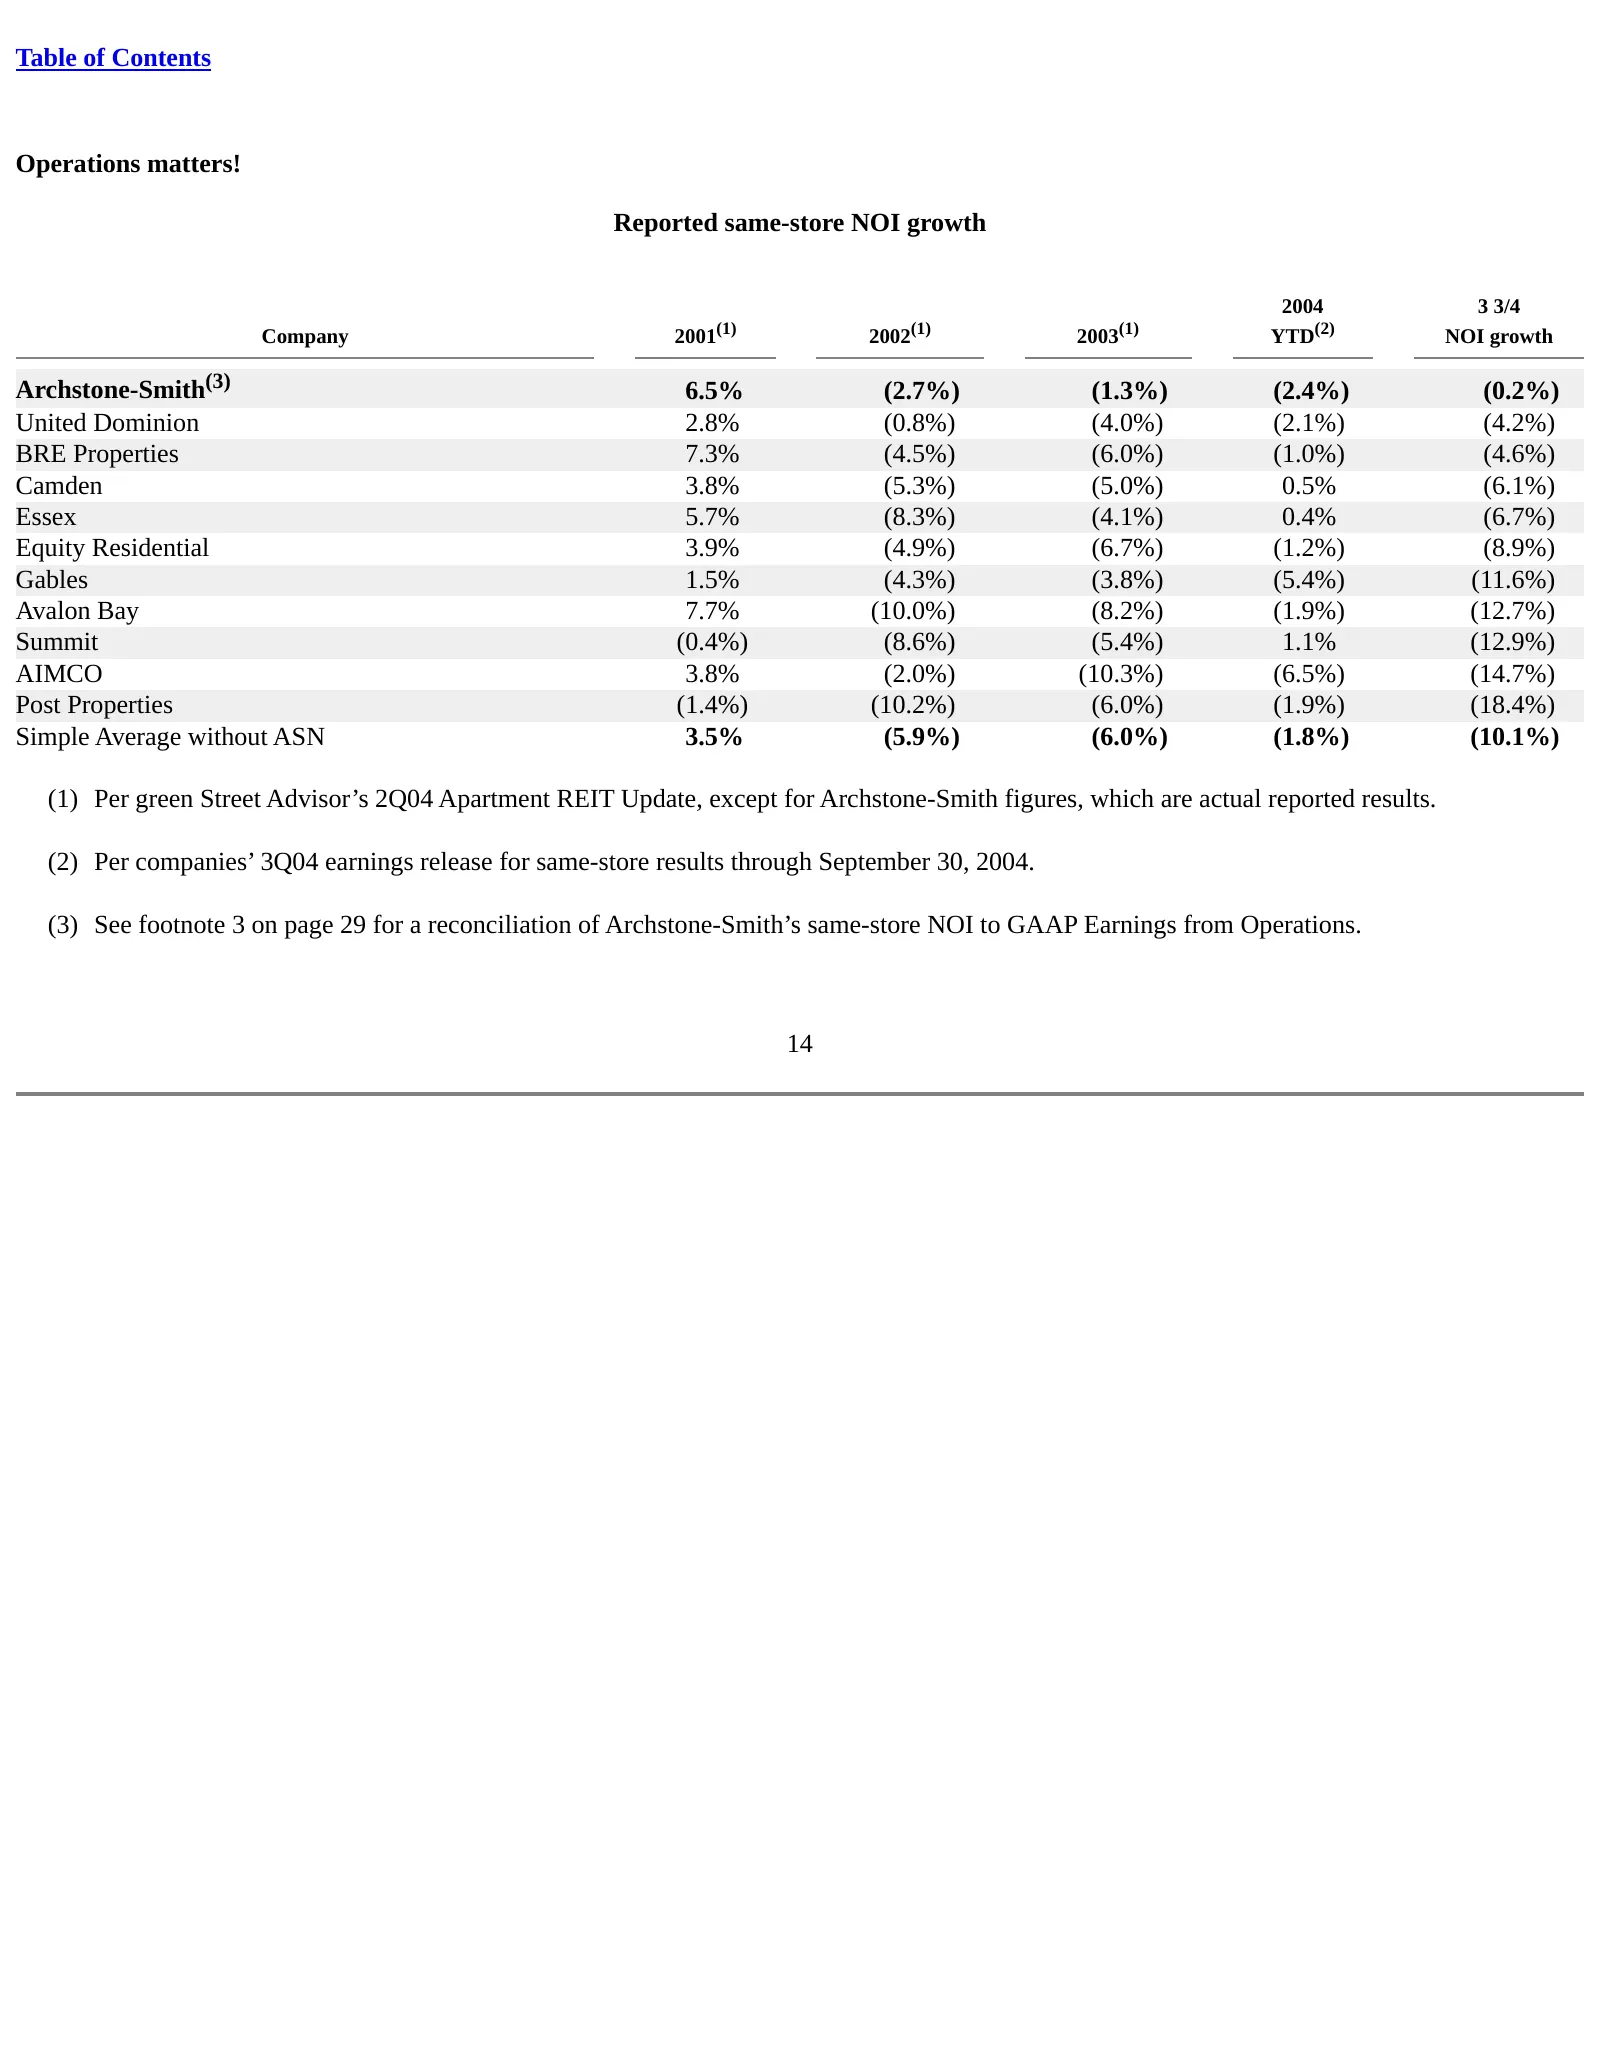
Table of Contents Operations matters! Reported same-store NOI growth 2004 3 3/4 Company 2001(1) 2002(1) 2003(1) YTD(2) NOI growth Archstone-Smith(3) 6.5% (2.7%) (1.3%) (2.4%) (0.2%) United Dominion 2.8% (0.8%) (4.0%) (2.1%) (4.2%) BRE Properties 7.3% (4.5%) (6.0%) (1.0%) (4.6%) Camden 3.8% (5.3%) (5

Slide 15: Track record of operational innovation
Table of Contents Track record of operational innovation • Multiple times, not just once • Purposeful, not accidental • Invest in research and development • We are reinventing our industry 15
Slide 16: ASN 2005 anticipated same store revenue growth
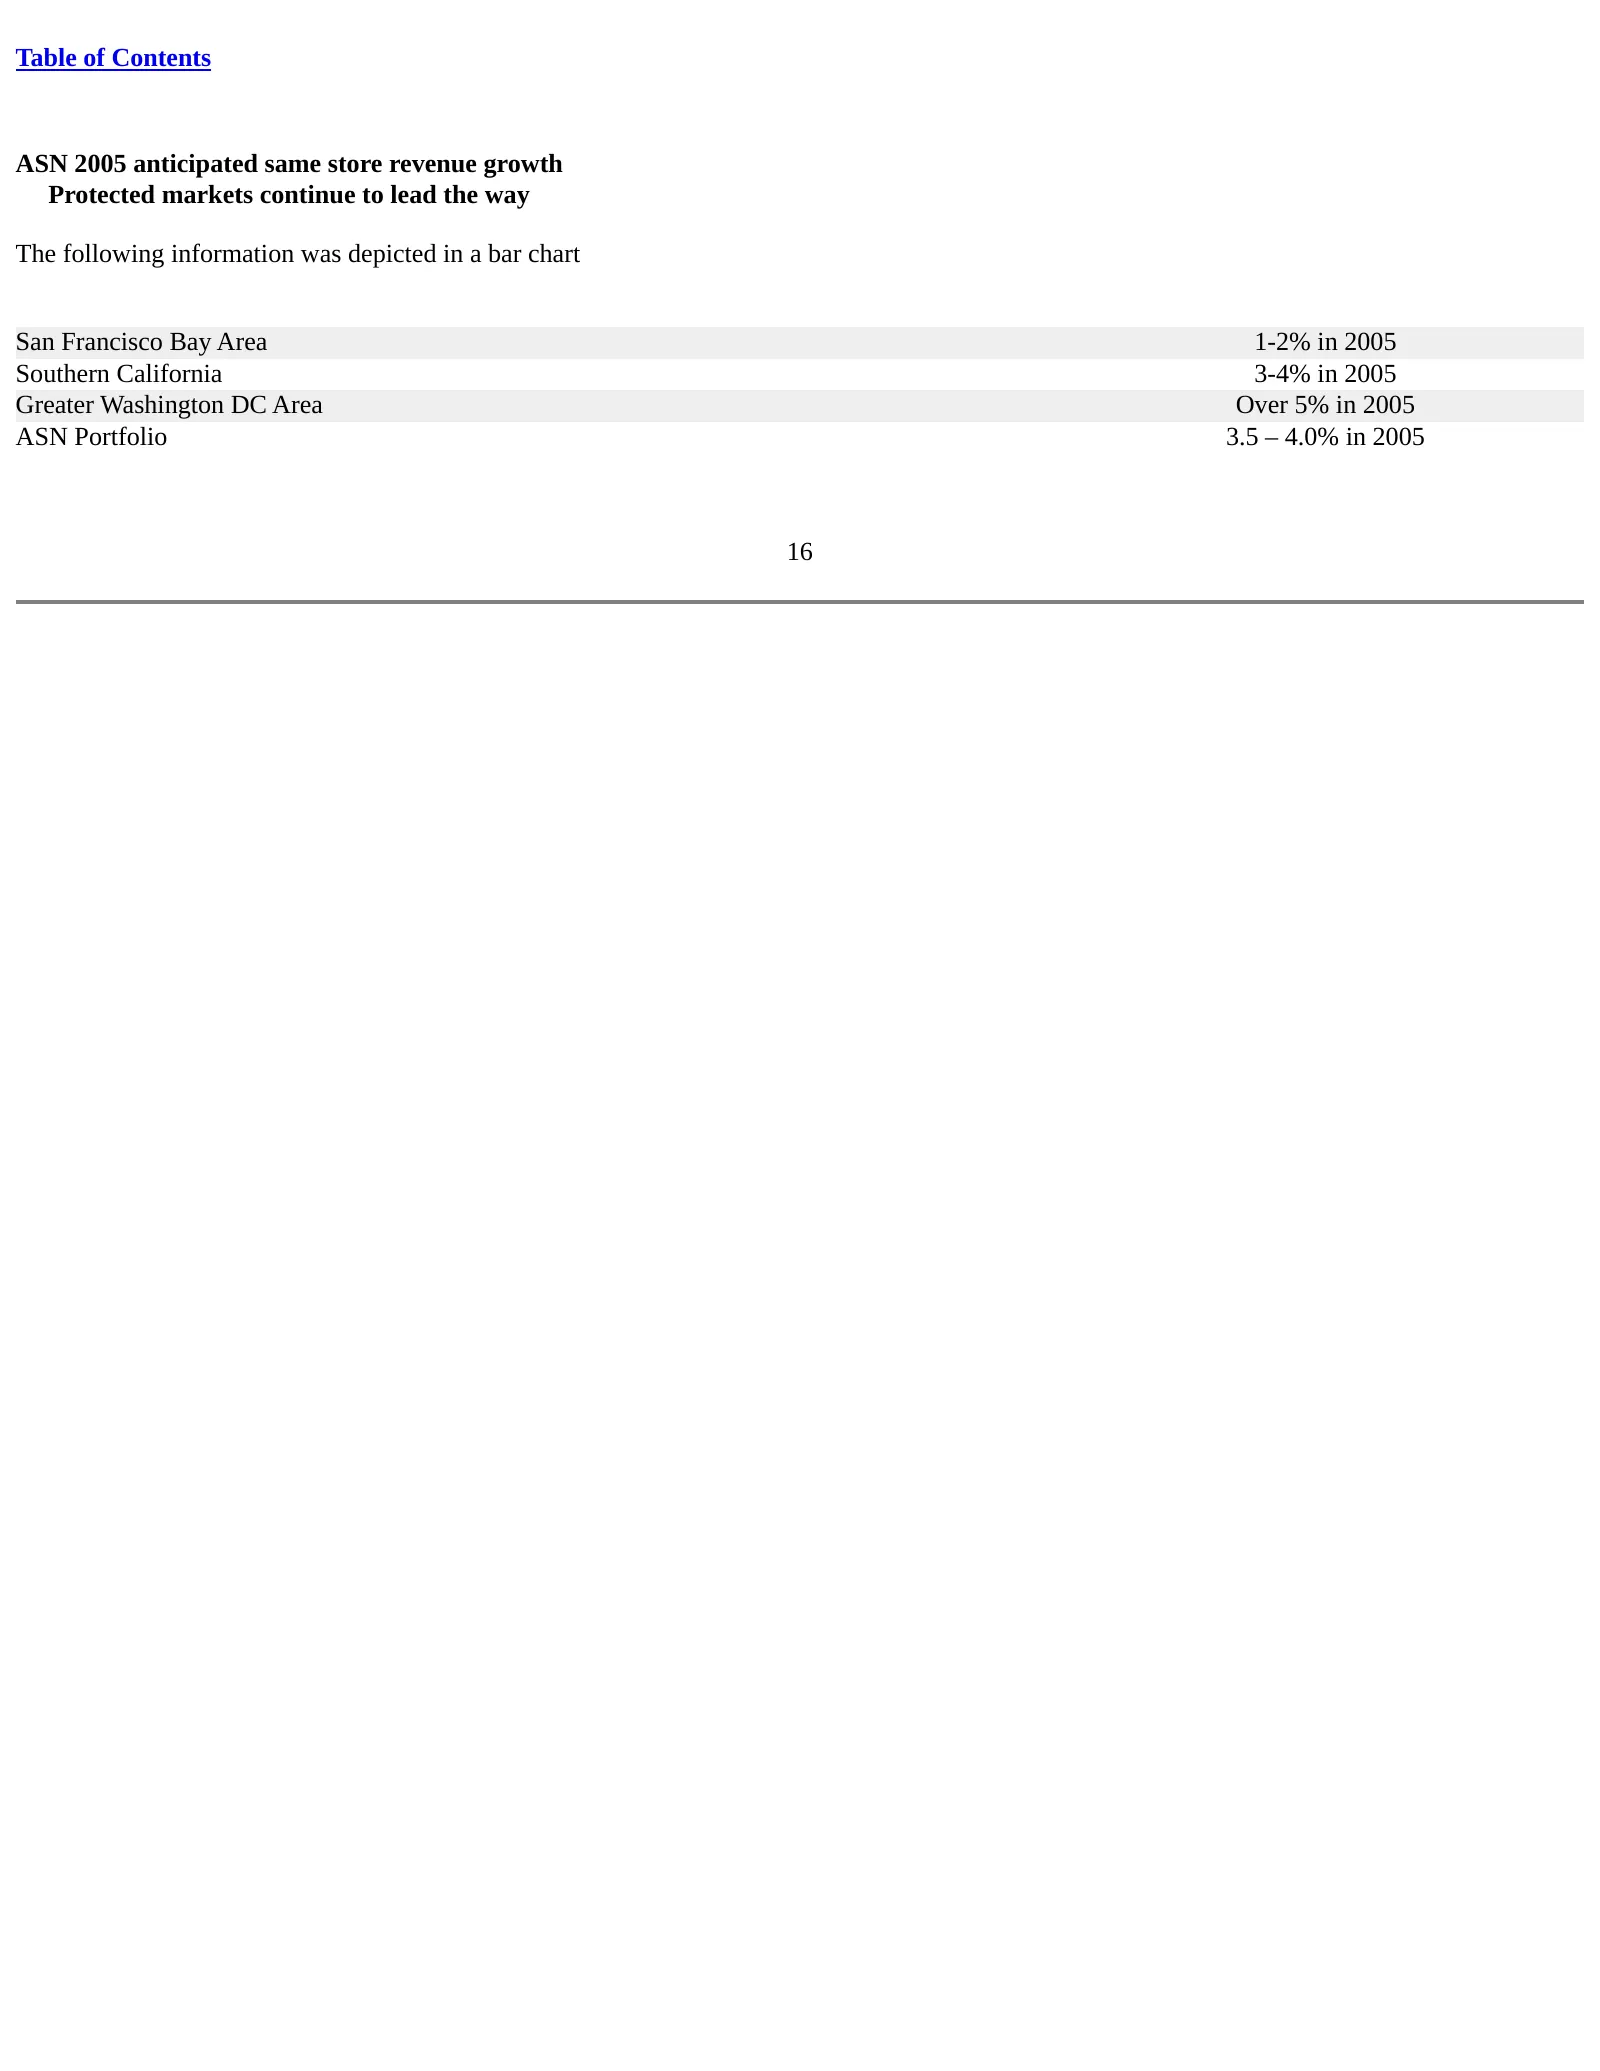
Table of Contents ASN 2005 anticipated same store revenue growth Protected markets continue to lead the way The following information was depicted in a bar chart San Francisco Bay Area 1-2% in 2005 Southern California 3-4% in 2005 Greater Washington DC Area Over 5% in 2005 ASN Portfolio 3.5 – 4.0% i
Slide 17: Disciplined capital allocation strategy
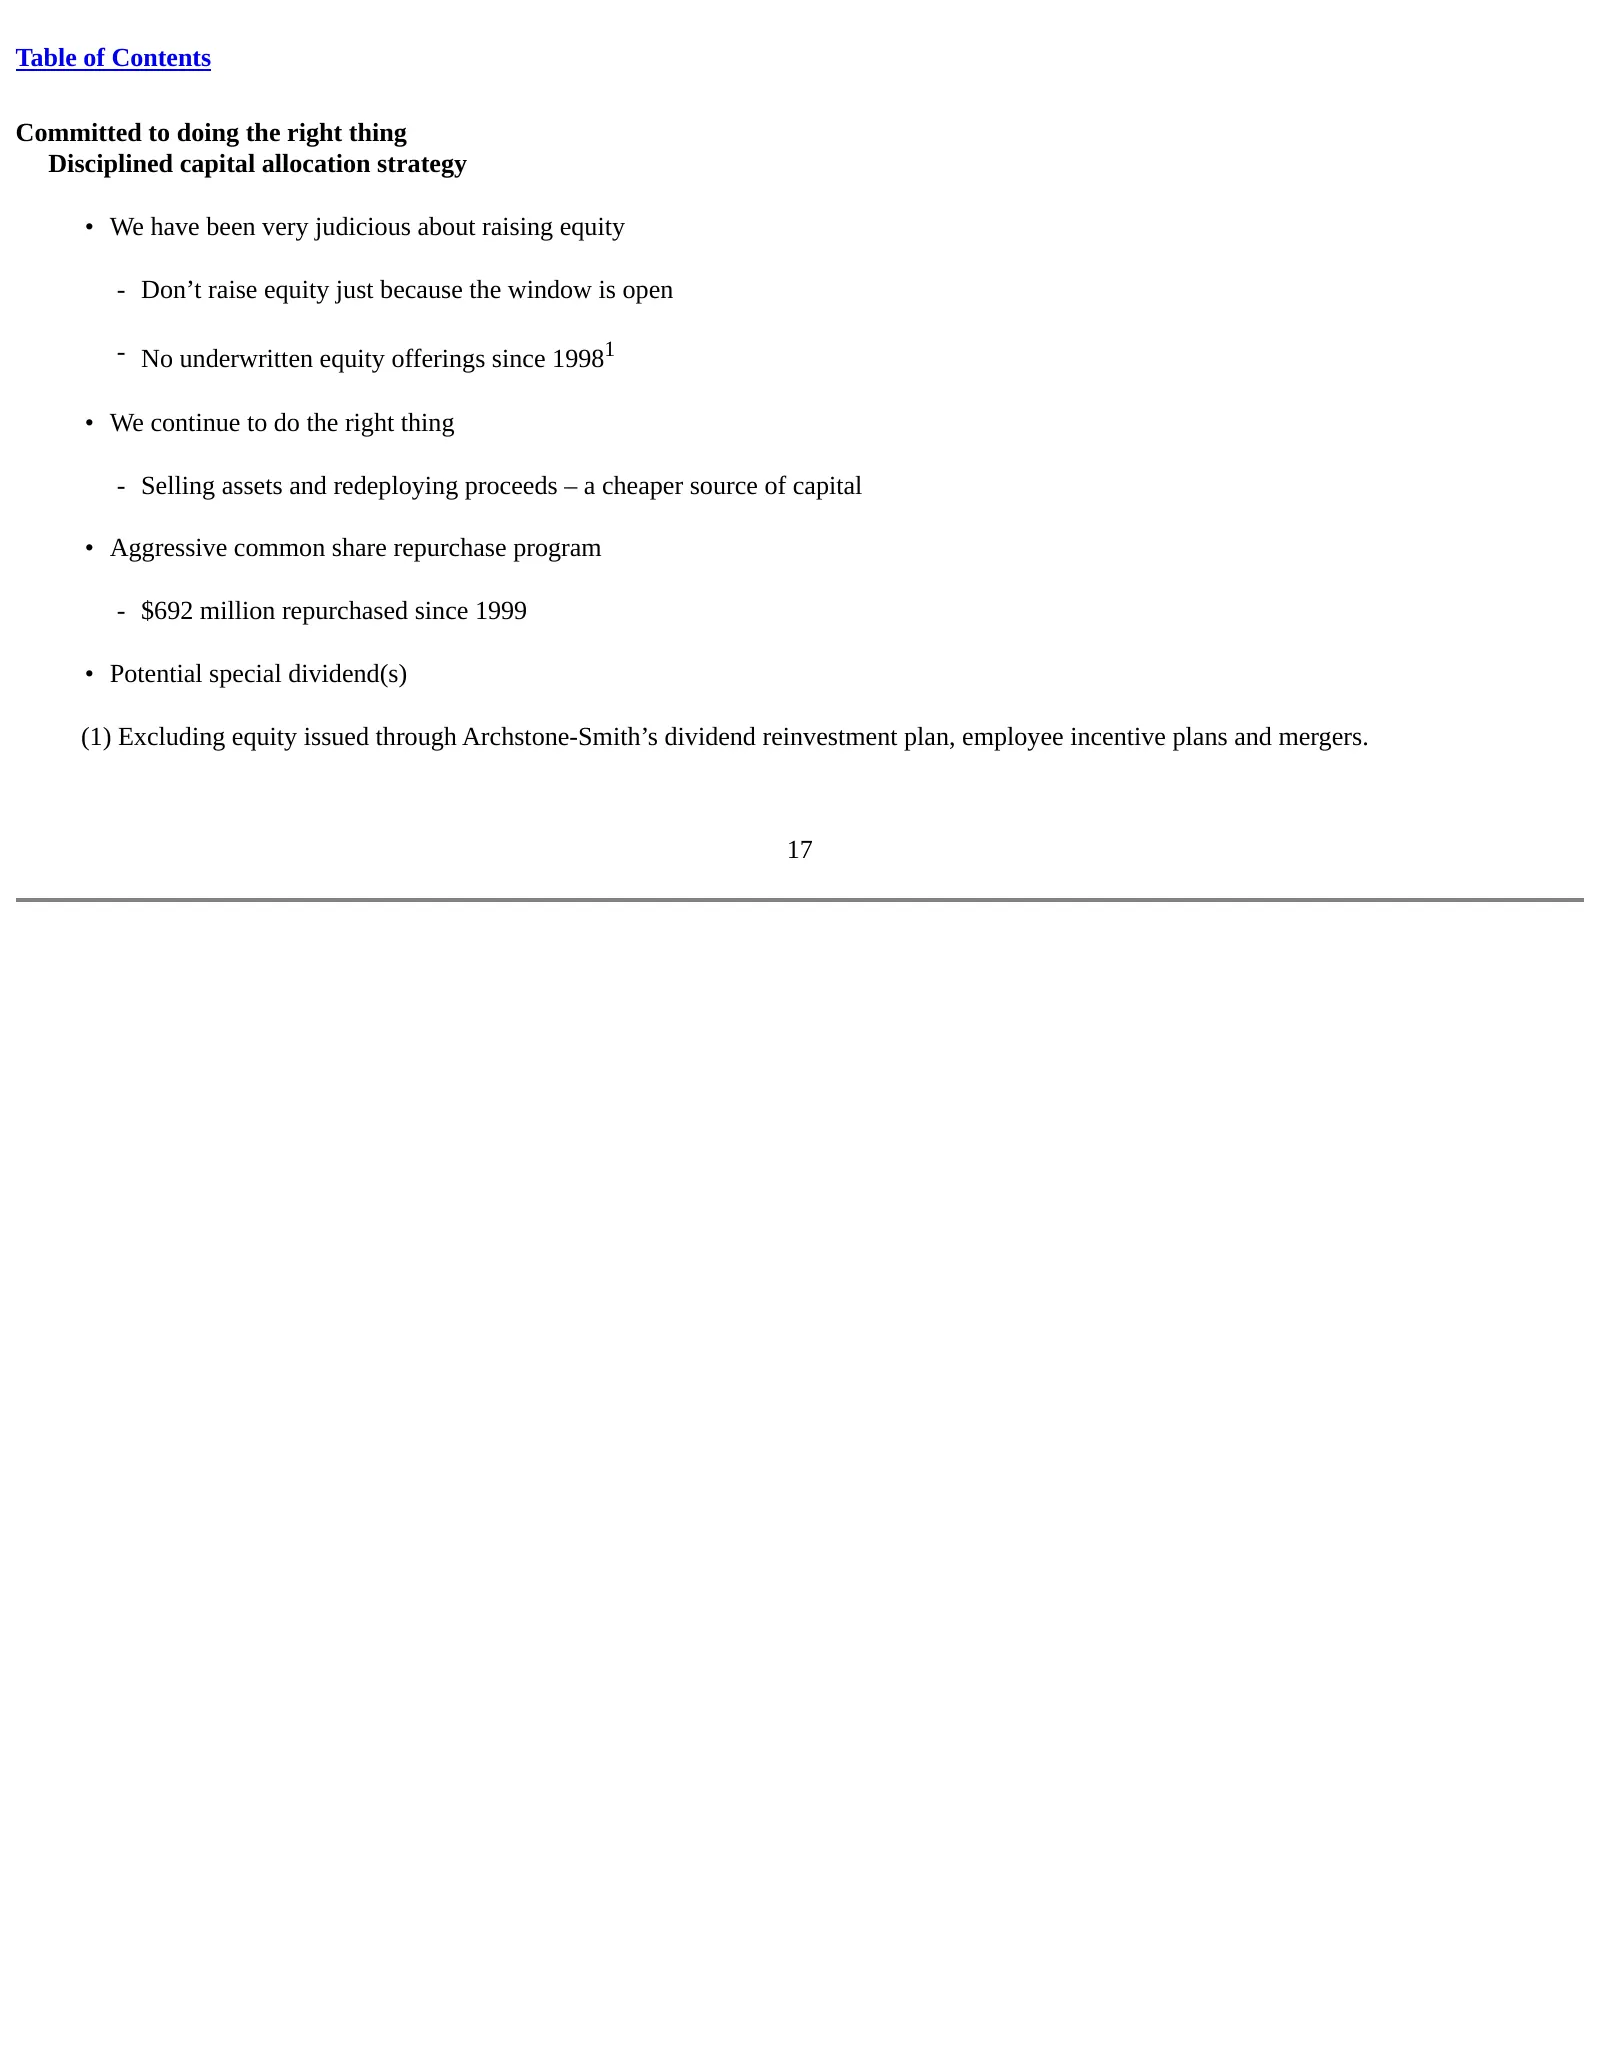
Table of Contents Committed to doing the right thing Disciplined capital allocation strategy • We have been very judicious about raising equity - Don’t raise equity just because the window is open - No underwritten equity offerings since 19981 • We continue to do the right thing - Selling assets and
Slide 18: Aggressive share repurchase program
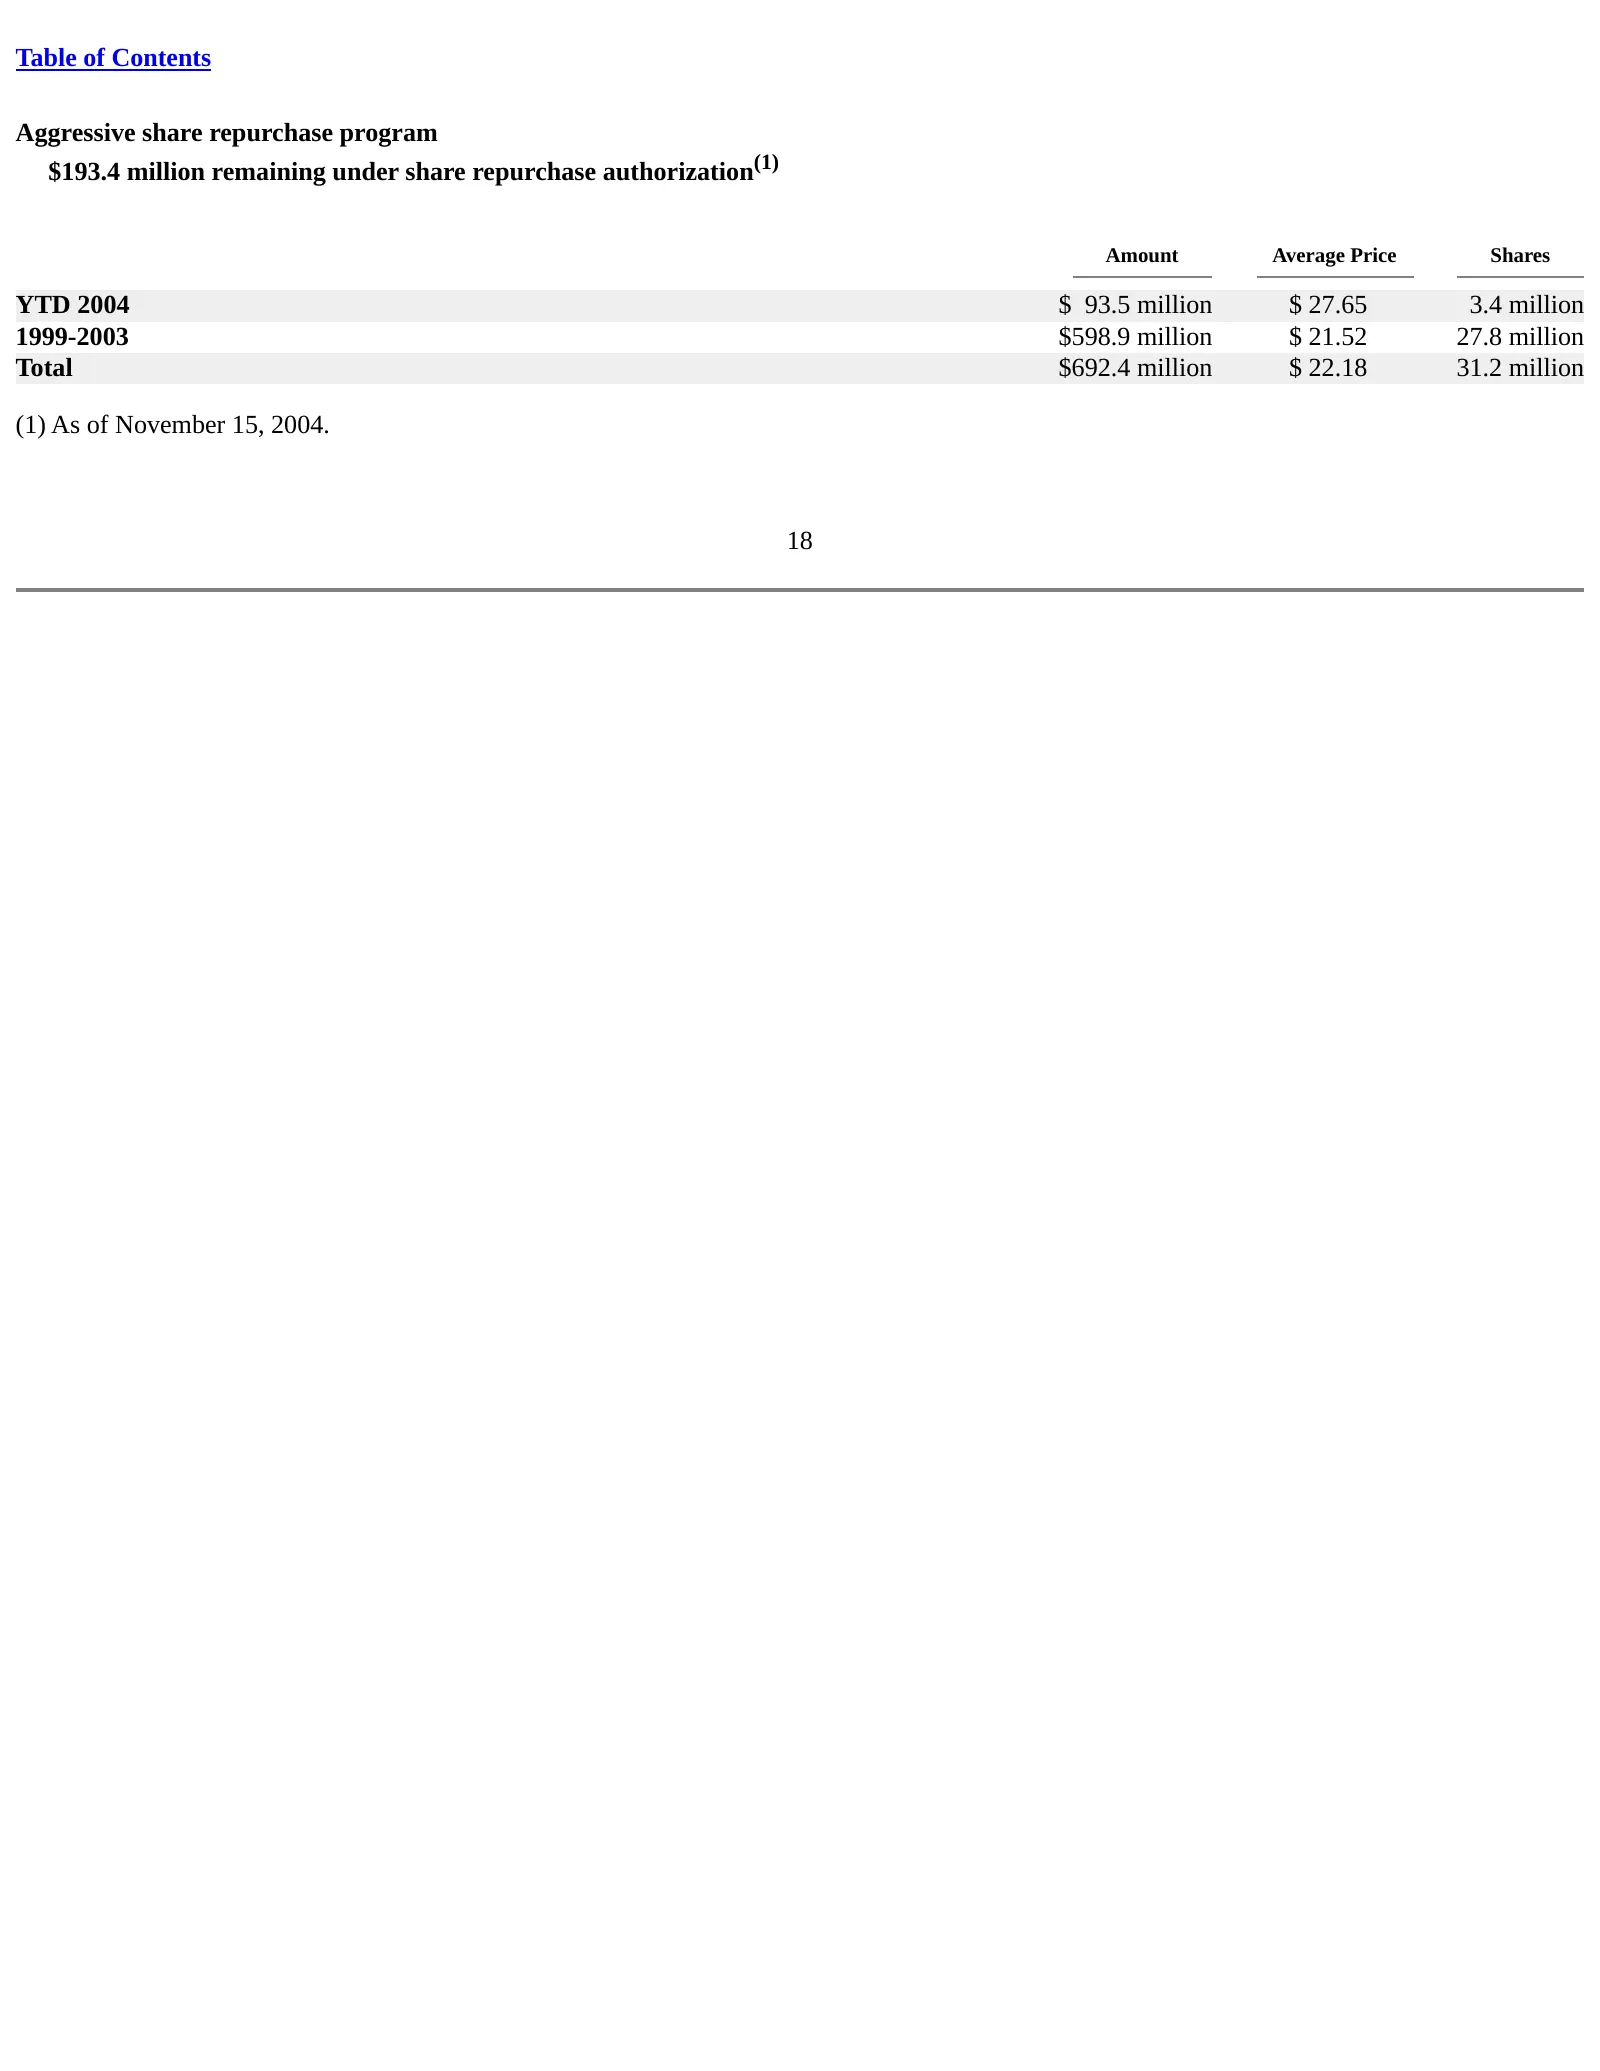
Table of Contents Aggressive share repurchase program $193.4 million remaining under share repurchase authorization(1) Amount Average Price Shares YTD 2004 $ 93.5 million $ 27.65 3.4 million 1999-2003 $598.9 million $ 21.52 27.8 million Total $692.4 million $ 22.18 31.2 million (1) As of November 15
Slide 19: ASN's Net Asset Value (NAV) per share
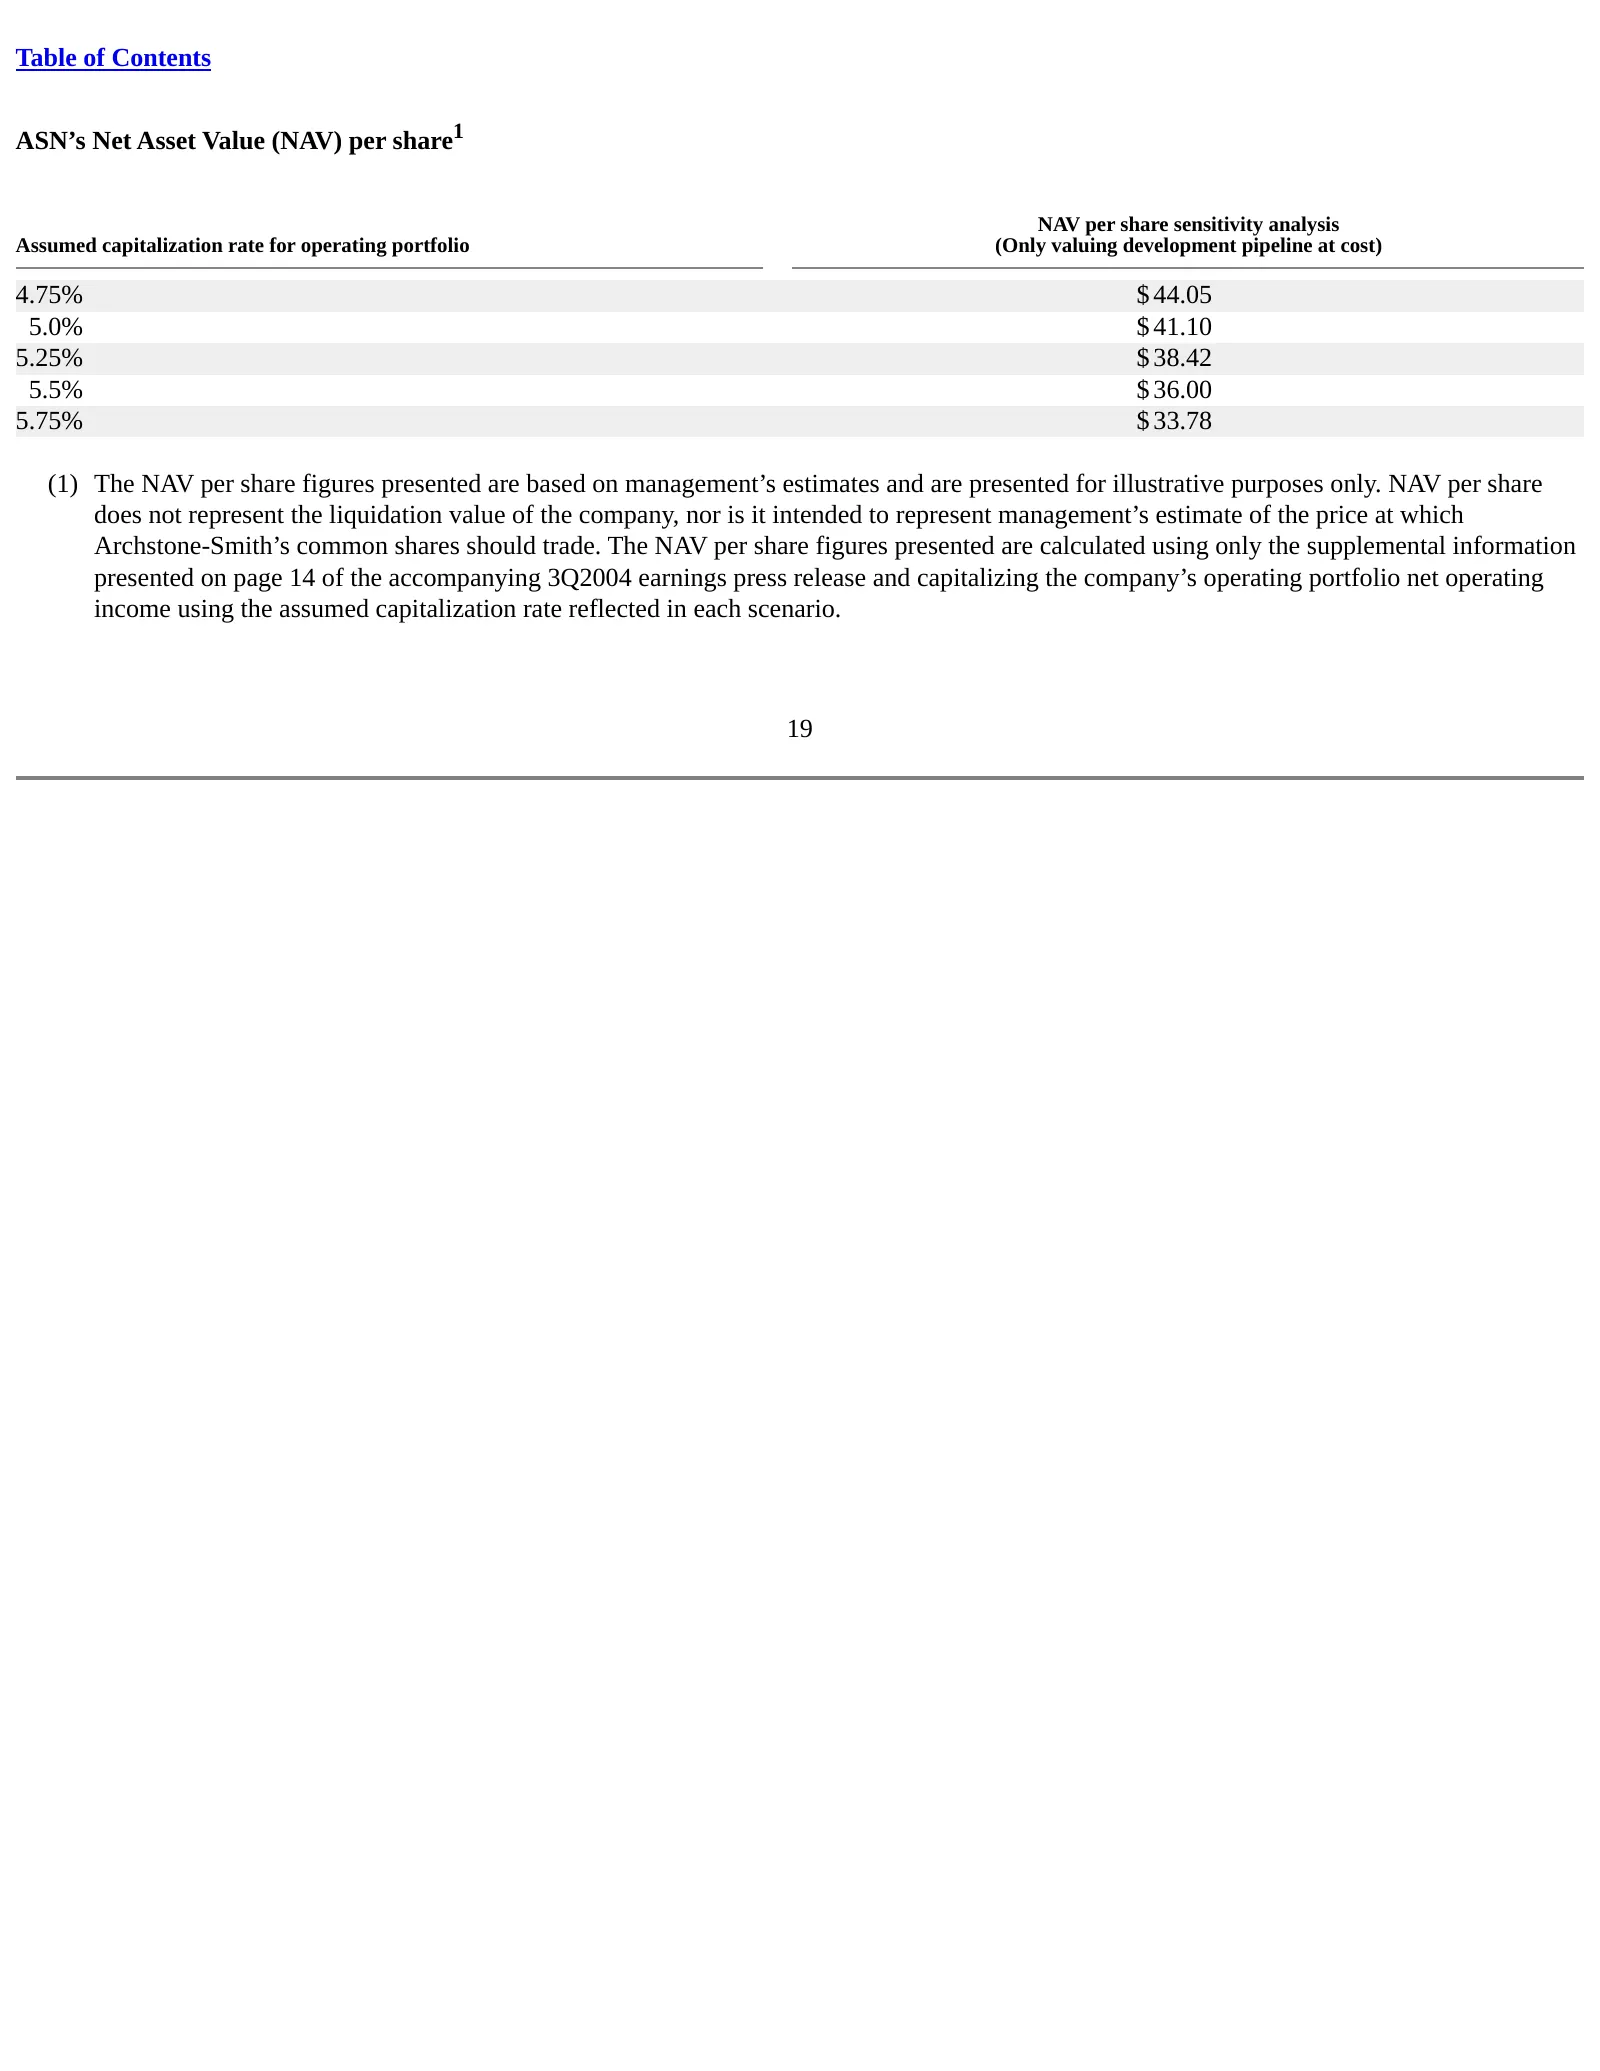
Table of Contents ASN’s Net Asset Value (NAV) per share1 NAV per share sensitivity analysis Assumed capitalization rate for operating portfolio (Only valuing development pipeline at cost) 4.75% $ 44.05 5.0% $ 41.10 5.25% $ 38.42 5.5% $ 36.00 5.75% $ 33.78 (1) The NAV per share figures presented are
Slide 20: Strong balance sheet and financial flexibility
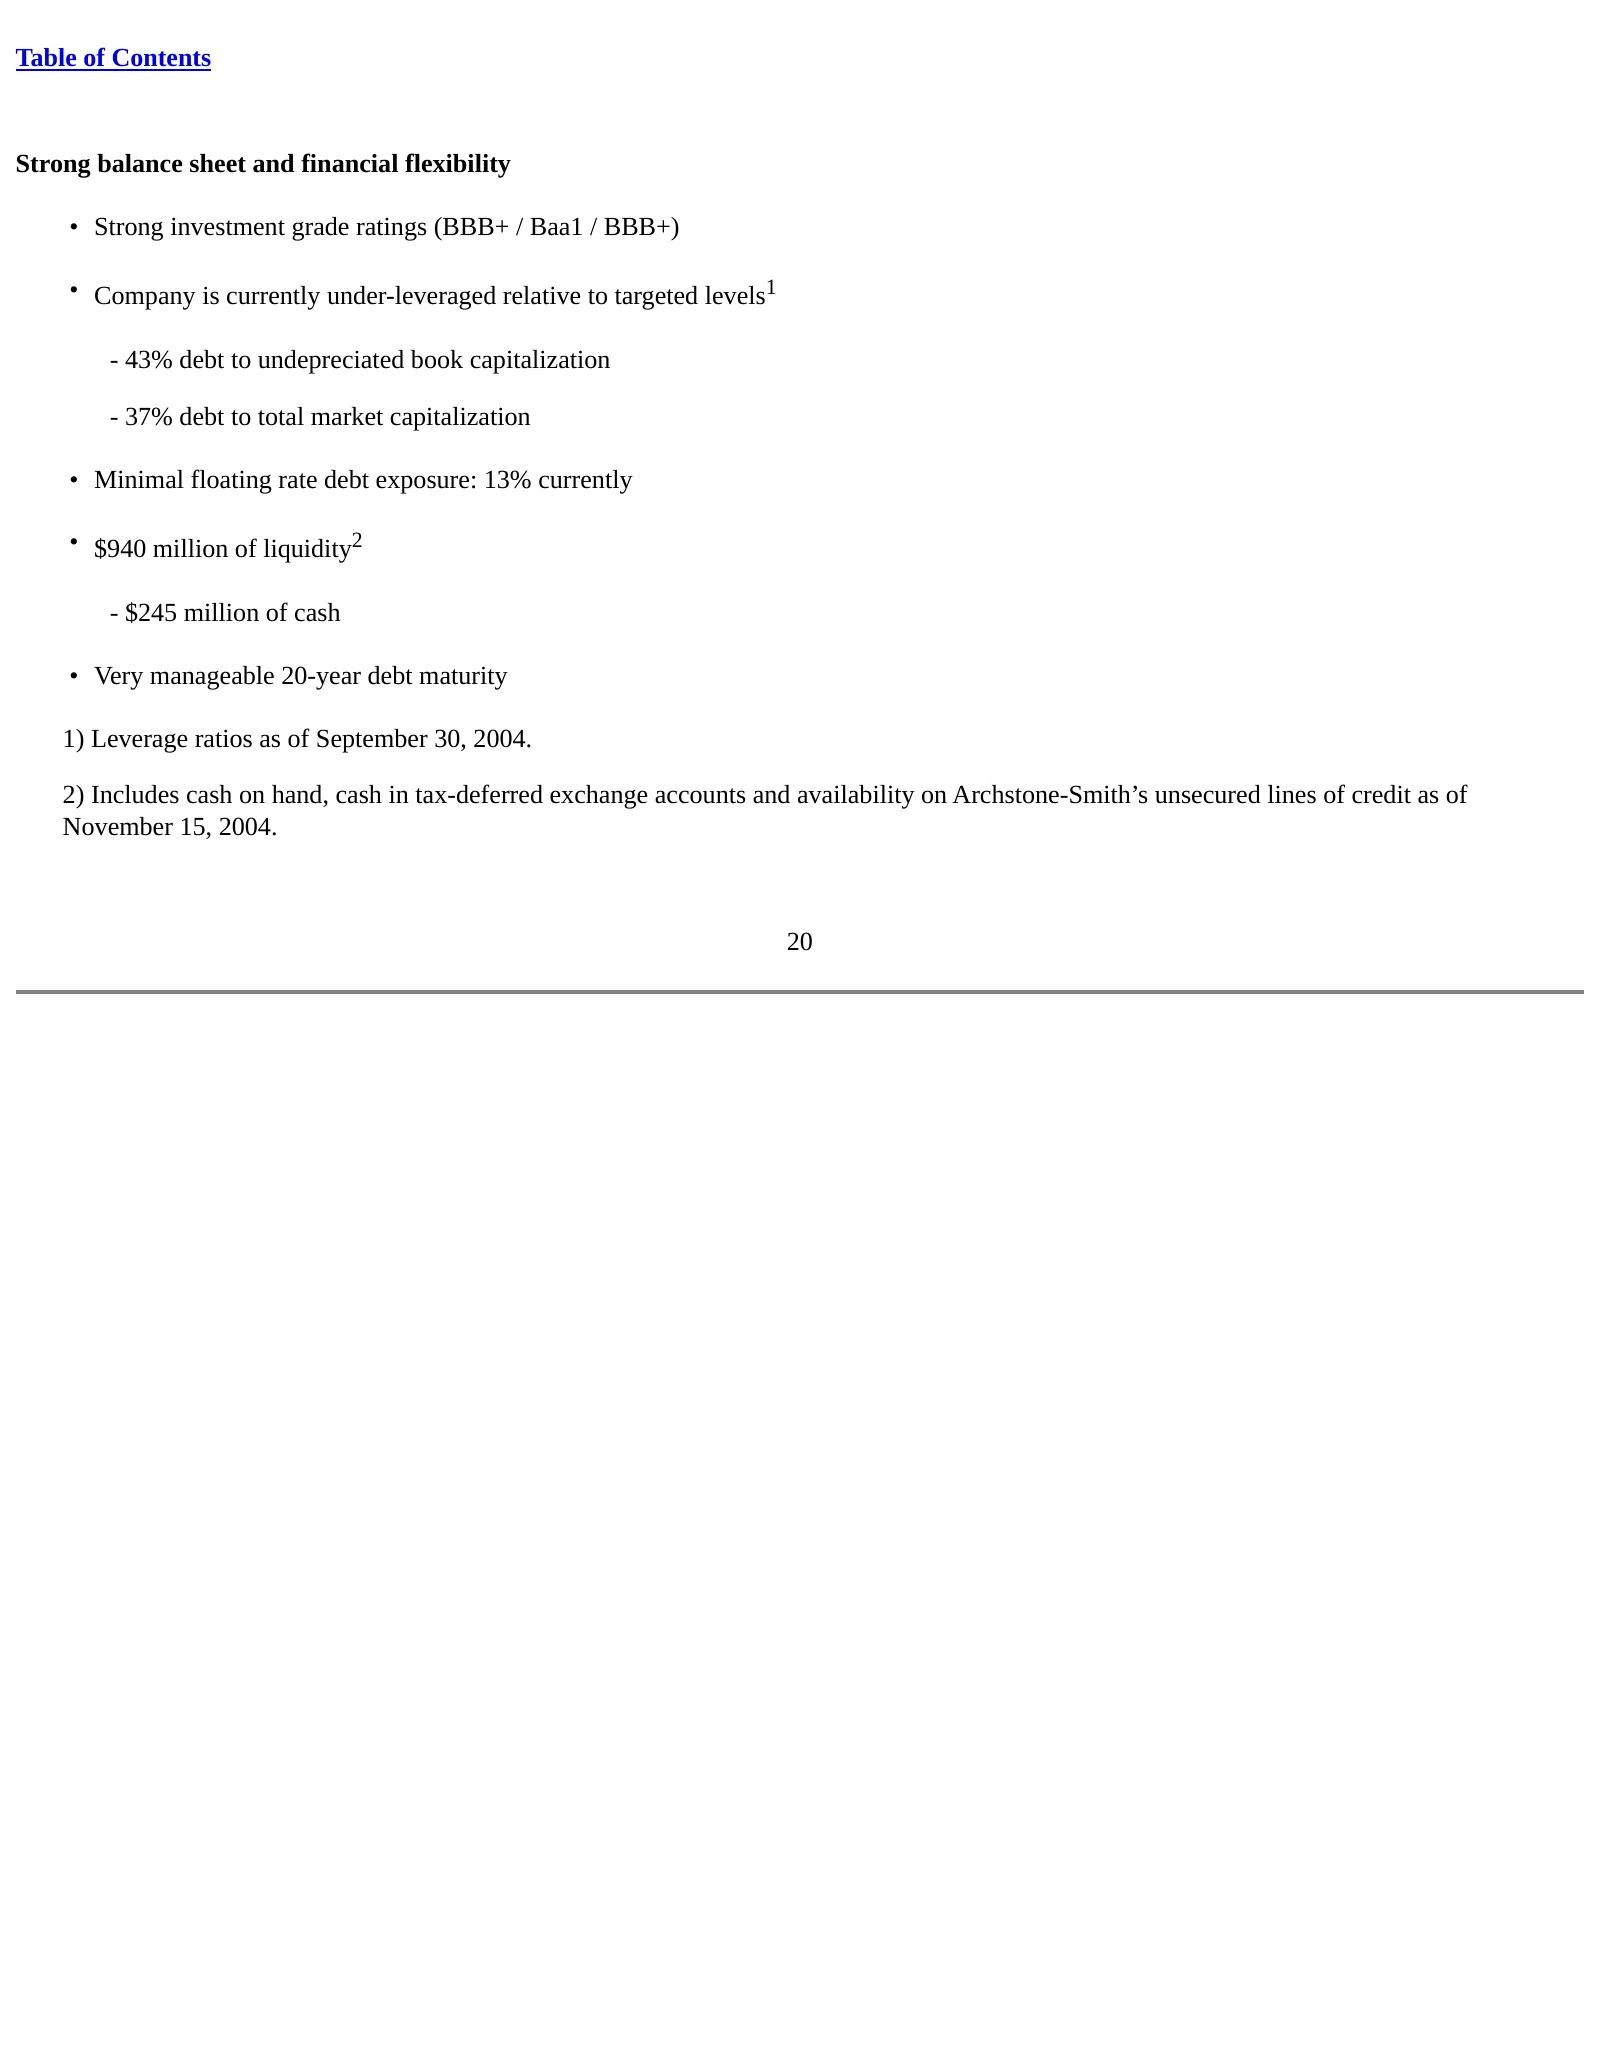
Table of Contents Strong balance sheet and financial flexibility • Strong investment grade ratings (BBB+ / Baa1 / BBB+) • Company is currently under-leveraged relative to targeted levels1 - 43% debt to undepreciated book capitalization - 37% debt to total market capitalization • Minimal floating rat
Slide 21: Archstone-Smith 2005 growth drivers
Table of Contents Archstone-Smith 2005 growth drivers • Anticipate substantially improved NOI growth • Accretion from positive spread investing • Recurring Ameriton gains – $0.07 of anticipated FFO from 2005 sales already under contract with non-refundable earnest money hard - Plus significant incre

Slide 22: Archstone-Smith goals
Table of Contents Archstone-Smith goals • Trade well above our estimate of net asset value per share • Reinvent our industry • Build the Dominant Operating Platform • Respected member of corporate America – not just a great real estate company 22

Slide 23: Appendix
Table of Contents Archstone-Smith Appendix 23
Slide 24: A brief history: Top markets in 1995
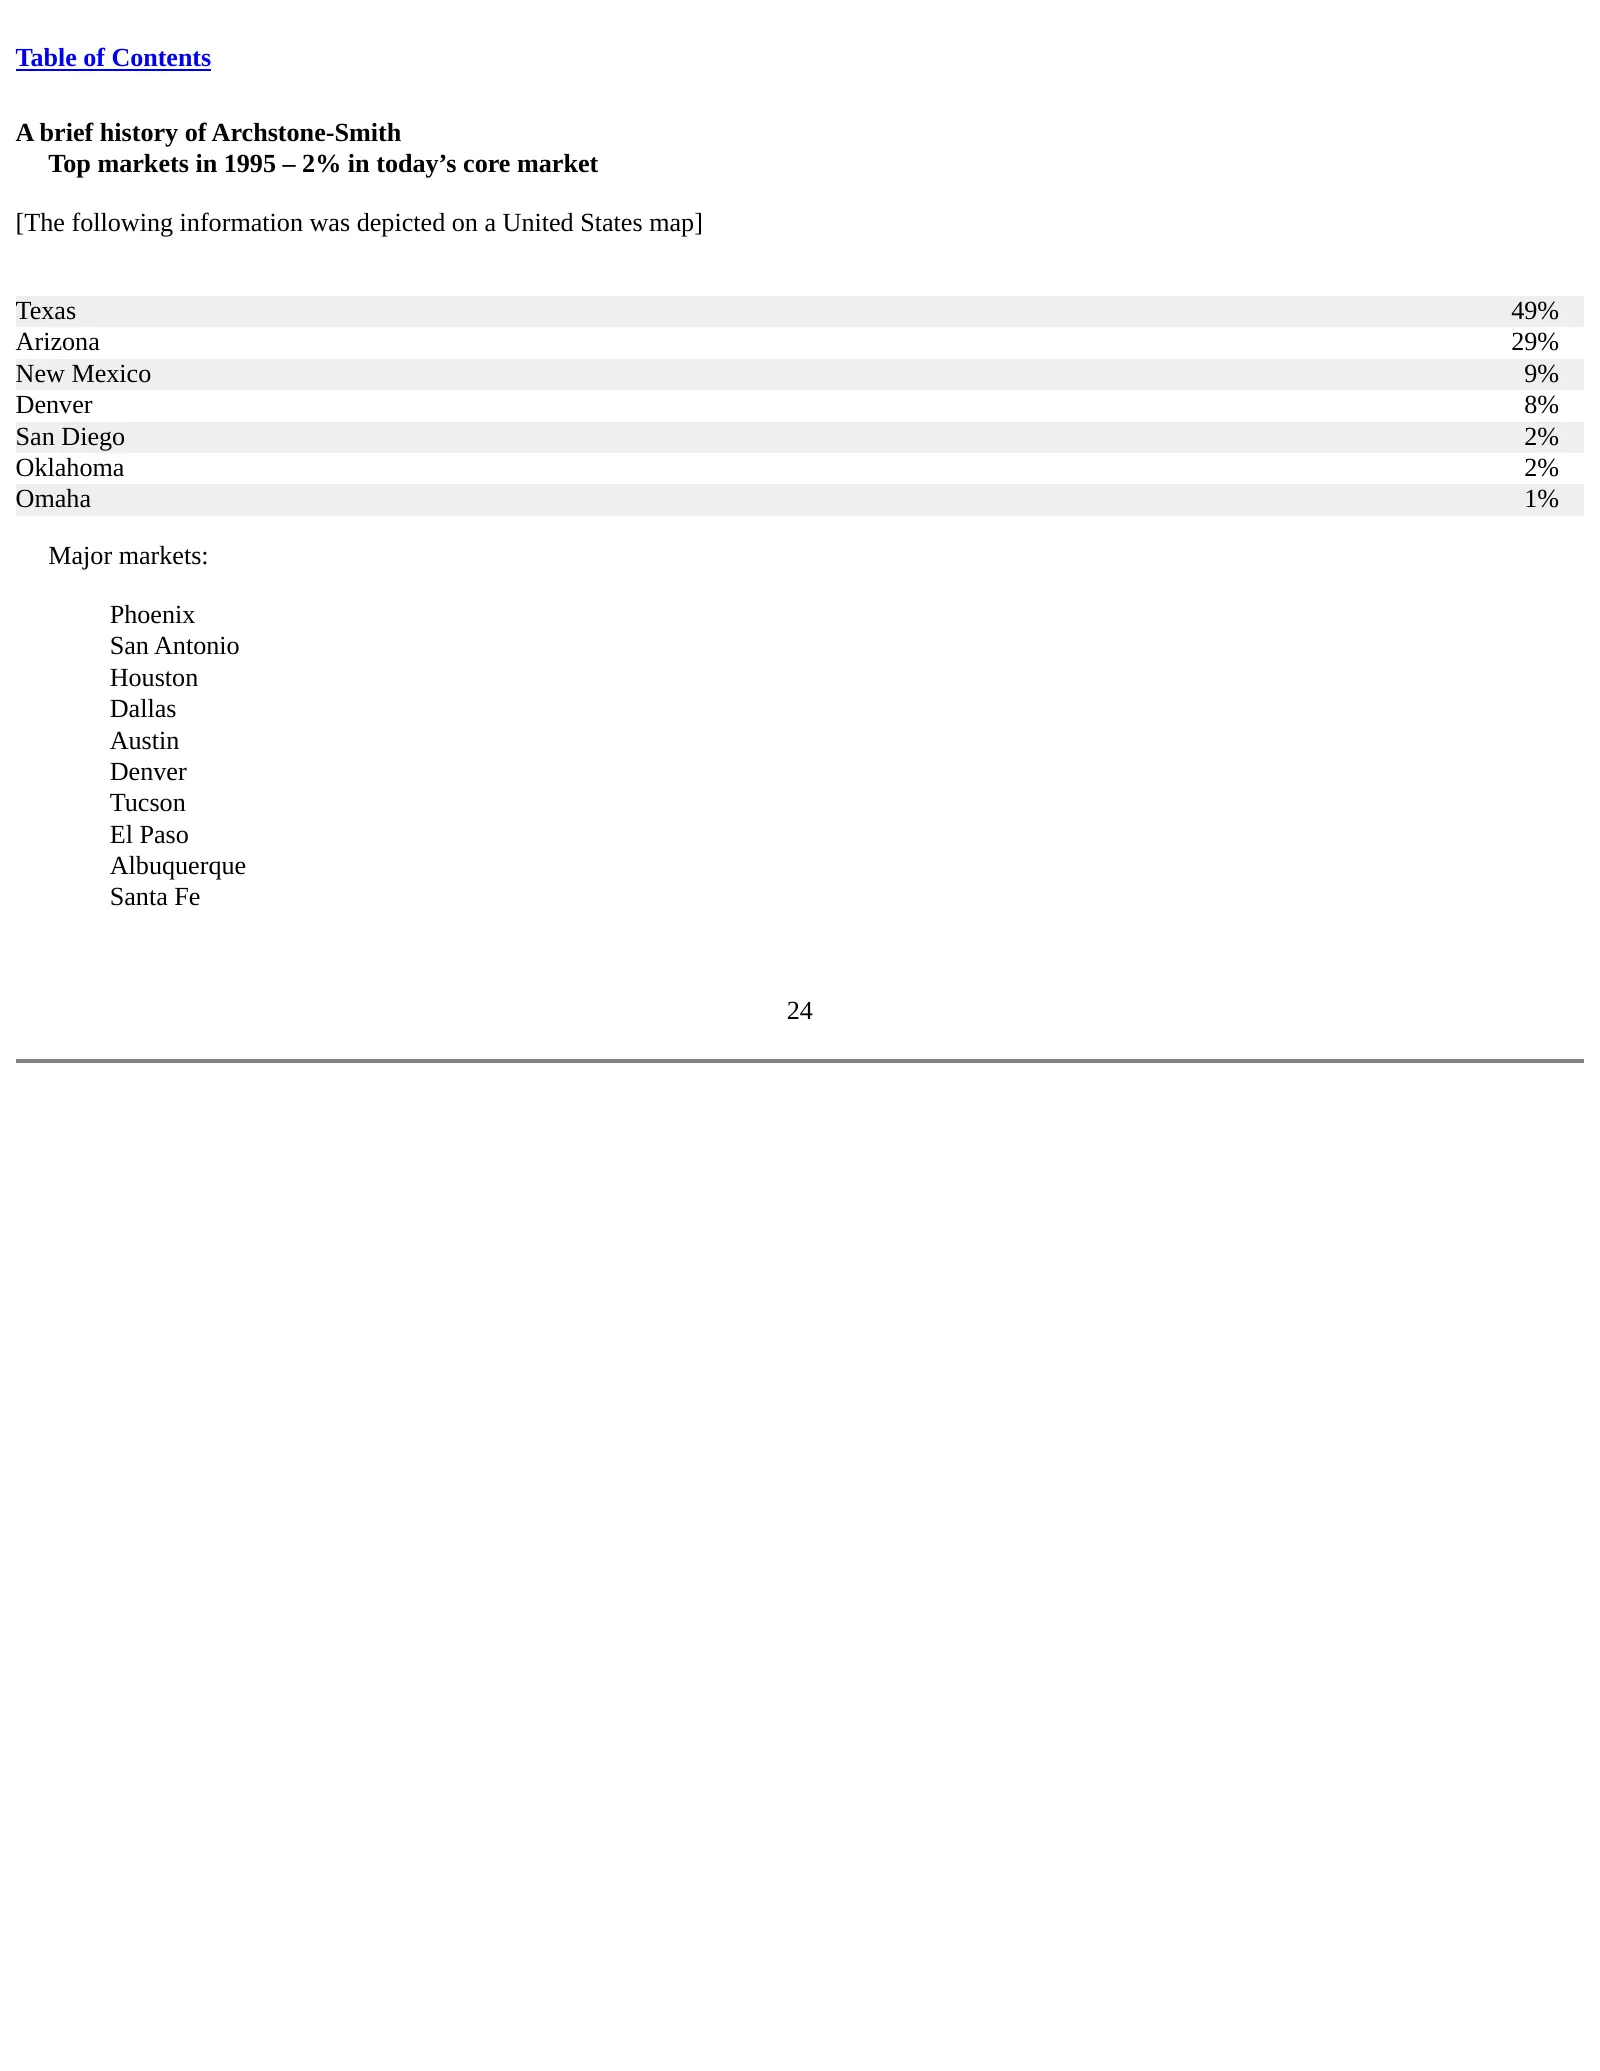
Table of Contents A brief history of Archstone-Smith Top markets in 1995 – 2% in today’s core market [The following information was depicted on a United States map] Texas 49% Arizona 29% New Mexico 9% Denver 8% San Diego 2% Oklahoma 2% Omaha 1% Major markets: Phoenix San Antonio Houston Dallas Austi
Slide 25: A brief history: Our assets in 1995
Table of Contents A brief history of Archstone-Smith Our assets in 1995 • Photo of Craycroft Gardens, Tucson • Photo of Tigua Village, El Paso • Photo of Foxfire, Phoenix • Photo of Cielo Vista, El Paso • Photo of Las Flores, El Paso • Photo of Rancho Mirage, San Antonio 25
Slide 26: A brief history: Our assets today
Table of Contents A brief history of Archstone-Smith Our assets today • Photo of One Superior Place, Chicago • Photo of Archstone Bear Hill, Boston • Photo of Ballston Place, Washington, D.C. area • Photo of Archstone Playa del Rey, Los Angeles • Photo of Alban Towers, Washington, DC • Photo of The
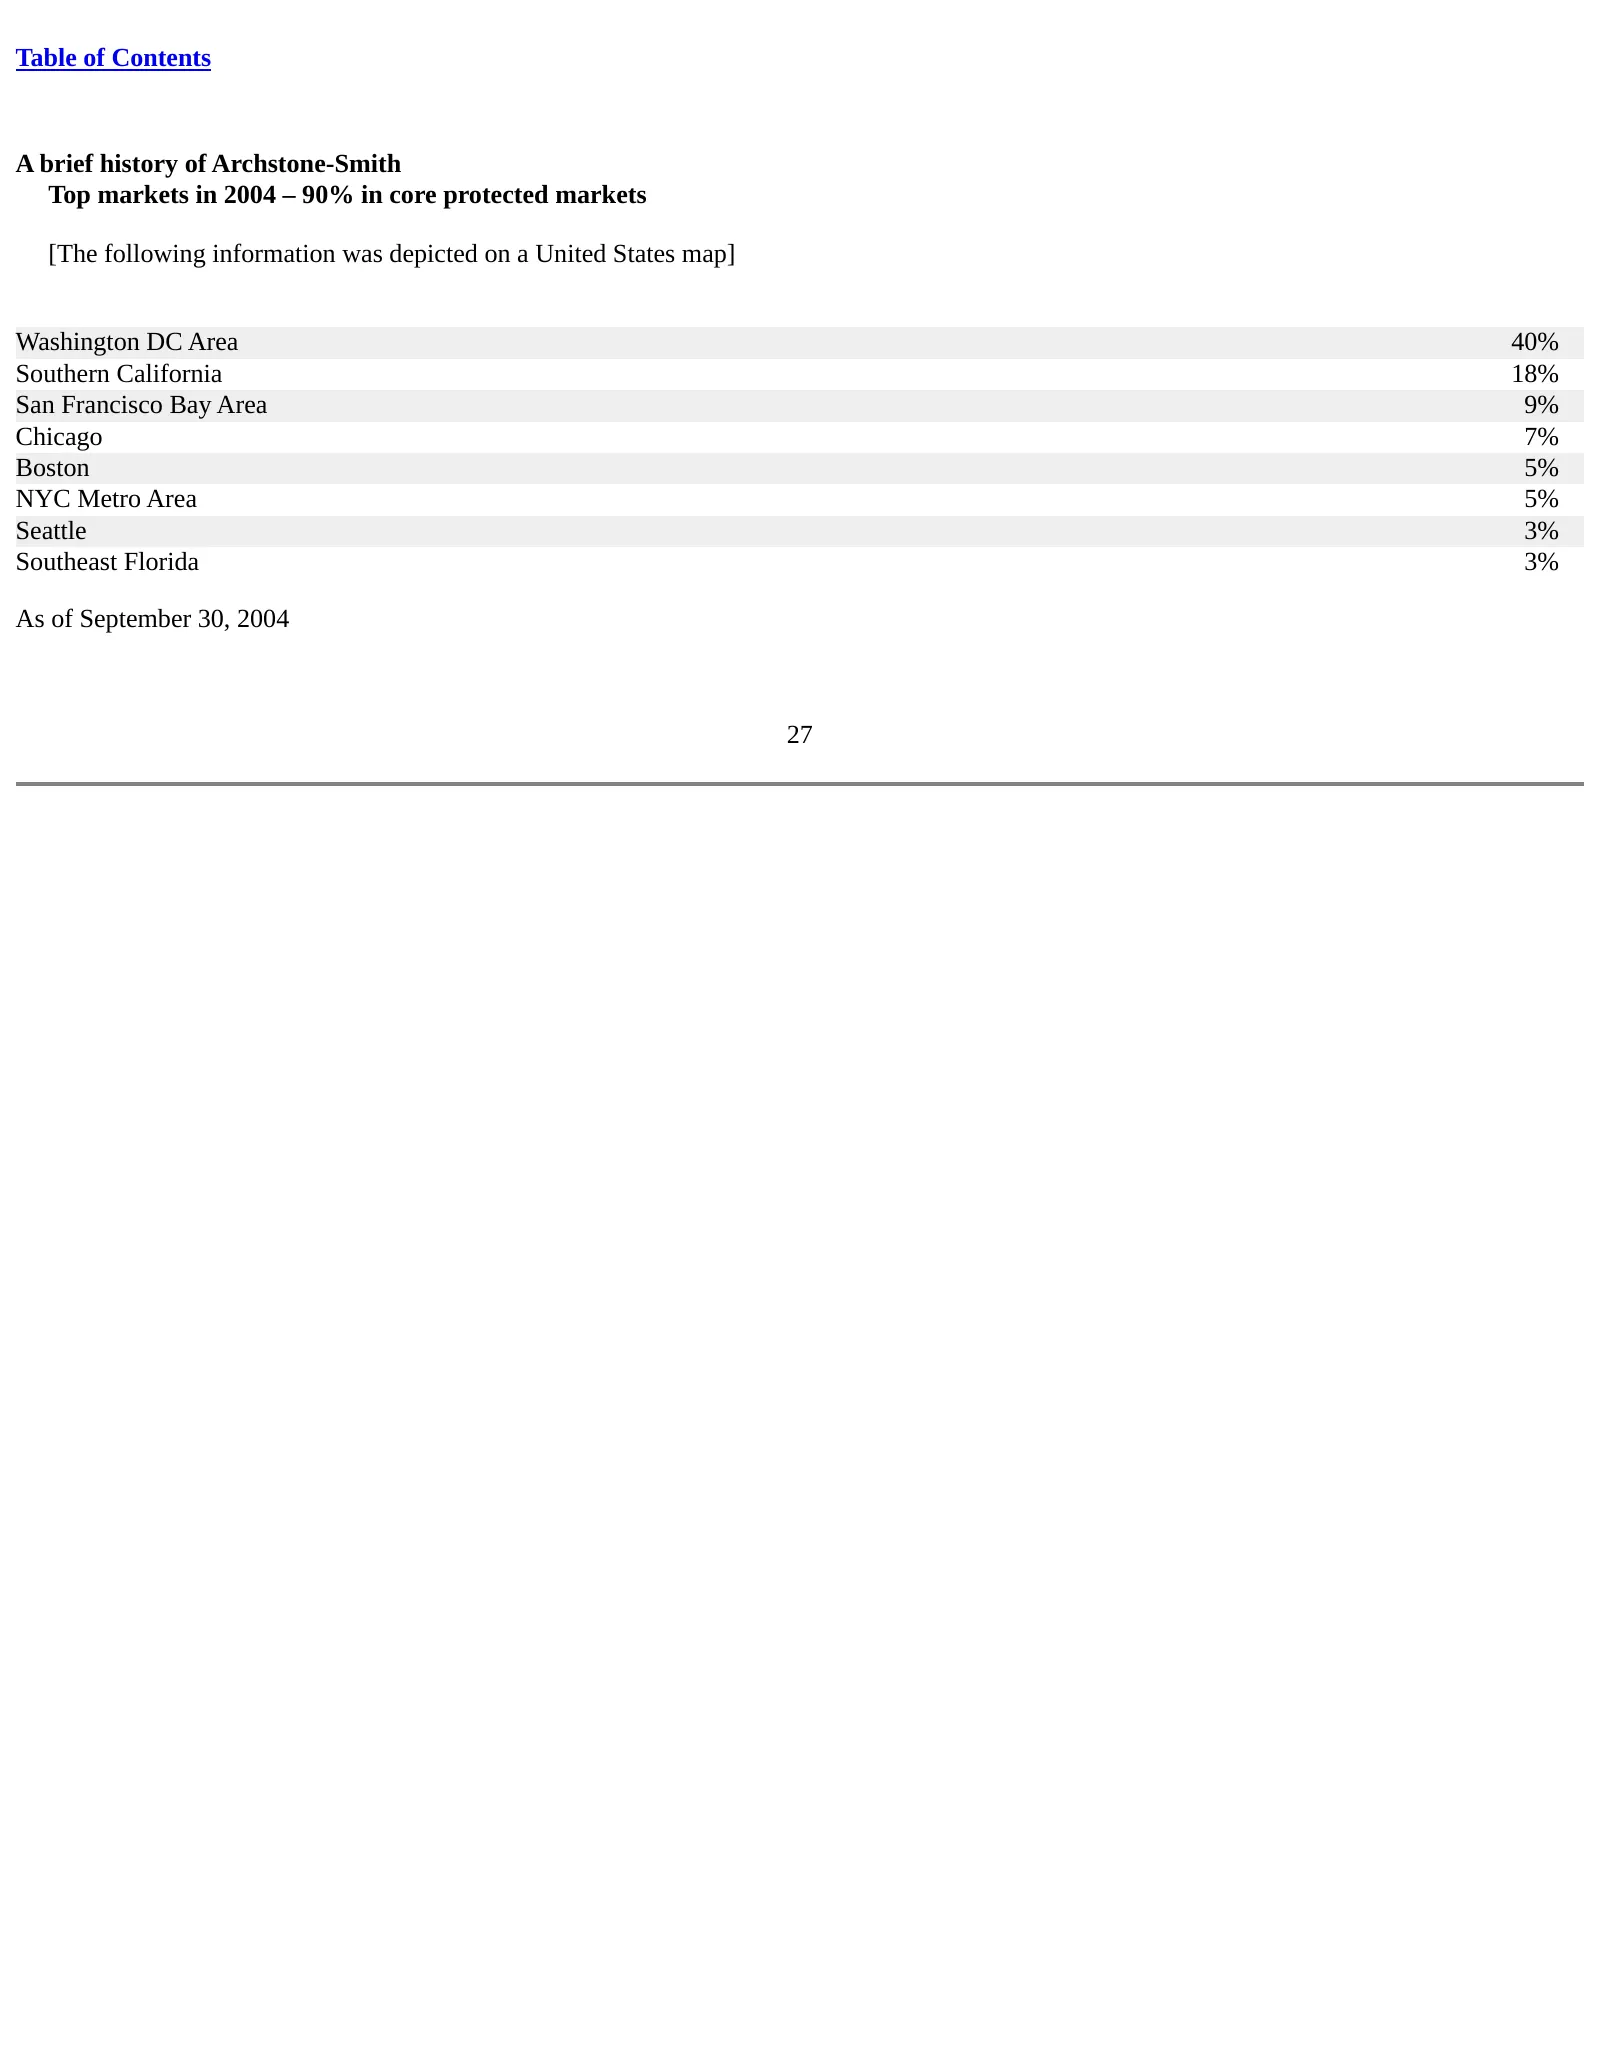
Slide 27: A brief history: Top markets in 2004
Table of Contents A brief history of Archstone-Smith Top markets in 2004 – 90% in core protected markets [The following information was depicted on a United States map] Washington DC Area 40% Southern California 18% San Francisco Bay Area 9% Chicago 7% Boston 5% NYC Metro Area 5% Seattle 3% Southeas
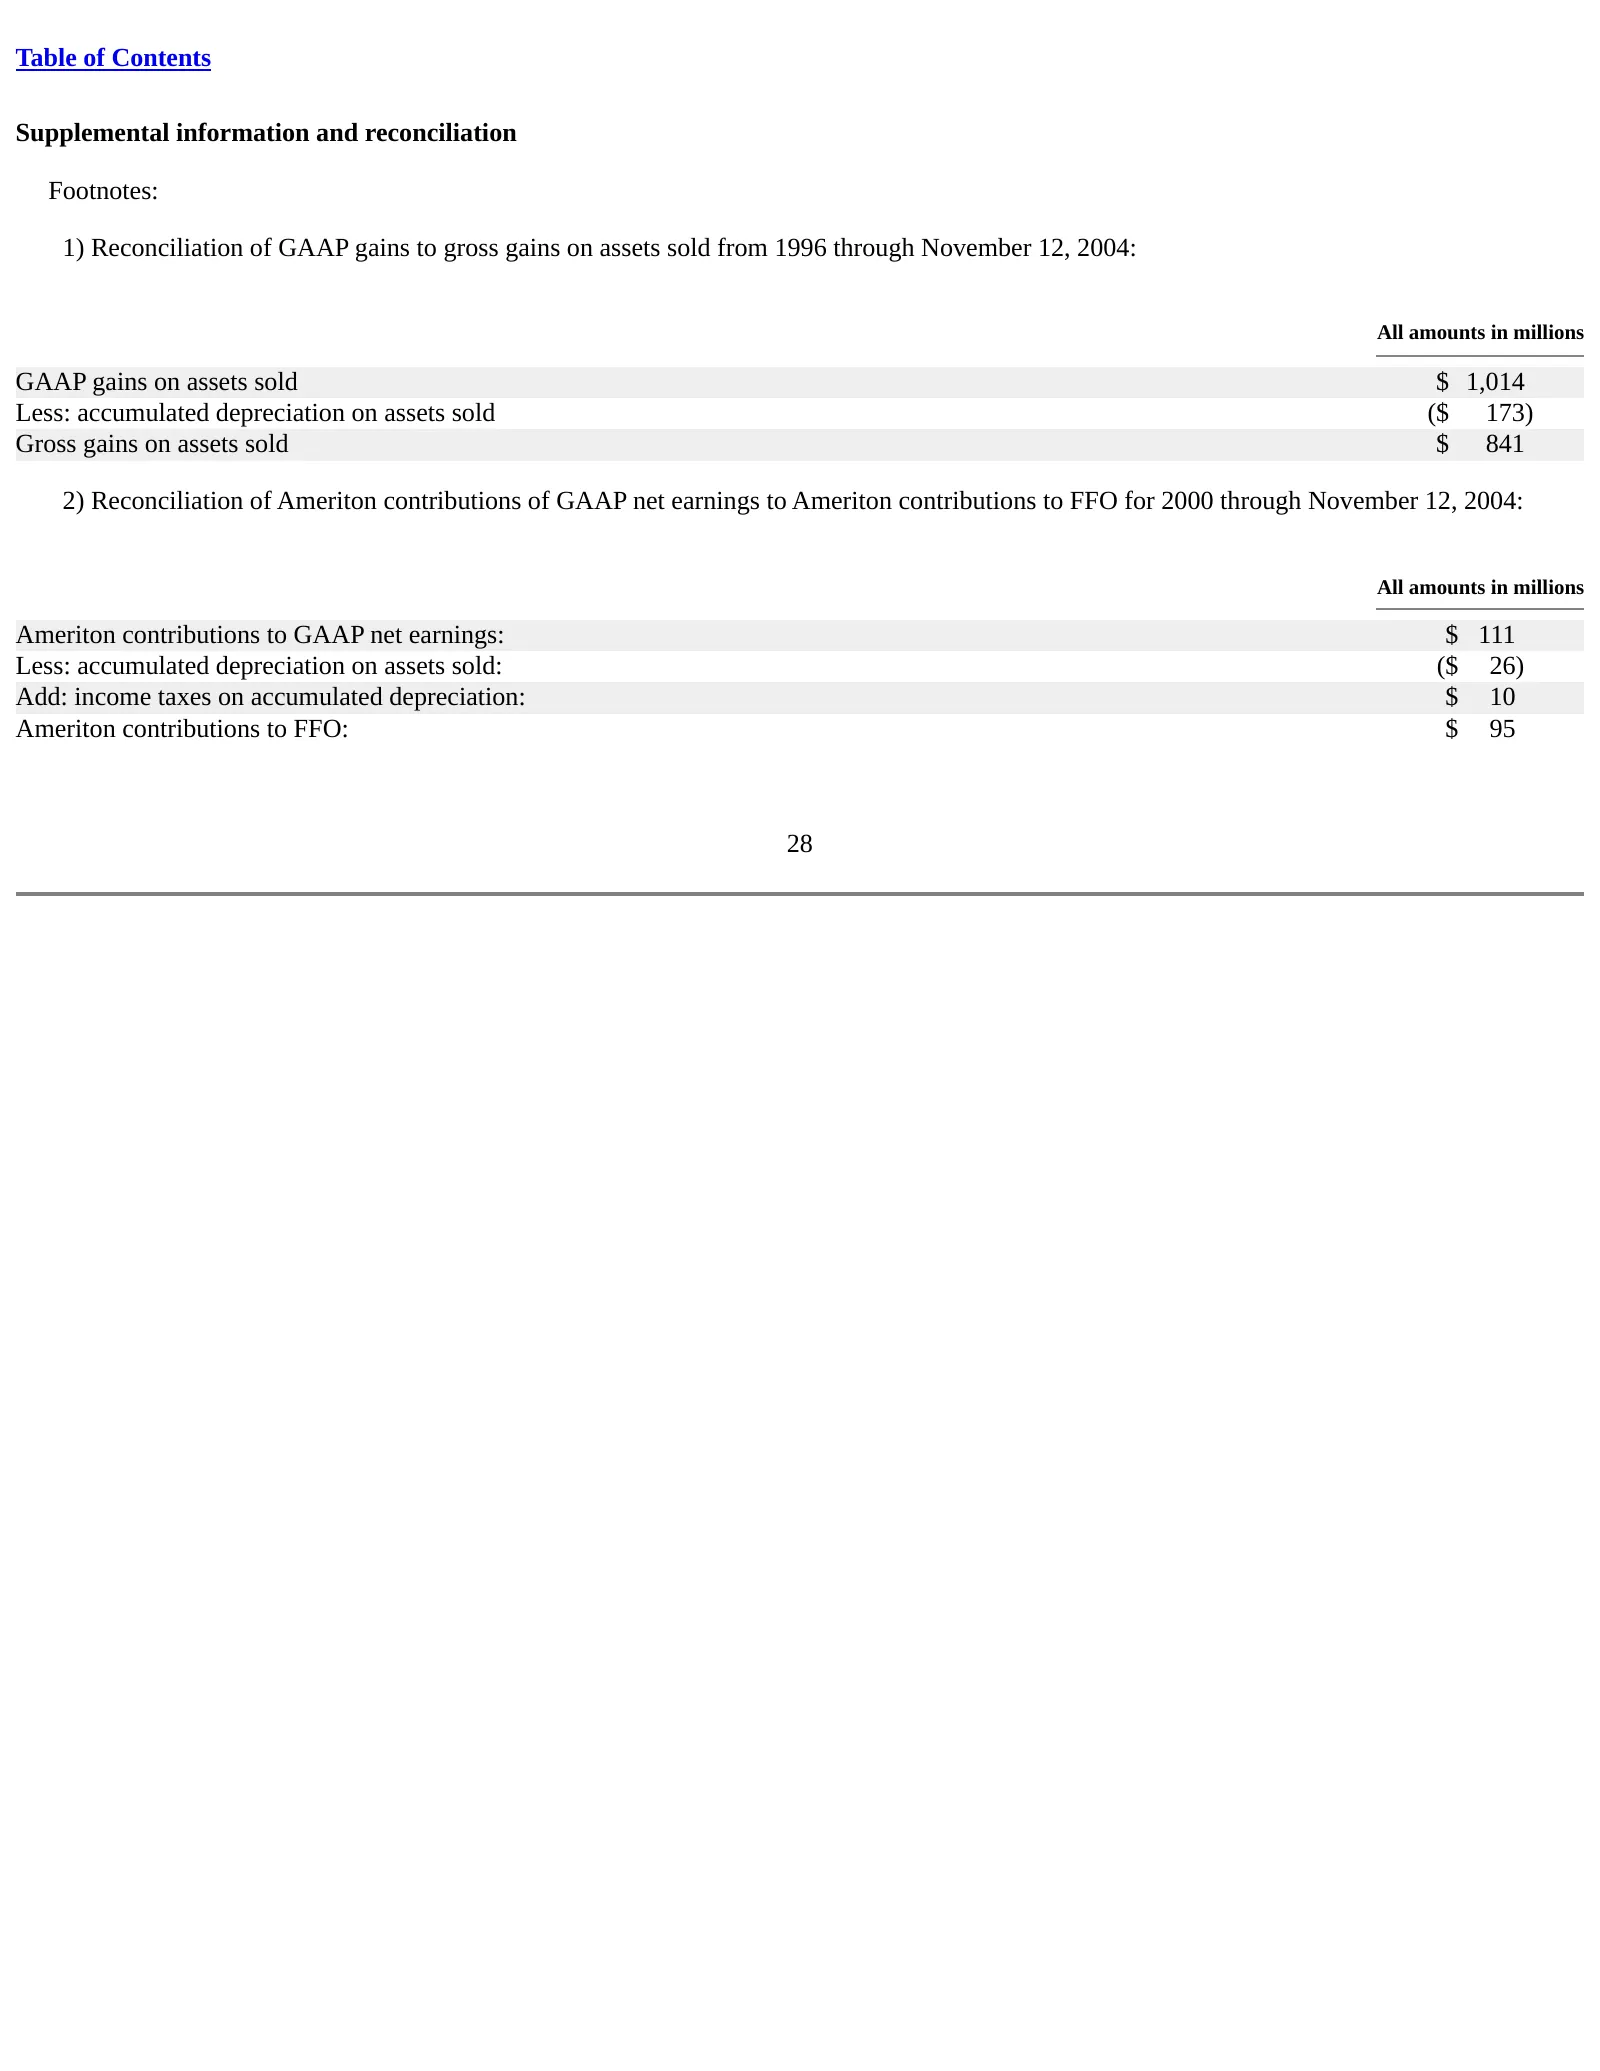
Slide 28: Supplemental information and reconciliation
Table of Contents Supplemental information and reconciliation Footnotes: 1) Reconciliation of GAAP gains to gross gains on assets sold from 1996 through November 12, 2004: All amounts in millions GAAP gains on assets sold $ 1,014 Less: accumulated depreciation on assets sold ($ 173) Gross gains on a
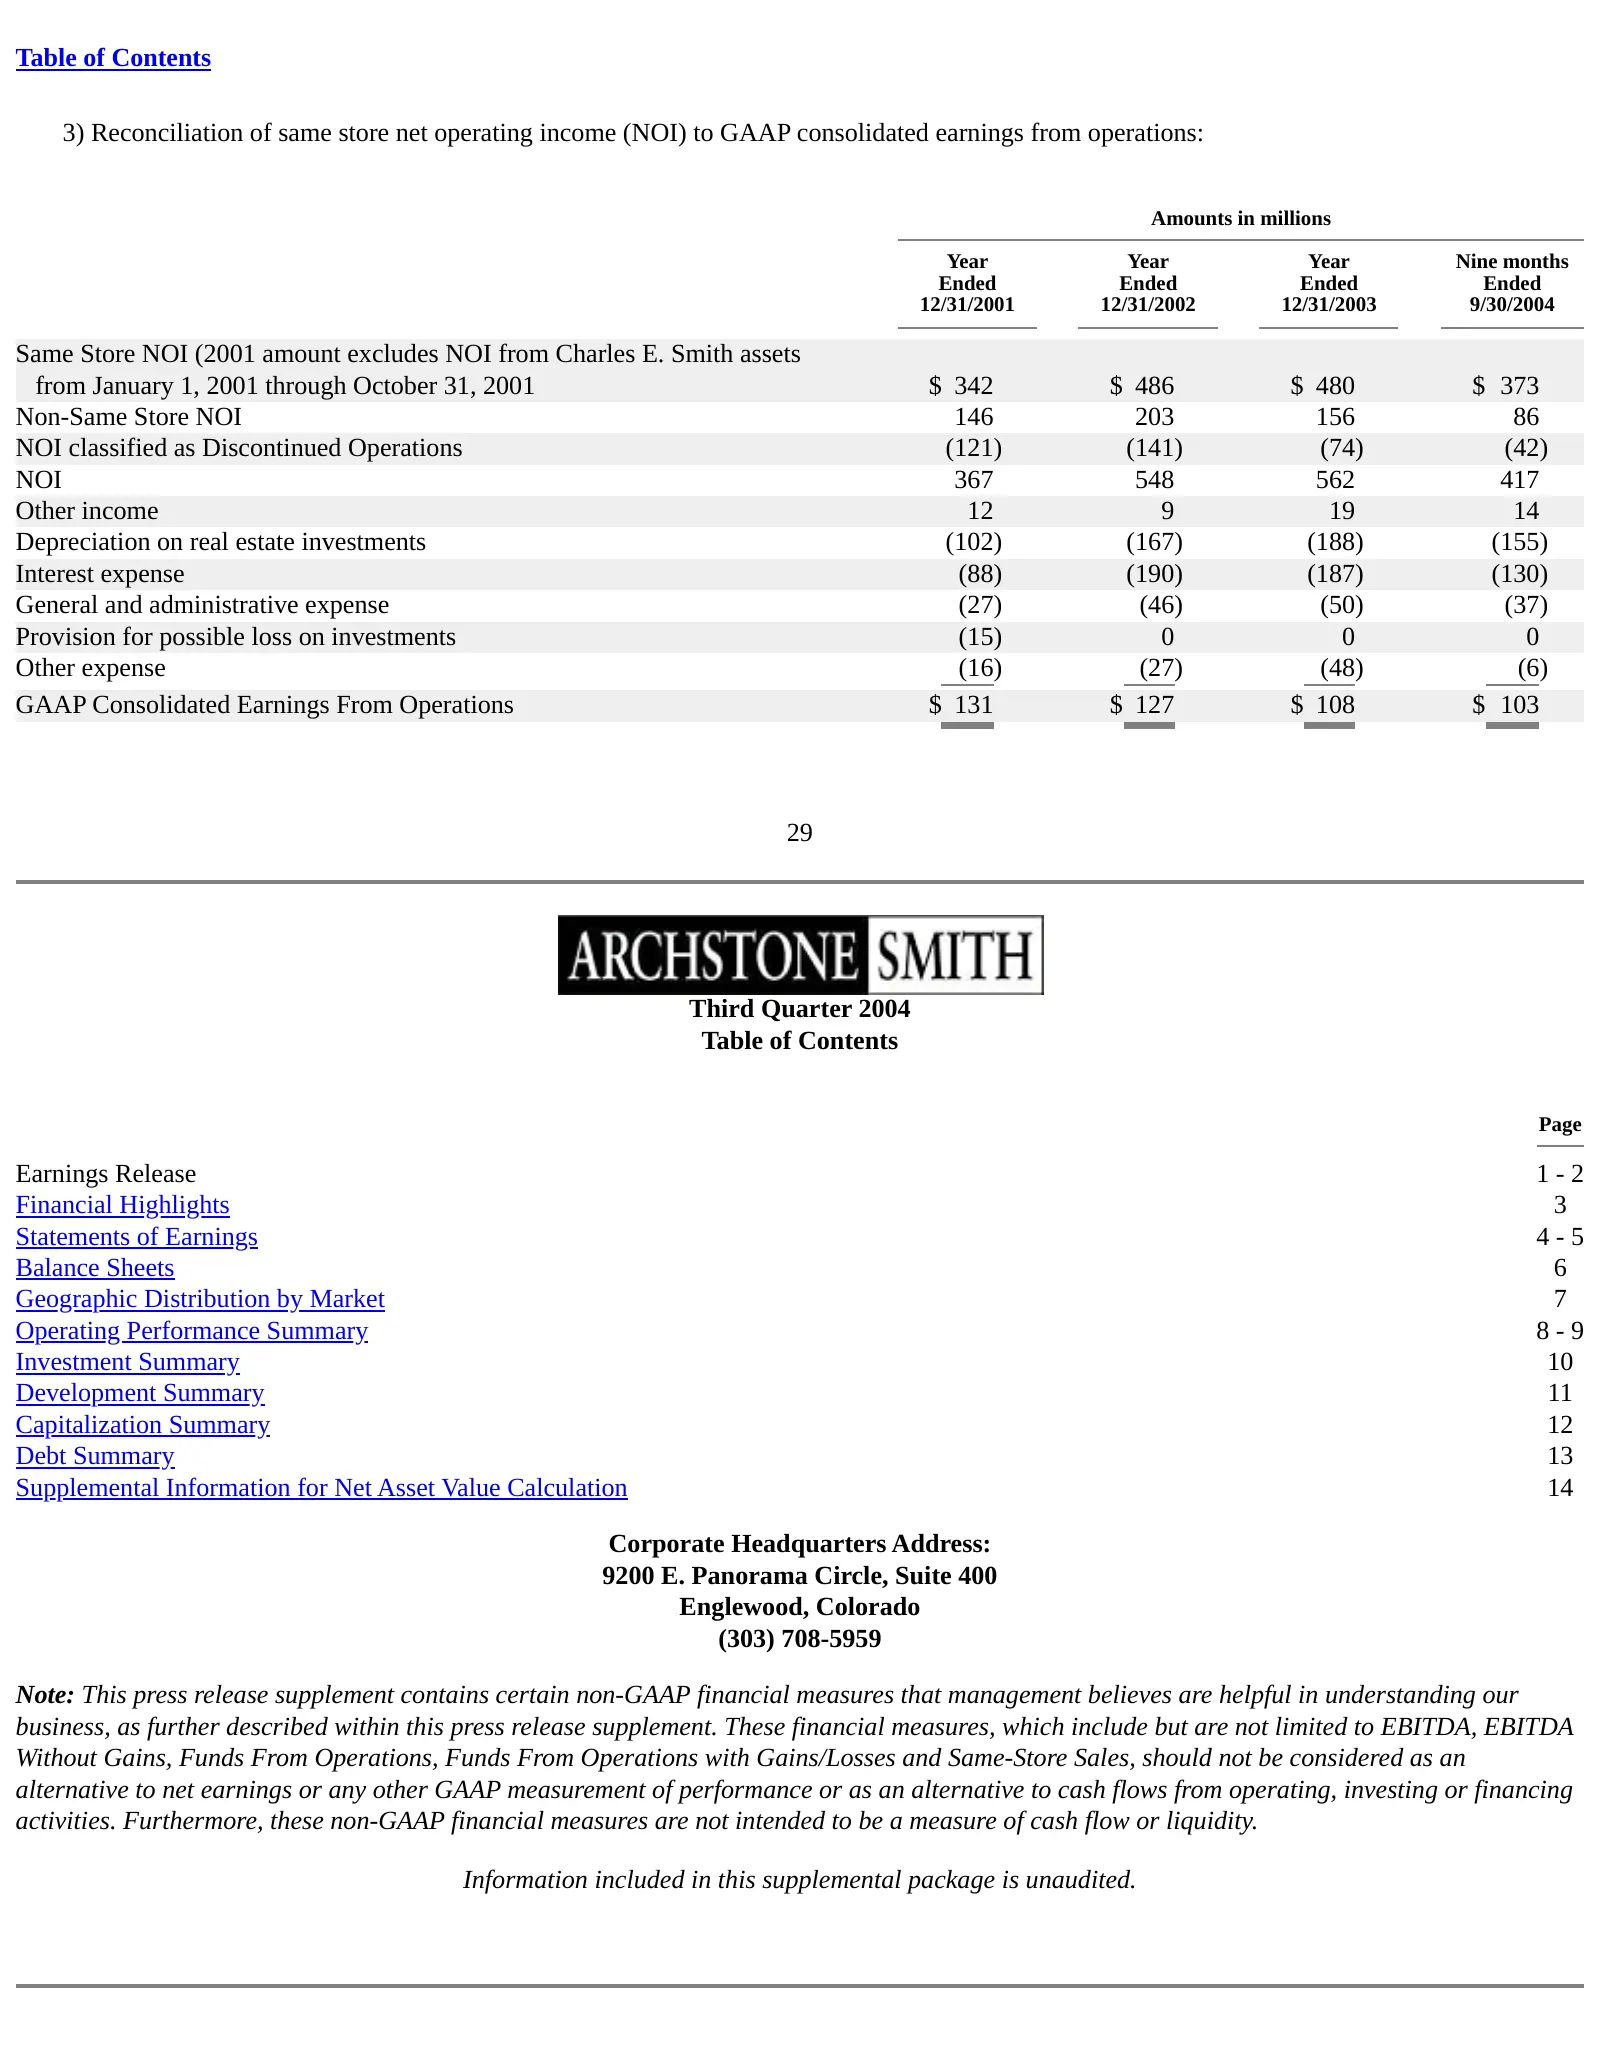
Slide 29: Reconciliation of same store NOI to GAAP
Table of Contents 3) Reconciliation of same store net operating income (NOI) to GAAP consolidated earnings from operations: Amounts in millions Year Year Year Nine months Ended Ended Ended Ended 12/31/2001 12/31/2002 12/31/2003 9/30/2004 Same Store NOI (2001 amount excludes NOI from Charles E. Smith
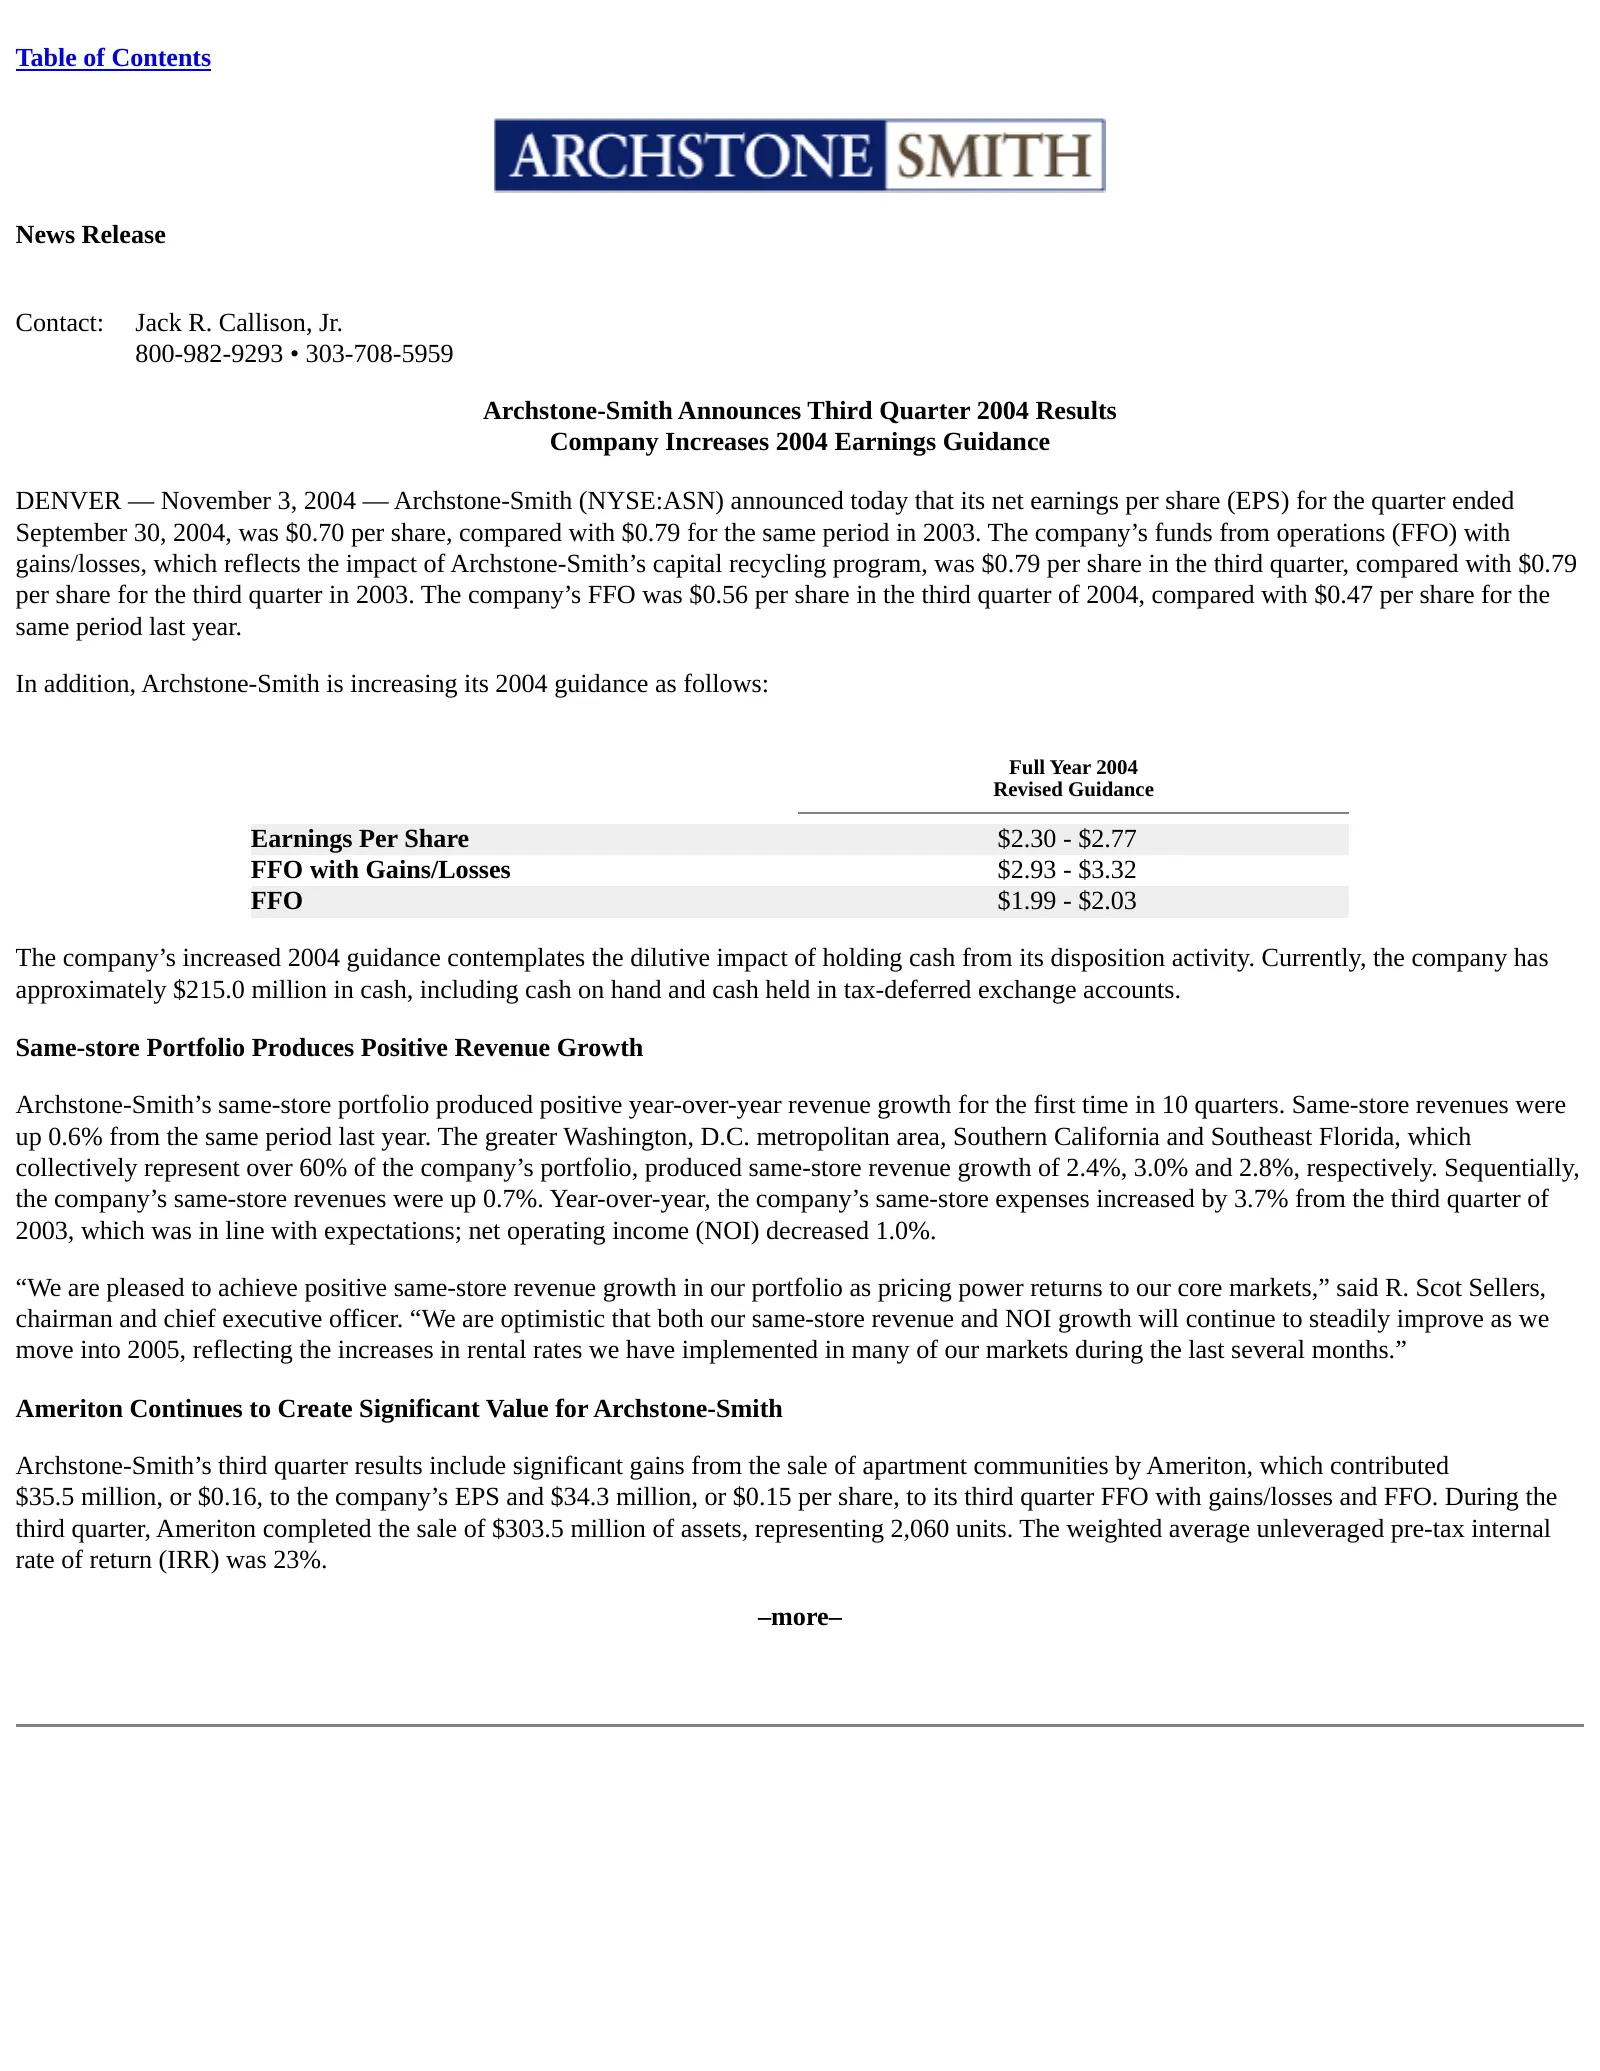
Slide 30: Archstone-Smith Announces Third Quarter 2004 Results
Table of Contents News Release Contact: Jack R. Callison, Jr. 800-982-9293 • 303-708-5959 Archstone-Smith Announces Third Quarter 2004 Results Company Increases 2004 Earnings Guidance DENVER — November 3, 2004 — Archstone-Smith (NYSE:ASN) announced today that its net earnings per share (EPS) for the
Slide 31: Archstone-Smith Reports 3Q04 Results Page 2
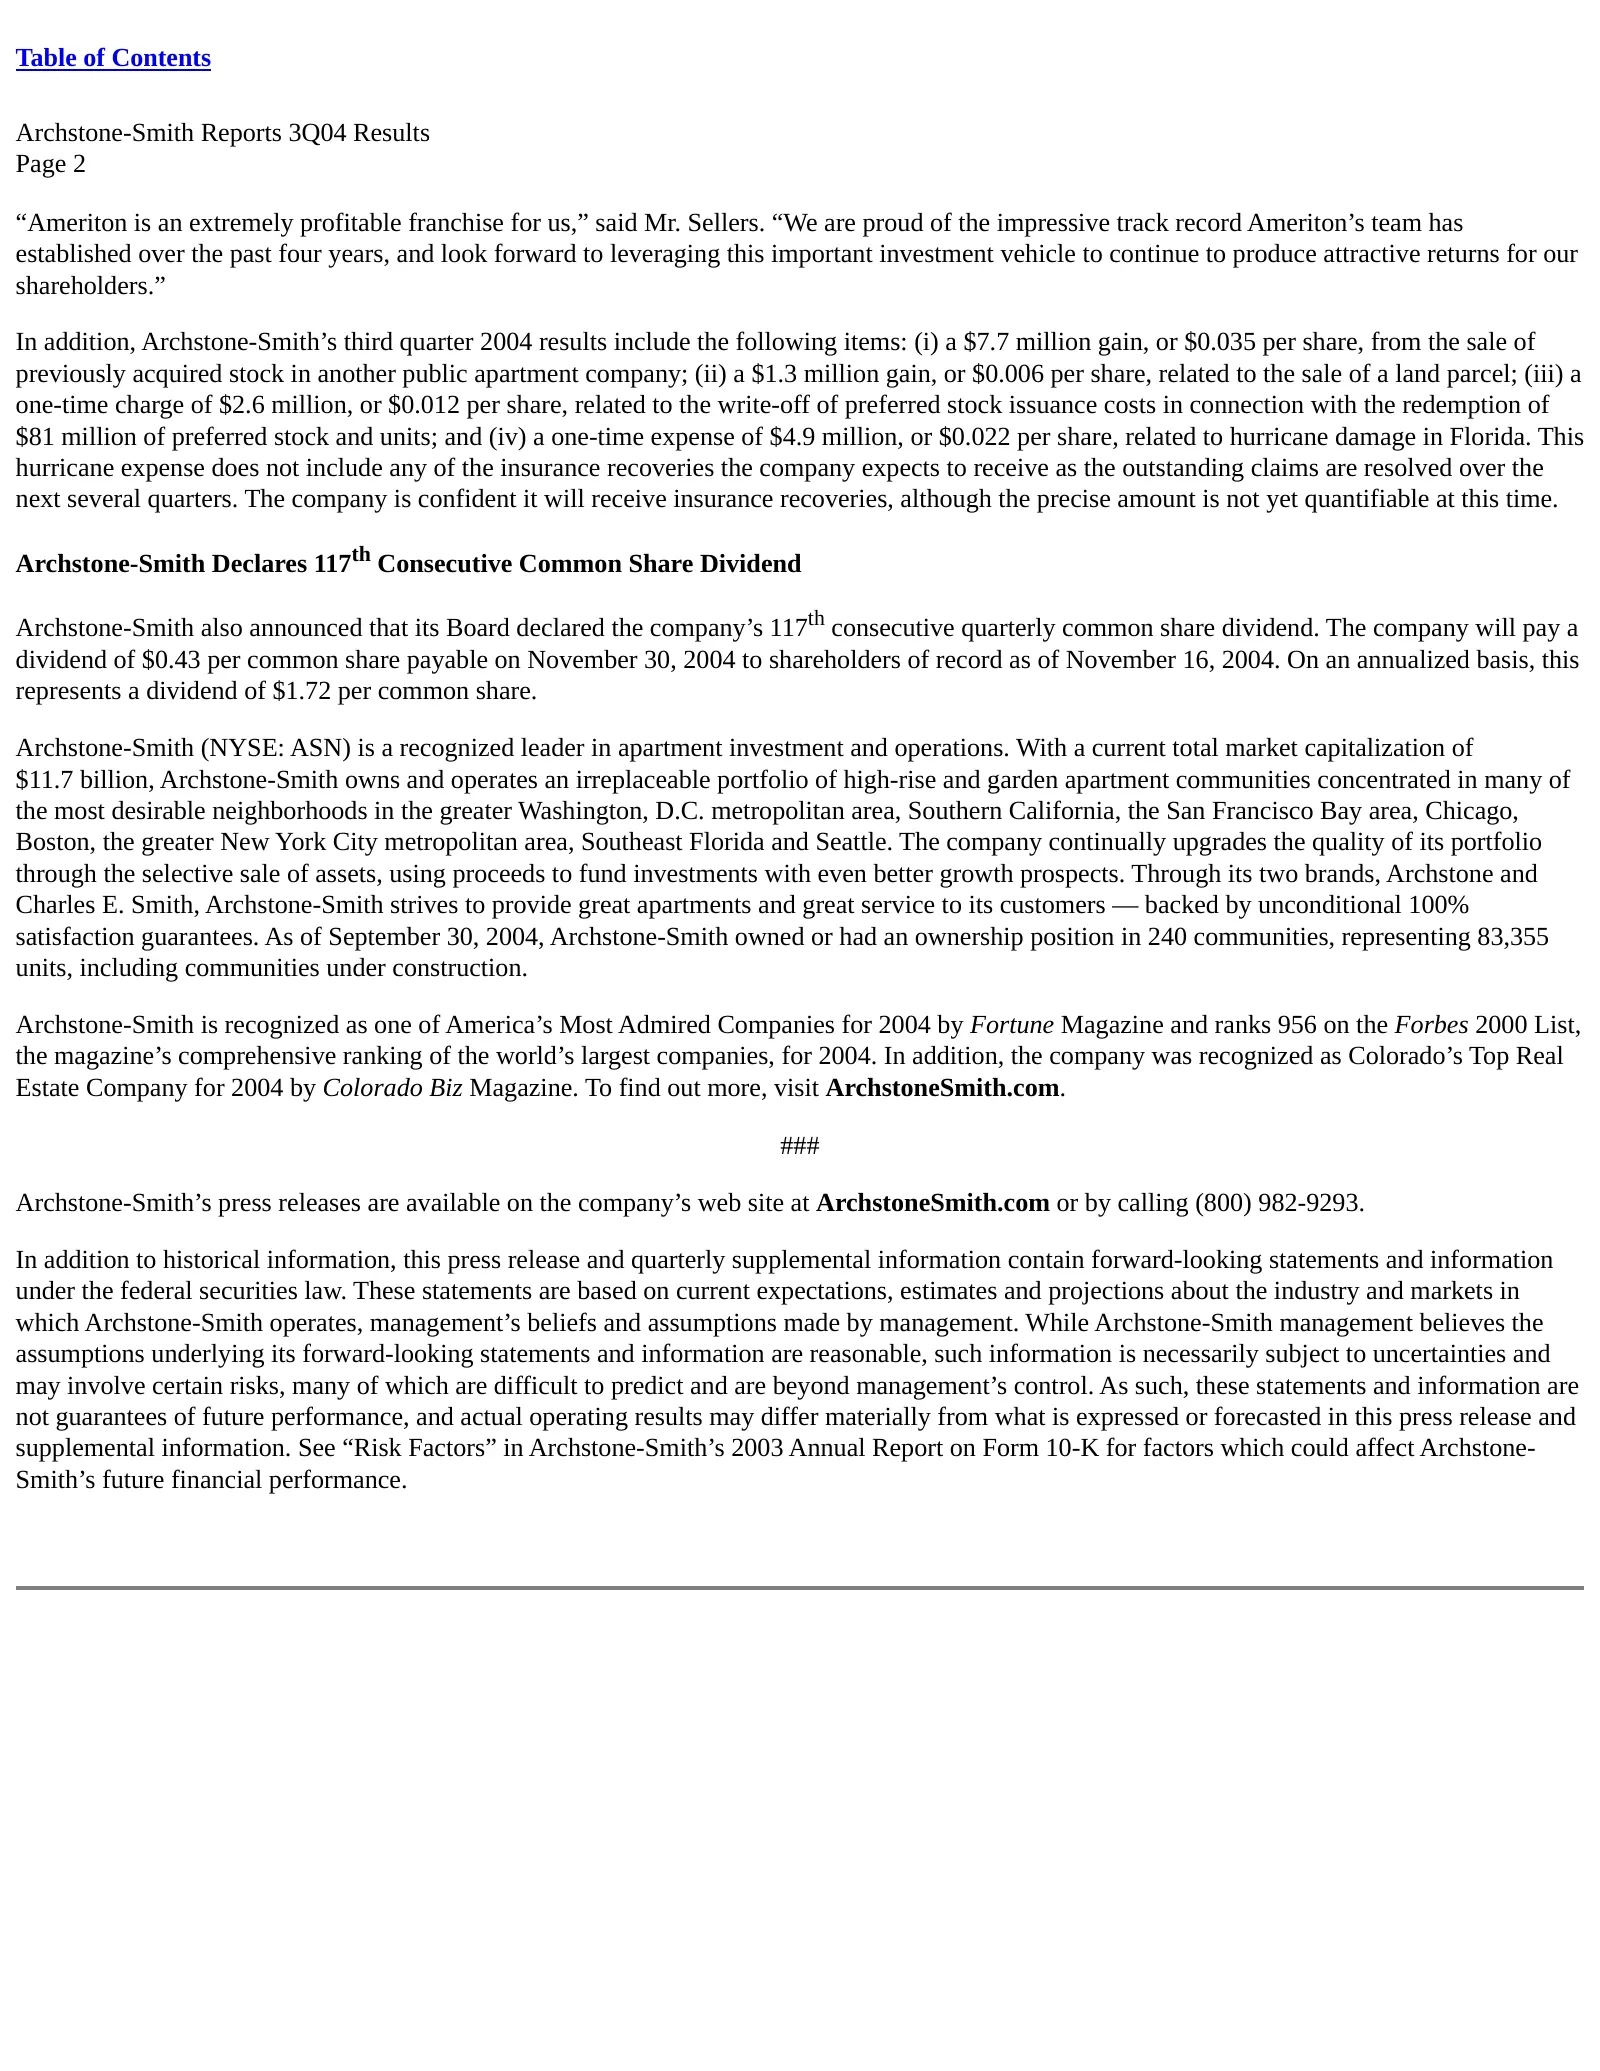
Table of Contents Archstone-Smith Reports 3Q04 Results Page 2 “Ameriton is an extremely profitable franchise for us,” said Mr. Sellers. “We are proud of the impressive track record Ameriton’s team has established over the past four years, and look forward to leveraging this important investment vehi
Slide 32: Third Quarter 2004 Financial Highlights
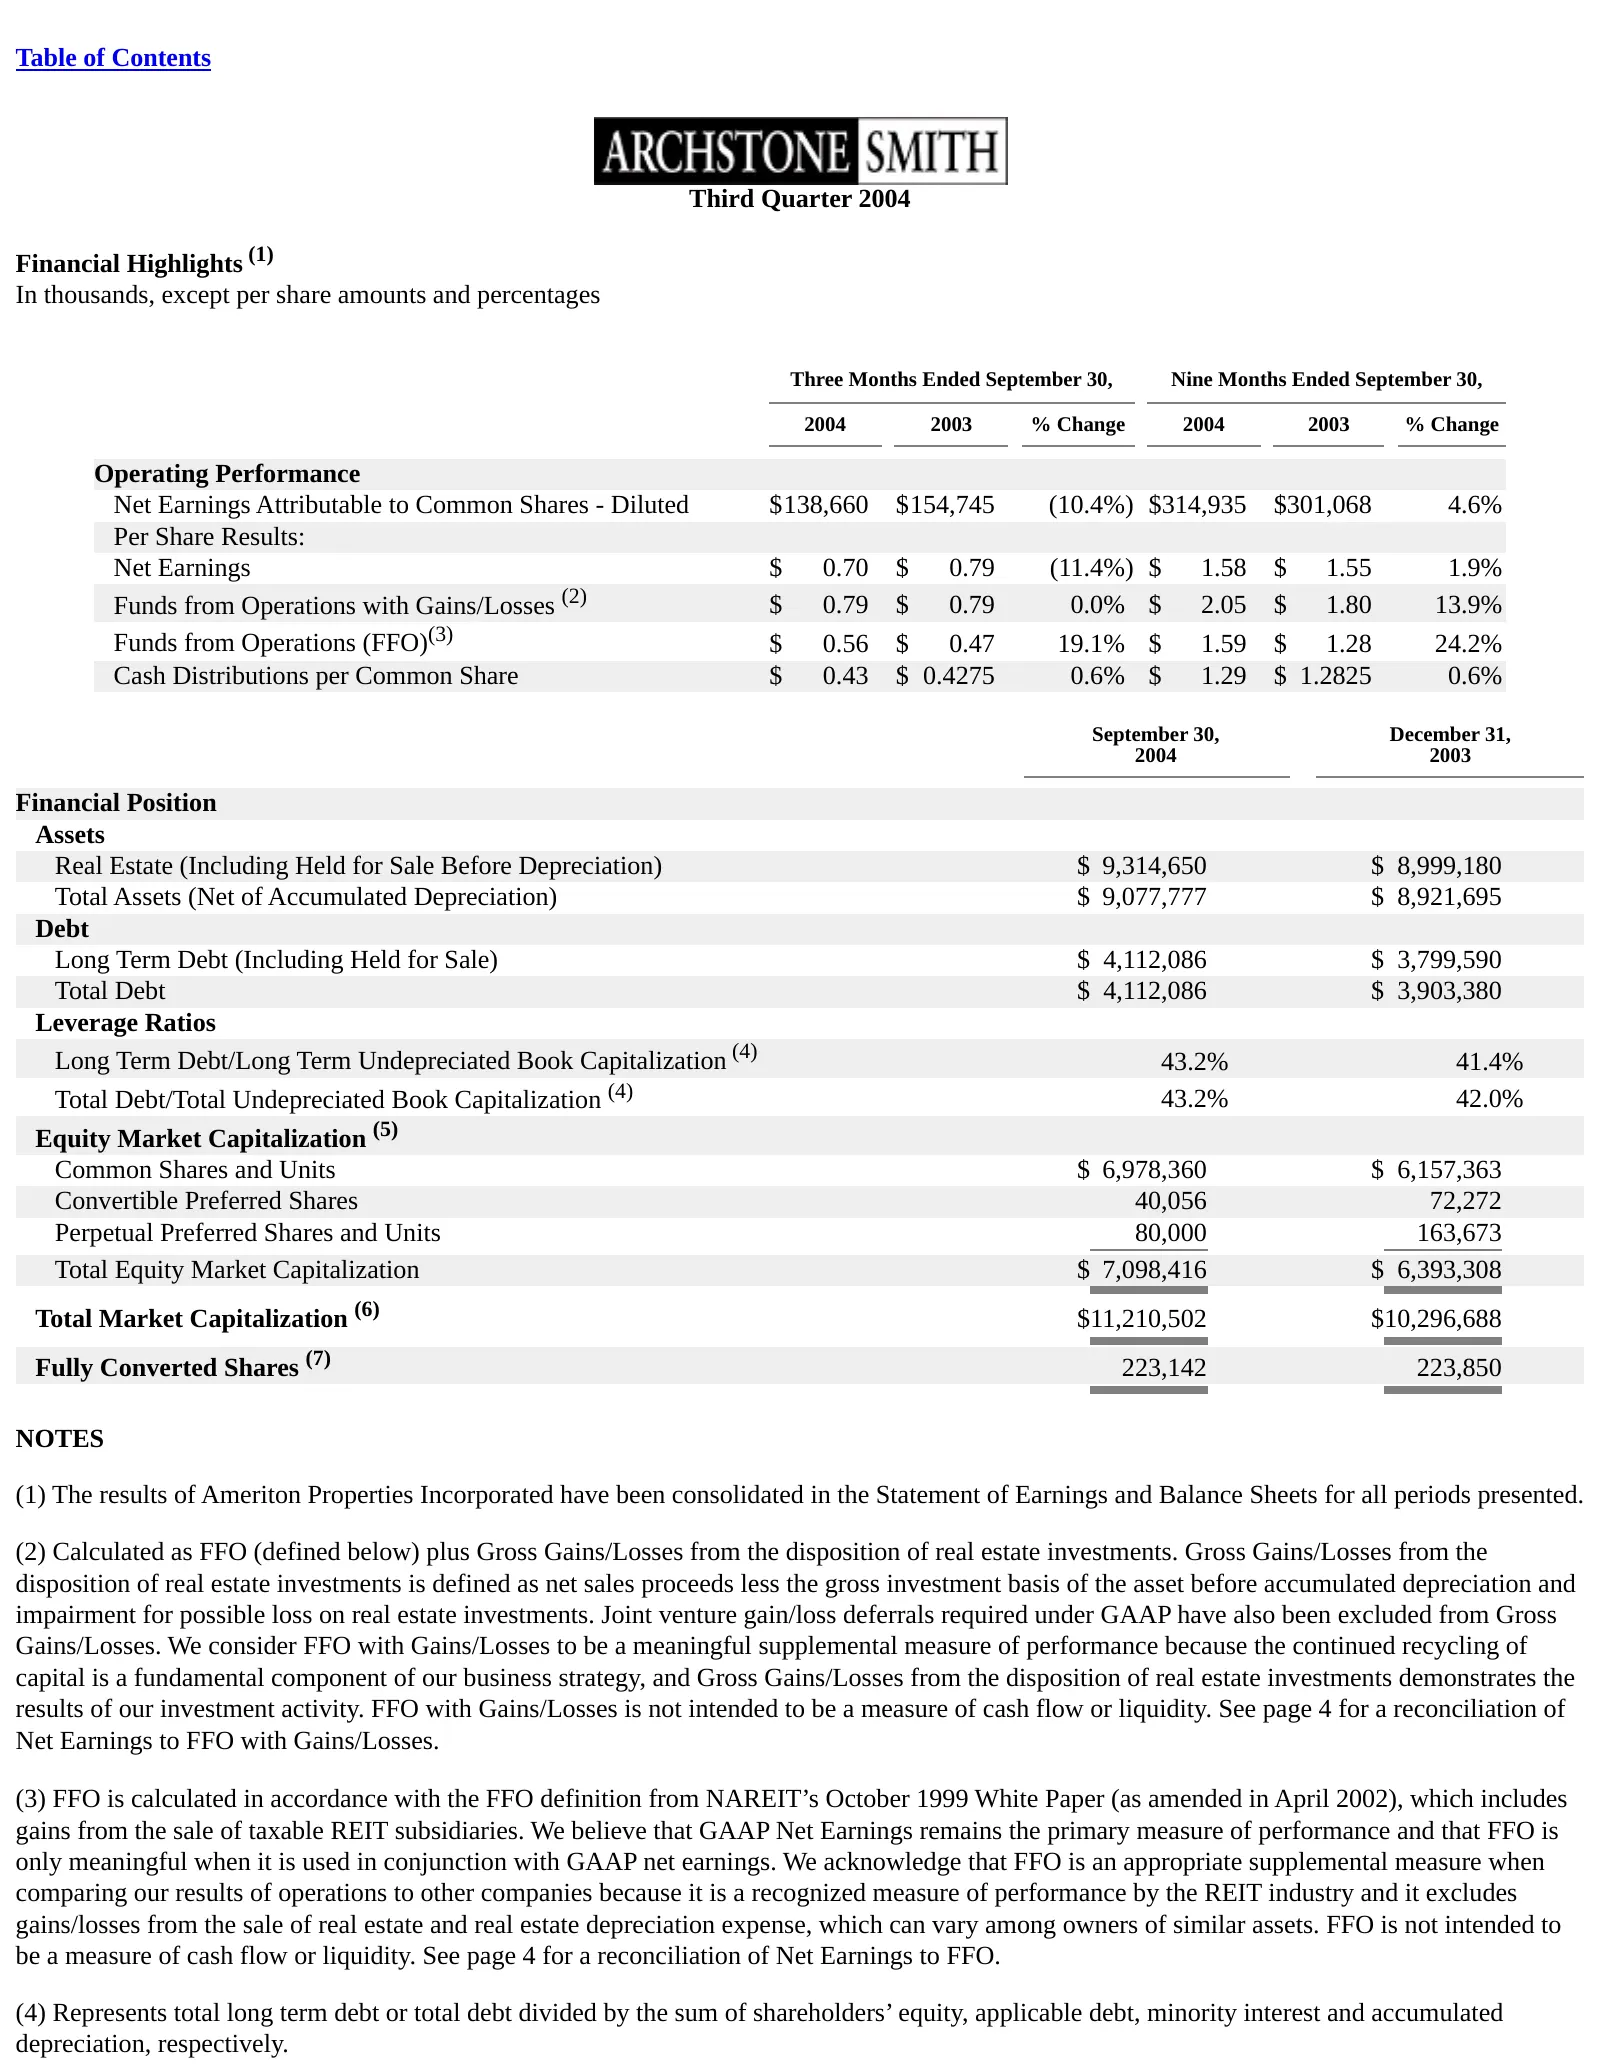
Table of Contents Third Quarter 2004 Financial Highlights (1) In thousands, except per share amounts and percentages Three Months Ended September 30, Nine Months Ended September 30, 2004 2003 % Change 2004 2003 % Change Operating Performance Net Earnings Attributable to Common Shares - Diluted $138,

Slide 33: (5) Reflects the market capitalization based on the closing share price on the last
(5) Reflects the market capitalization based on the closing share price on the last trading day of the period for publicly traded securities and liquidation value of private securities. See detailed market capitalization calculation on page 12. (6) Represents the book value of Total Debt plus Total
Slide 34: Third Quarter 2004 Statements of Earnings
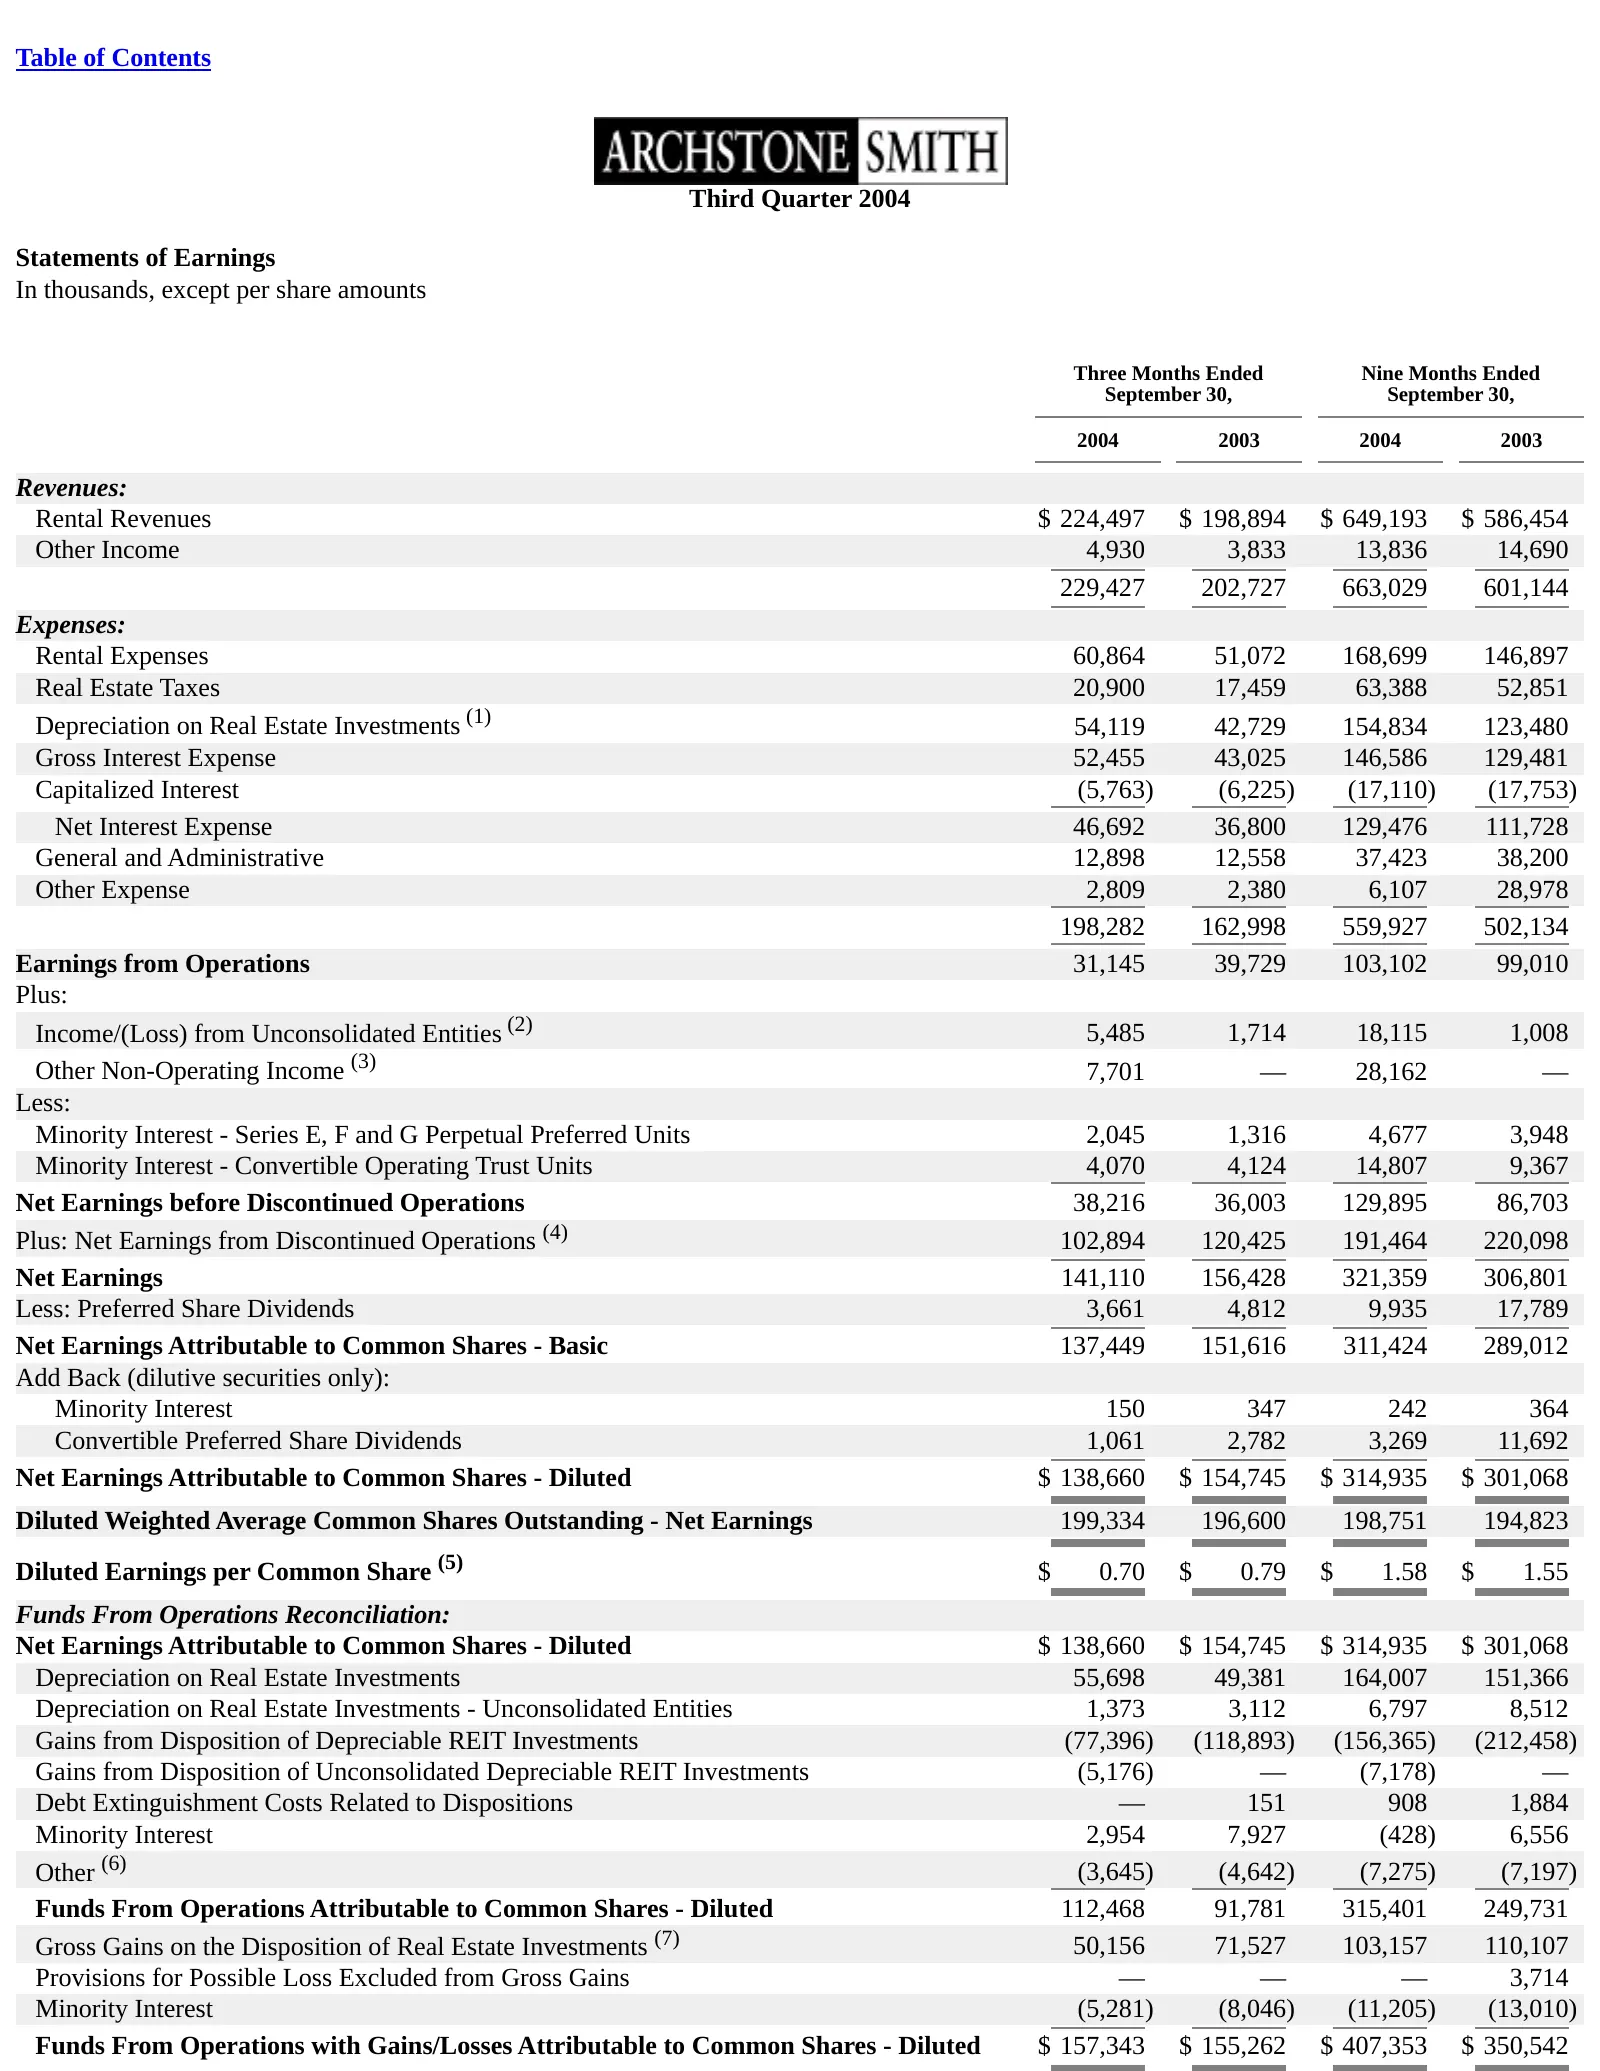
Table of Contents Third Quarter 2004 Statements of Earnings In thousands, except per share amounts Three Months Ended Nine Months Ended September 30, September 30, 2004 2003 2004 2003 Revenues: Rental Revenues $ 224,497 $ 198,894 $ 649,193 $ 586,454 Other Income 4,930 3,833 13,836 14,690 229,427 202
Slide 35: Diluted Weighted Average Common Shares Outstanding: Net Earnings, FFO and FFO with Gains/Losses Per
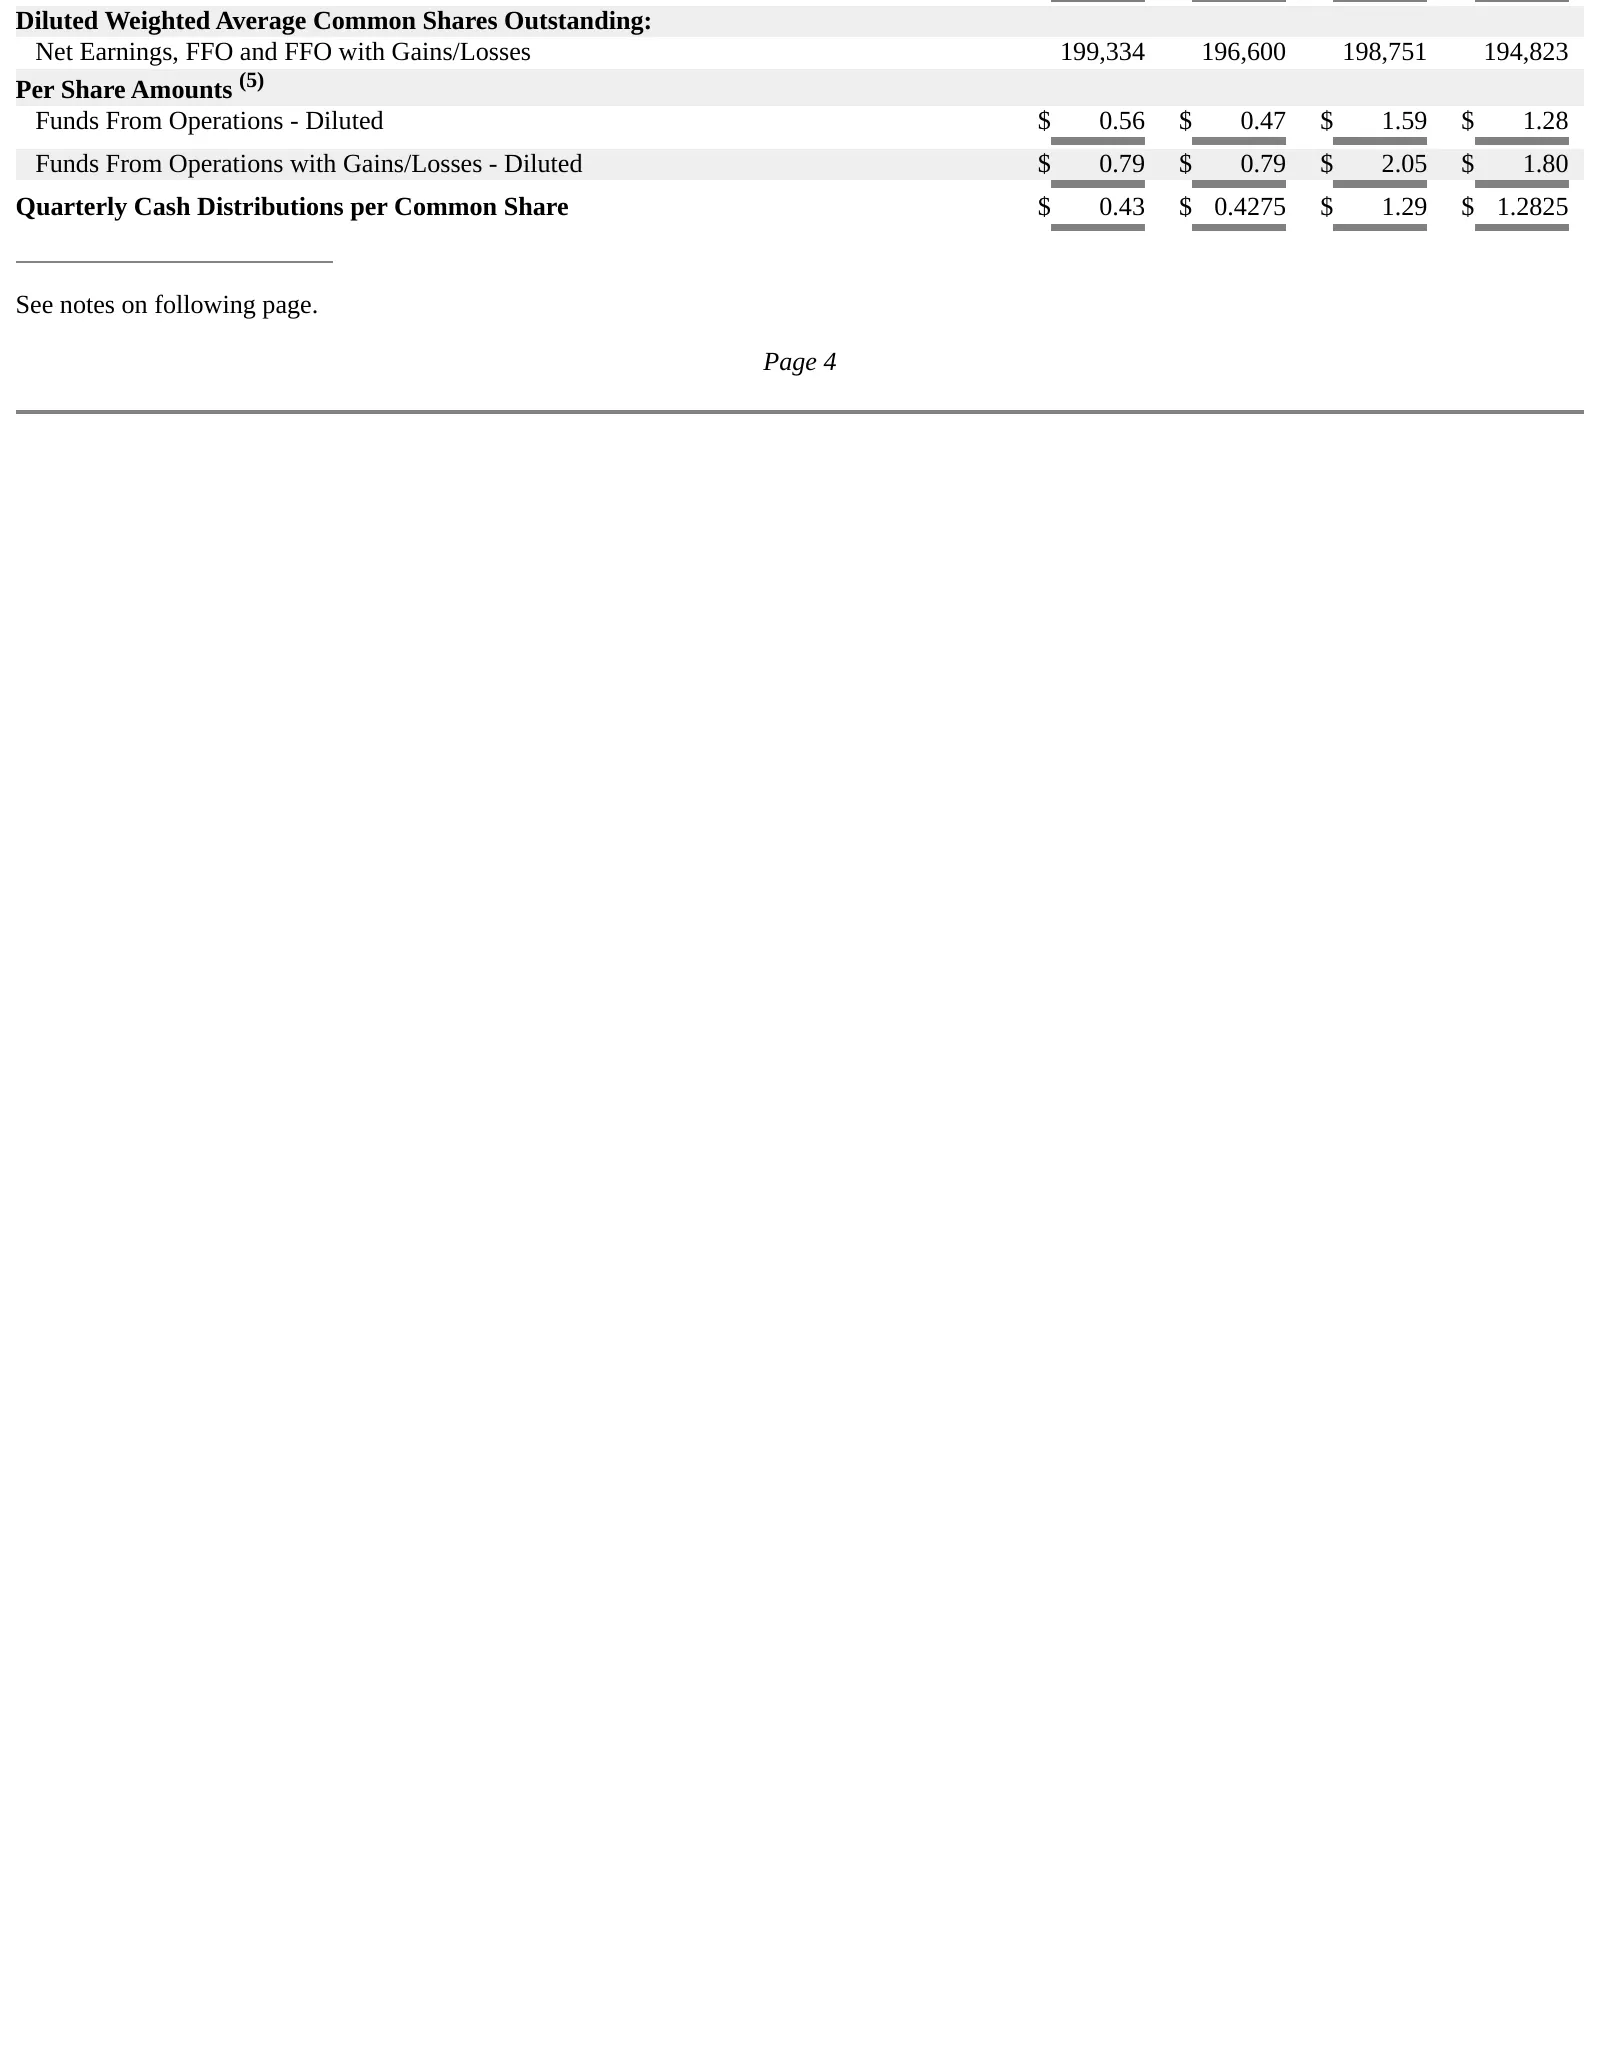
Diluted Weighted Average Common Shares Outstanding: Net Earnings, FFO and FFO with Gains/Losses 199,334 196,600 198,751 194,823 Per Share Amounts (5) Funds From Operations - Diluted $ 0.56 $ 0.47 $ 1.59 $ 1.28 Funds From Operations with Gains/Losses - Diluted $ 0.79 $ 0.79 $ 2.05 $ 1.80 Quarterly Ca
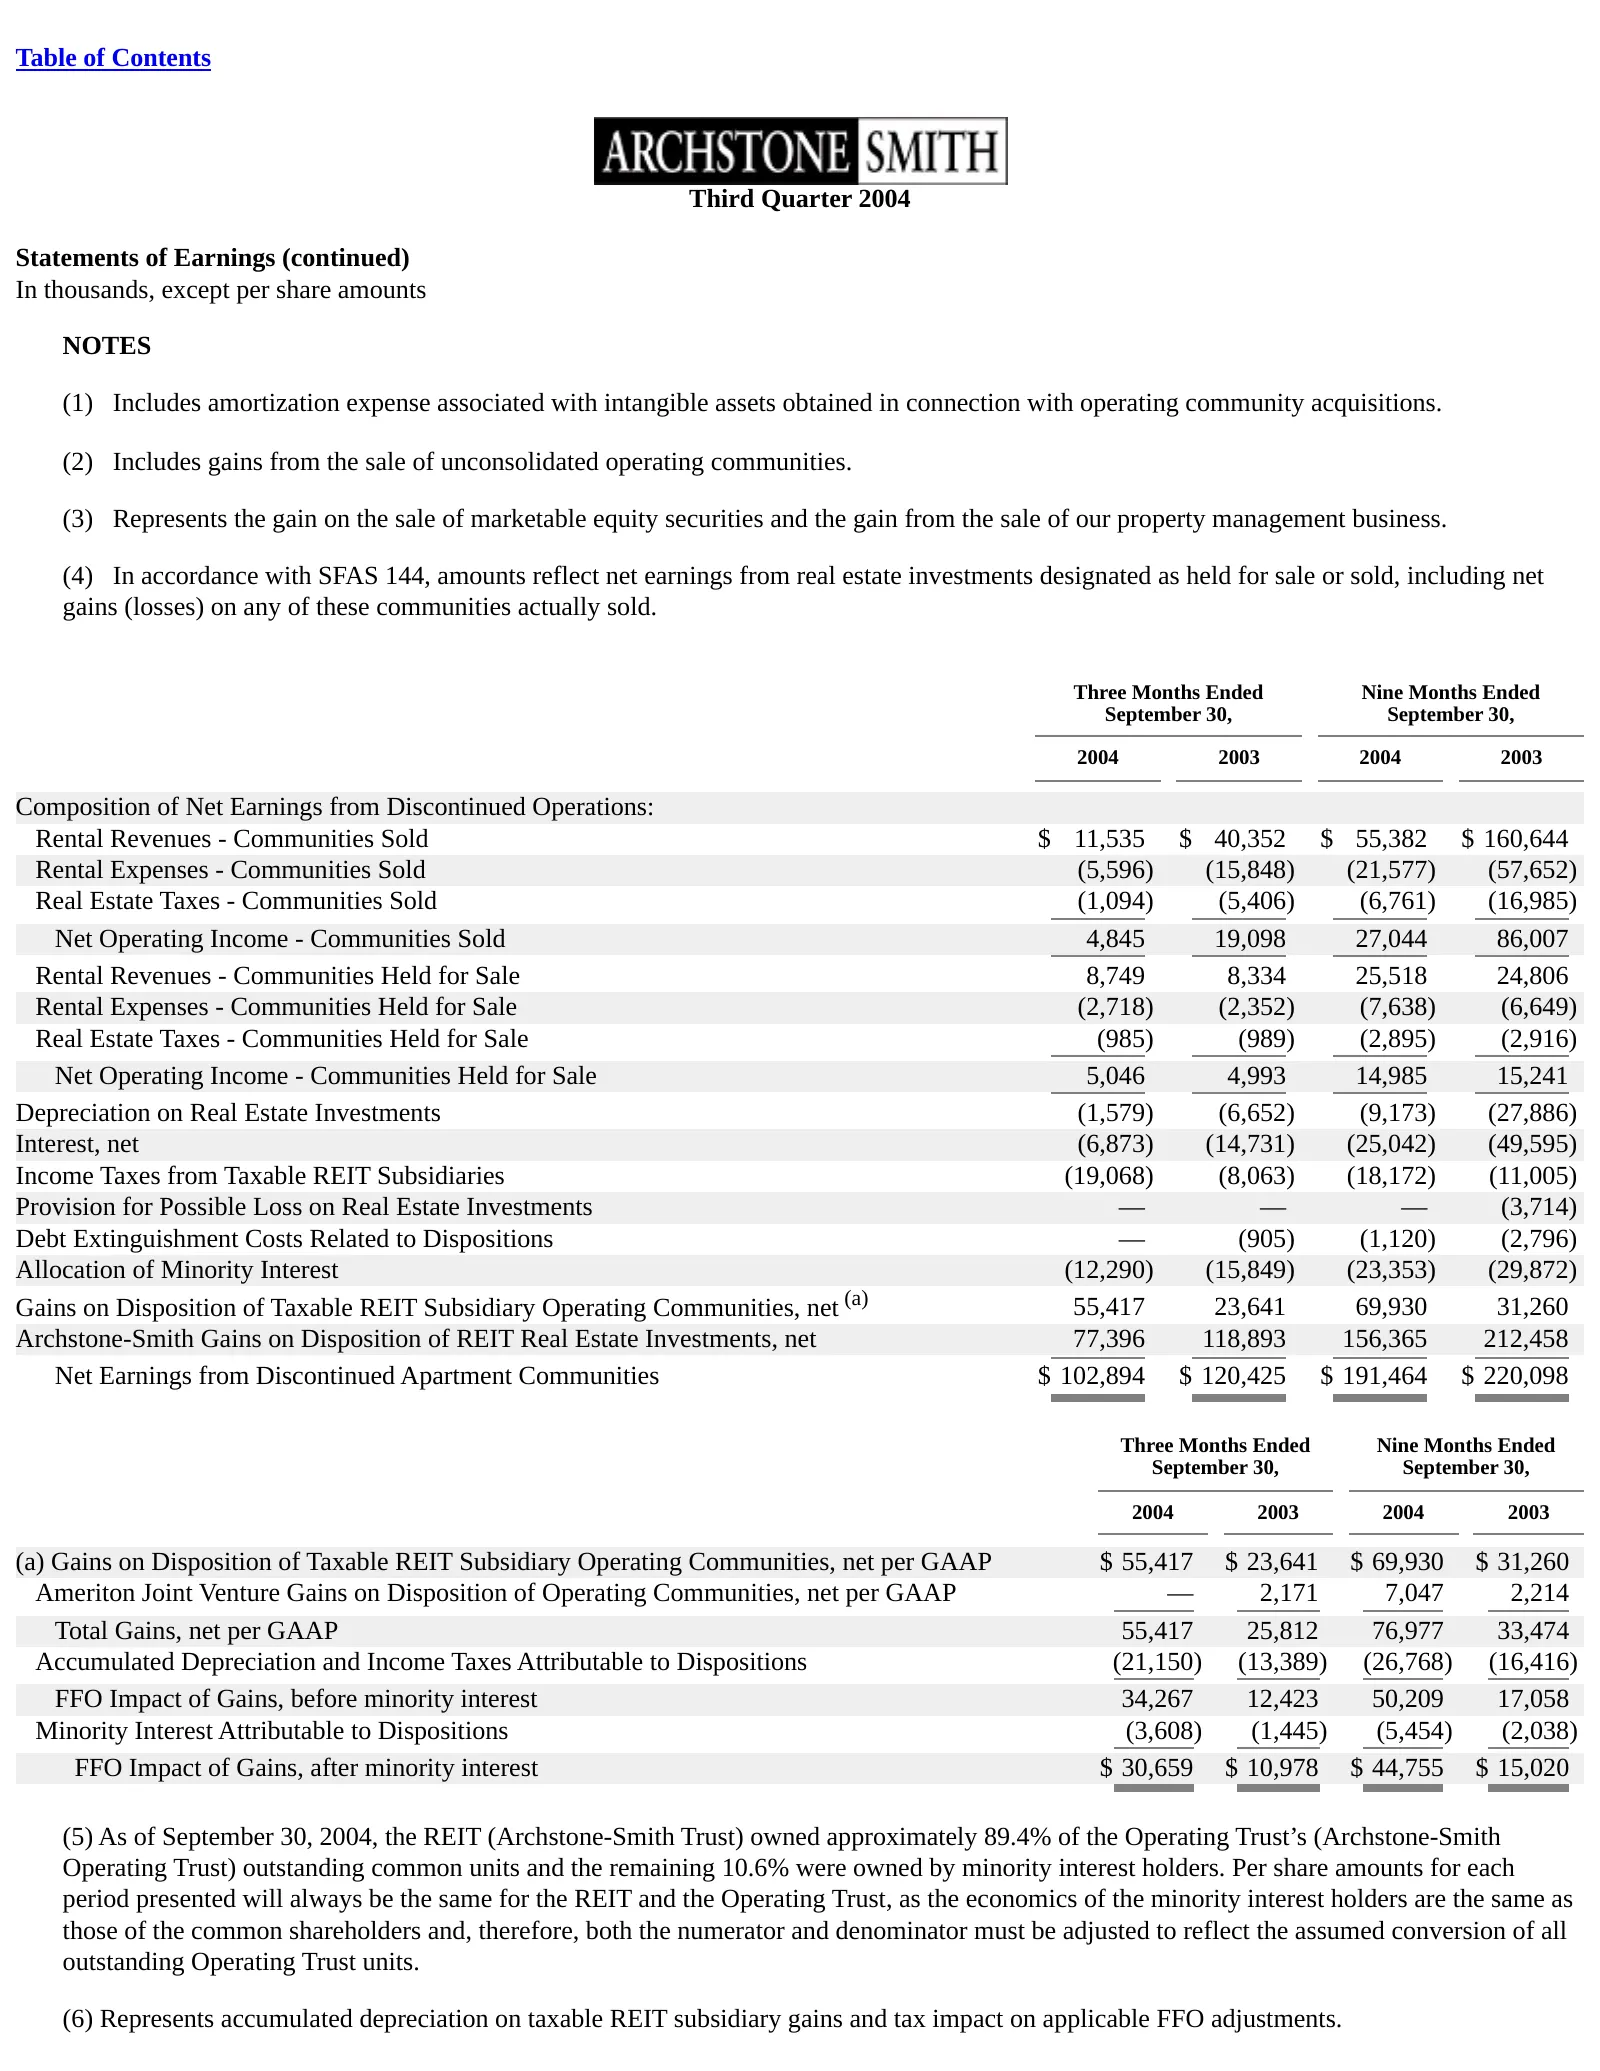
Slide 36: Statements of Earnings (continued)
Table of Contents Third Quarter 2004 Statements of Earnings (continued) In thousands, except per share amounts NOTES (1) Includes amortization expense associated with intangible assets obtained in connection with operating community acquisitions. (2) Includes gains from the sale of unconsolidated op
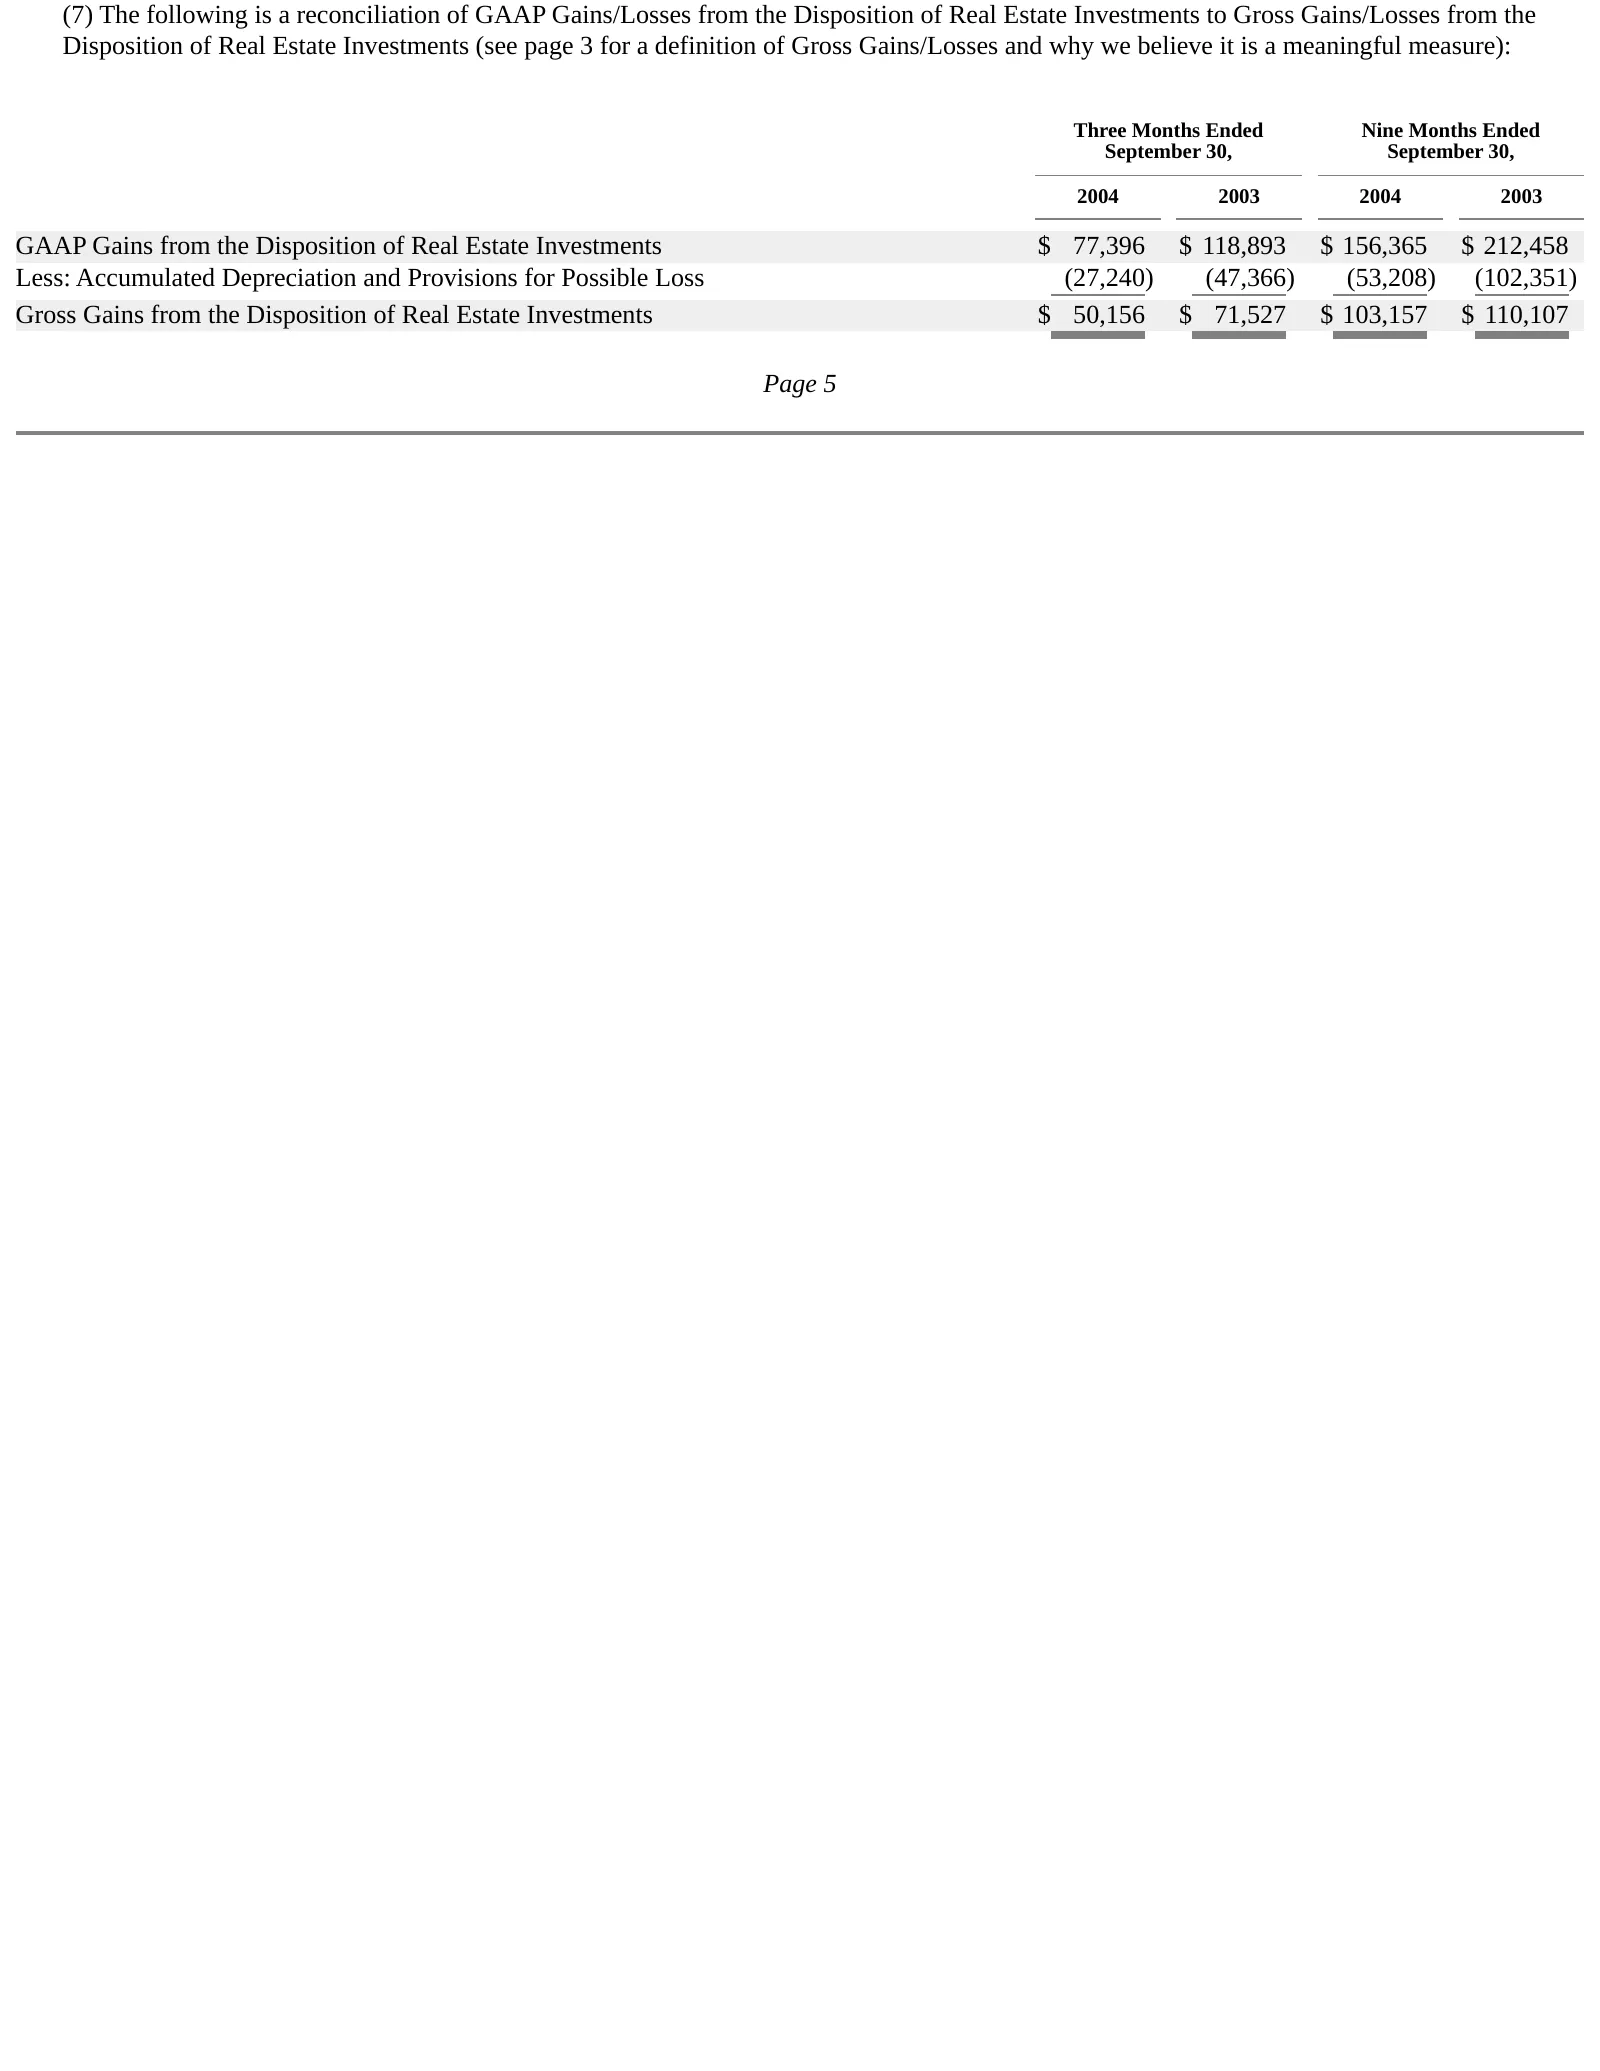
Slide 37: Reconciliation of GAAP gains to gross gains
(7) The following is a reconciliation of GAAP Gains/Losses from the Disposition of Real Estate Investments to Gross Gains/Losses from the Disposition of Real Estate Investments (see page 3 for a definition of Gross Gains/Losses and why we believe it is a meaningful measure): Three Months Ended Nine
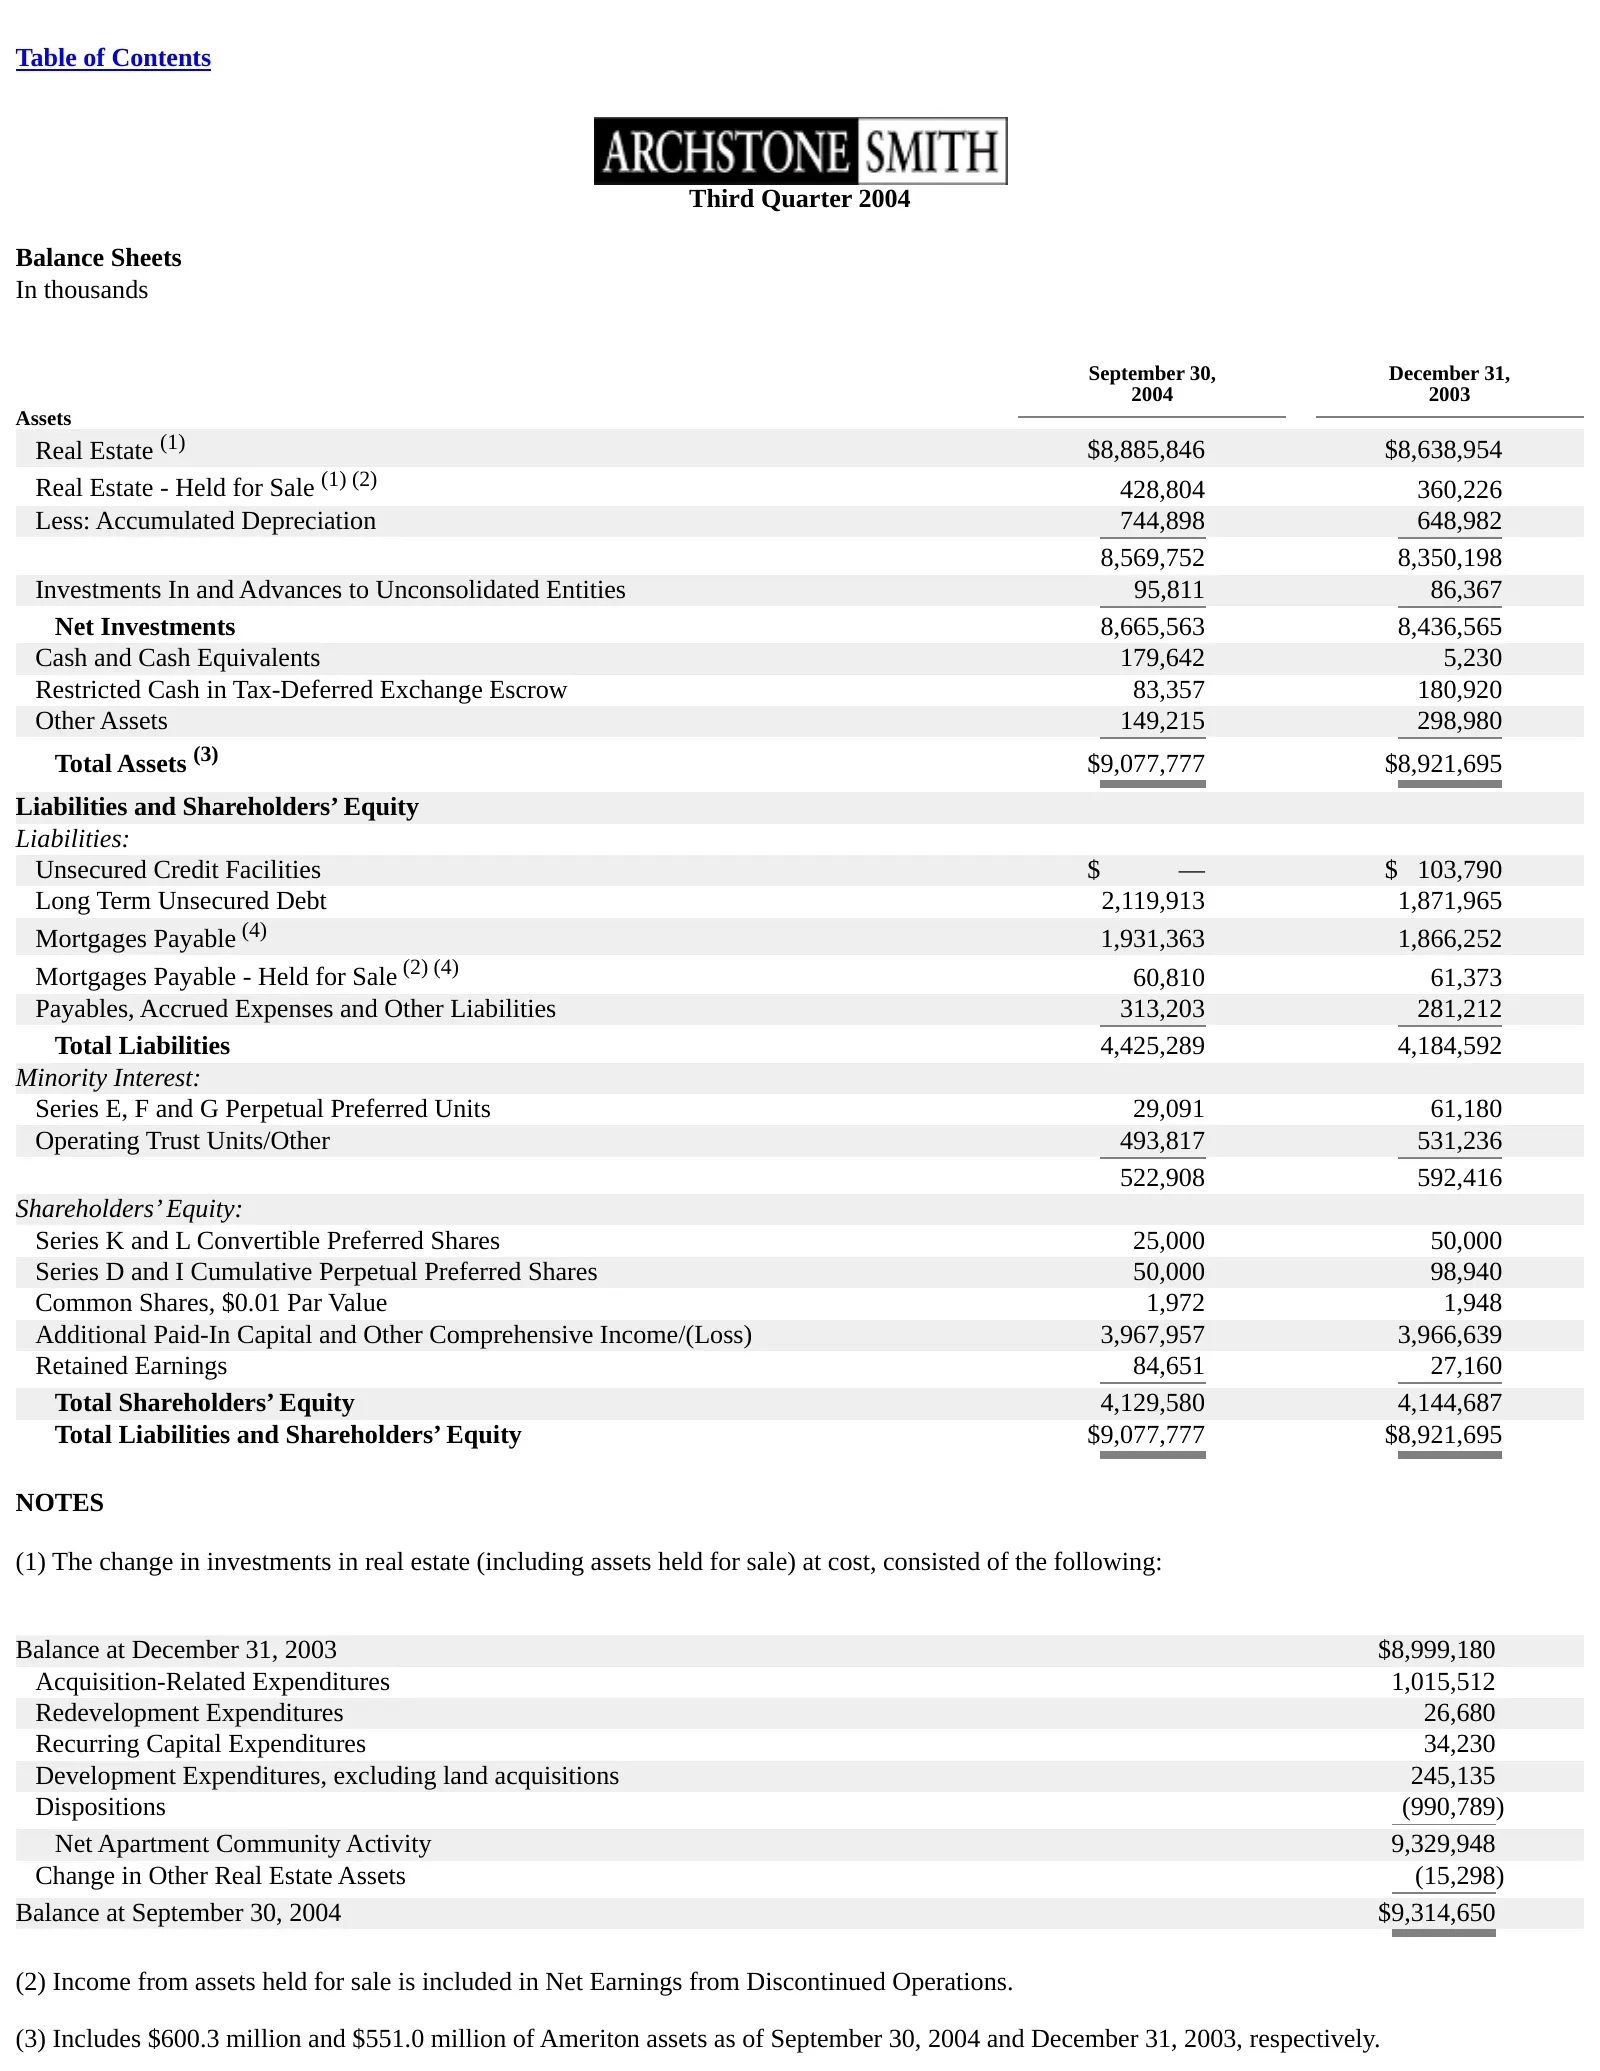
Slide 38: Third Quarter 2004 Balance Sheets
Table of Contents Third Quarter 2004 Balance Sheets In thousands September 30, December 31, 2004 2003 Assets Real Estate (1) $8,885,846 $8,638,954 Real Estate - Held for Sale (1) (2) 428,804 360,226 Less: Accumulated Depreciation 744,898 648,982 8,569,752 8,350,198 Investments In and Advances to Unc

Slide 39: (4) Includes a total of $113.1 million and $80.7 million of Ameriton third party
(4) Includes a total of $113.1 million and $80.7 million of Ameriton third party debt as of September 30, 2004 and December 31, 2003, respectively. Page 6
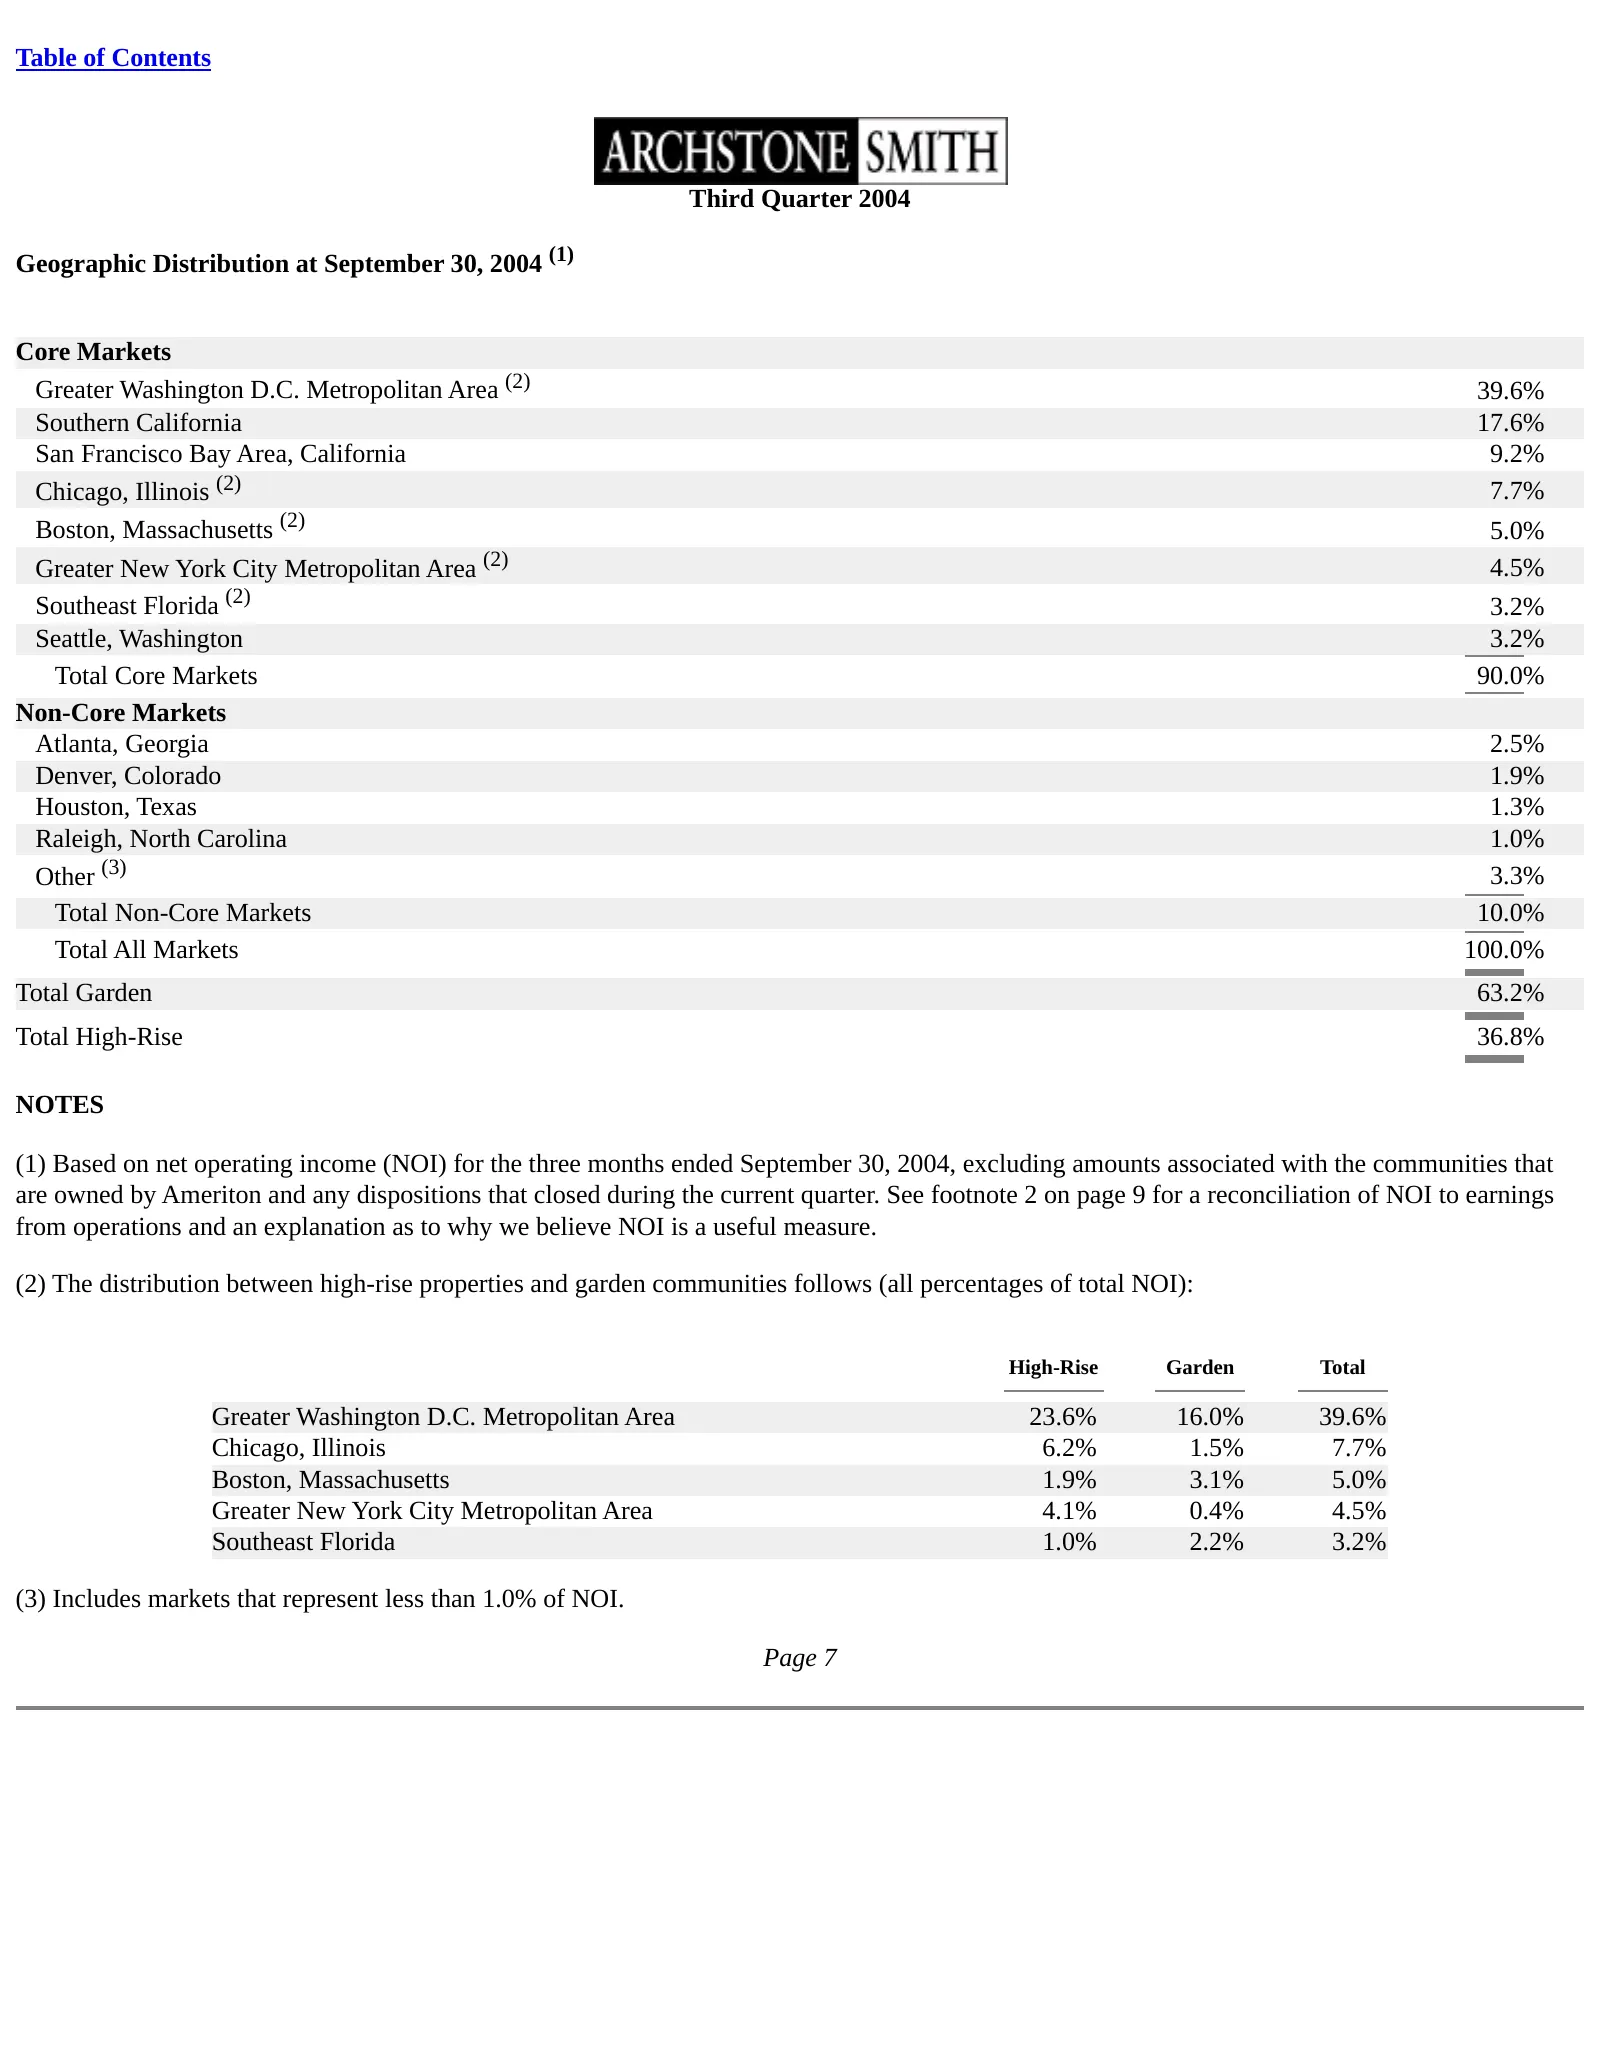
Slide 40: Geographic Distribution at September 30, 2004
Table of Contents Third Quarter 2004 Geographic Distribution at September 30, 2004 (1) Core Markets Greater Washington D.C. Metropolitan Area (2) 39.6% Southern California 17.6% San Francisco Bay Area, California 9.2% Chicago, Illinois (2) 7.7% Boston, Massachusetts (2) 5.0% Greater New York City Me
Slide 41: Operating Performance Summary
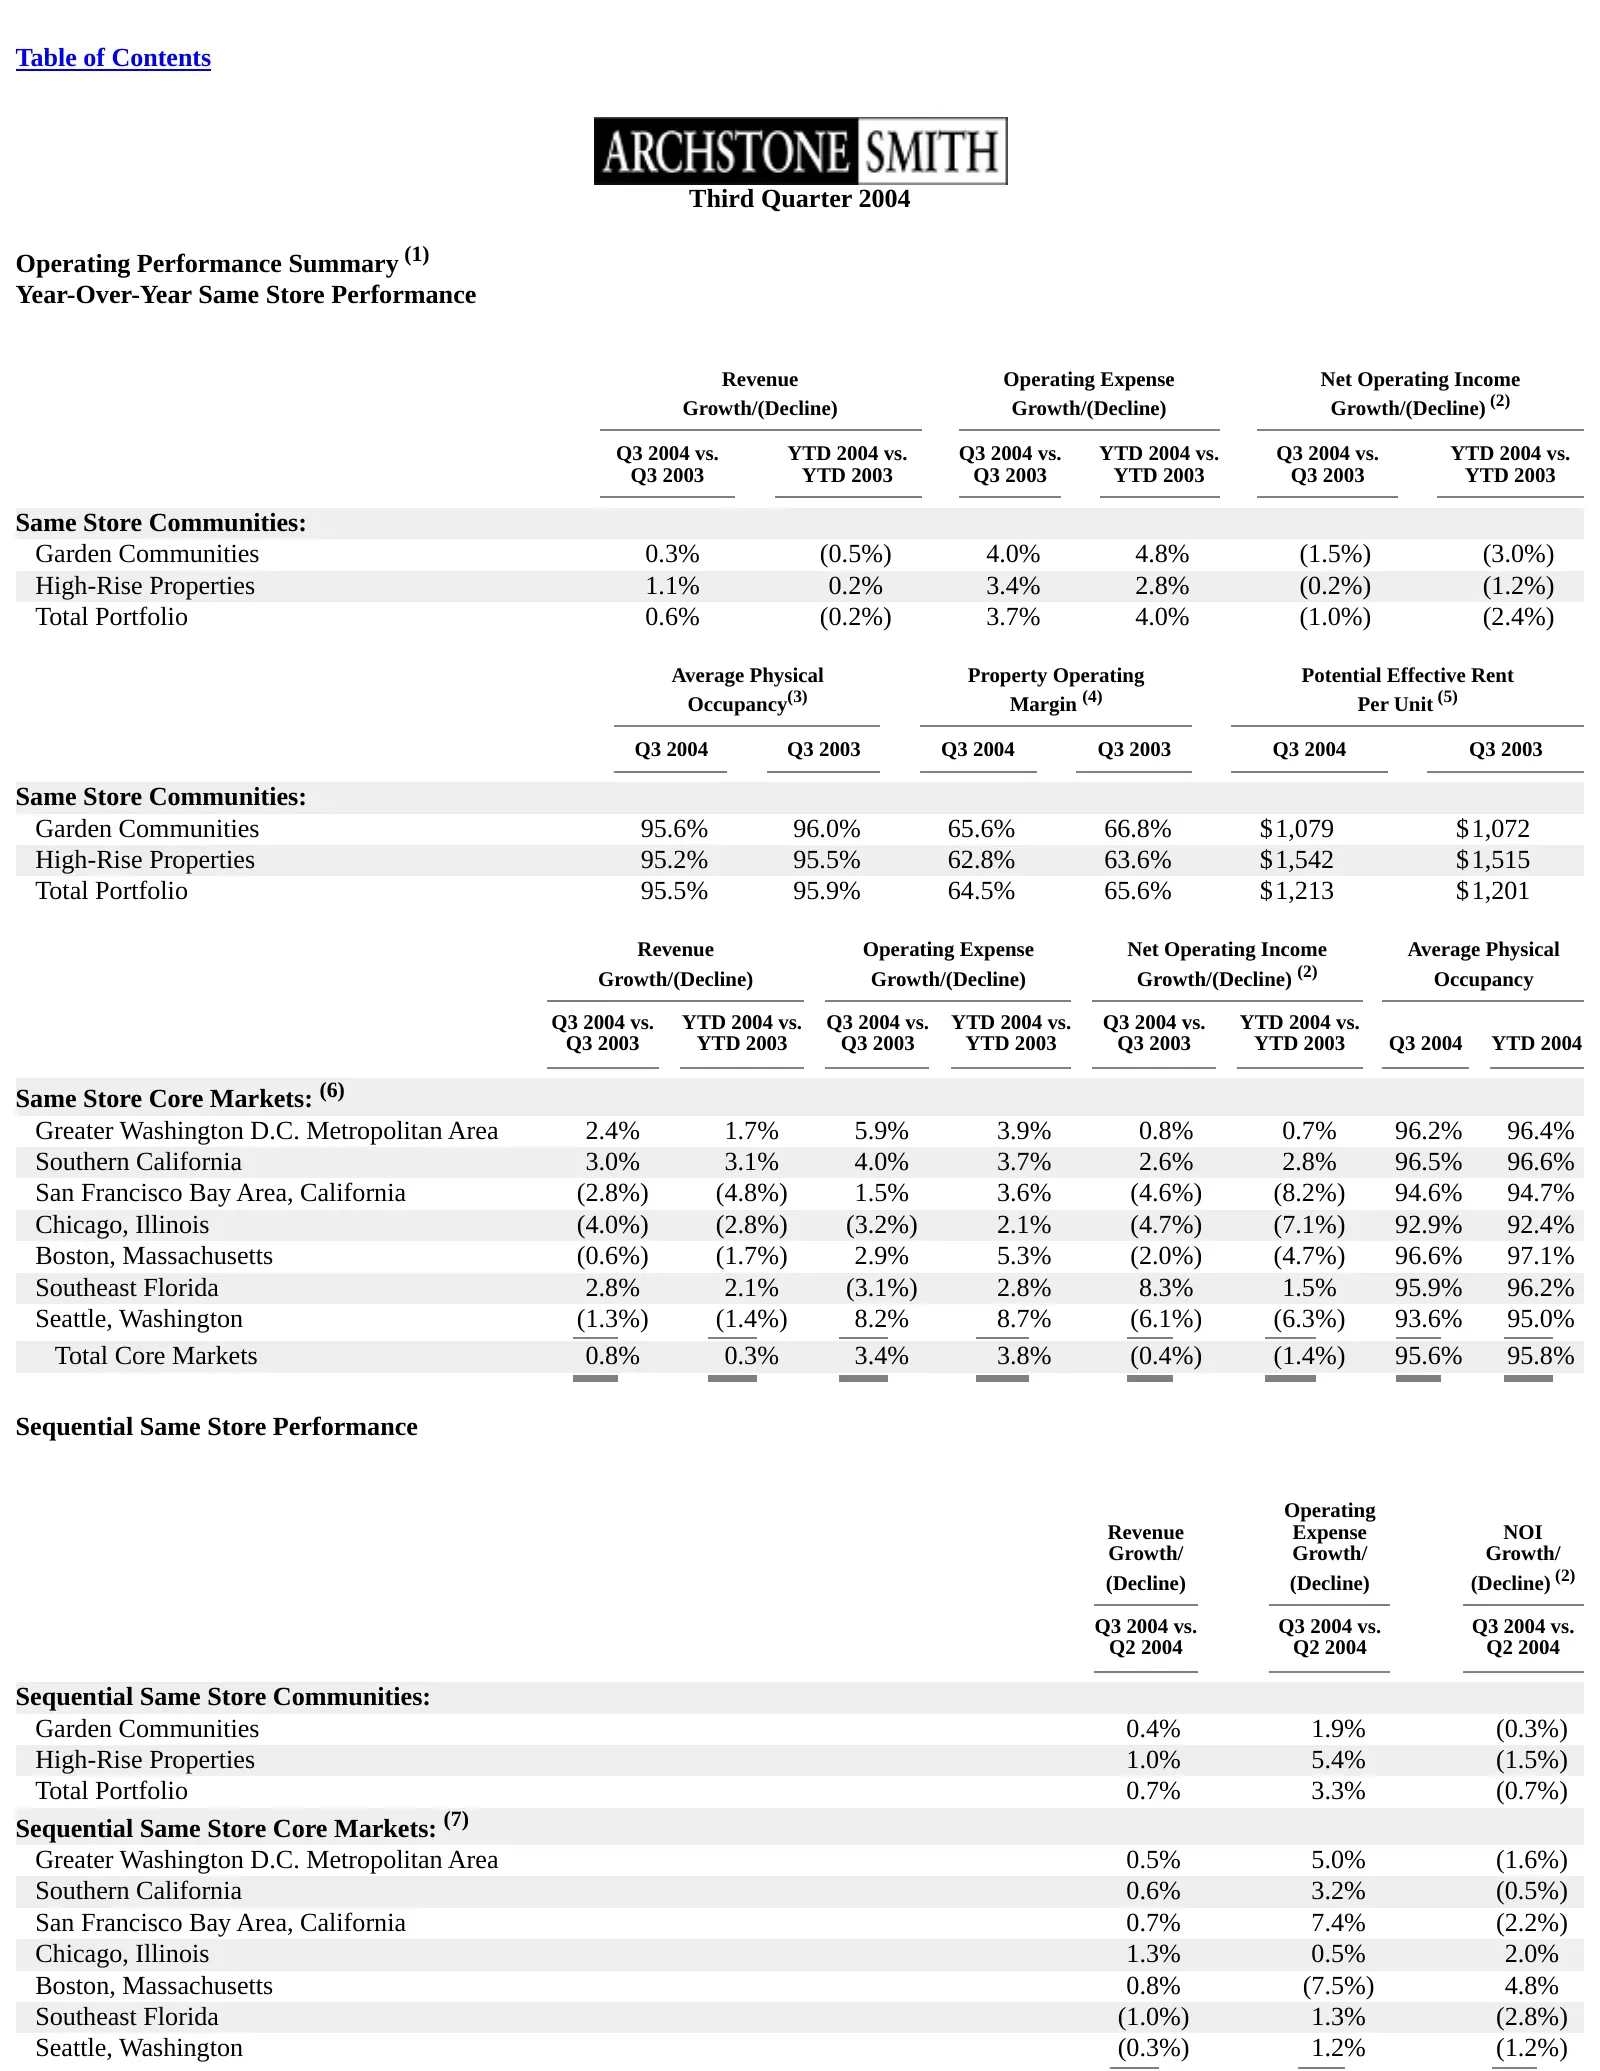
Table of Contents Third Quarter 2004 Operating Performance Summary (1) Year-Over-Year Same Store Performance Revenue Operating Expense Net Operating Income Growth/(Decline) Growth/(Decline) Growth/(Decline) (2) Q3 2004 vs. YTD 2004 vs. Q3 2004 vs. YTD 2004 vs. Q3 2004 vs. YTD 2004 vs. Q3 2003 YTD 20
Slide 42: Total Core Markets
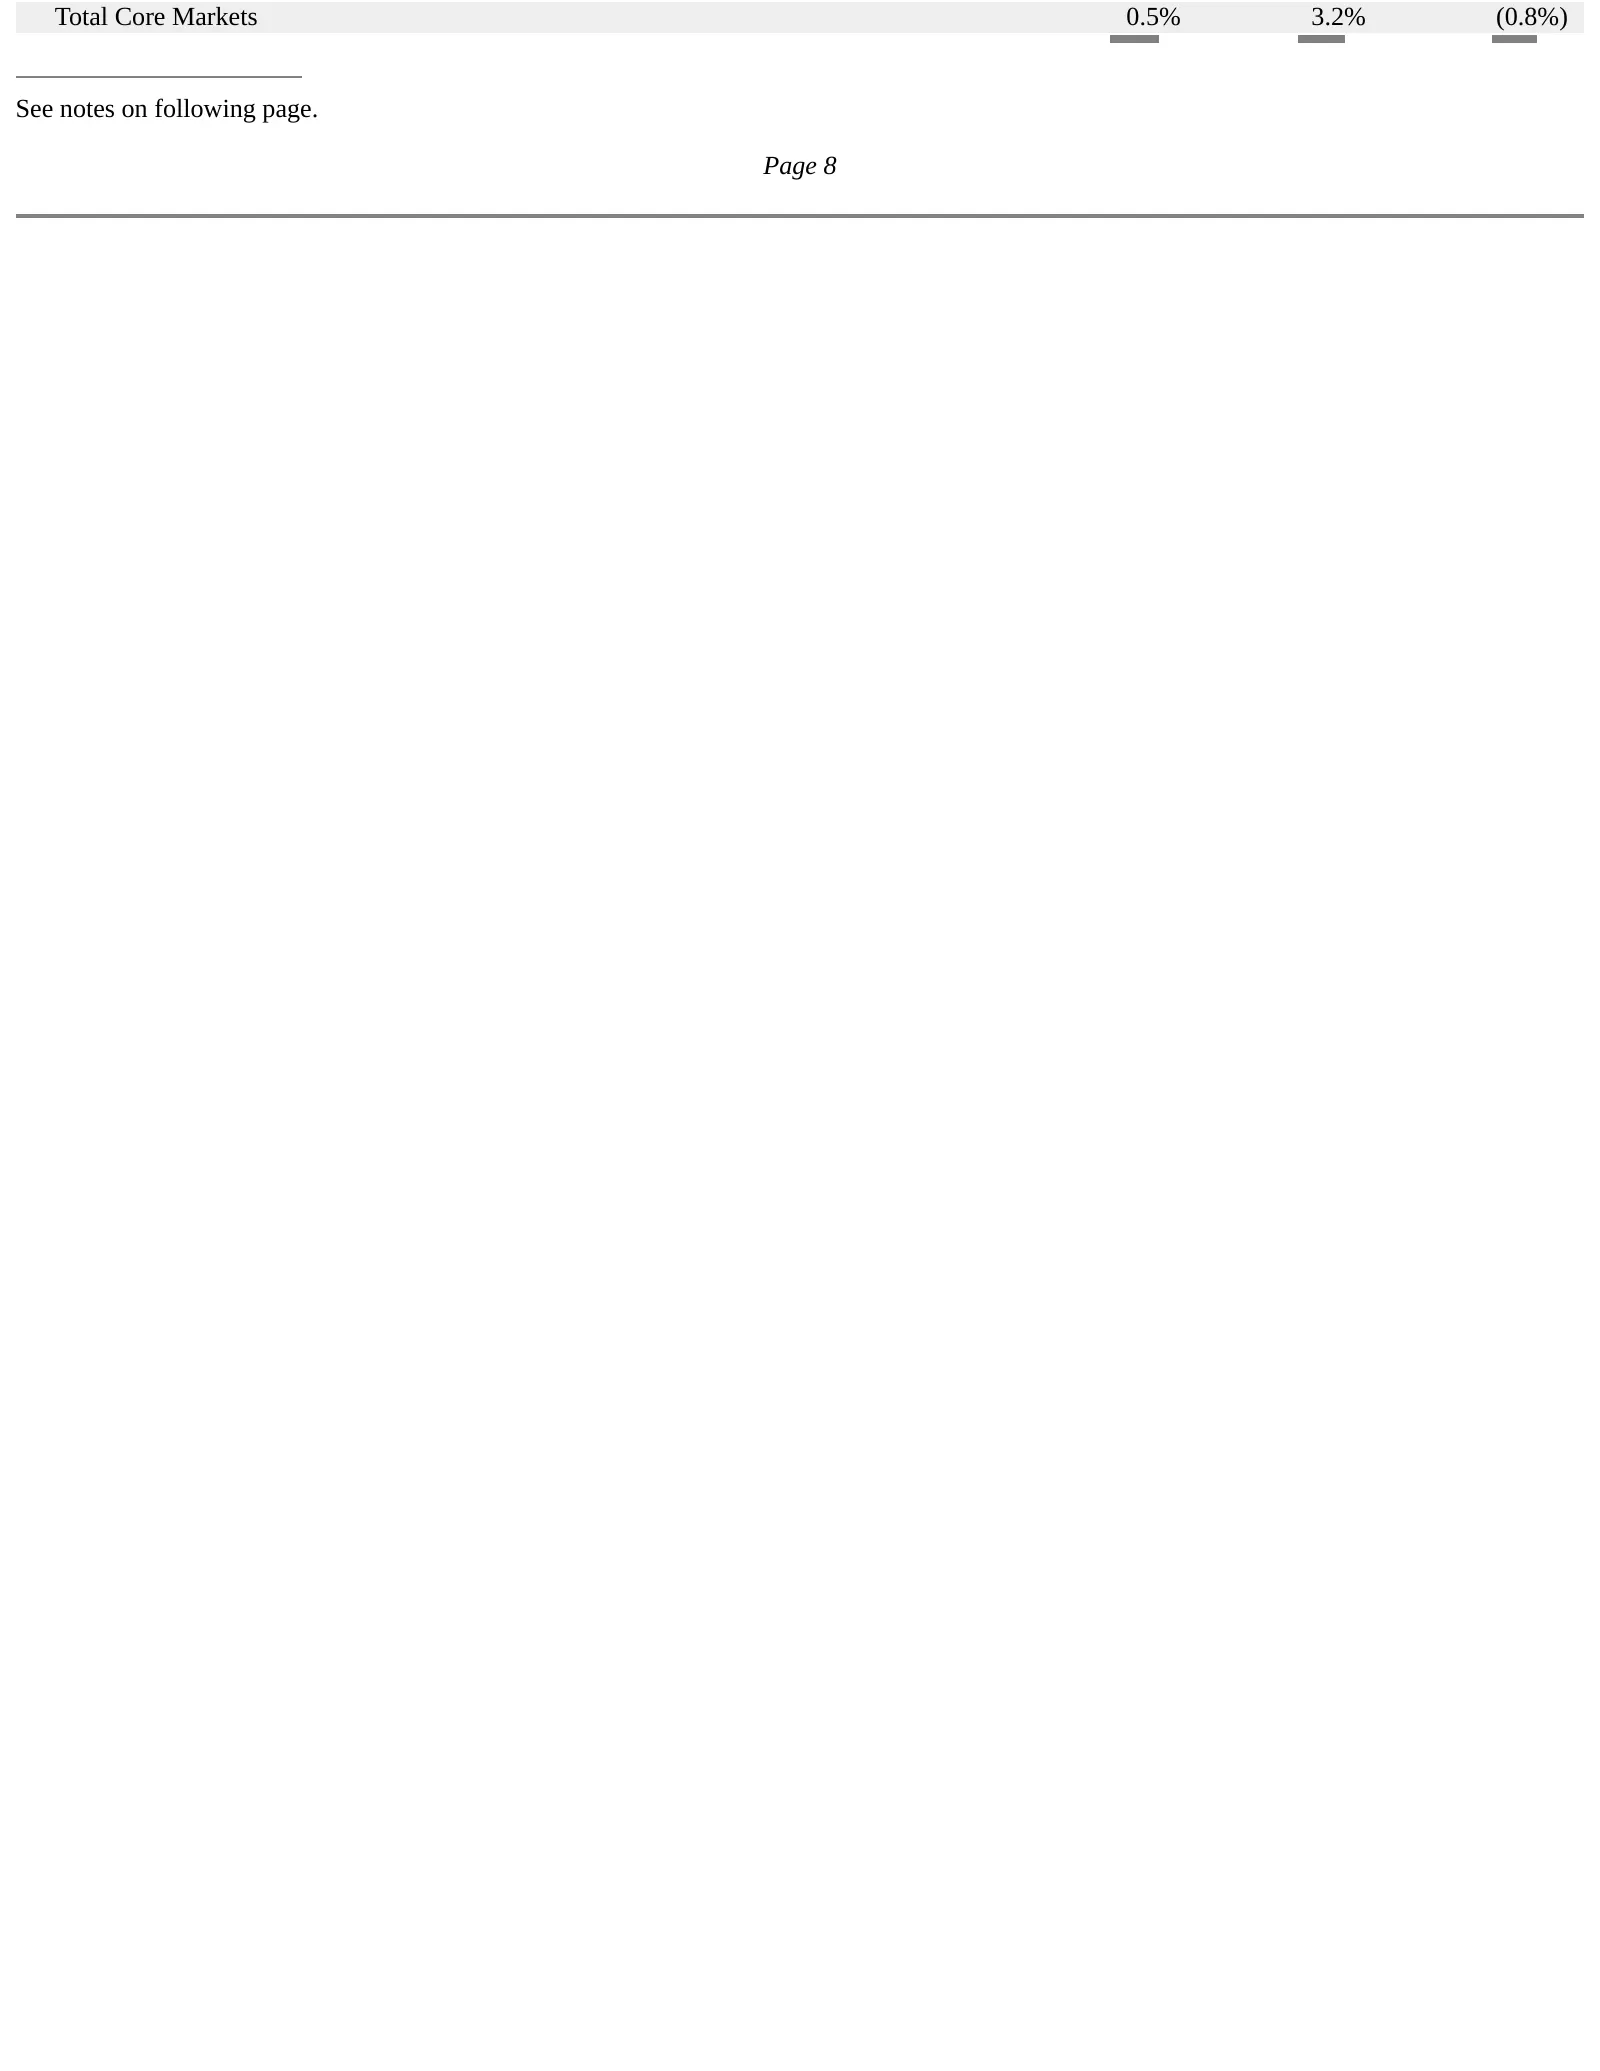
Total Core Markets 0.5% 3.2% (0.8%) See notes on following page. Page 8
Slide 43: Operating Performance Summary (continued)
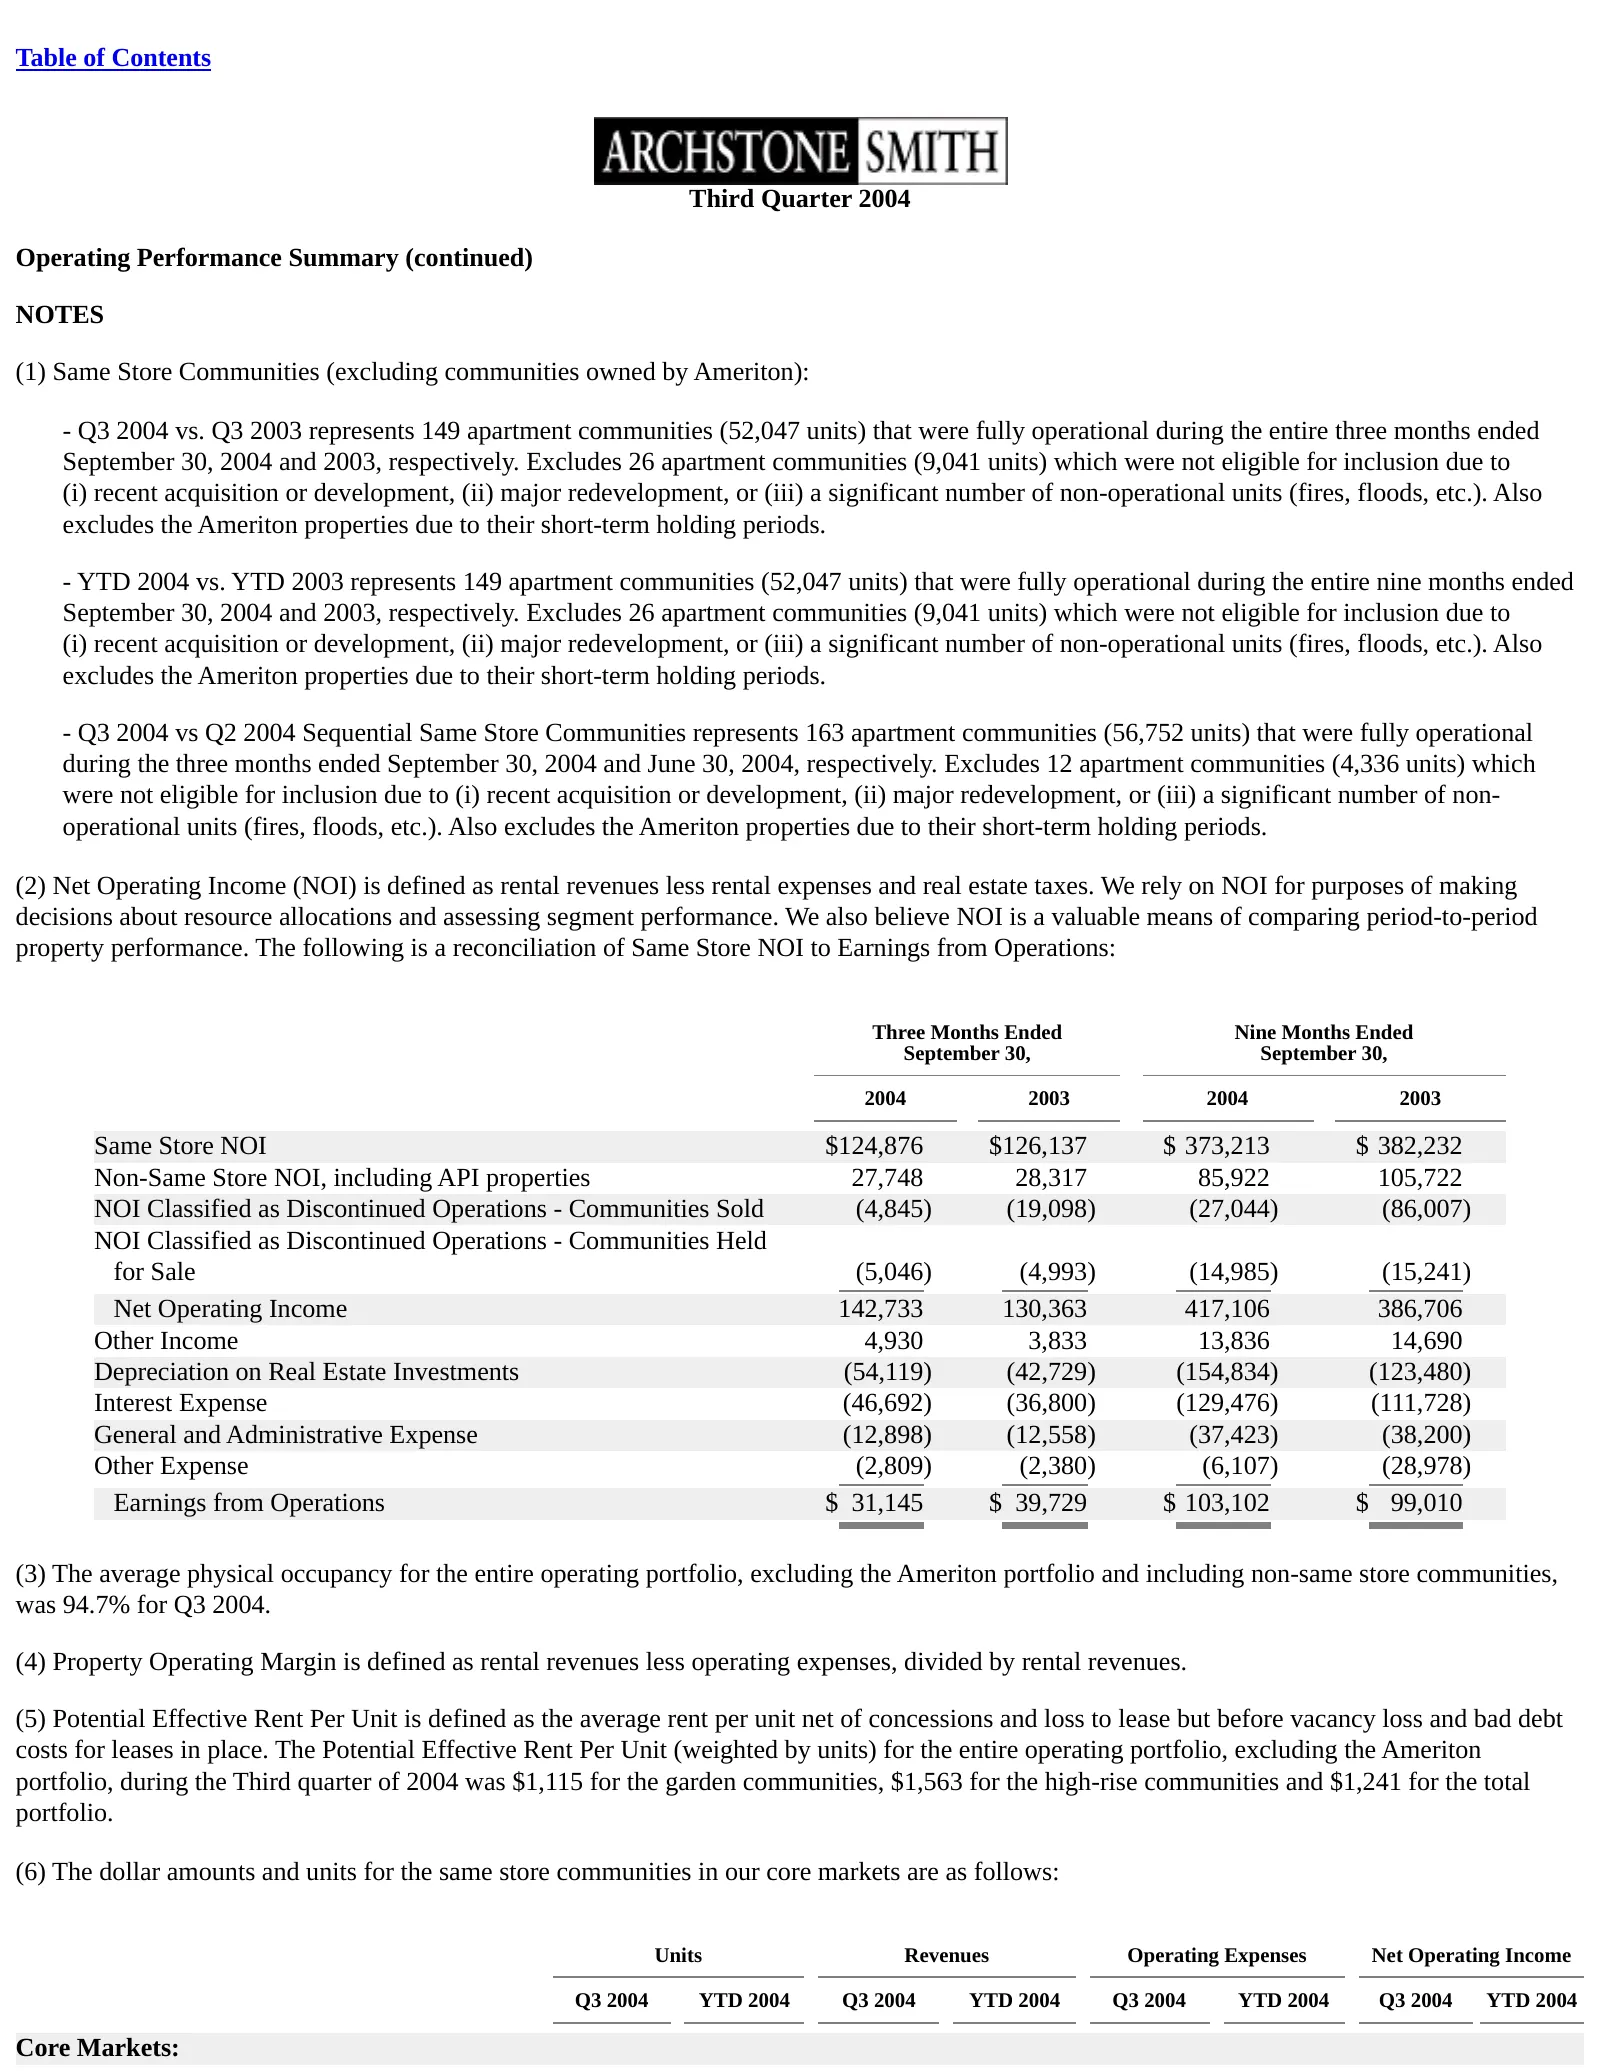
Table of Contents Third Quarter 2004 Operating Performance Summary (continued) NOTES (1) Same Store Communities (excluding communities owned by Ameriton): - Q3 2004 vs. Q3 2003 represents 149 apartment communities (52,047 units) that were fully operational during the entire three months ended Septem
Slide 44: Greater Washington D.C. Metropolitan Area Southern California San Francisco Bay Area, California
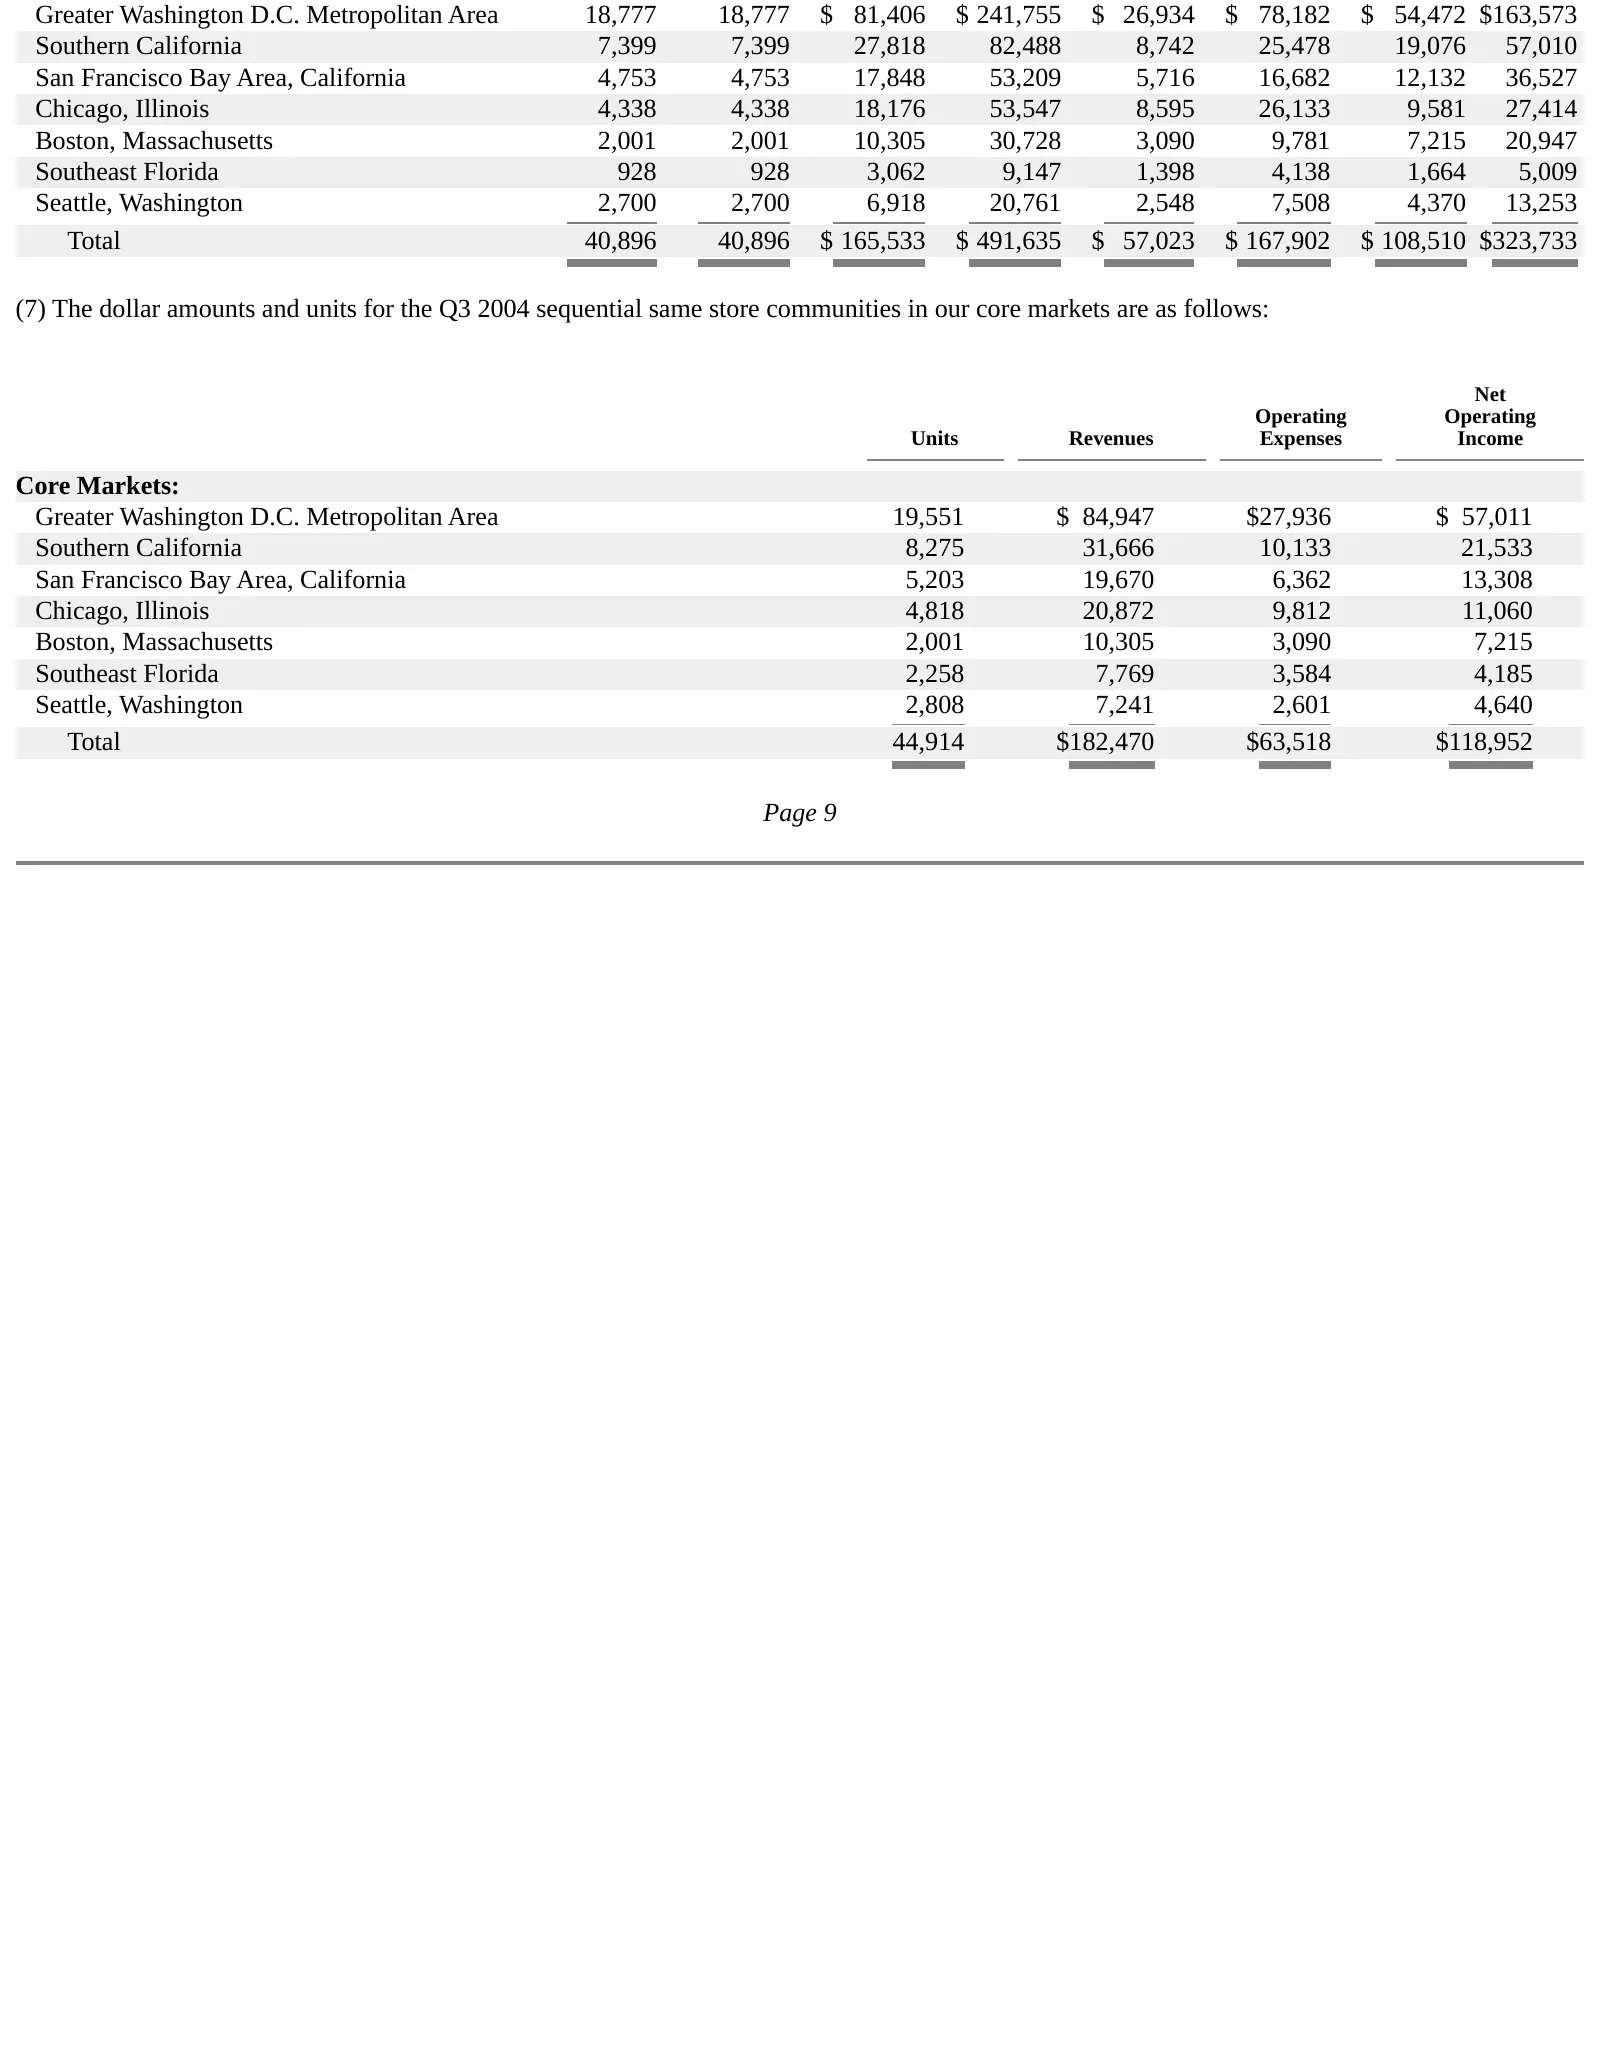
Greater Washington D.C. Metropolitan Area 18,777 18,777 $ 81,406 $ 241,755 $ 26,934 $ 78,182 $ 54,472 $163,573 Southern California 7,399 7,399 27,818 82,488 8,742 25,478 19,076 57,010 San Francisco Bay Area, California 4,753 4,753 17,848 53,209 5,716 16,682 12,132 36,527 Chicago, Illinois 4,338 4,33
Slide 45: Archstone-Smith Investment Summary
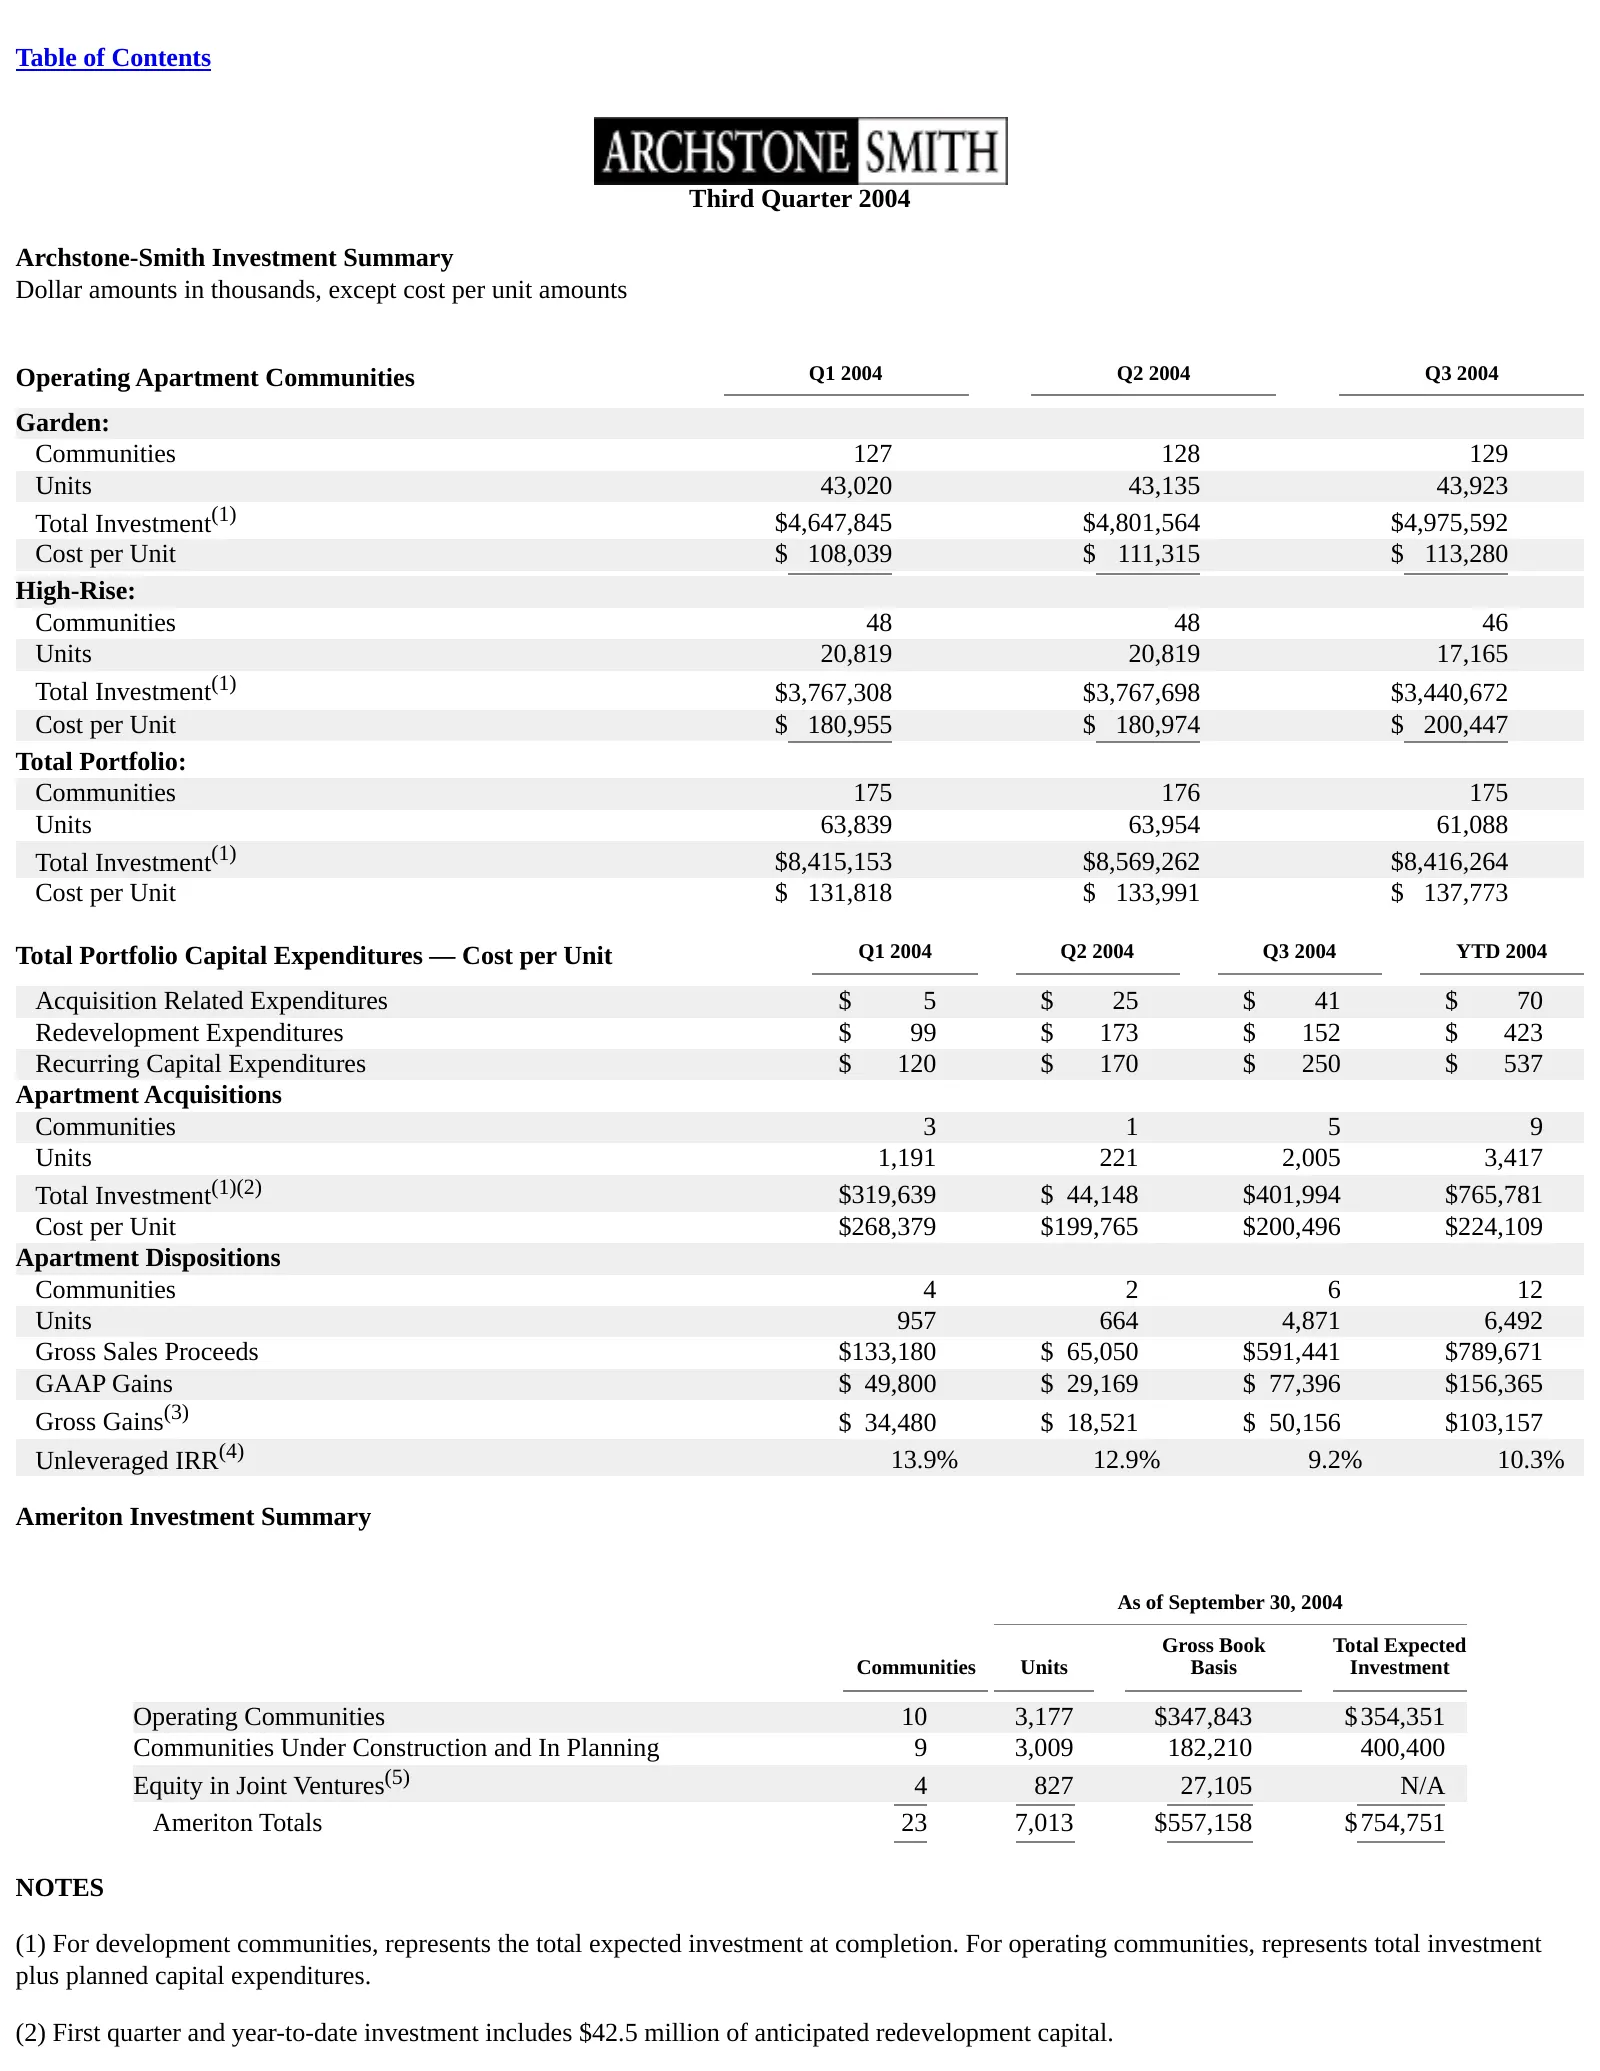
Table of Contents Third Quarter 2004 Archstone-Smith Investment Summary Dollar amounts in thousands, except cost per unit amounts Operating Apartment Communities Q1 2004 Q2 2004 Q3 2004 Garden: Communities 127 128 129 Units 43,020 43,135 43,923 Total Investment(1) $4,647,845 $4,801,564 $4,975,592 Co

Slide 46: (3) See page 3 for a definition of Gross Gains/Losses from the disposition of
(3) See page 3 for a definition of Gross Gains/Losses from the disposition of real estate investments. See page 5 for a reconciliation of GAAP Gains/Losses from the disposition of real estate investments to Gross Gains/Losses from the disposition of real estate investments. (4) The unleveraged IRR r
Slide 47: Development Summary
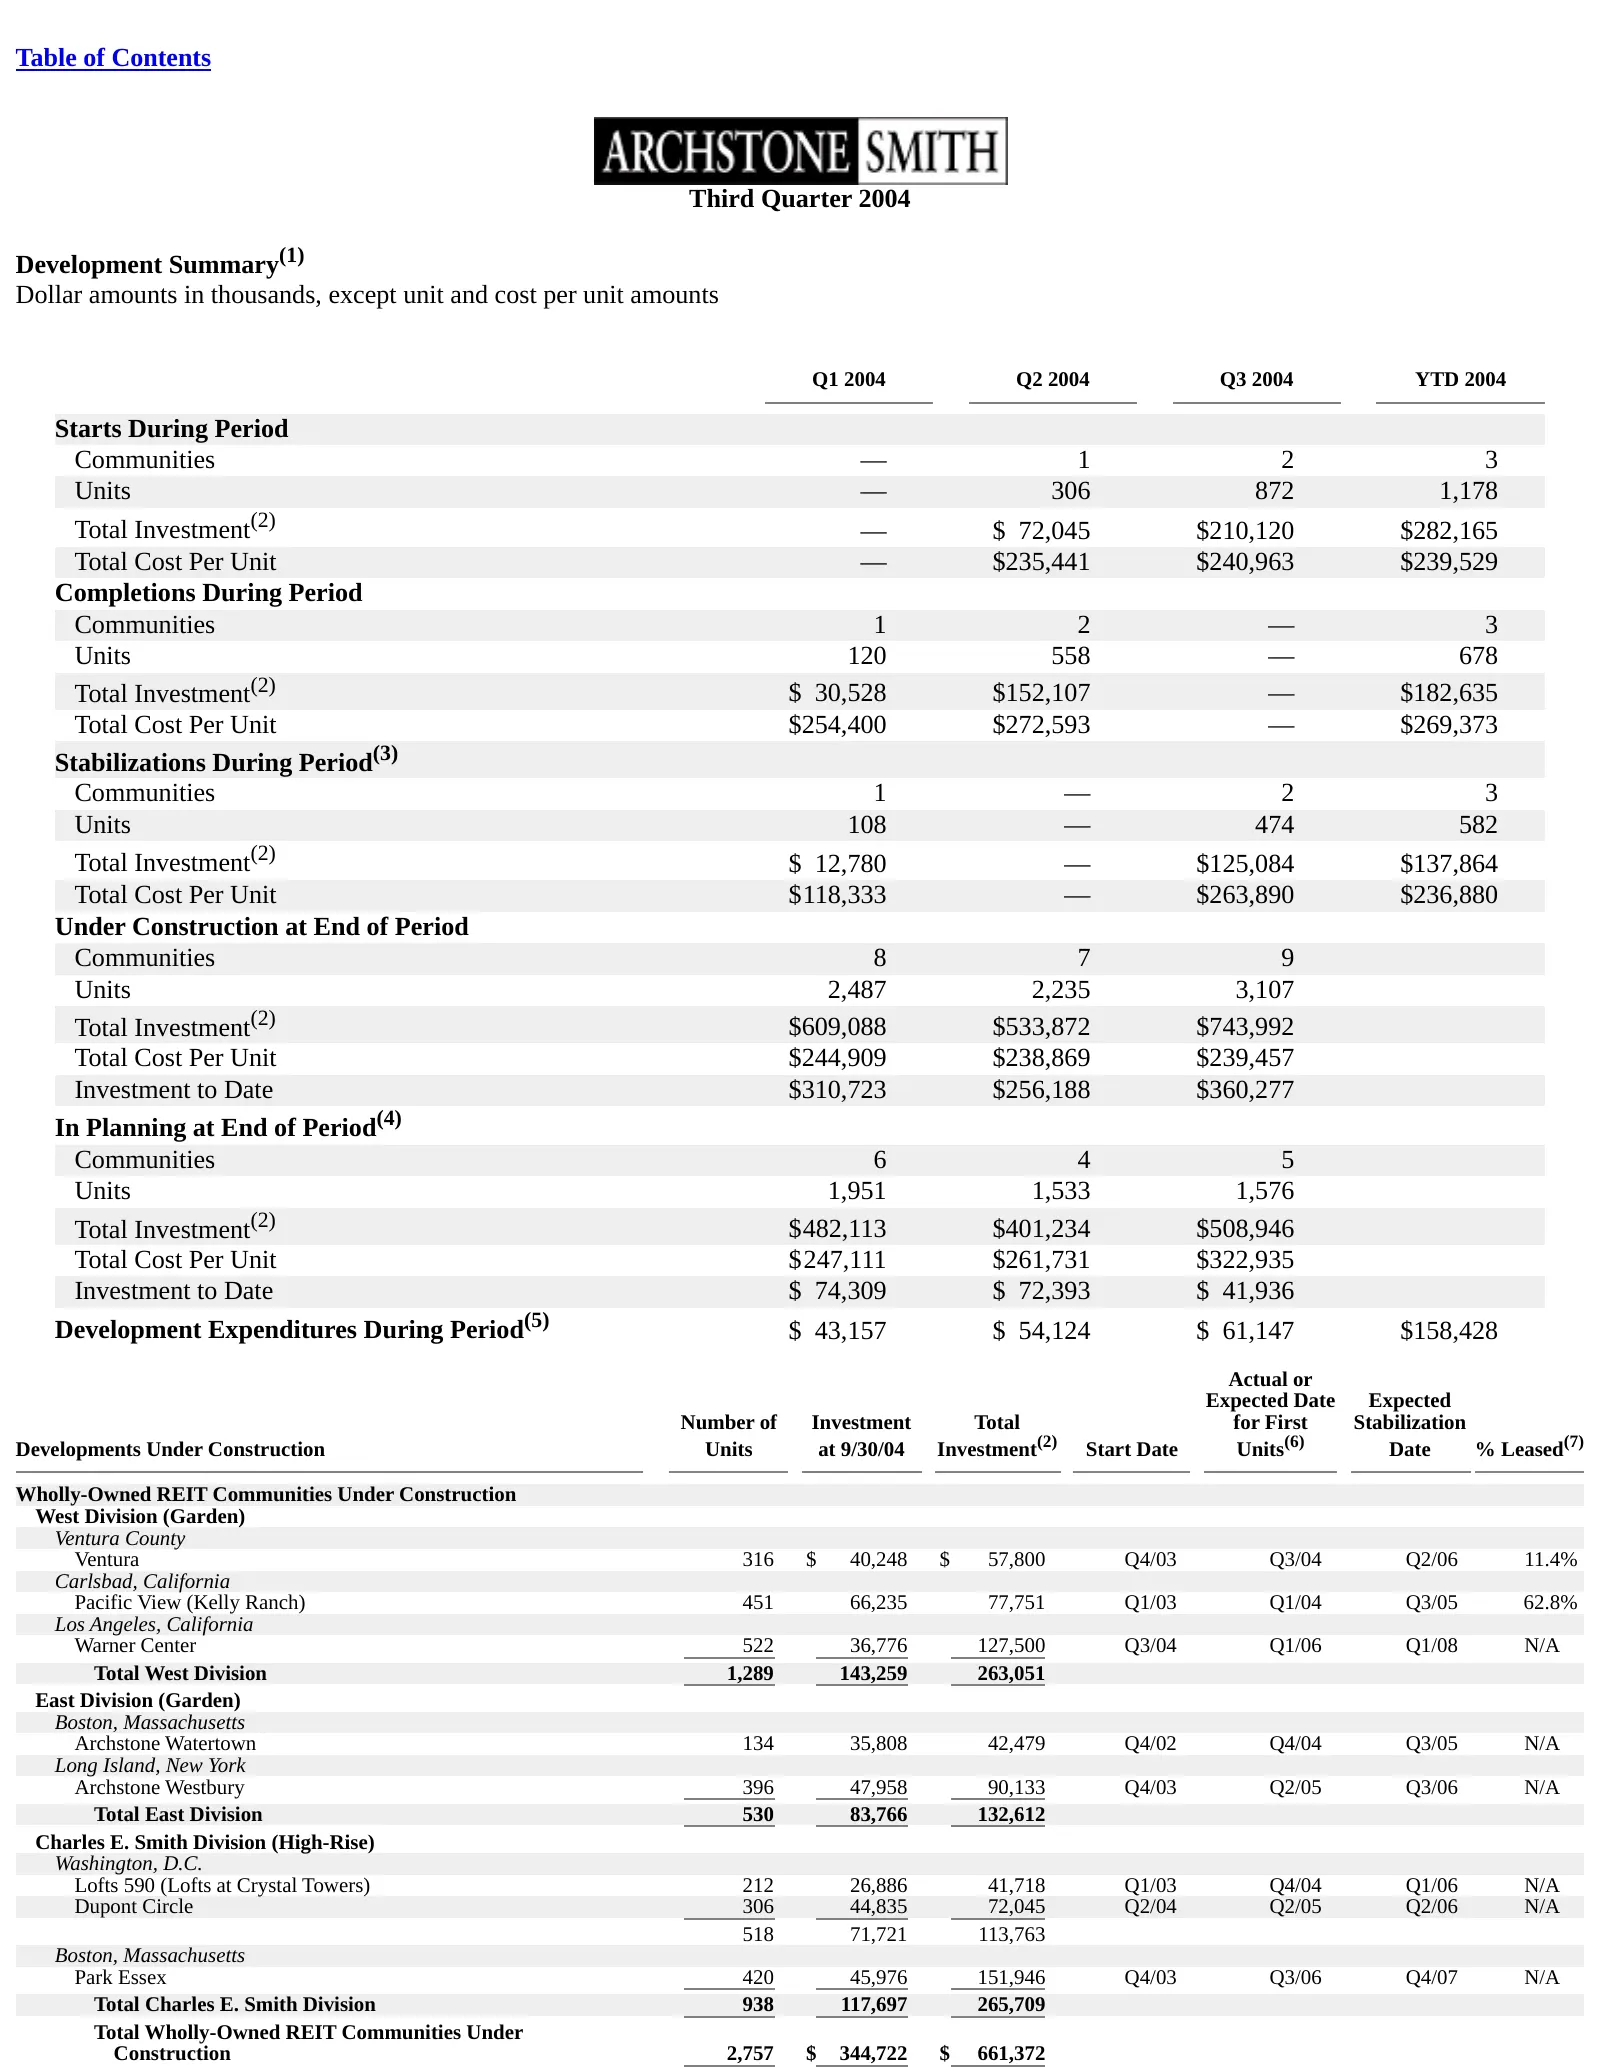
Table of Contents Third Quarter 2004 Development Summary(1) Dollar amounts in thousands, except unit and cost per unit amounts Q1 2004 Q2 2004 Q3 2004 YTD 2004 Starts During Period Communities — 1 2 3 Units — 306 872 1,178 Total Investment(2) — $ 72,045 $210,120 $282,165 Total Cost Per Unit — $235,4
Slide 48: Communities under construction notes
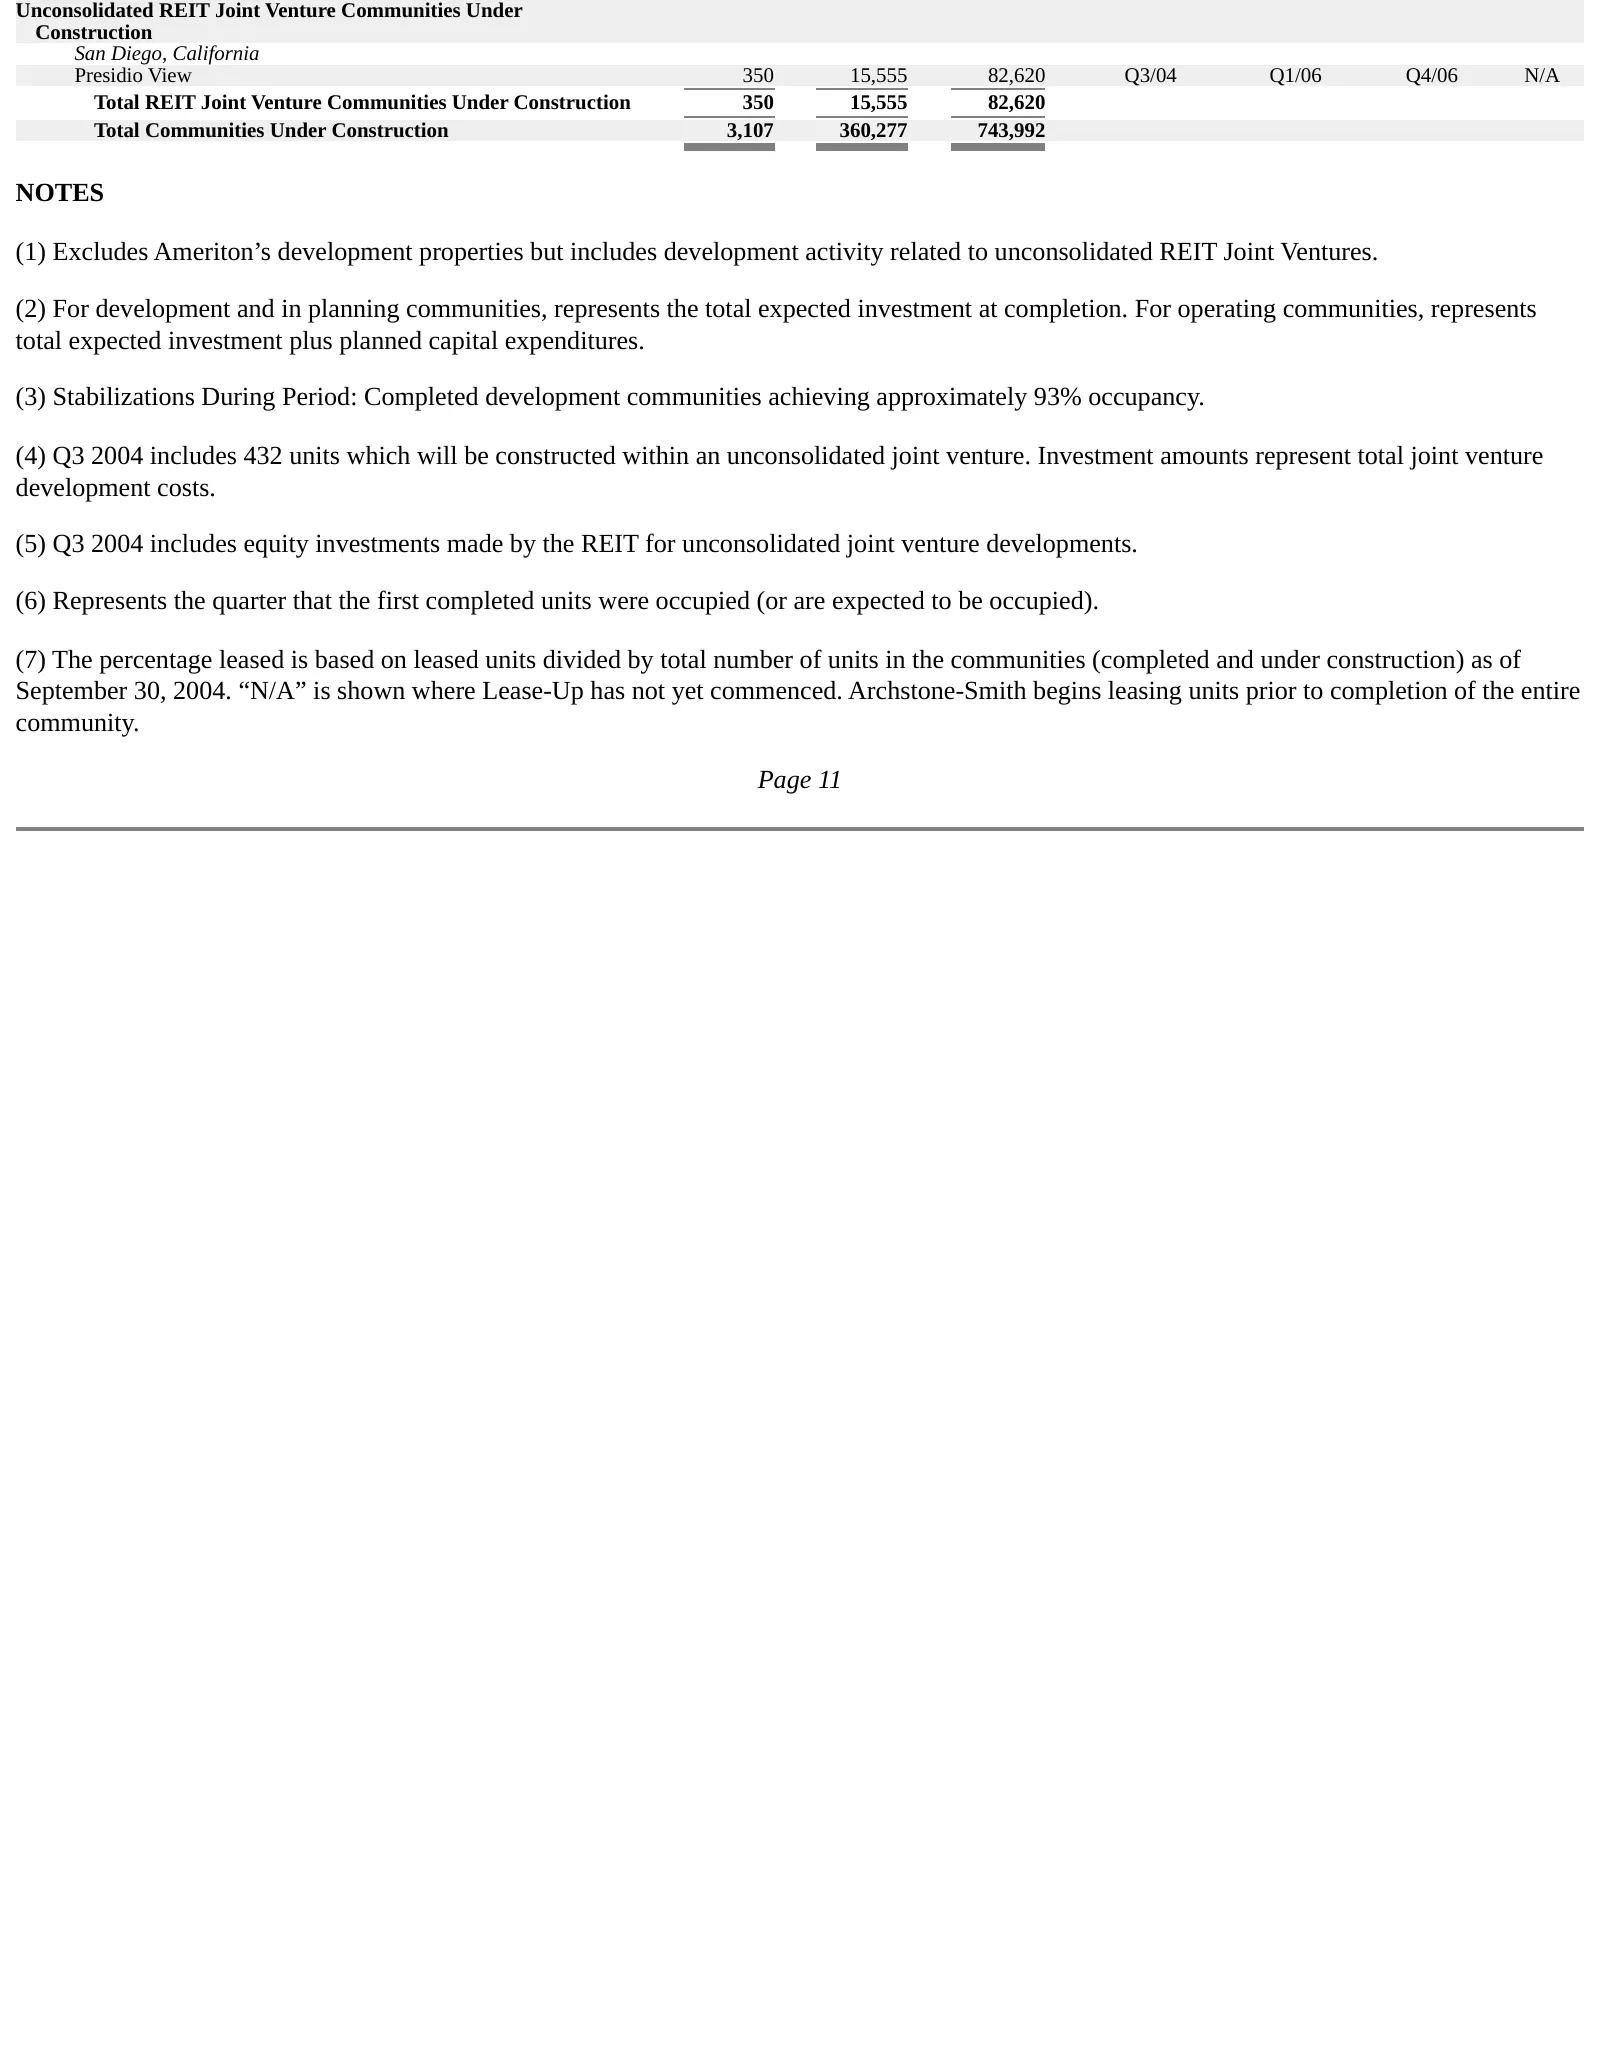
Unconsolidated REIT Joint Venture Communities Under Construction San Diego, California Presidio View 350 15,555 82,620 Q3/04 Q1/06 Q4/06 N/A Total REIT Joint Venture Communities Under Construction 350 15,555 82,620 Total Communities Under Construction 3,107 360,277 743,992 NOTES (1) Excludes Amerito
Slide 49: Capitalization Summary
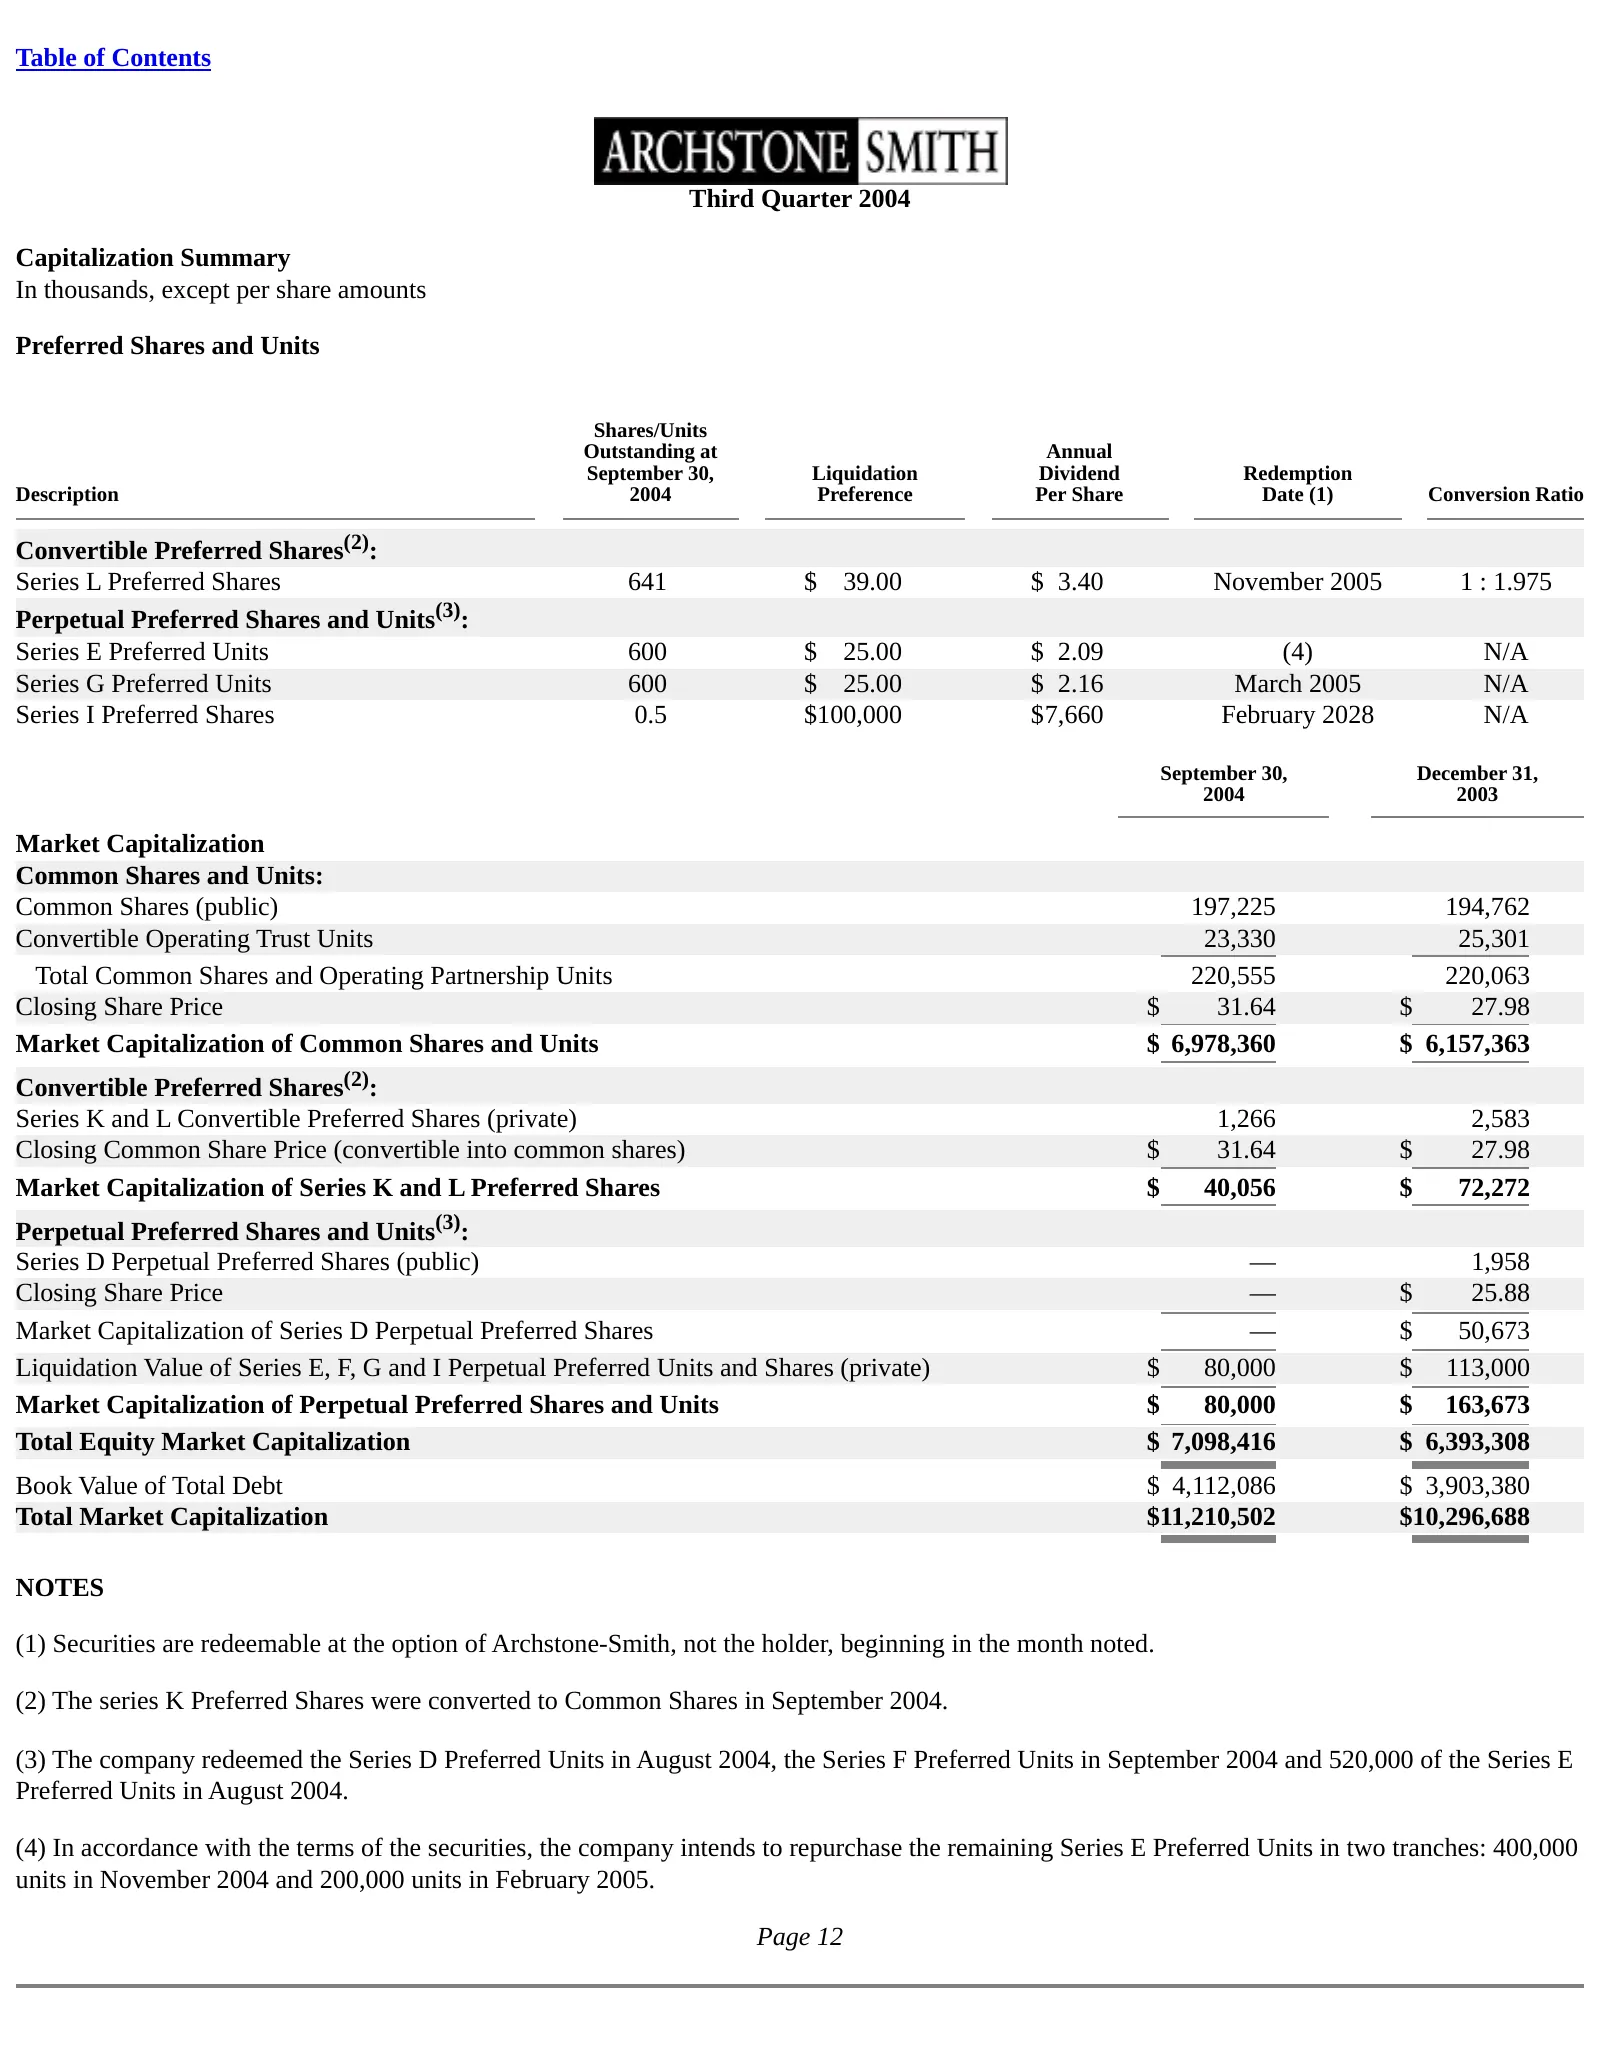
Table of Contents Third Quarter 2004 Capitalization Summary In thousands, except per share amounts Preferred Shares and Units Shares/Units Outstanding at Annual September 30, Liquidation Dividend Redemption Description 2004 Preference Per Share Date (1) Conversion Ratio Convertible Preferred Shares(
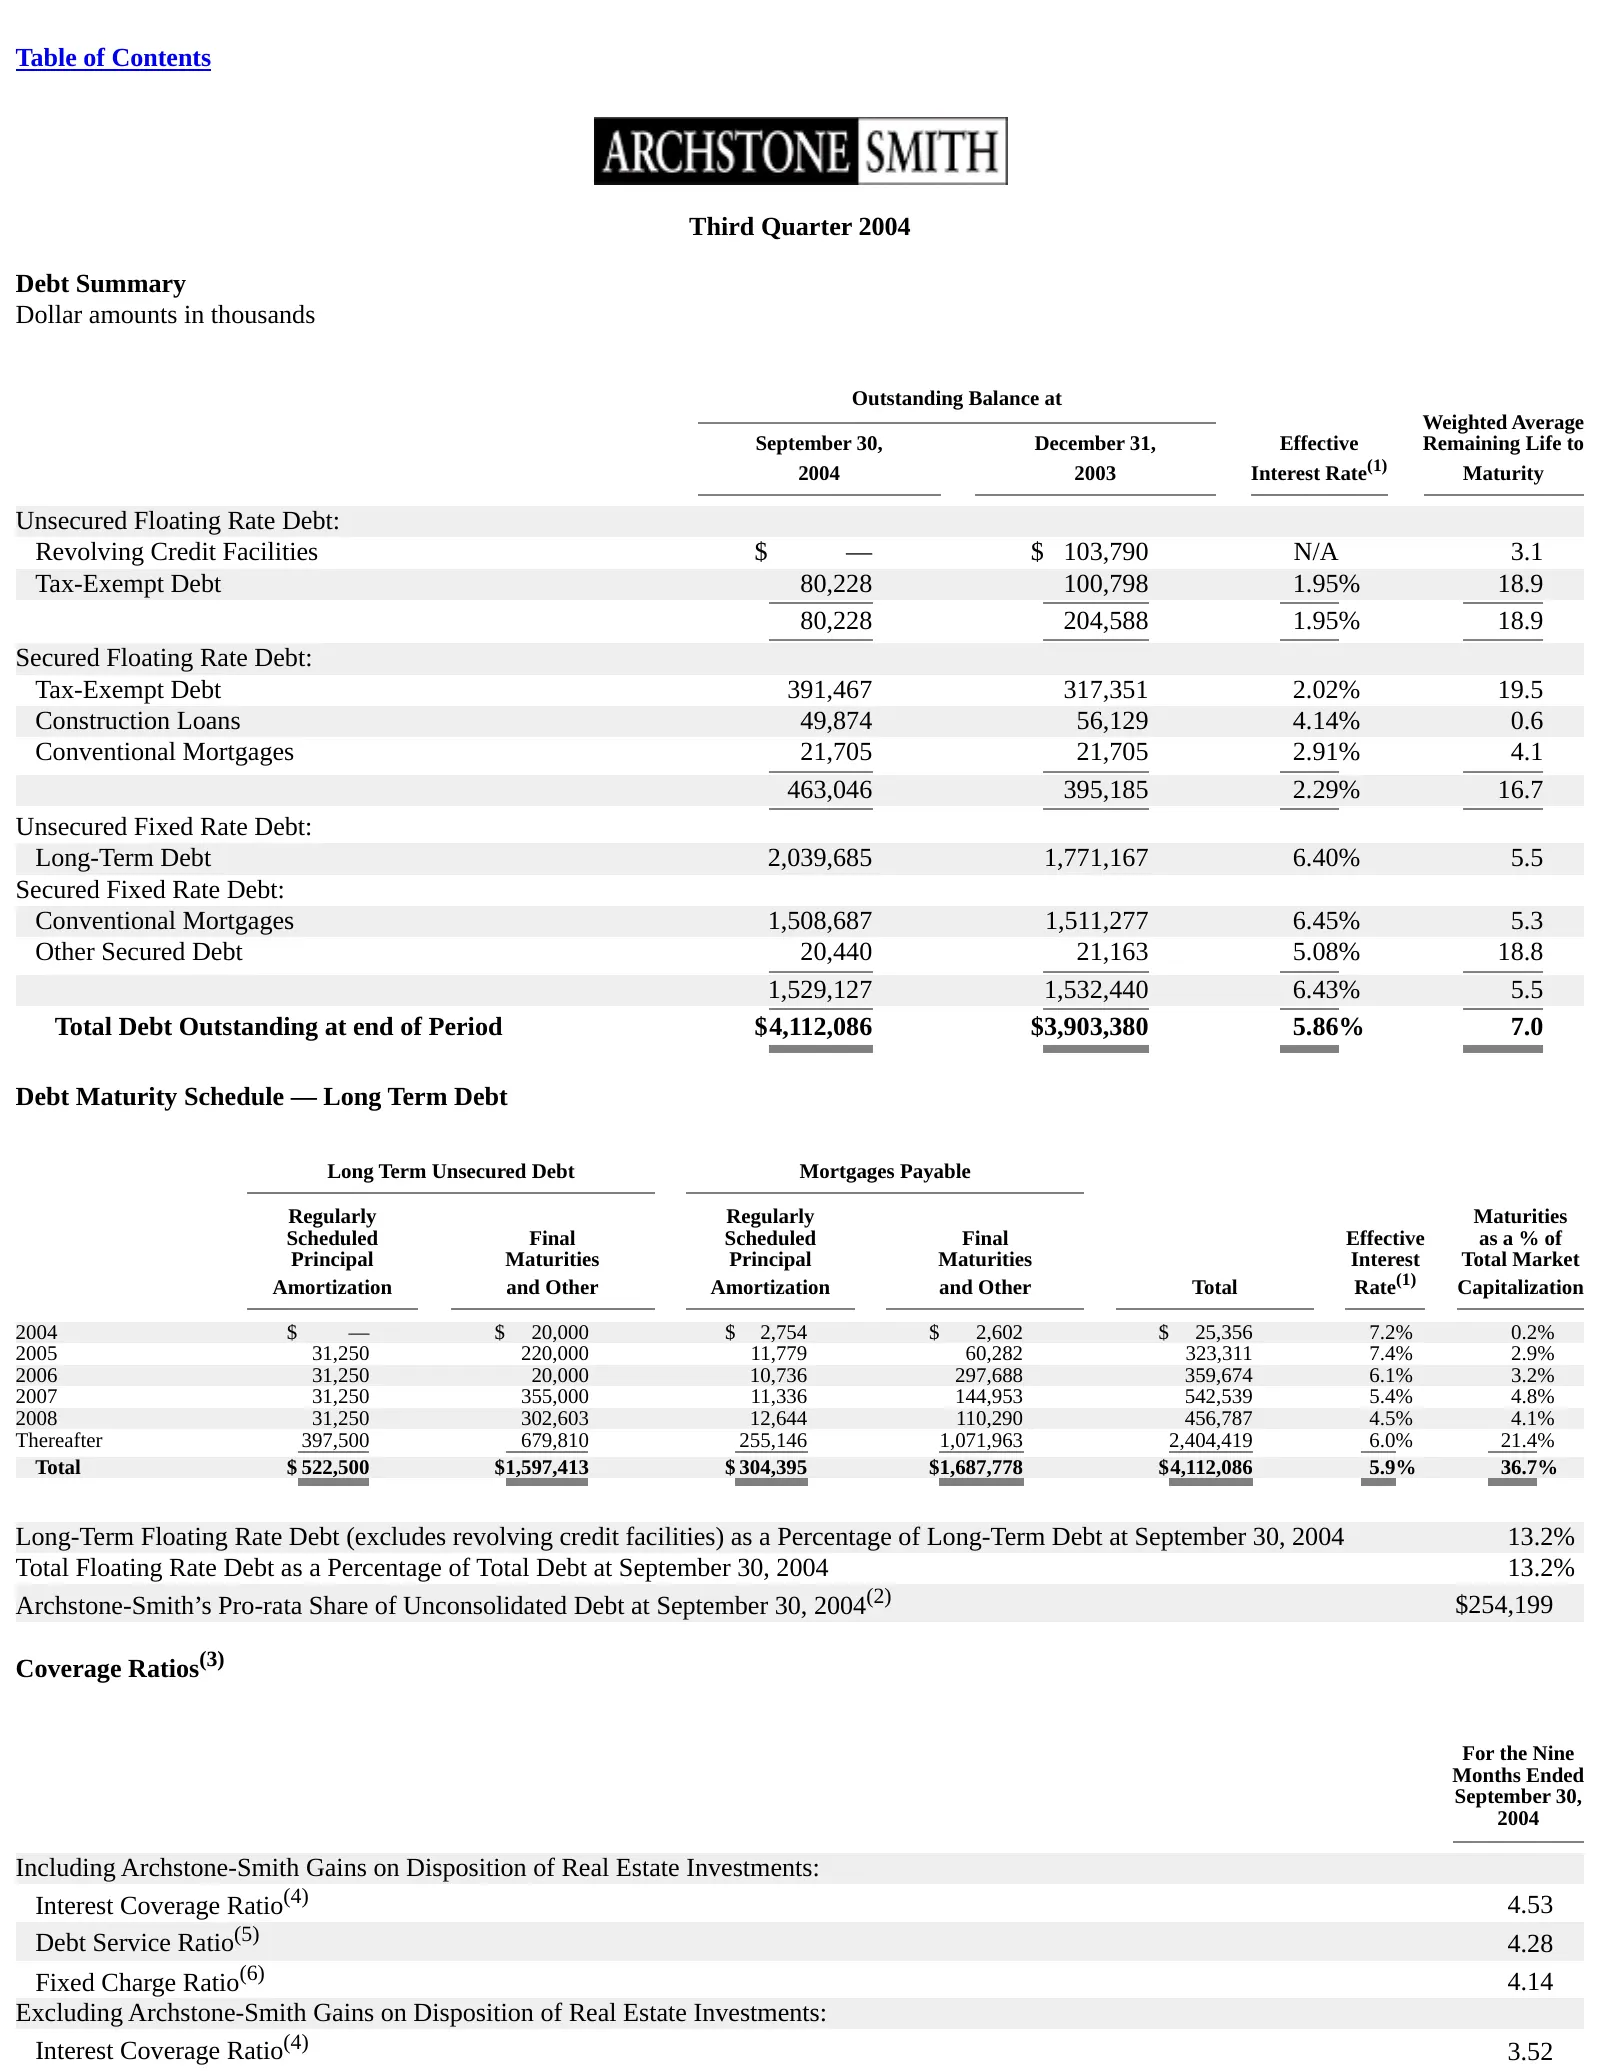
Slide 50: Debt Summary
Table of Contents Third Quarter 2004 Debt Summary Dollar amounts in thousands Outstanding Balance at Weighted Average September 30, December 31, Effective Remaining Life to 2004 2003 Interest Rate(1) Maturity Unsecured Floating Rate Debt: Revolving Credit Facilities $ — $ 103,790 N/A 3.1 Tax-Exempt
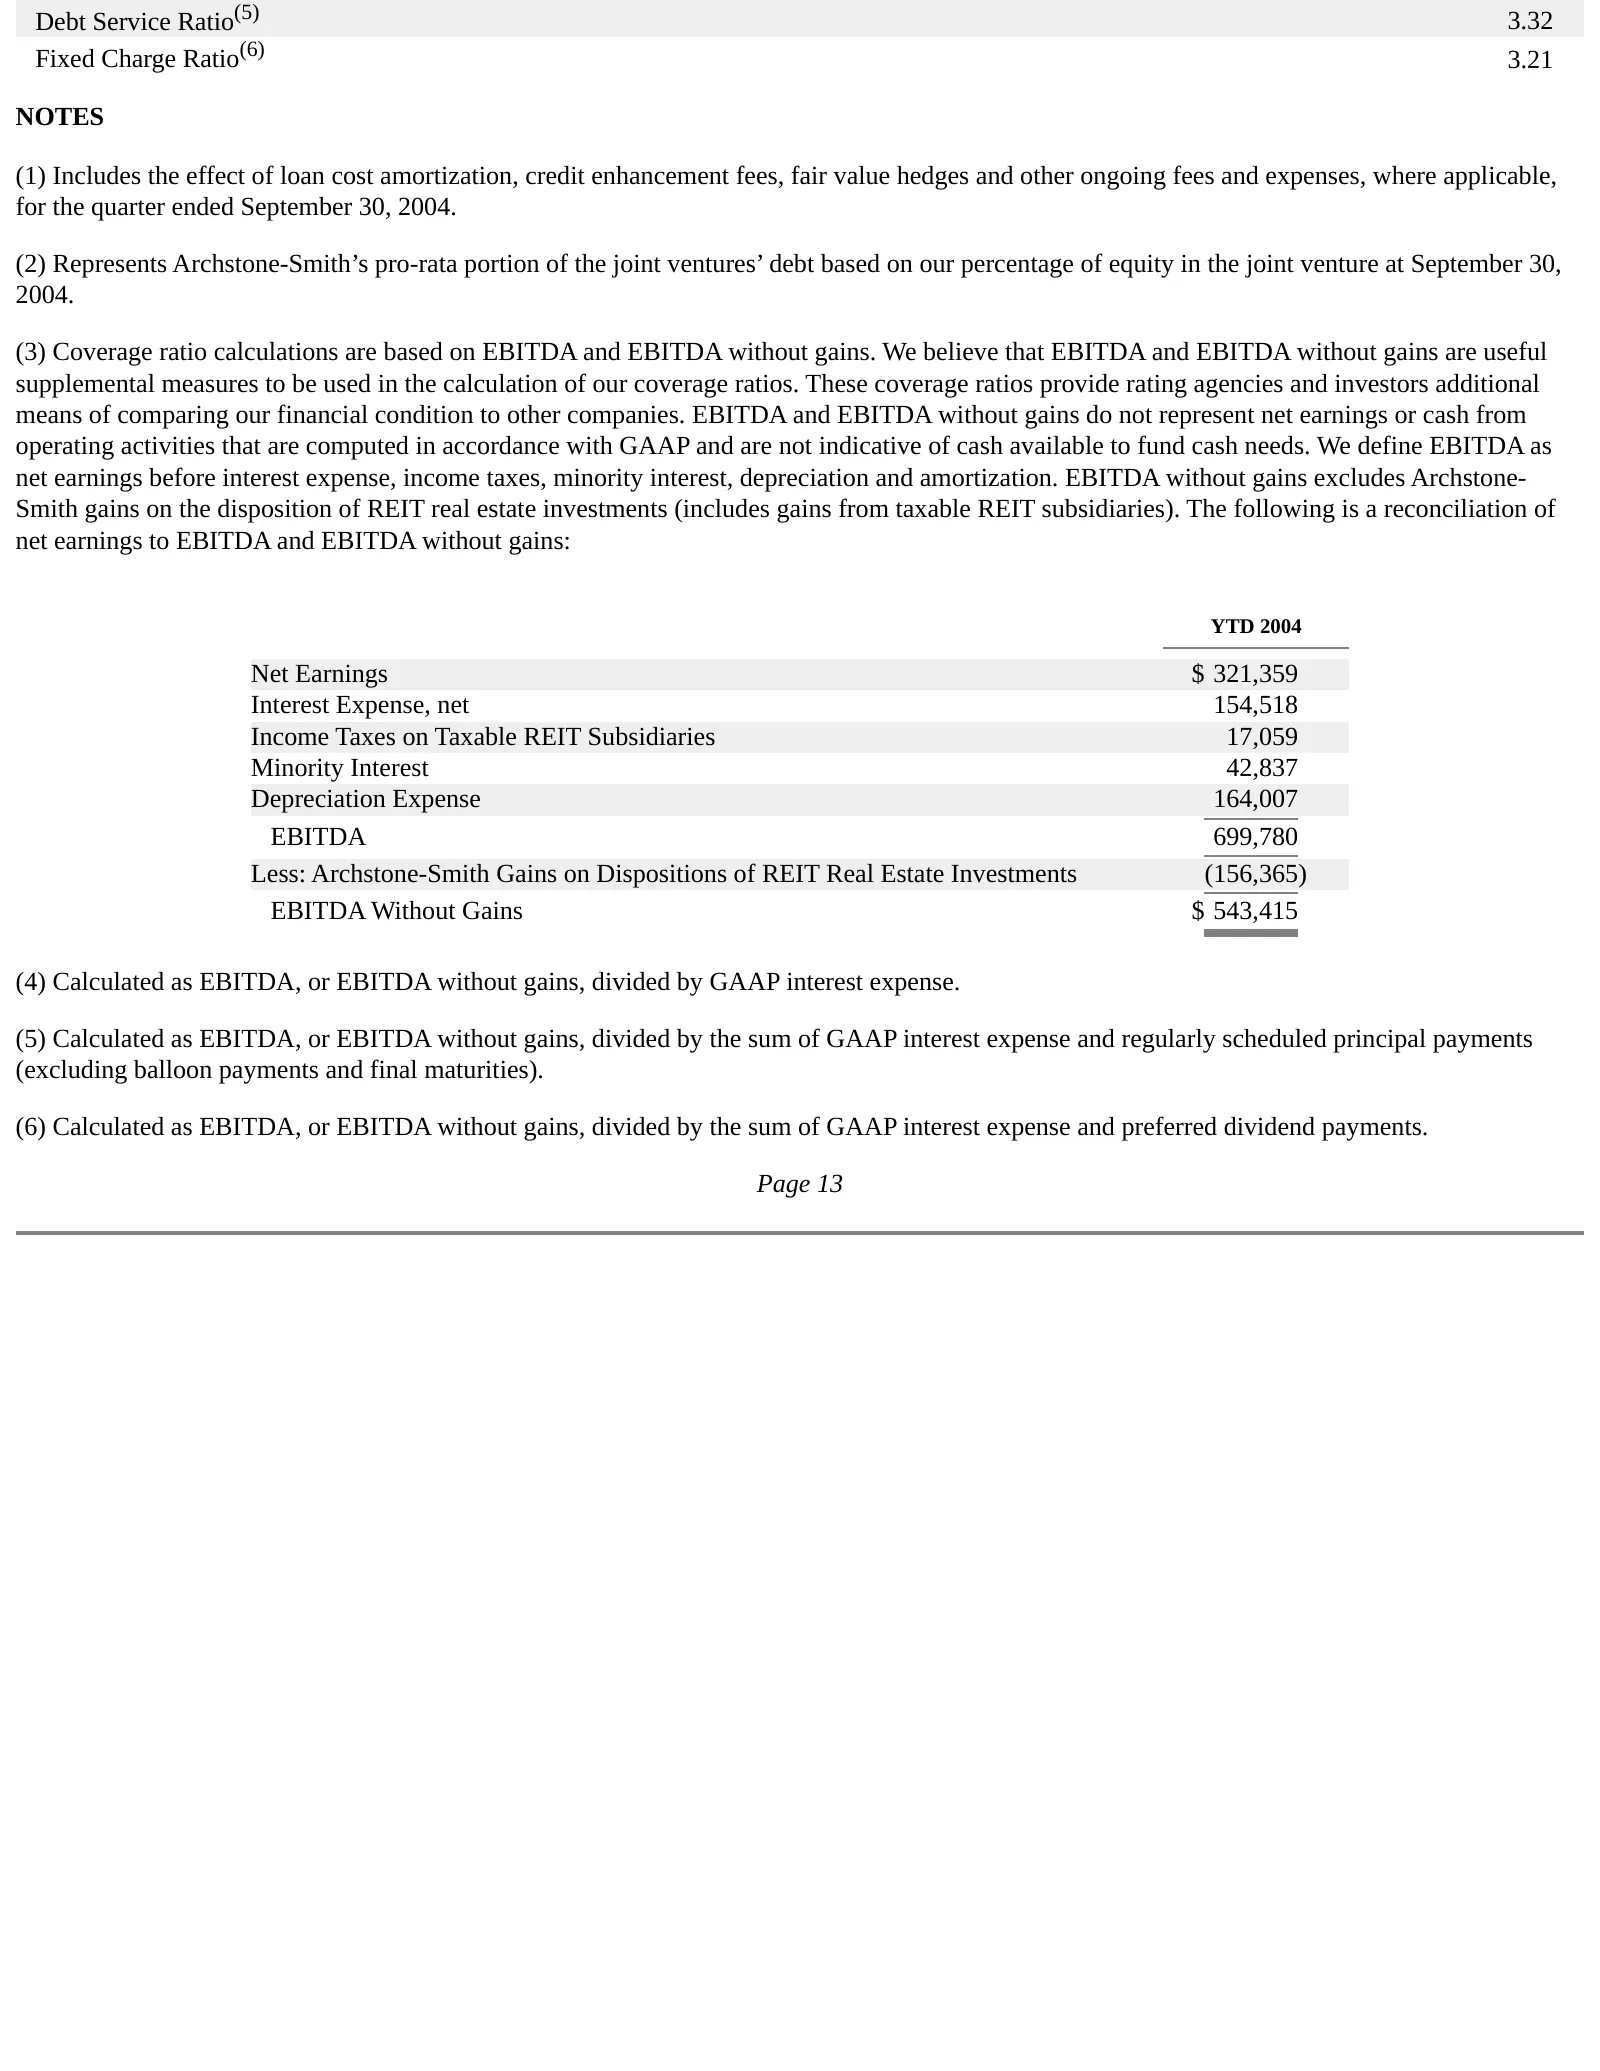
Slide 51: Debt Service Ratio and Fixed Charge Ratio
Debt Service Ratio(5) 3.32 Fixed Charge Ratio(6) 3.21 NOTES (1) Includes the effect of loan cost amortization, credit enhancement fees, fair value hedges and other ongoing fees and expenses, where applicable, for the quarter ended September 30, 2004. (2) Represents Archstone-Smith’s pro-rata portion
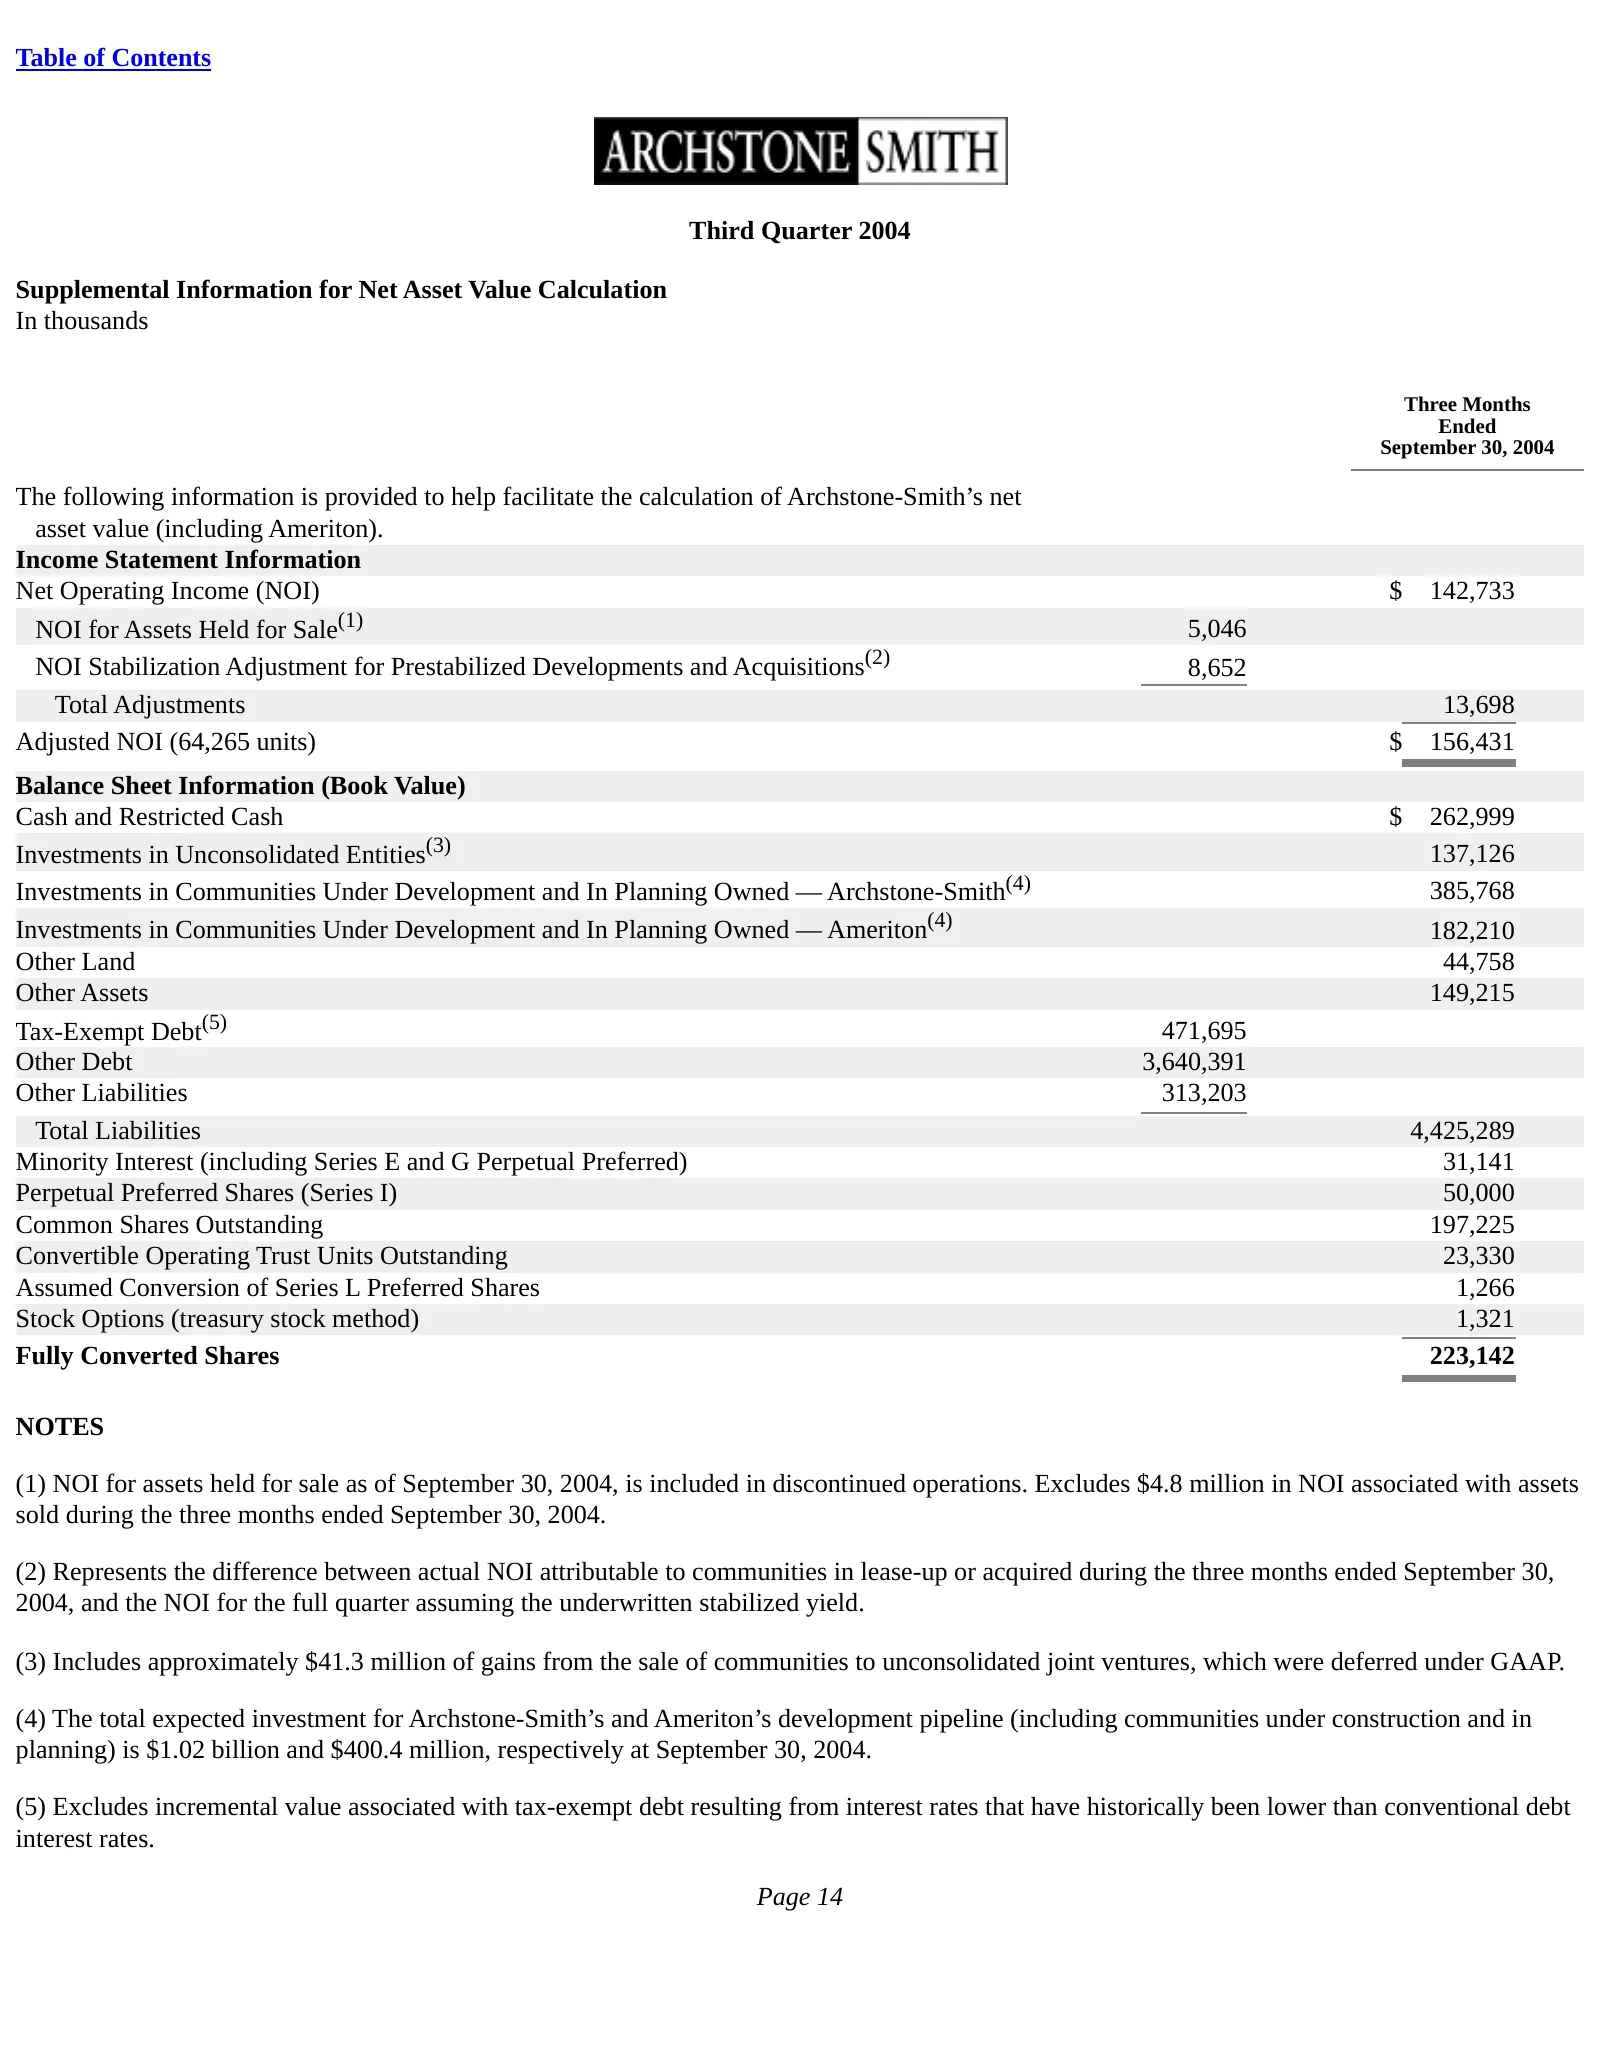
Slide 52: Supplemental Information for Net Asset Value Calculation
Table of Contents Third Quarter 2004 Supplemental Information for Net Asset Value Calculation In thousands Three Months Ended September 30, 2004 The following information is provided to help facilitate the calculation of Archstone-Smith’s net asset value (including Ameriton). Income Statement Inform
Source: SEC EDGAR · 8-K filed Nov 17, 2004
More decks from Archstone Smith Trust
 Citigroup 2007 Global Property CEO Conference26 slides · Mar 5, 2007
 NAREIT Annual Convention 200625 slides · Nov 7, 2006
 NAREIT Institutional Investor Forum June 200626 slides · Jun 5, 2006
 Corporate Update (June 2006)14 slides · Jun 5, 2006
 Corporate Update (April 2006)17 slides · Apr 11, 2006
 Citigroup REIT CEO Conference March 200620 slides · Mar 7, 2006