Naspers Limited Class N · JSE:NPN
Naspers Limited Class N — FY2018 Earnings Presentation
60 slides from Naspers Limited Class N's earnings presentation, 2018

Slide 1: Analyst Booklet – detailed financials
Analyst Booklet – detailed financials For the year ended 31 March 2018
Slide 2: Important information
Important information This report contains forward-looking statements as defined in the United States Private Securities Litigation Reform Act of 1995. Words such as “believe”, “anticipate”, “intend”, “seek”, “will”, “plan”, “could”, “may”, “endeavor” and similar expressions are intended to identify
Slide 3: Agenda
1.Strategic review 2. Operational review Agenda 3. Financial review 4. Outlook

Slide 4: Strategic review
Strategic review
Slide 5: In pursuit of growth - how do we create value?
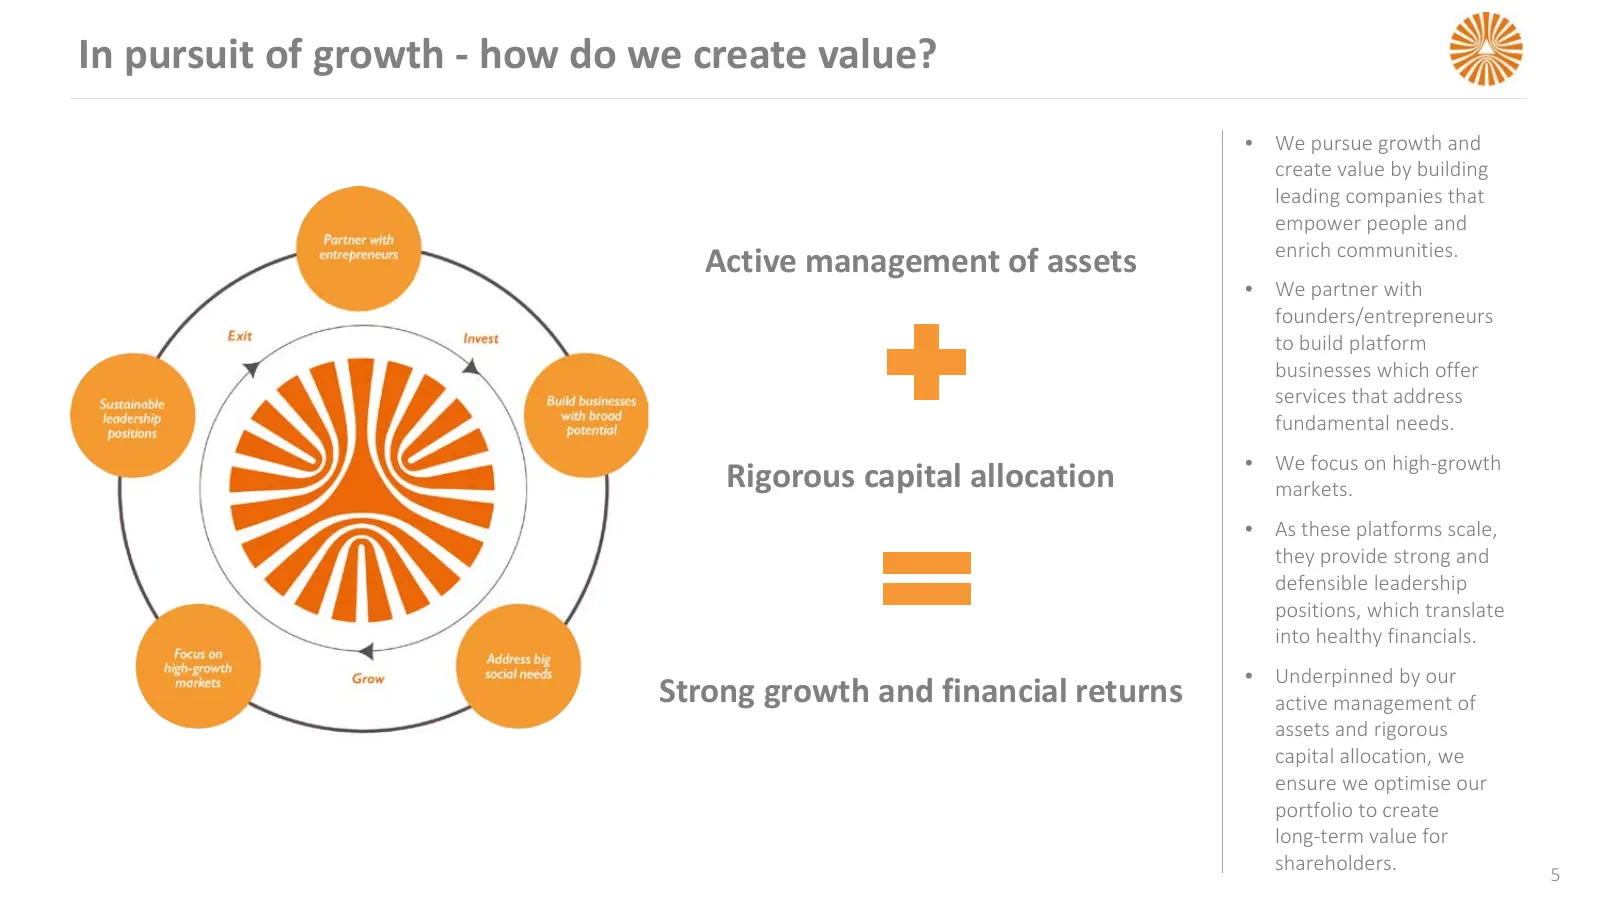
In pursuit of growth - how do we create value? • We pursue growth and create value by building leading companies that empower people and Active management of assets enrich communities. • We partner with founders/entrepreneurs to build platform businesses which offer services that address fundamental
Slide 6: Managing assets and allocating capital for growth and financial returns
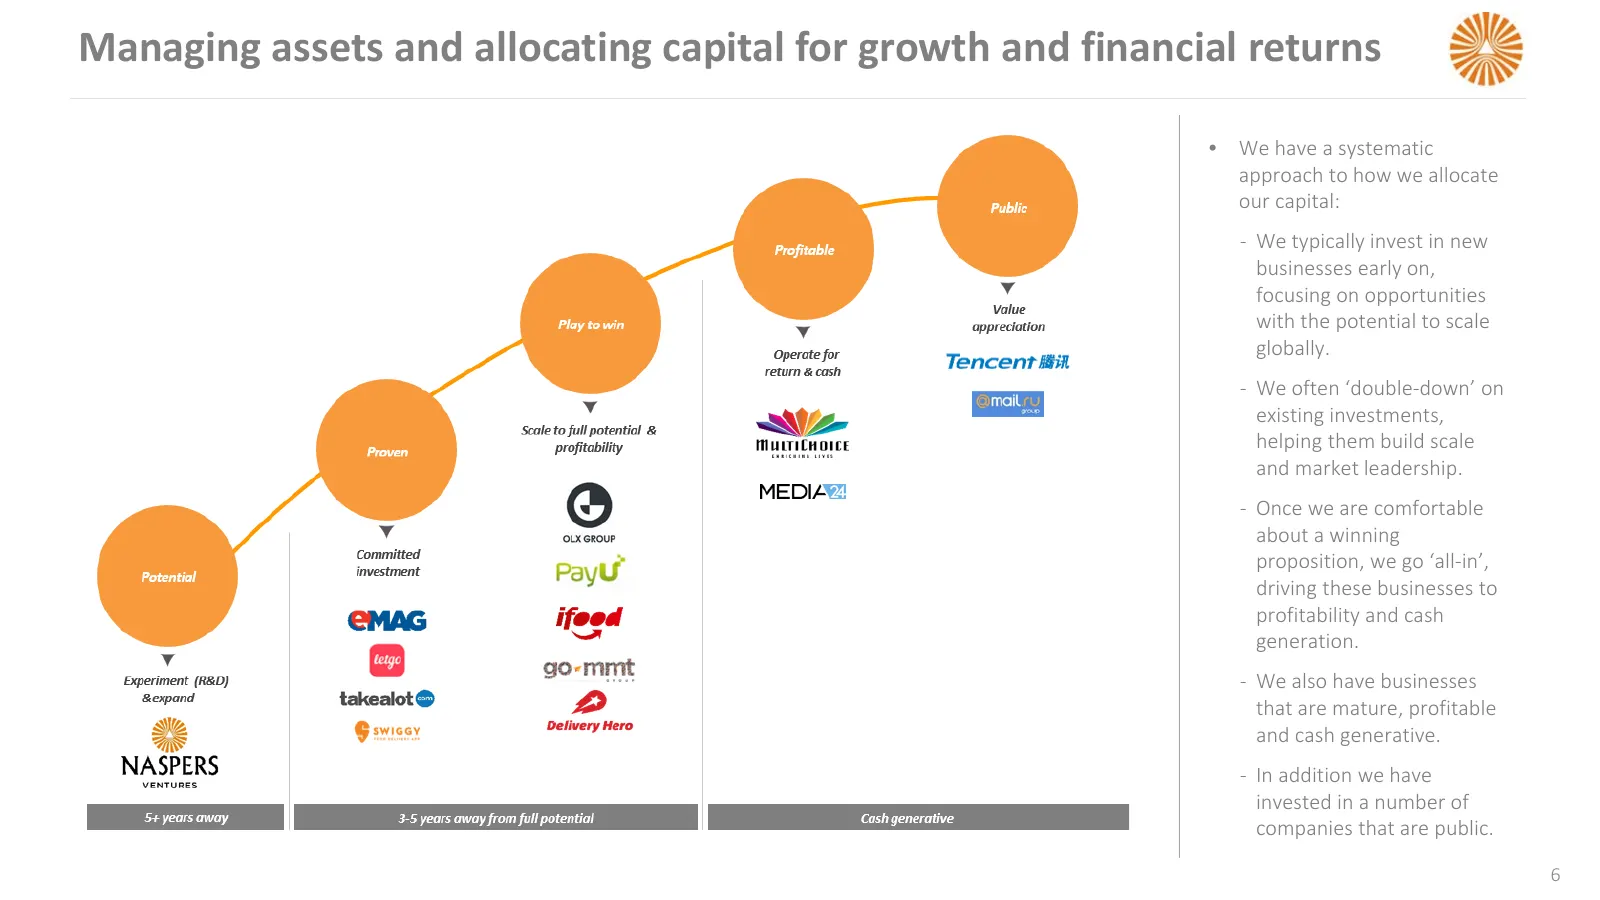
Managing assets and allocating capital for growth and financial returns • We have a systematic approach to how we allocate our capital: ‐ We typically invest in new businesses early on, focusing on opportunities with the potential to scale globally. ‐ We often ‘double-down’ on existing investments,
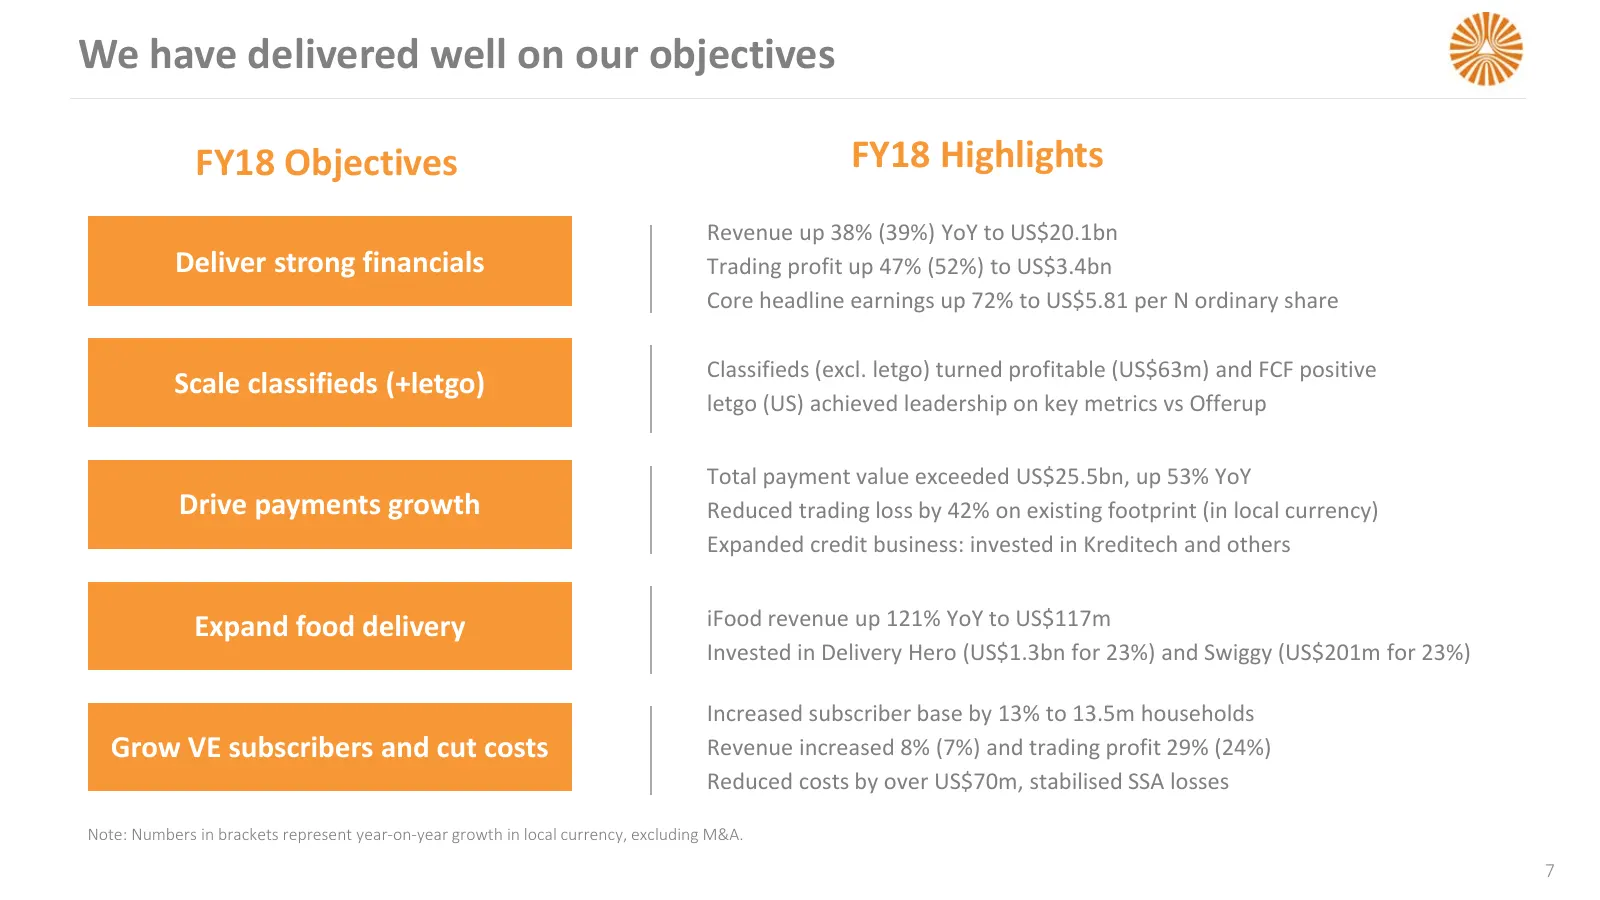
Slide 7: We have delivered well on our objectives
We have delivered well on our objectives FY18 Objectives FY18 Highlights Revenue up 38% (39%) YoY to US$20.1bn Deliver strong financials Trading profit up 47% (52%) to US$3.4bn Core headline earnings up 72% to US$5.81 per N ordinary share Classifieds (excl. letgo) turned profitable (US$63m) and FCF

Slide 8: Operational review
Operational review
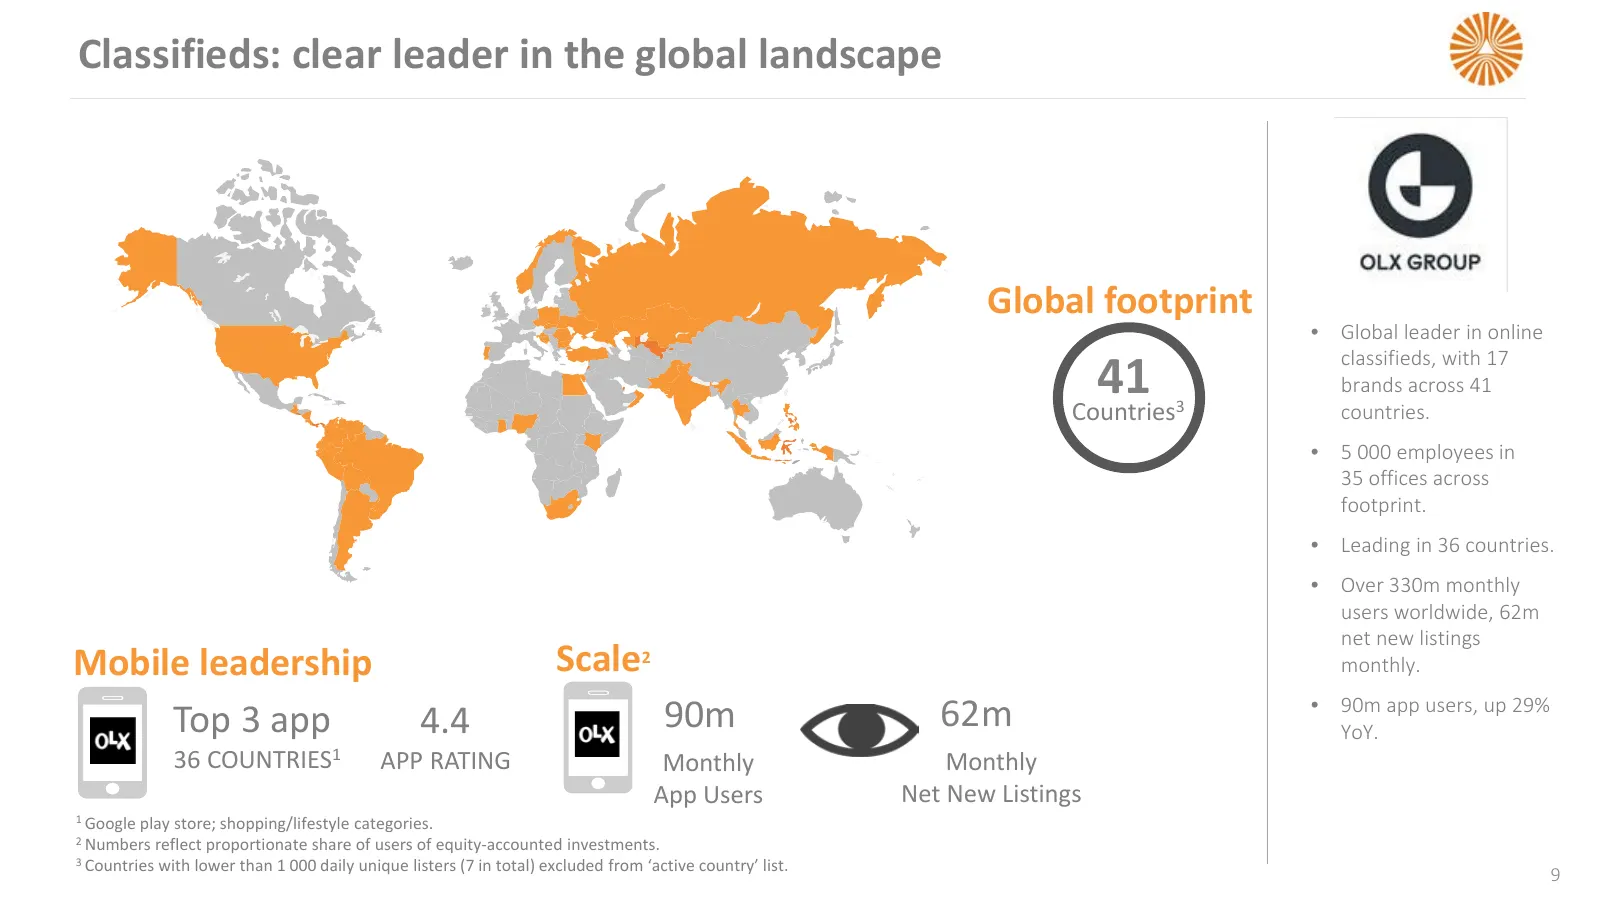
Slide 9: Classifieds: clear leader in the global landscape
Classifieds: clear leader in the global landscape Global footprint • Global leader in online 41 classifieds, with 17 brands across 41 Countries3 countries. • 5 000 employees in 35 offices across footprint. • Leading in 36 countries. • Over 330m monthly users worldwide, 62m net new listings Mobile le
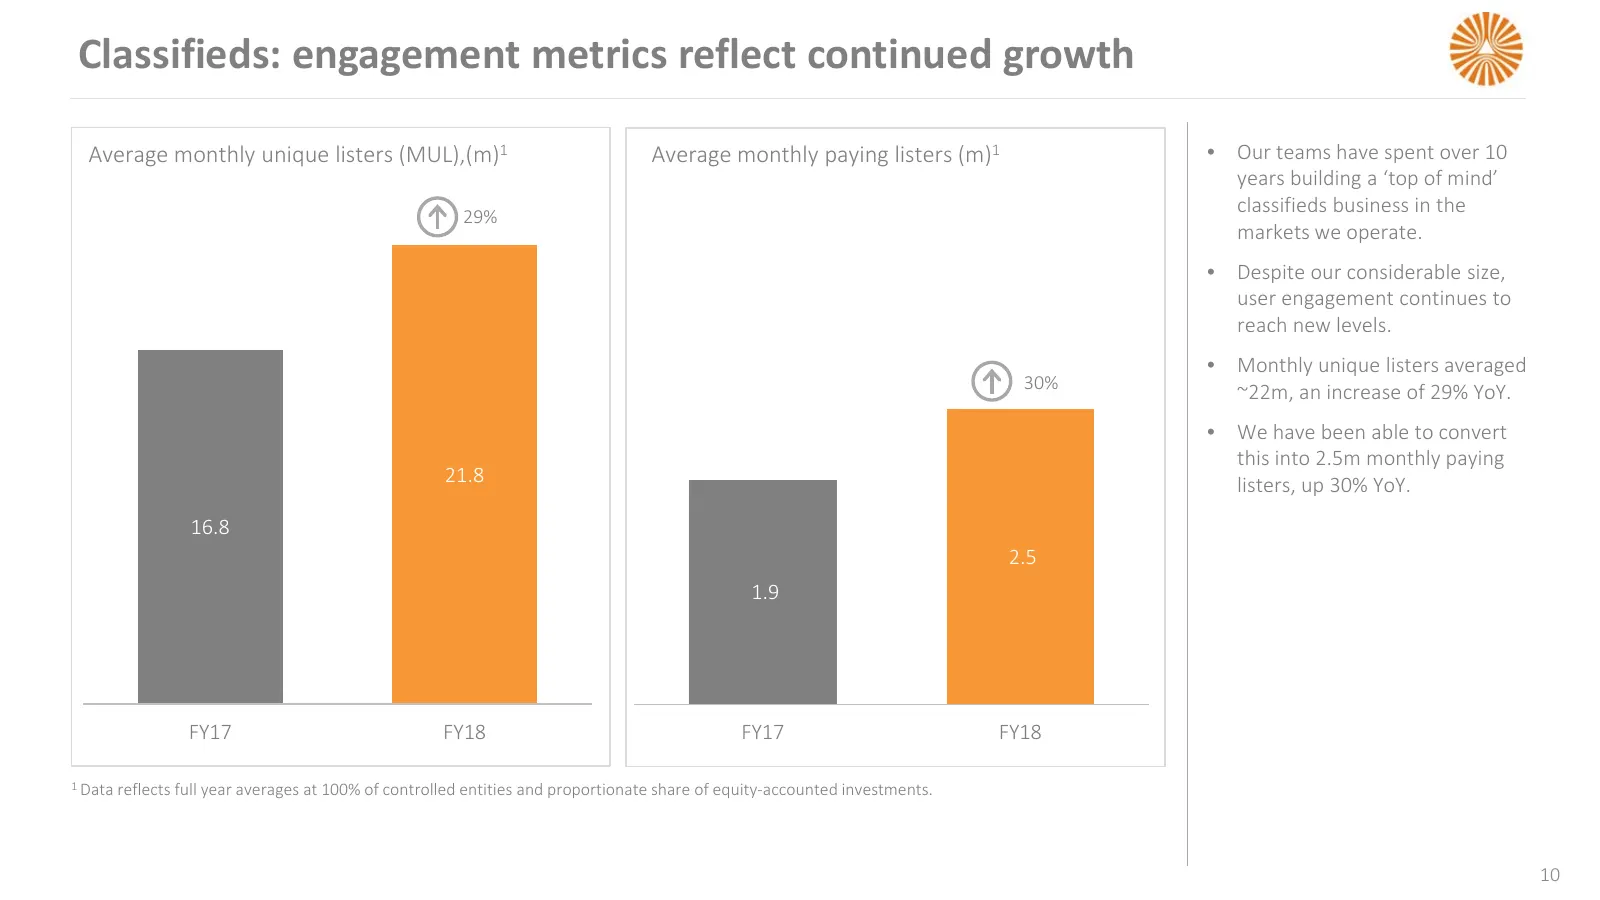
Slide 10: Classifieds: engagement metrics reflect continued growth
Classifieds: engagement metrics reflect continued growth Average monthly unique listers (MUL),(m)1 Average monthly paying listers (m)1 • Our teams have spent over 10 years building a ‘top of mind’ 29% classifieds business in the markets we operate. • Despite our considerable size, user engagement co
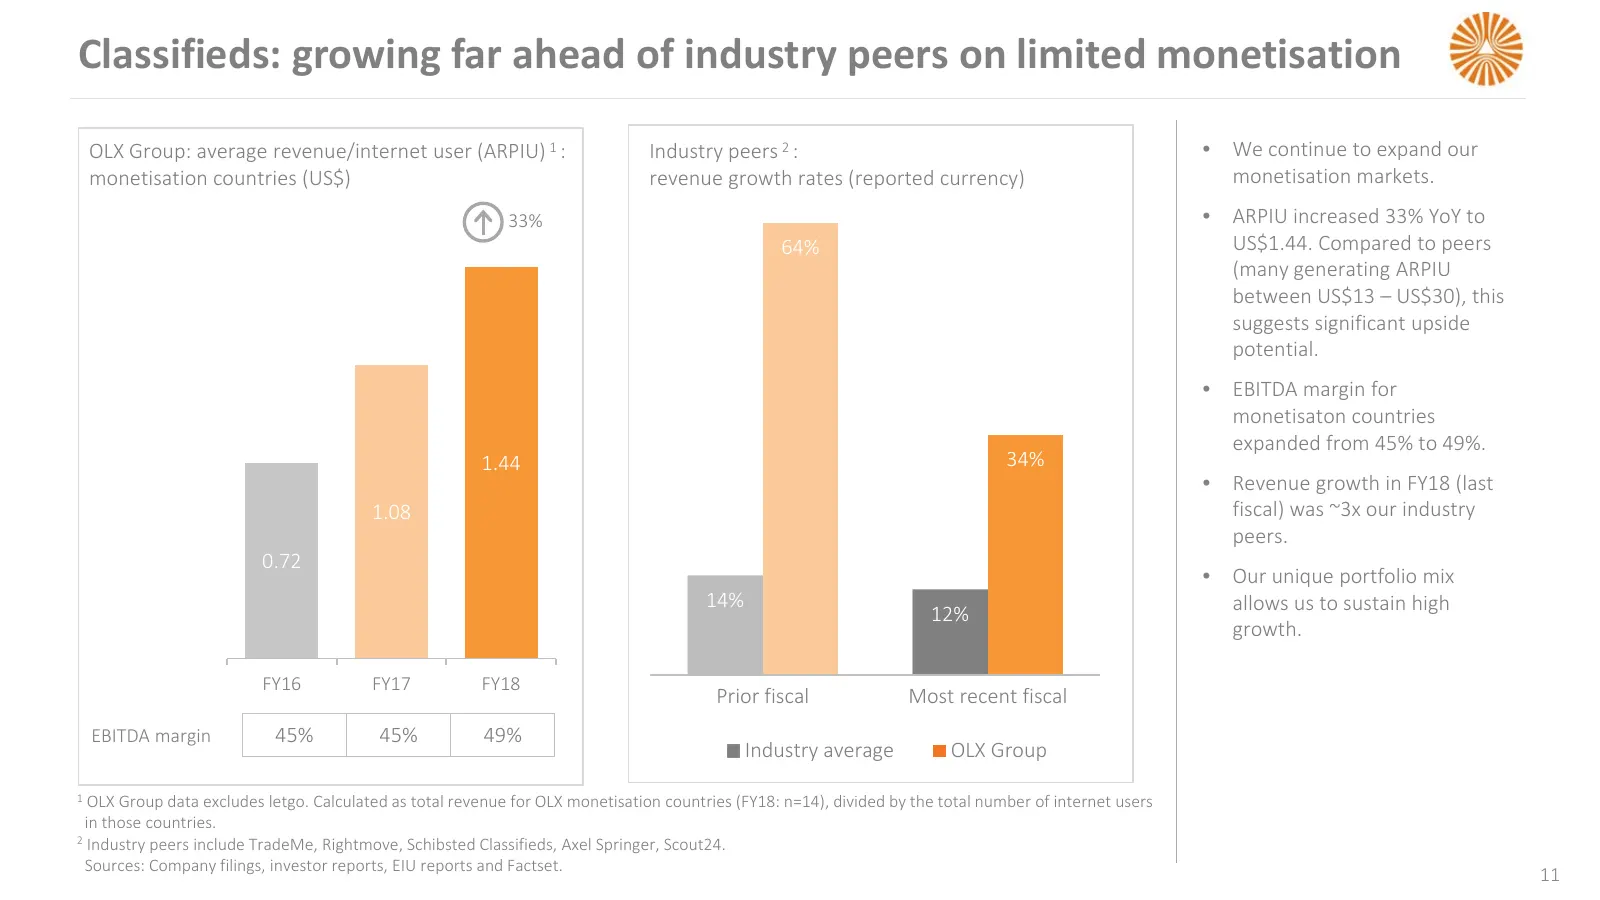
Slide 11: Classifieds: growing far ahead of industry peers on limited monetisation
Classifieds: growing far ahead of industry peers on limited monetisation OLX Group: average revenue/internet user (ARPIU) 1 : Industry peers 2 : • We continue to expand our monetisation countries (US$) revenue growth rates (reported currency) monetisation markets. 33% • ARPIU increased 33% YoY to 64
Slide 12: Classifieds: acceleration by our European leaders
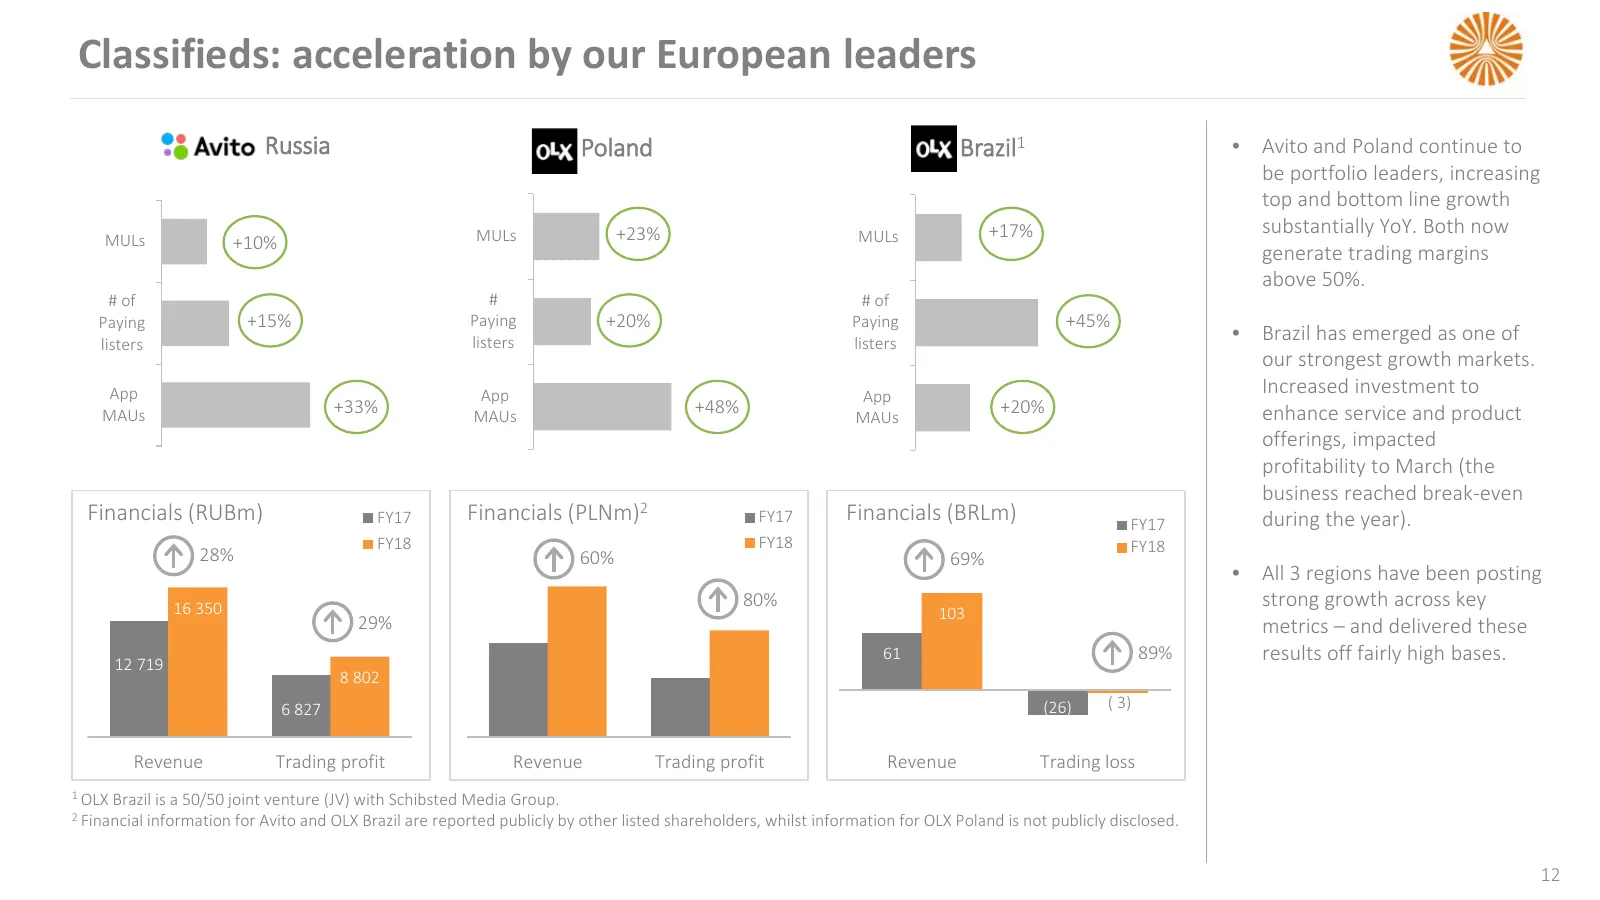
Classifieds: acceleration by our European leaders Russia Poland Brazil1 • Avito and Poland continue to be portfolio leaders, increasing top and bottom line growth MULs +23% MULs +17% substantially YoY. Both now MULs +10% generate trading margins above 50%. # of # # of Paying +15% Paying +20% Paying
Slide 13: Classifieds: letgo growth exceeding expectations on limited marketing
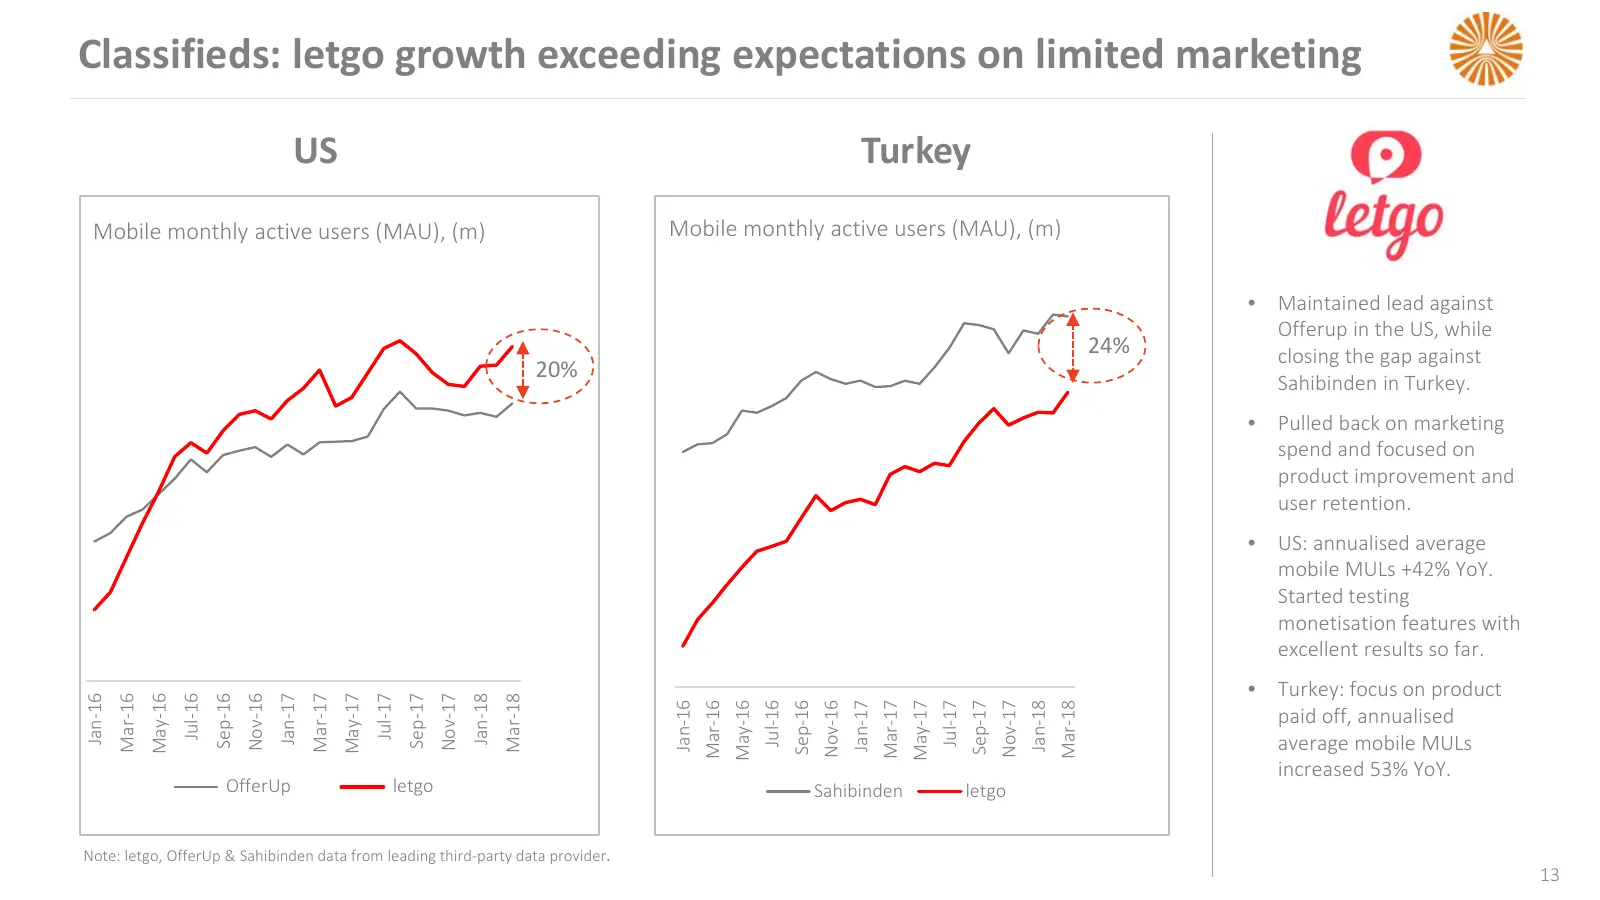
Classifieds: letgo growth exceeding expectations on limited marketing US Turkey Mobile monthly active users (MAU), (m) Mobile monthly active users (MAU), (m) • Maintained lead against Offerup in the US, while 24% closing the gap against 20% Sahibinden in Turkey. • Pulled back on marketing spend and
Slide 14: Classifieds: extending our business model
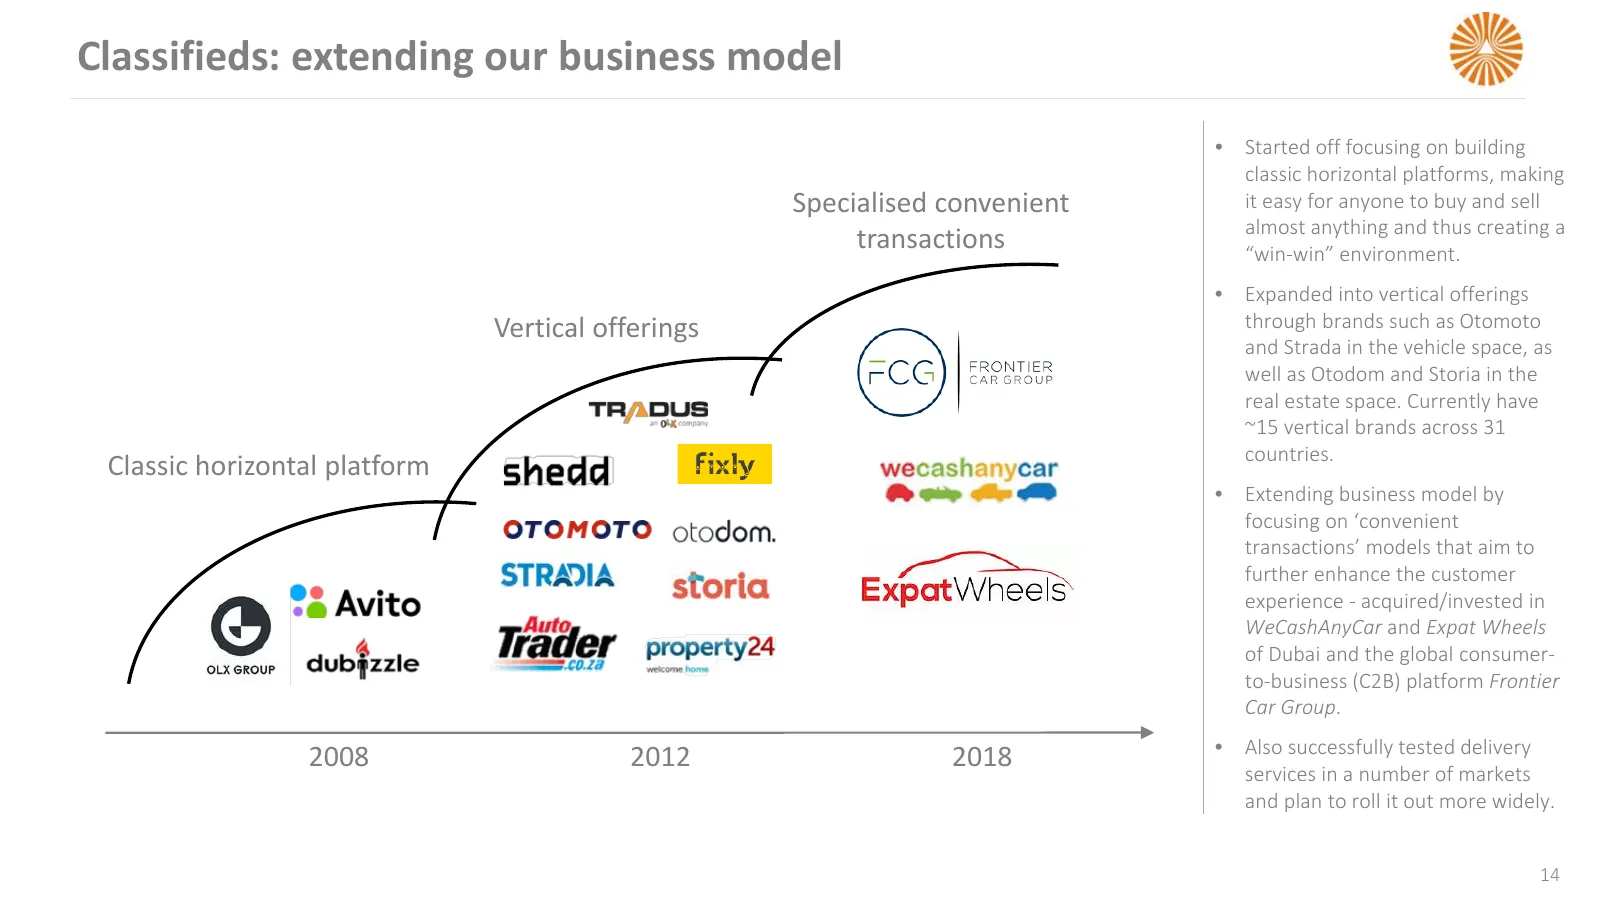
Classifieds: extending our business model • Started off focusing on building classic horizontal platforms, making Specialised convenient it easy for anyone to buy and sell almost anything and thus creating a transactions “win-win” environment. • Expanded into vertical offerings Vertical offerings th
Slide 15: Payments: scaling the core business, building organisational capabilities
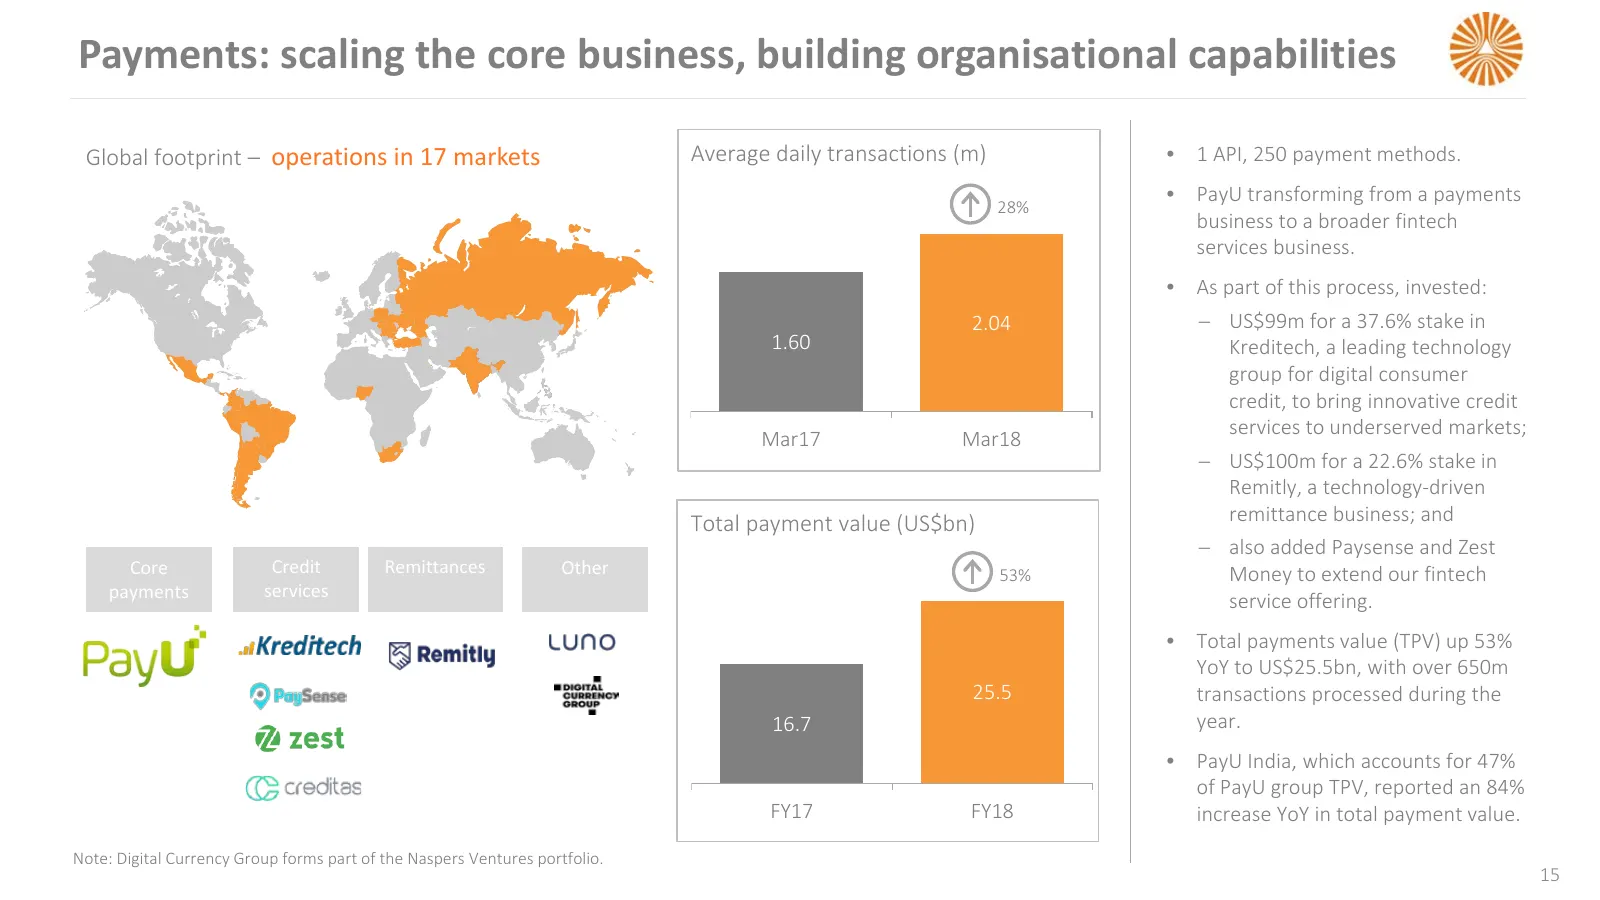
Payments: scaling the core business, building organisational capabilities Global footprint – operations in 17 markets Average daily transactions (m) • 1 API, 250 payment methods. • PayU transforming from a payments 28% business to a broader fintech services business. • As part of this process, inves
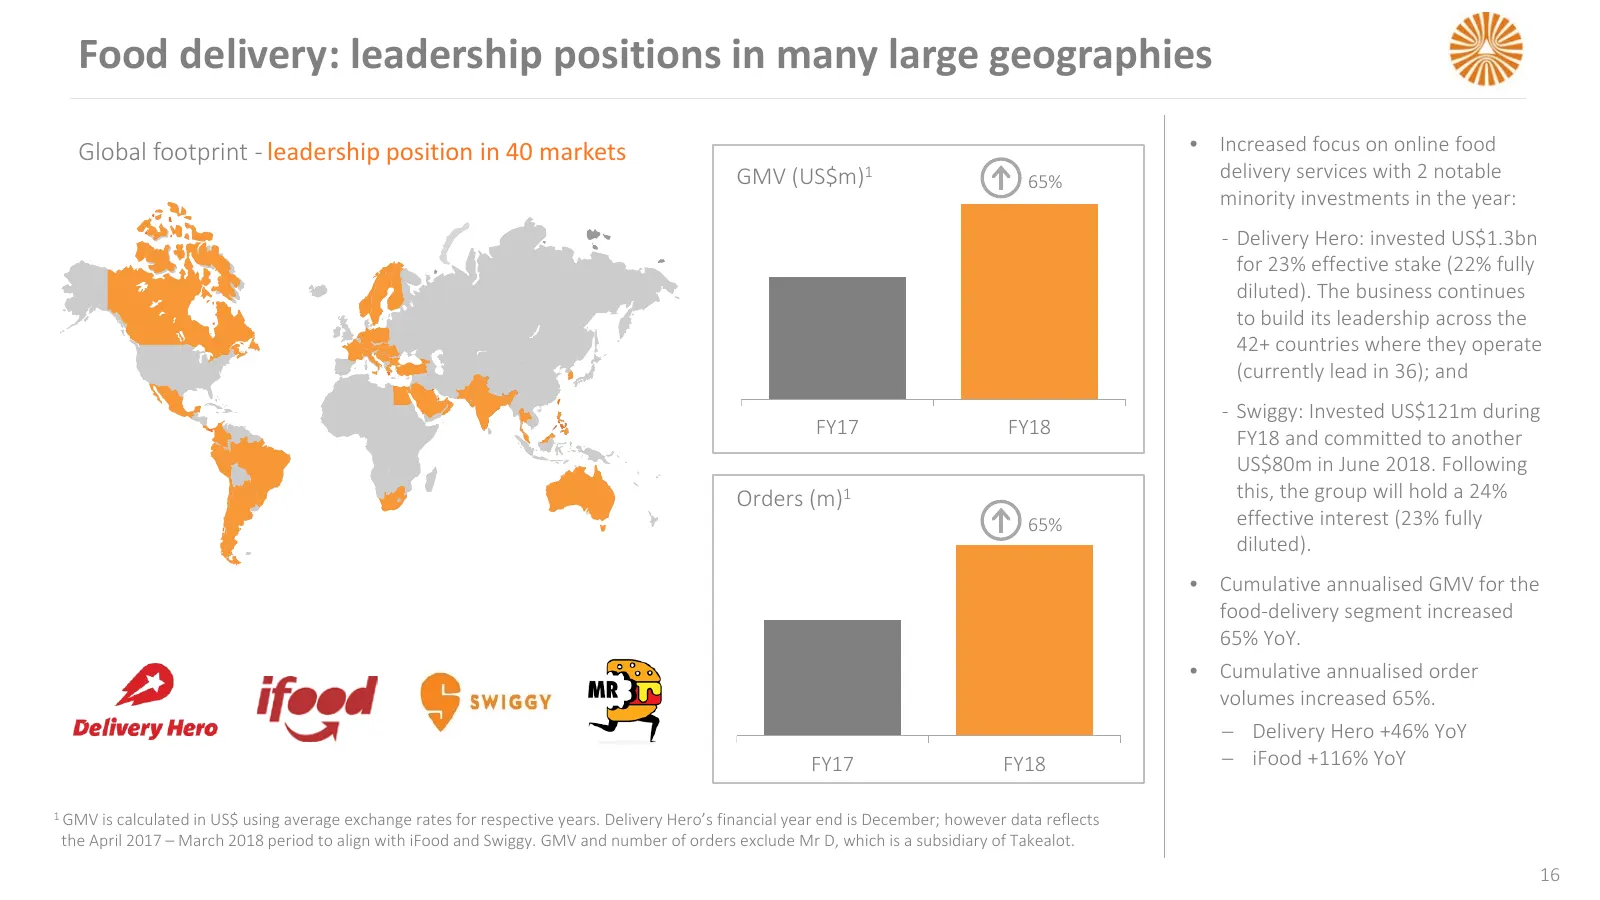
Slide 16: Food delivery: leadership positions in many large geographies
Food delivery: leadership positions in many large geographies Global footprint - leadership position in 40 markets • Increased focus on online food GMV (US$m)1 65% delivery services with 2 notable minority investments in the year: ‐ Delivery Hero: invested US$1.3bn for 23% effective stake (22% fully
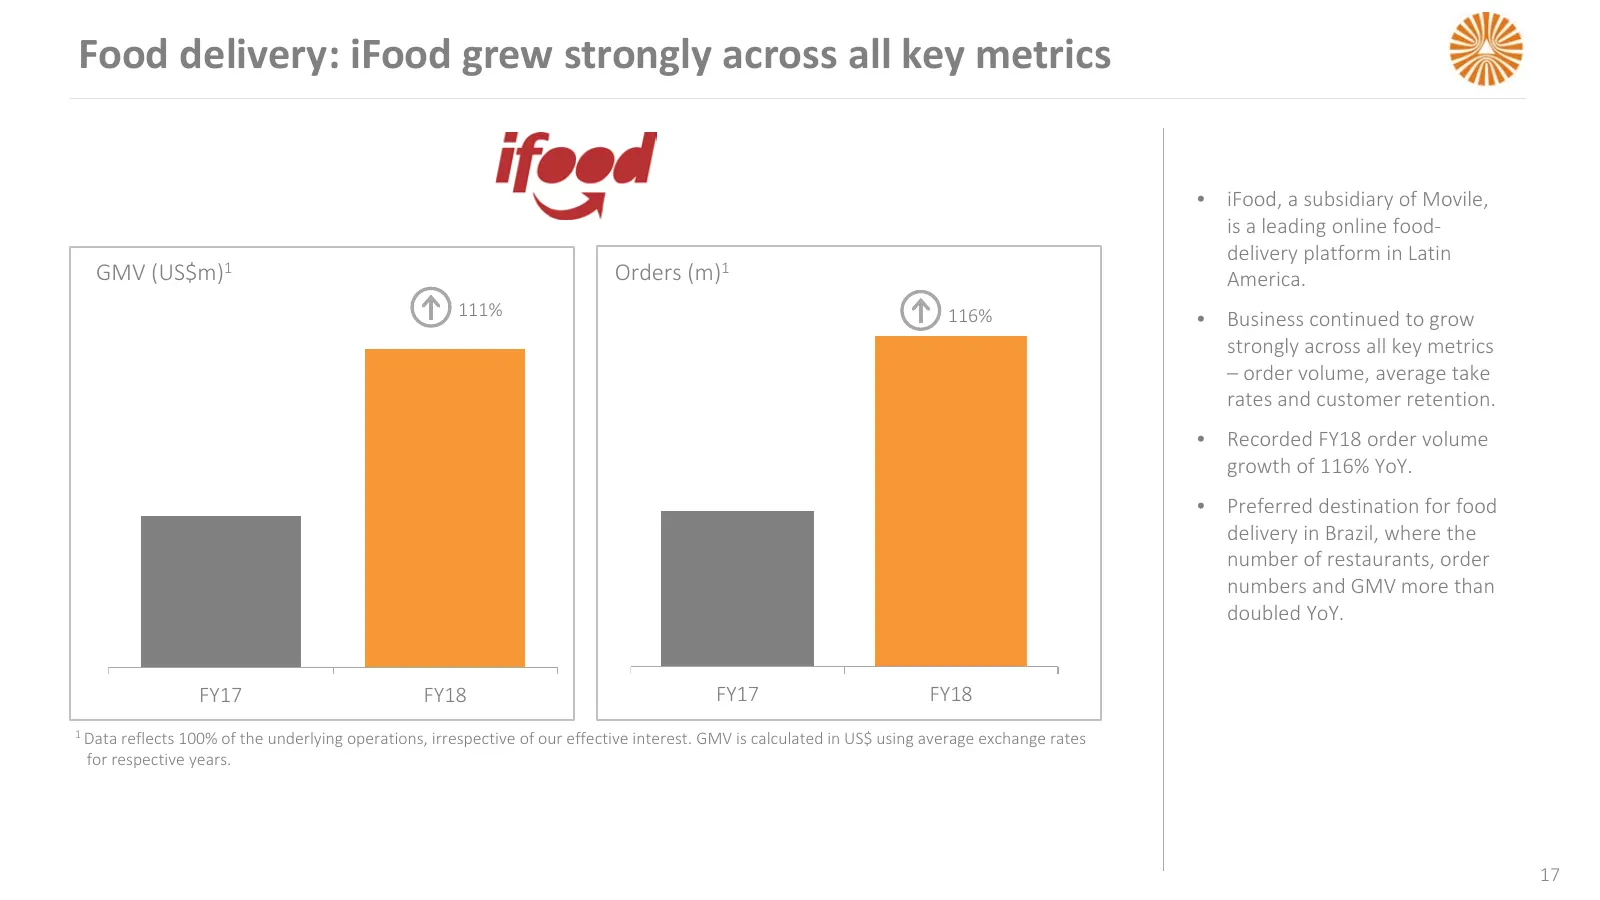
Slide 17: Food delivery: iFood grew strongly across all key metrics
Food delivery: iFood grew strongly across all key metrics • iFood, a subsidiary of Movile, is a leading online food- delivery platform in Latin GMV (US$m)1 Orders (m)1 America. 111% 116% • Business continued to grow strongly across all key metrics – order volume, average take rates and customer rete
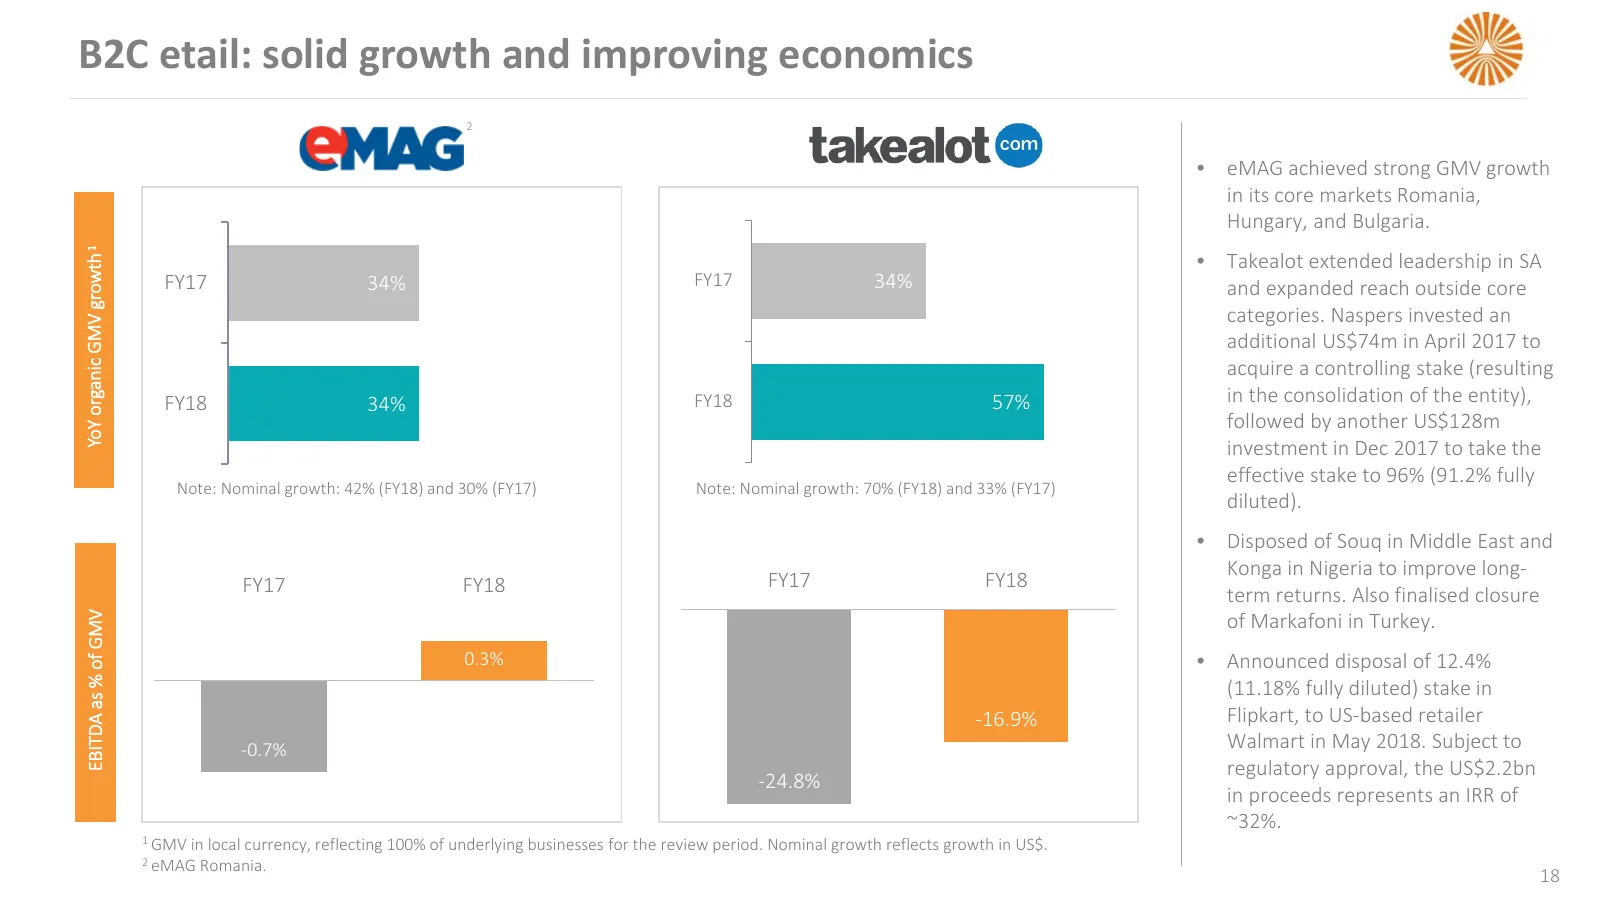
Slide 18: B2C etail: solid growth and improving economics
B2C etail: solid growth and improving economics 2 • eMAG achieved strong GMV growth in its core markets Romania, Hungary, and Bulgaria. YoY organic GMV growth 1 • Takealot extended leadership in SA FY17 34% FY17 34% and expanded reach outside core categories. Naspers invested an additional US$74m in
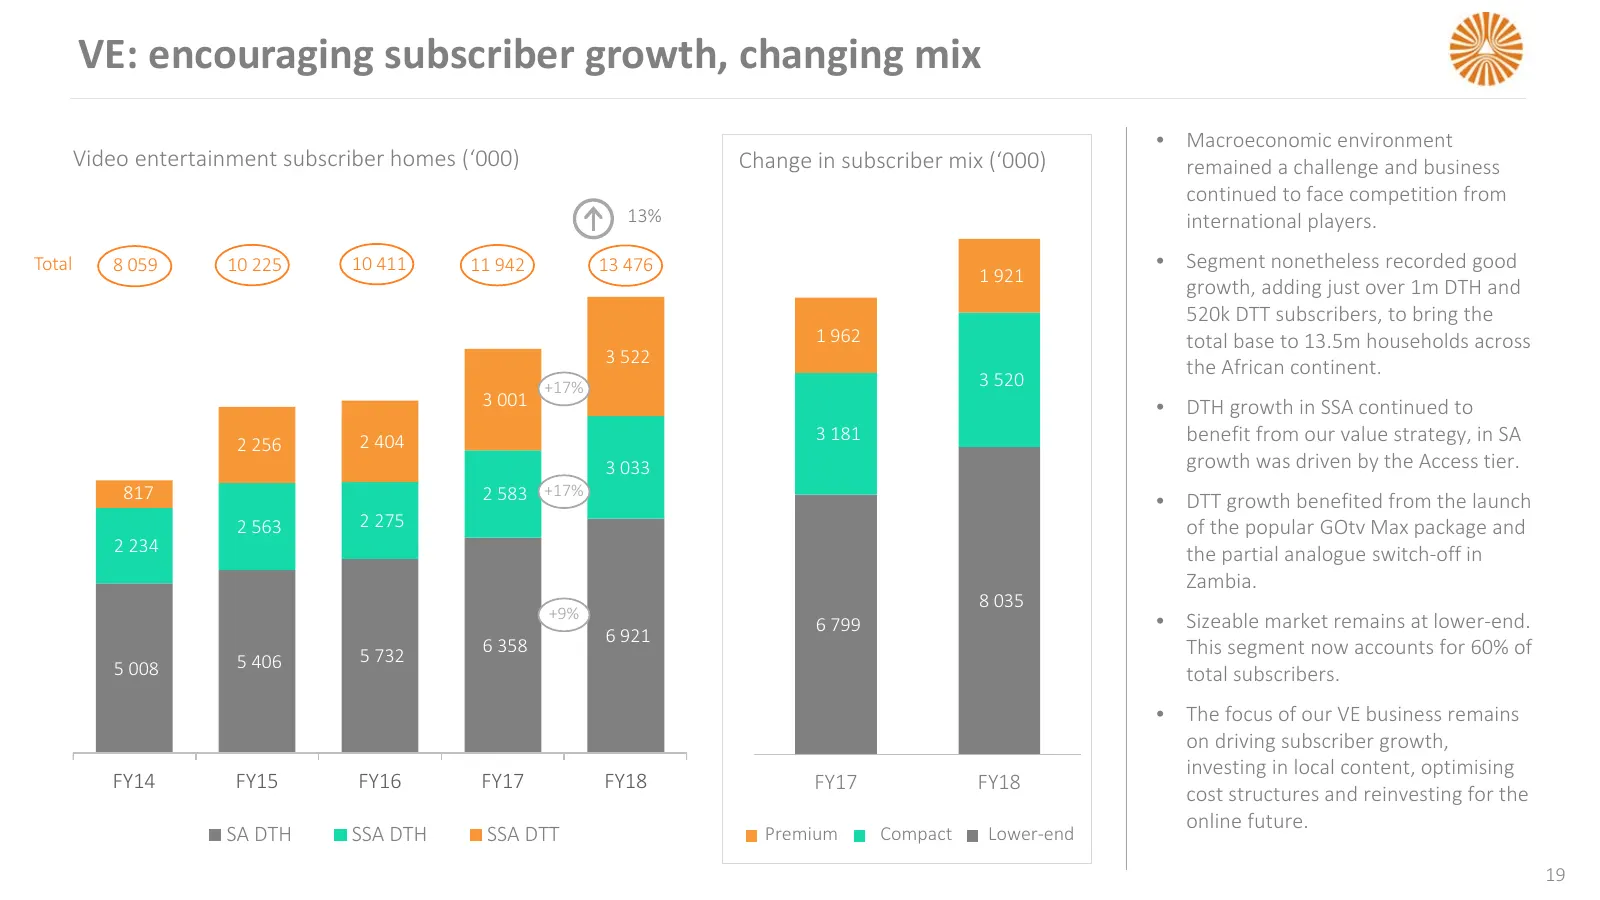
Slide 19: VE: encouraging subscriber growth, changing mix
VE: encouraging subscriber growth, changing mix • Macroeconomic environment Video entertainment subscriber homes (‘000) Change in subscriber mix (‘000) remained a challenge and business continued to face competition from 13% international players. Total 8 059 10 225 10 411 11 942 13 476 • Segment no
Slide 20: VE SA: solid all-round performance in tough macro environment
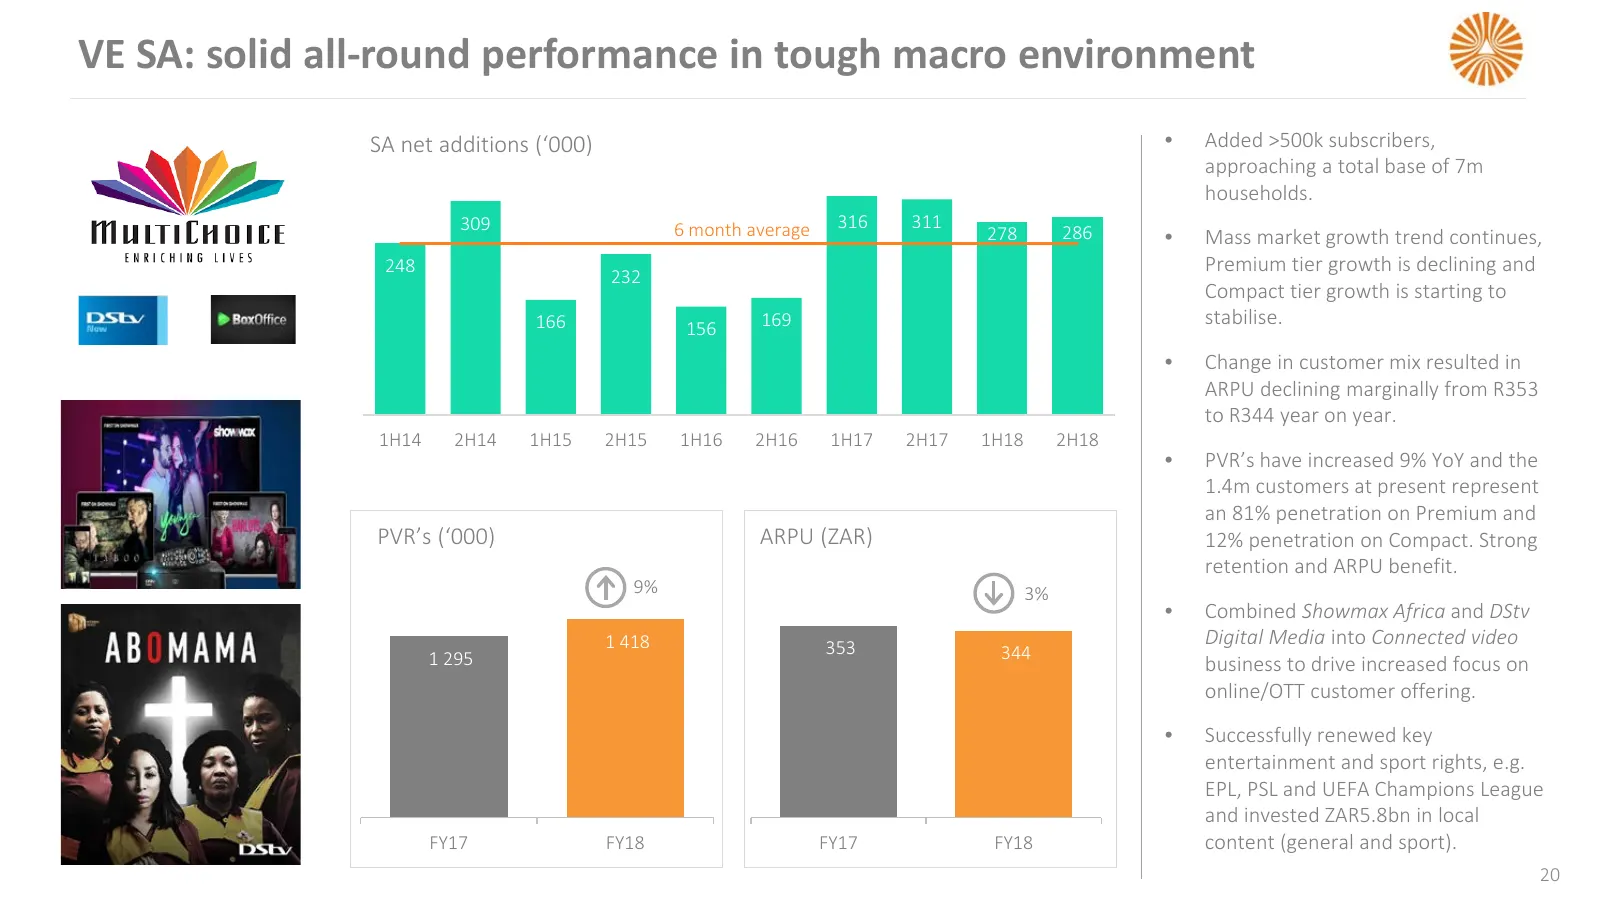
VE SA: solid all-round performance in tough macro environment SA net additions (‘000) • Added >500k subscribers, approaching a total base of 7m households. 309 6 month average 316 311 278 286 • Mass market growth trend continues, 248 Premium tier growth is declining and 232 Compact tier growth is st
Slide 21: VE SSA: turnaround continues
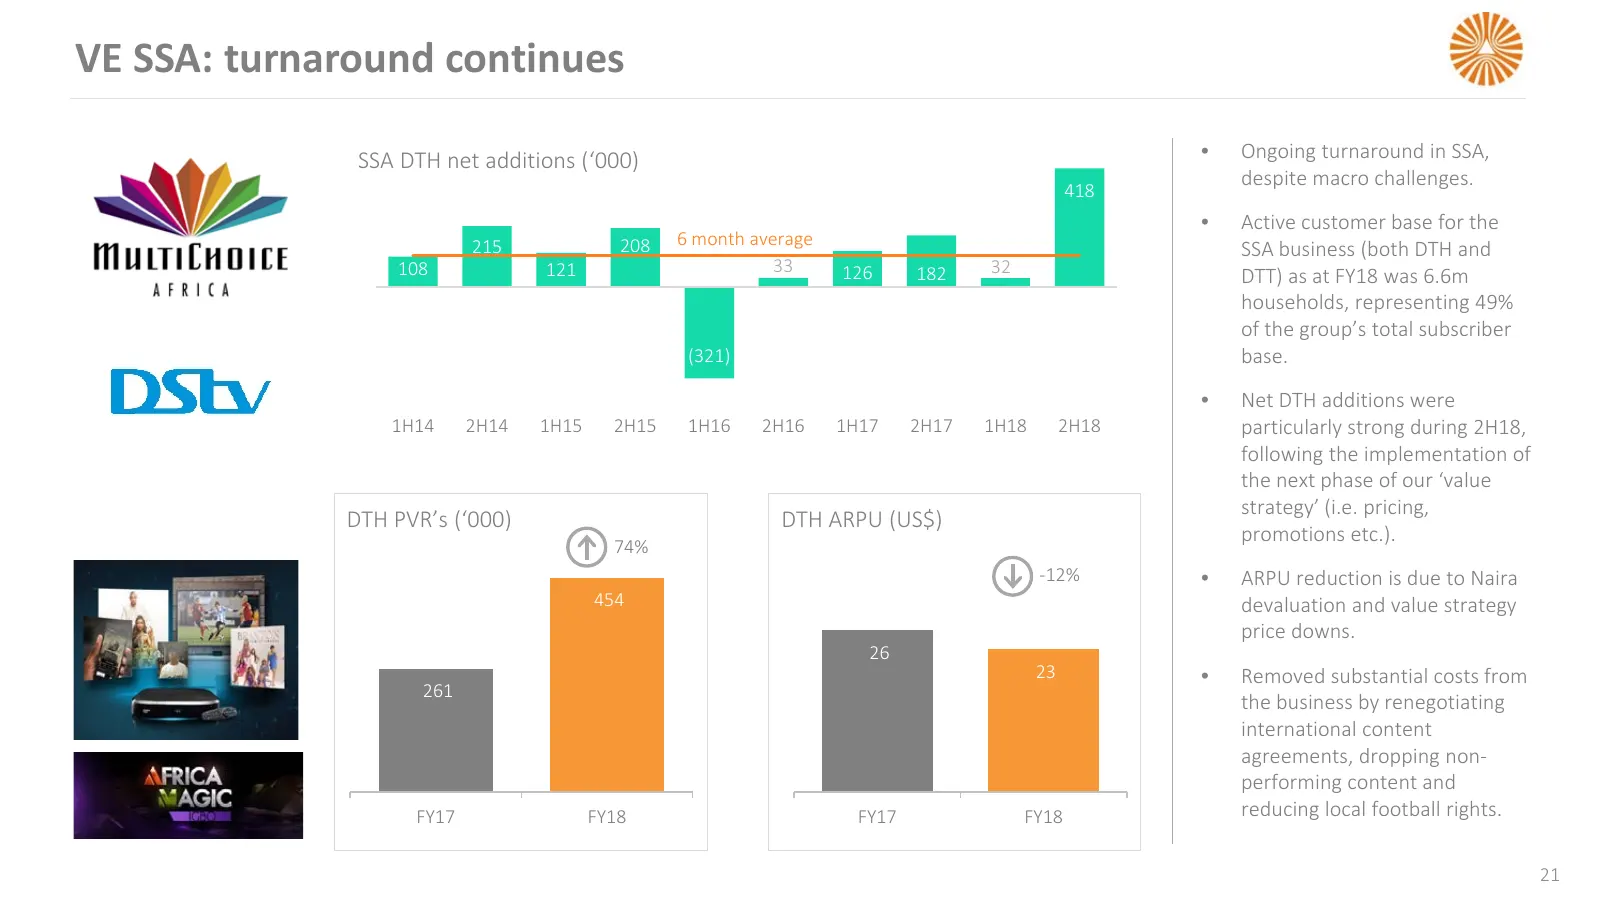
VE SSA: turnaround continues SSA DTH net additions (‘000) • Ongoing turnaround in SSA, despite macro challenges. 418 • Active customer base for the 215 208 6 month average SSA business (both DTH and 108 121 33 126 182 32 DTT) as at FY18 was 6.6m households, representing 49% of the group’s total subs

Slide 22: Financial review
Financial review
Slide 23: FY18 financial highlights
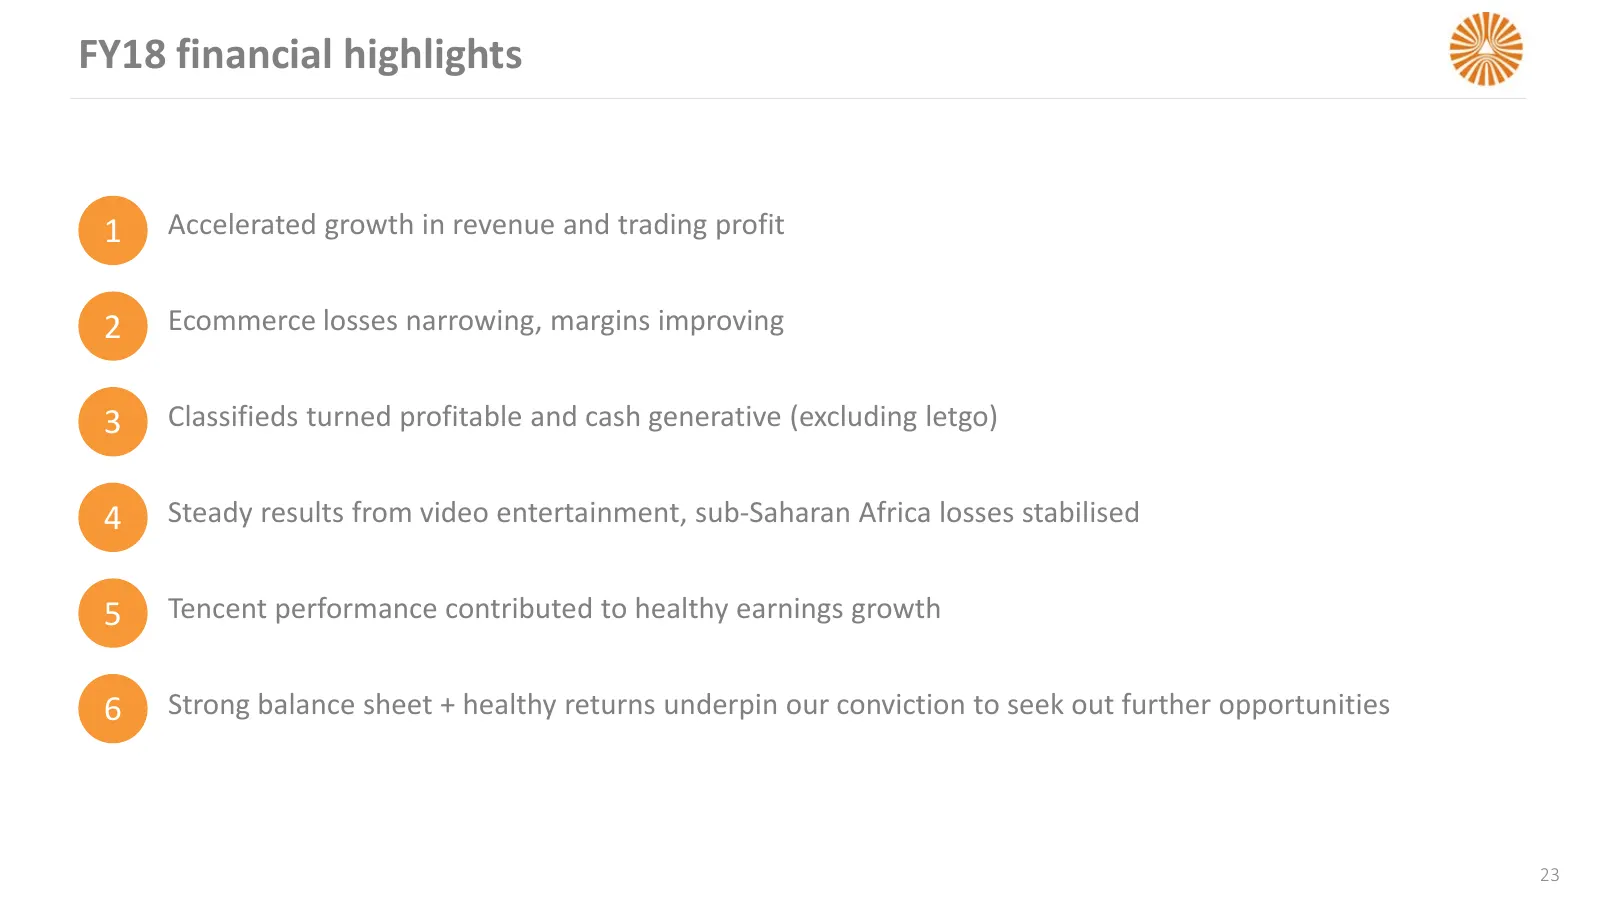
FY18 financial highlights 1 Accelerated growth in revenue and trading profit 2 Ecommerce losses narrowing, margins improving 3 Classifieds turned profitable and cash generative (excluding letgo) 4 Steady results from video entertainment, sub-Saharan Africa losses stabilised 5 Tencent performance con
Slide 24: Synopsis of financials
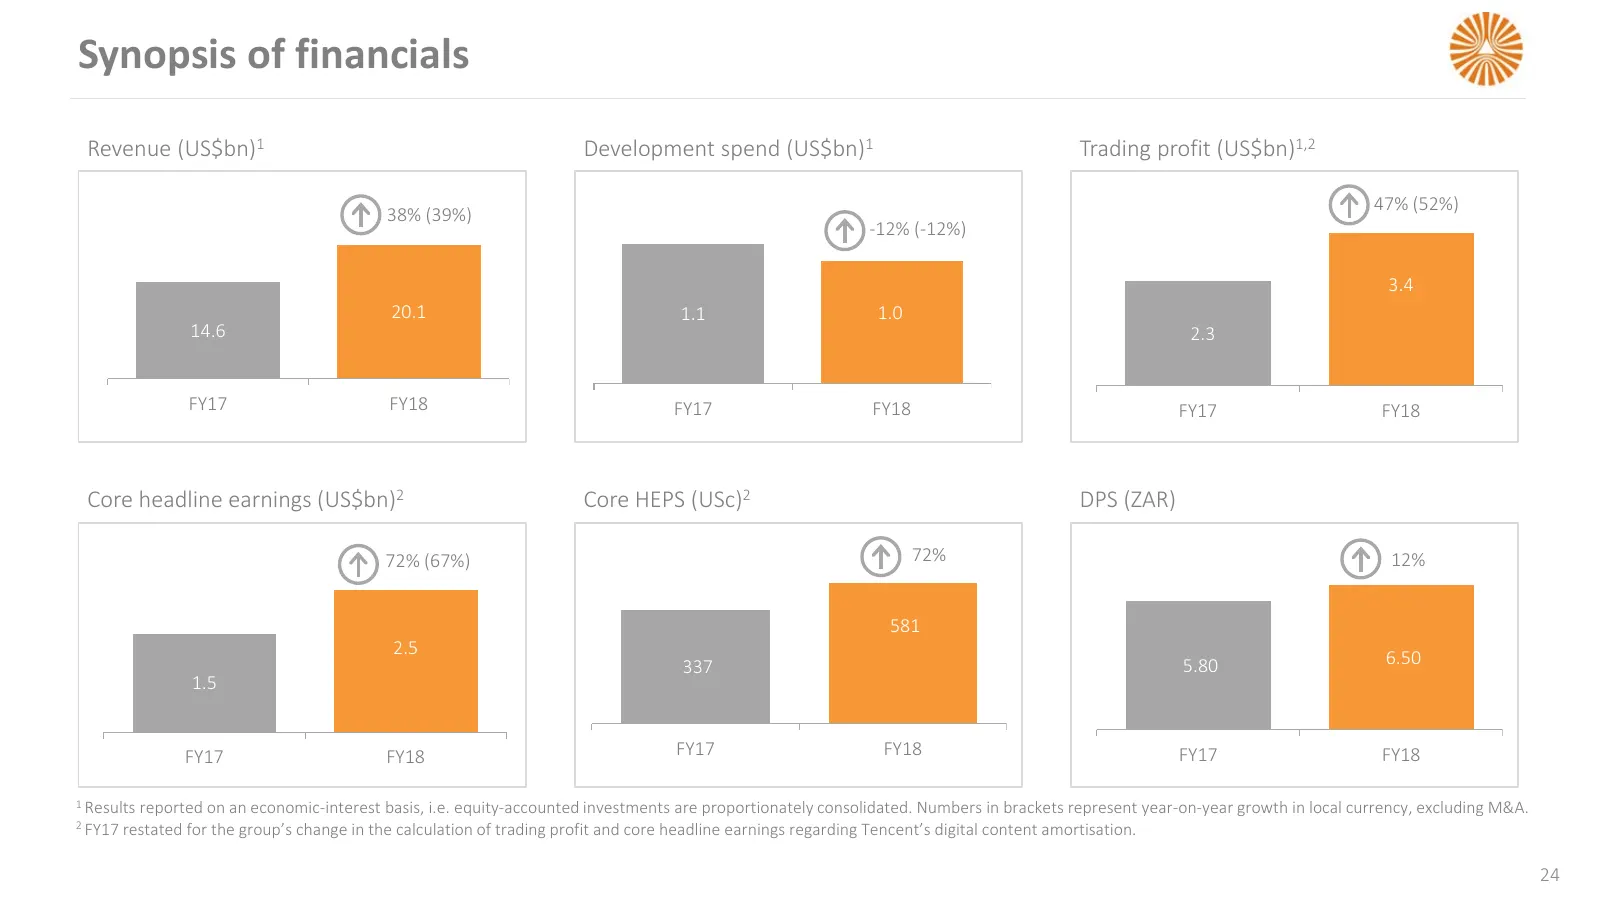
Synopsis of financials Revenue (US$bn)1 Development spend (US$bn)1 Trading profit (US$bn)1,2 47% (52%) 38% (39%) -12% (-12%) 3.4 20.1 1.1 1.0 14.6 2.3 FY17 FY18 FY17 FY18 FY17 FY18 Core headline earnings (US$bn)2 Core HEPS (USc)2 DPS (ZAR) 72% (67%) 72% 12% 581 2.5 337 5.80 6.50 1.5 FY17 FY18 FY17 F
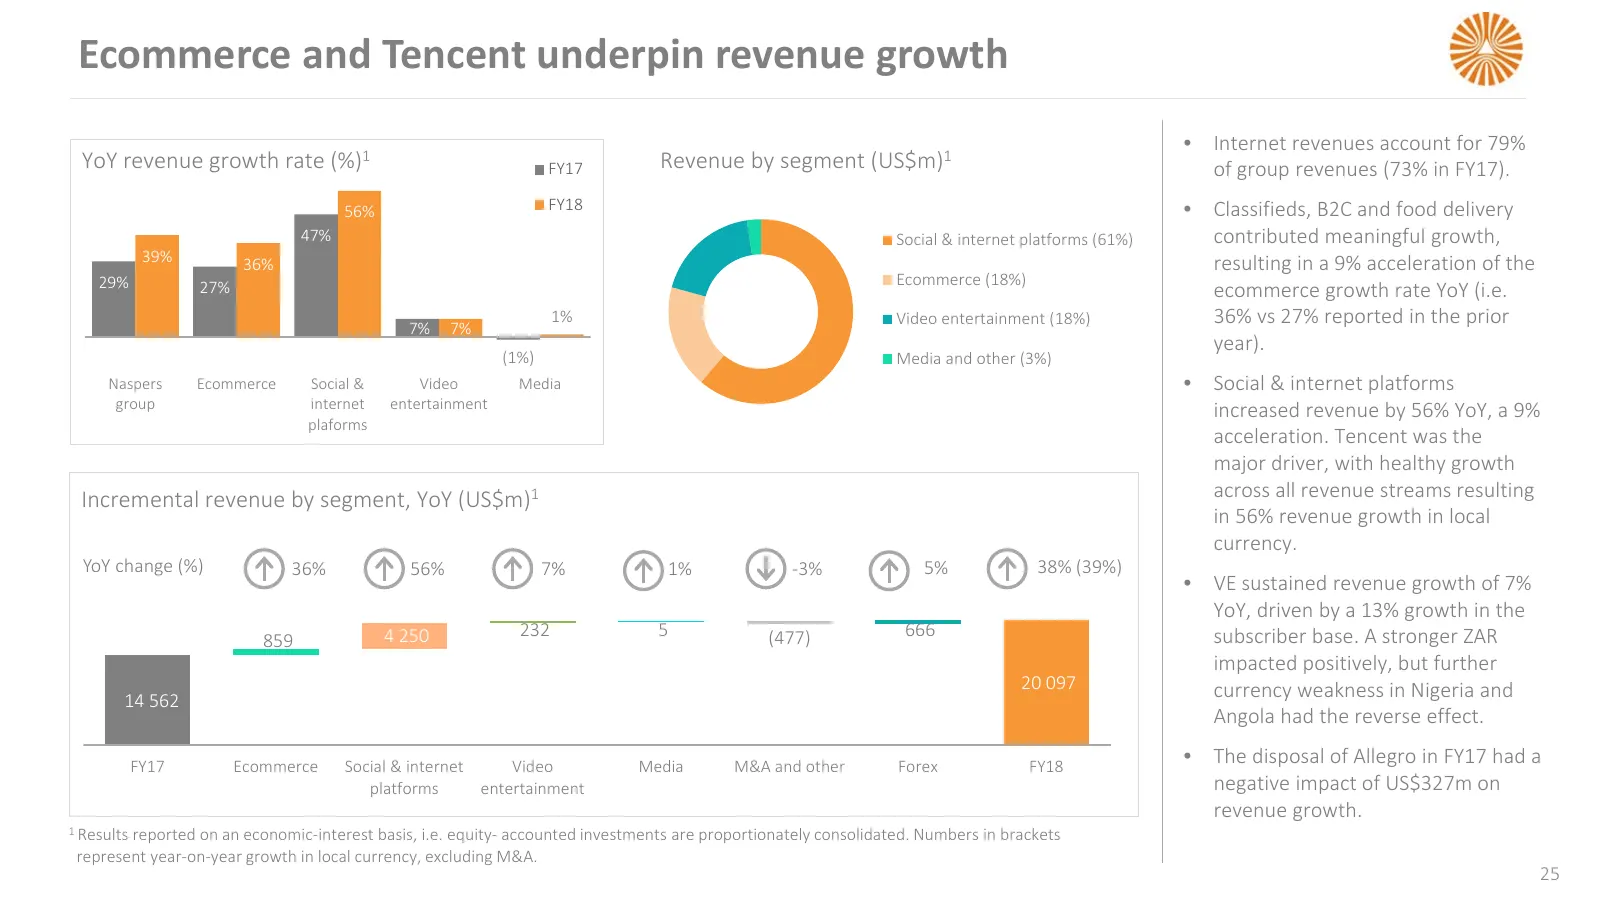
Slide 25: Ecommerce and Tencent underpin revenue growth
Ecommerce and Tencent underpin revenue growth • Internet revenues account for 79% YoY revenue growth rate (%)1 FY17 Revenue by segment (US$m)1 of group revenues (73% in FY17). 56% FY18 • Classifieds, B2C and food delivery 47% Social & internet platforms (61%) contributed meaningful growth, 39% 36% r
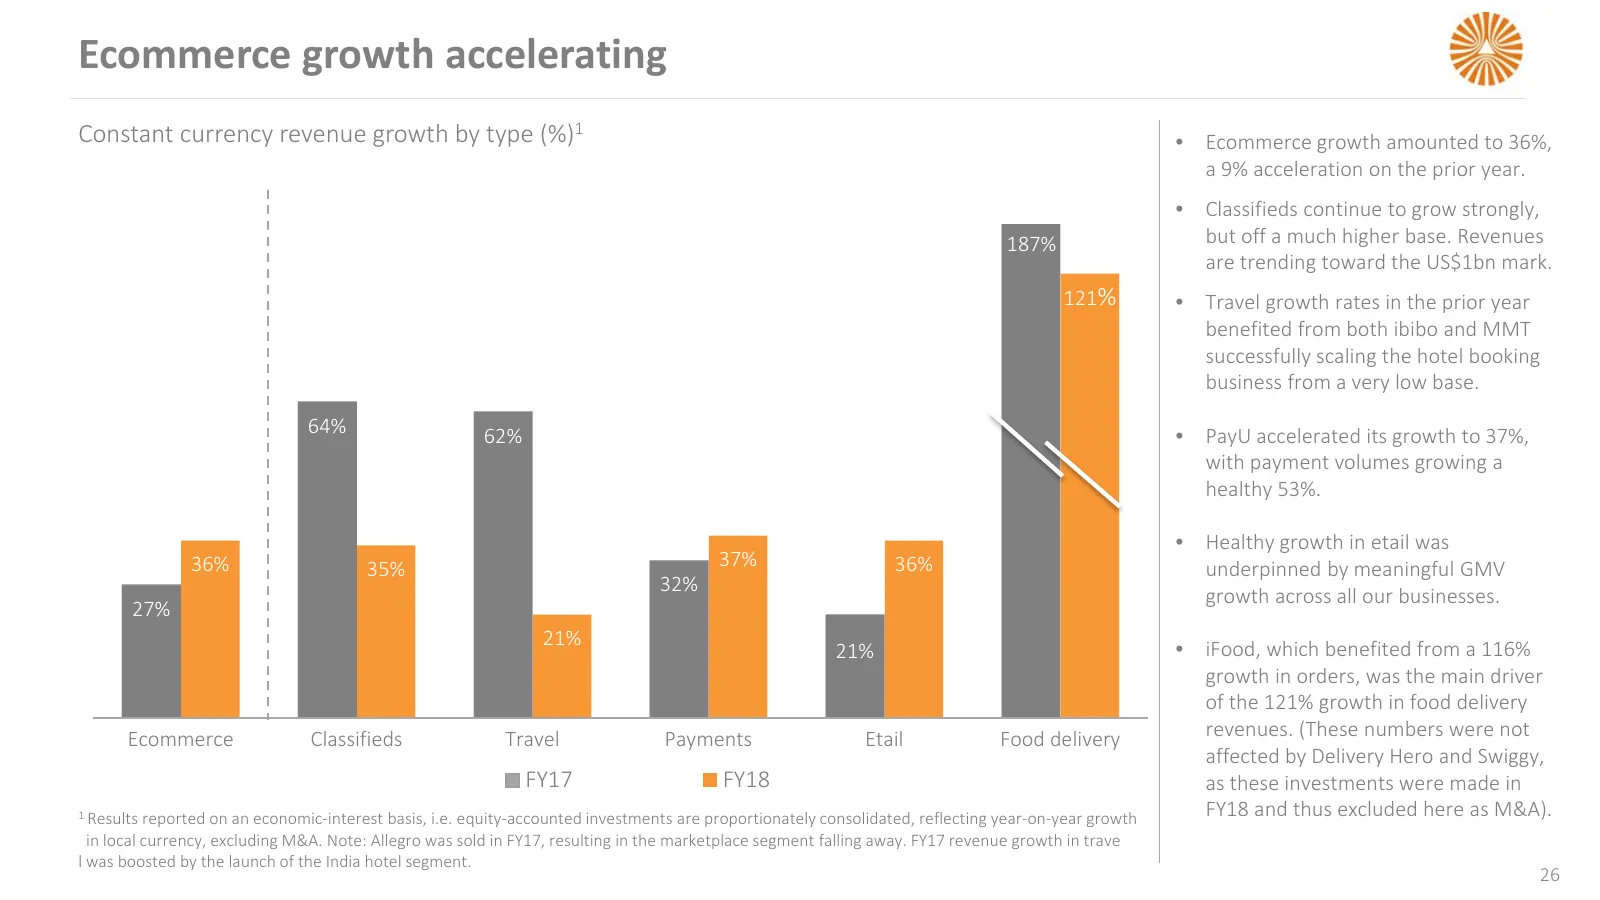
Slide 26: Ecommerce growth accelerating
Ecommerce growth accelerating Constant currency revenue growth by type (%)1 • Ecommerce growth amounted to 36%, a 9% acceleration on the prior year. • Classifieds continue to grow strongly, 187% but off a much higher base. Revenues are trending toward the US$1bn mark. 121% • Travel growth rates in t
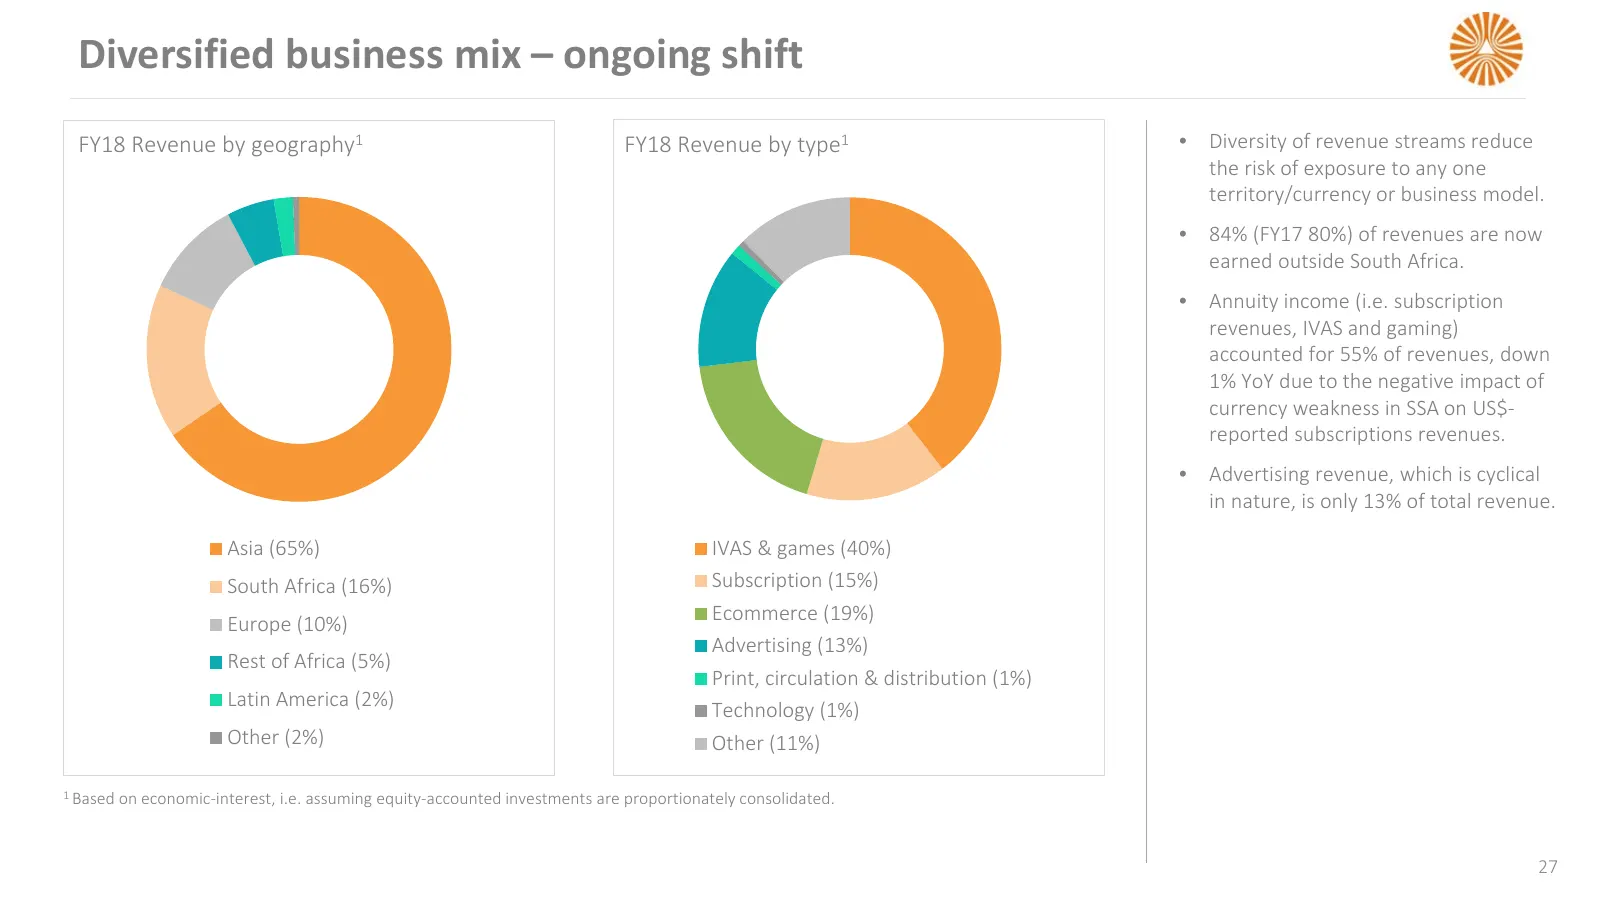
Slide 27: Diversified business mix – ongoing shift
Diversified business mix – ongoing shift FY18 Revenue by geography1 FY18 Revenue by type1 • Diversity of revenue streams reduce the risk of exposure to any one territory/currency or business model. • 84% (FY17 80%) of revenues are now earned outside South Africa. • Annuity income (i.e. subscription
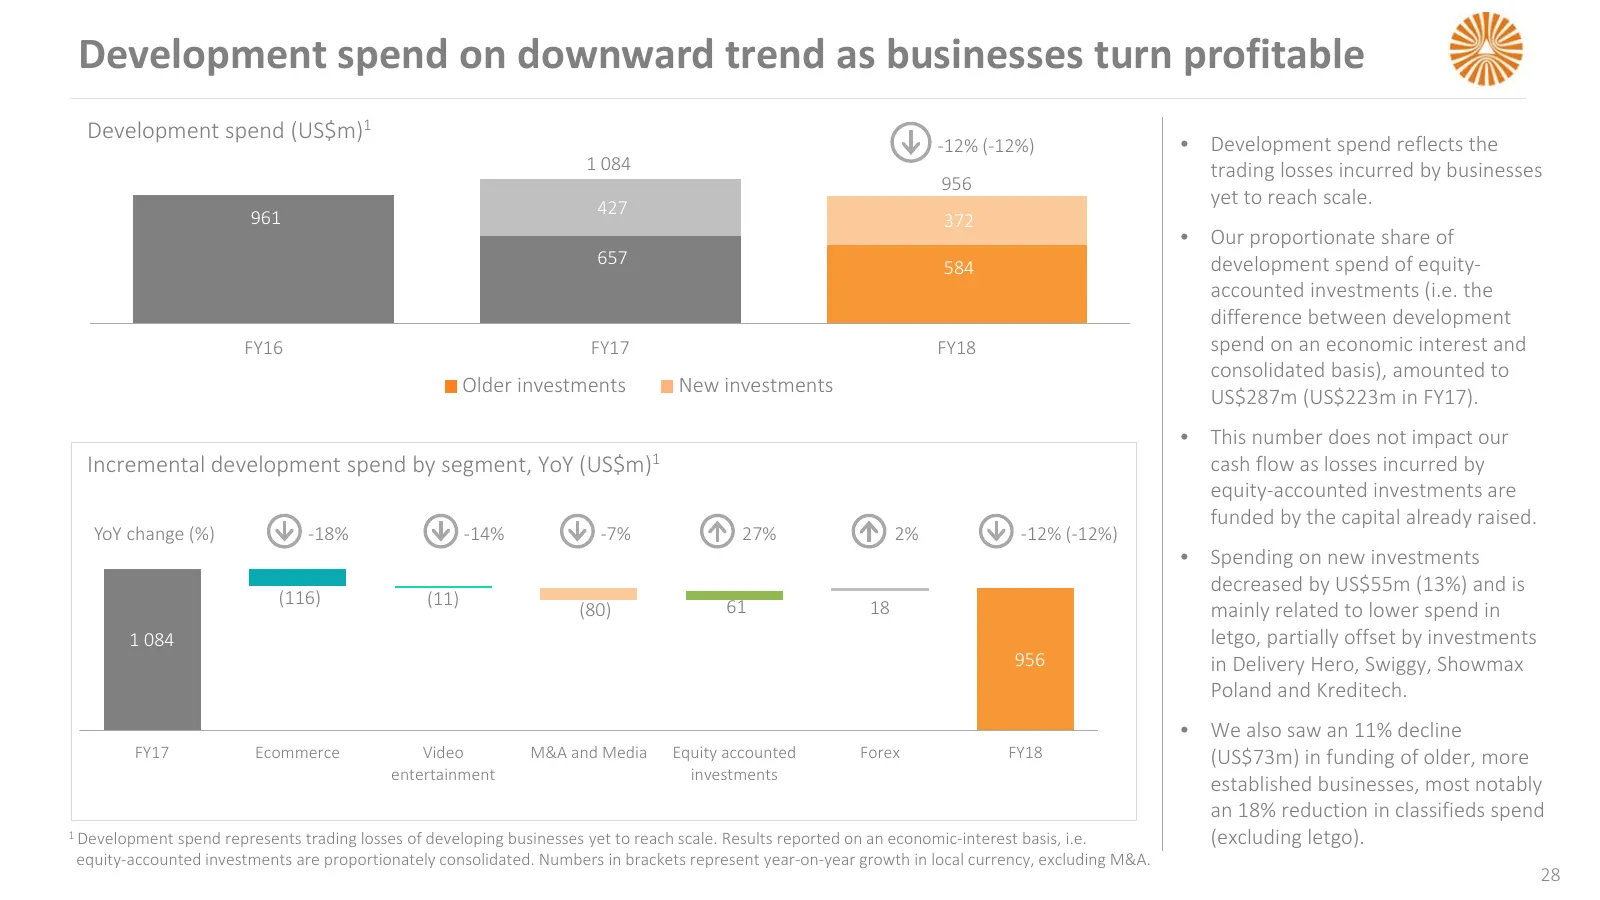
Slide 28: Development spend on downward trend as businesses turn profitable
Development spend on downward trend as businesses turn profitable Development spend (US$m)1 -12% (-12%) • Development spend reflects the 1 084 trading losses incurred by businesses 956 427 yet to reach scale. 961 372 • Our proportionate share of 657 584 development spend of equity- accounted investm
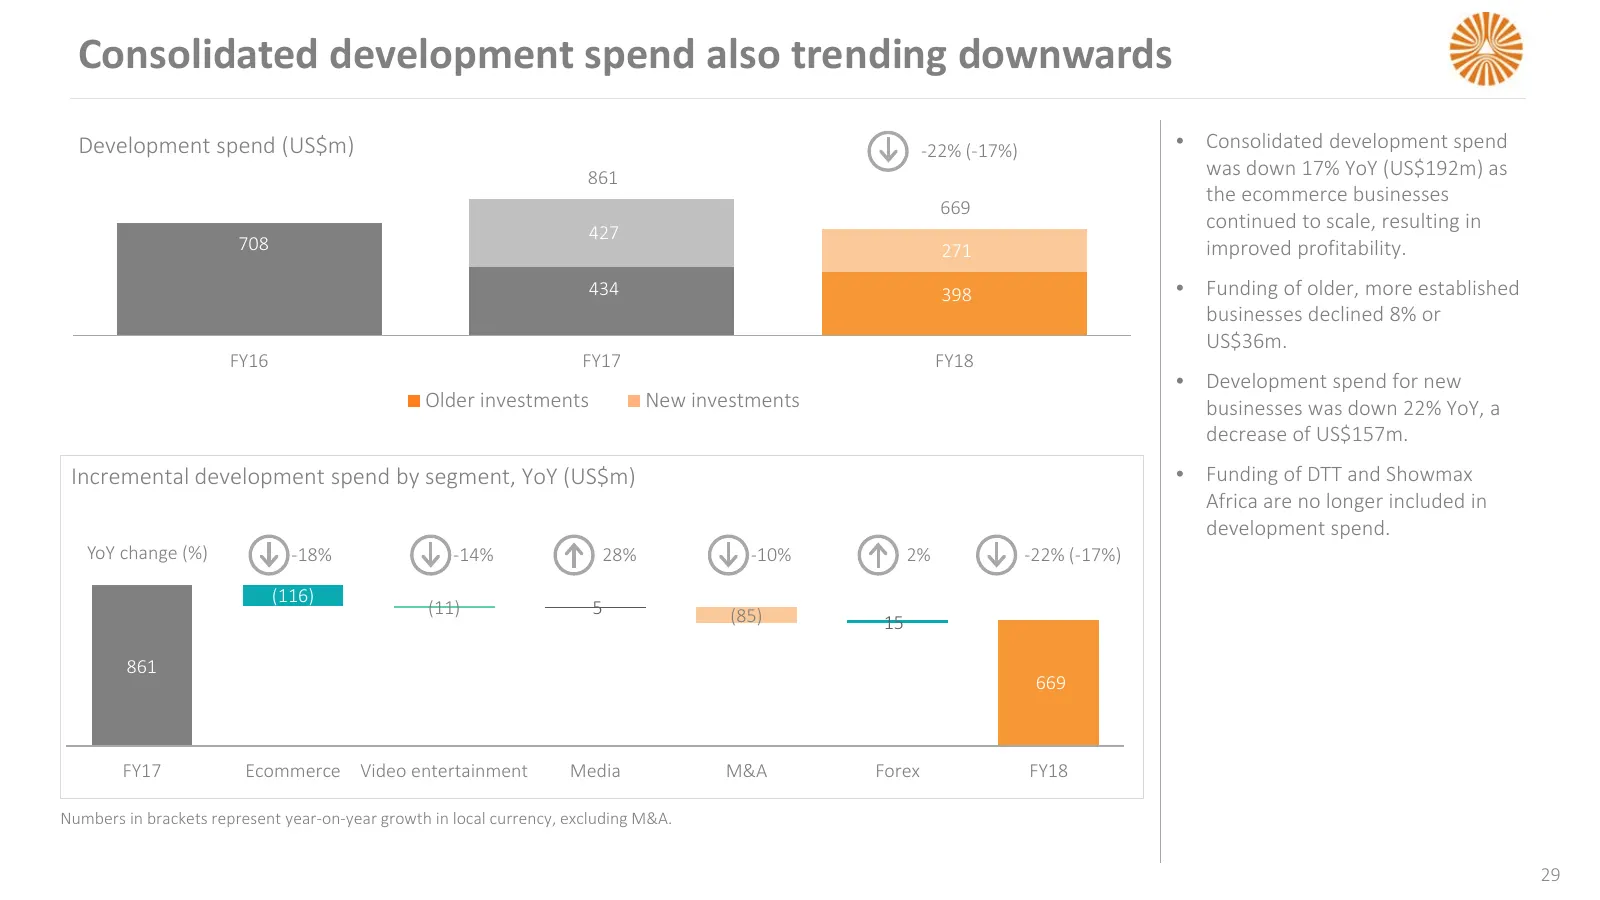
Slide 29: Consolidated development spend also trending downwards
Consolidated development spend also trending downwards Development spend (US$m) -22% (-17%) • Consolidated development spend 861 was down 17% YoY (US$192m) as the ecommerce businesses 669 427 continued to scale, resulting in 708 271 improved profitability. 434 398 • Funding of older, more establishe
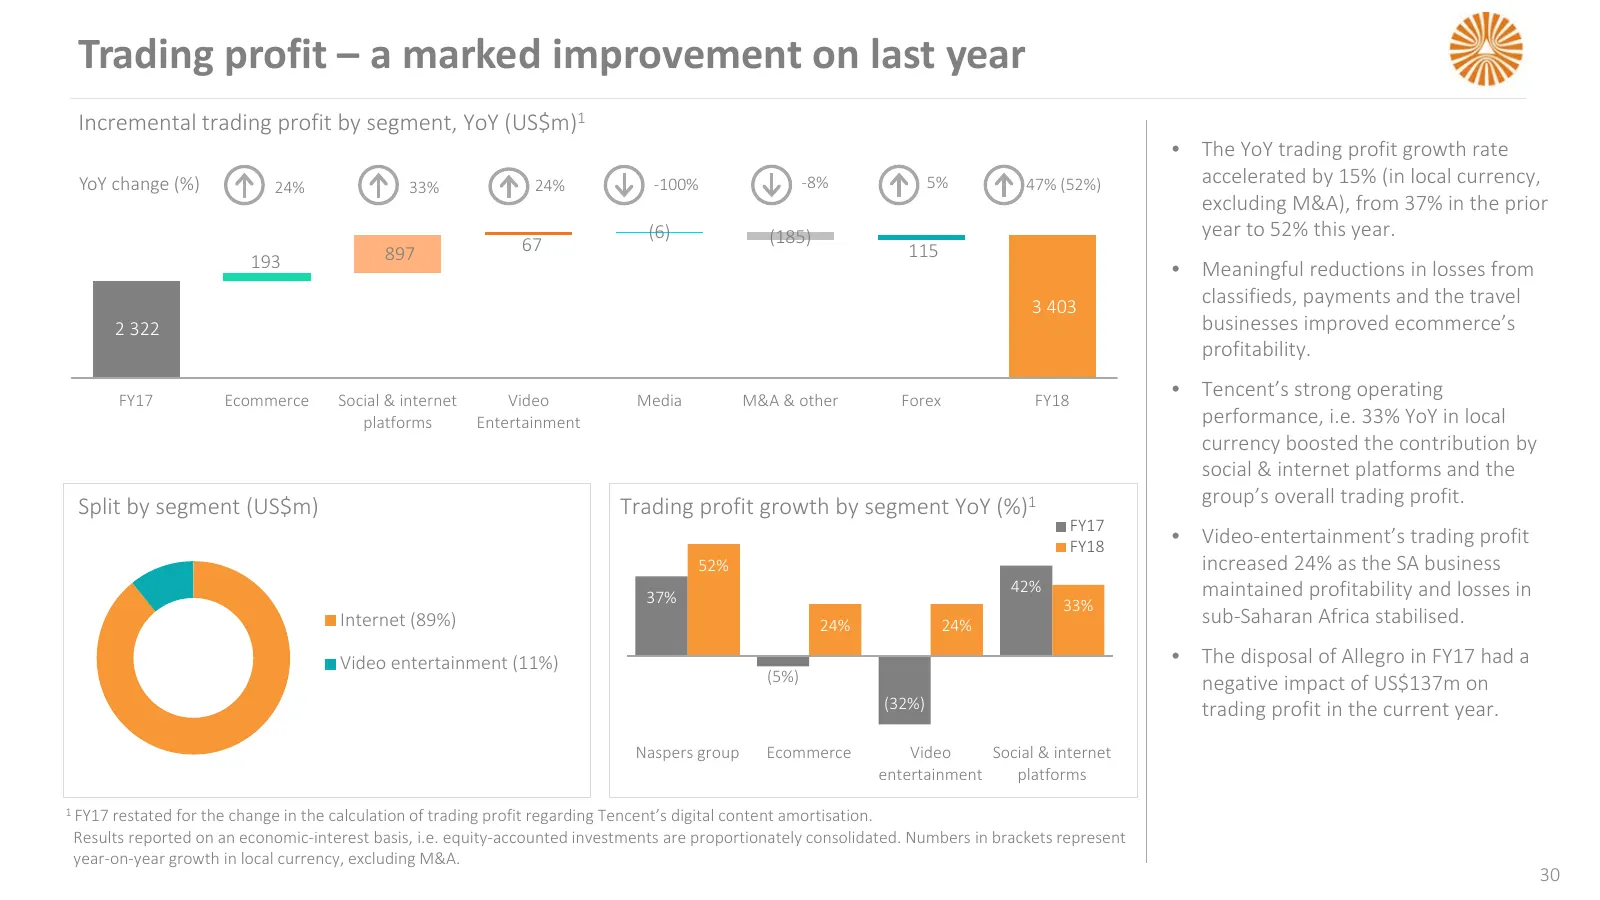
Slide 30: Trading profit – a marked improvement on last year
Trading profit – a marked improvement on last year Incremental trading profit by segment, YoY (US$m)1 • The YoY trading profit growth rate YoY change (%) 24% 33% 24% -100% -8% 5% 47% (52%) accelerated by 15% (in local currency, excluding M&A), from 37% in the prior (6) (185) year to 52% this year. 8
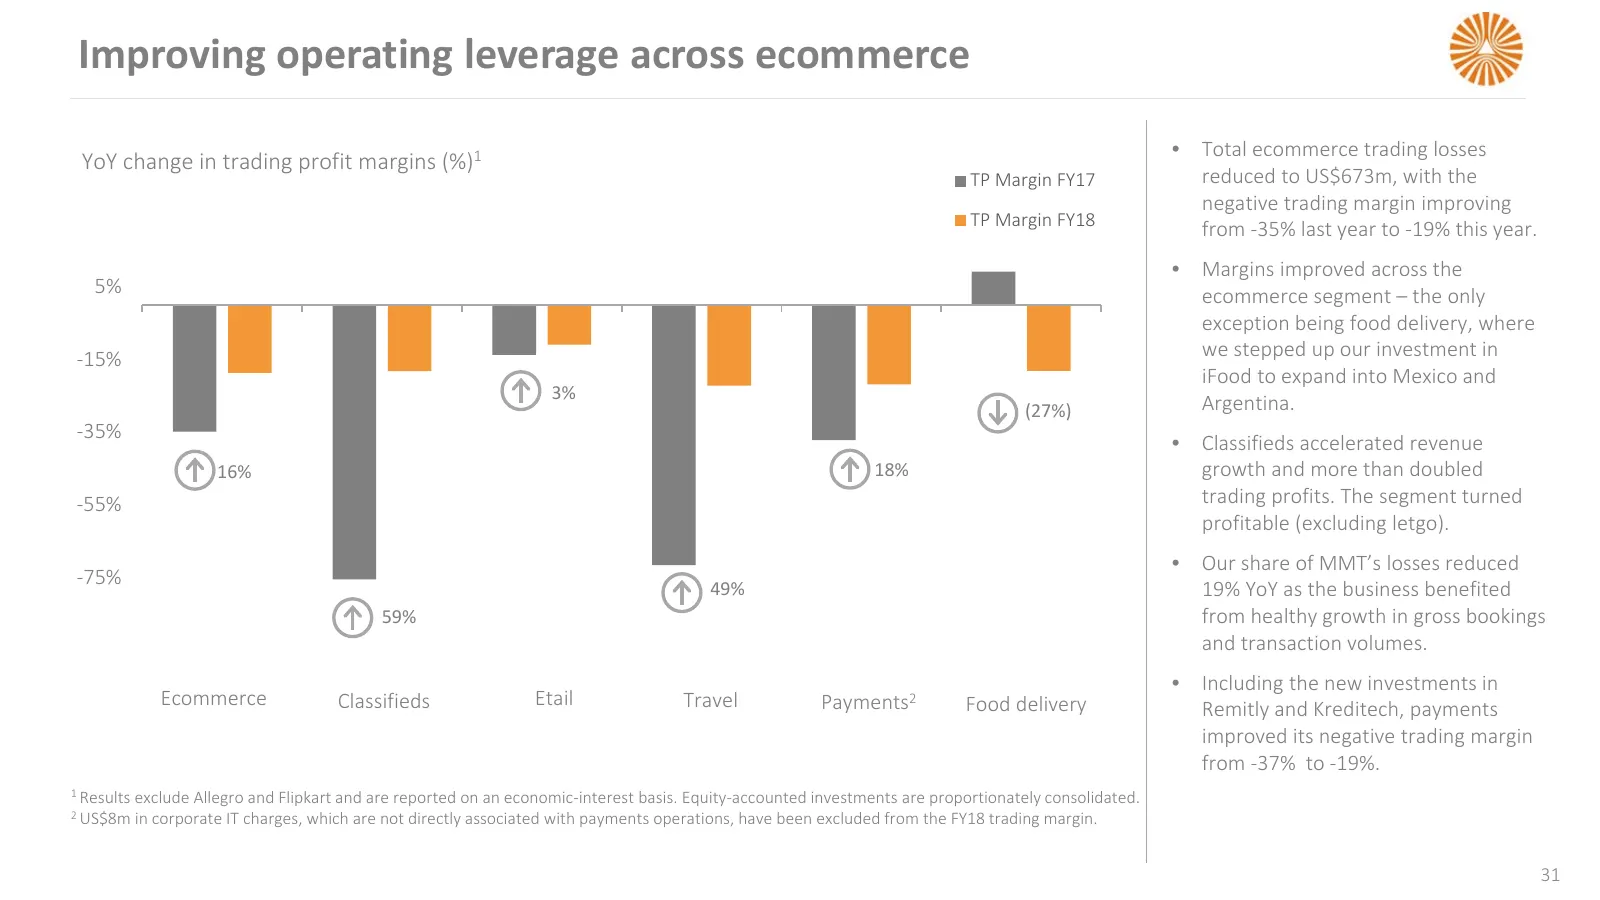
Slide 31: Improving operating leverage across ecommerce
Improving operating leverage across ecommerce • Total ecommerce trading losses YoY change in trading profit margins (%)1 TP Margin FY17 reduced to US$673m, with the negative trading margin improving TP Margin FY18 from -35% last year to -19% this year. • Margins improved across the 5% ecommerce segm
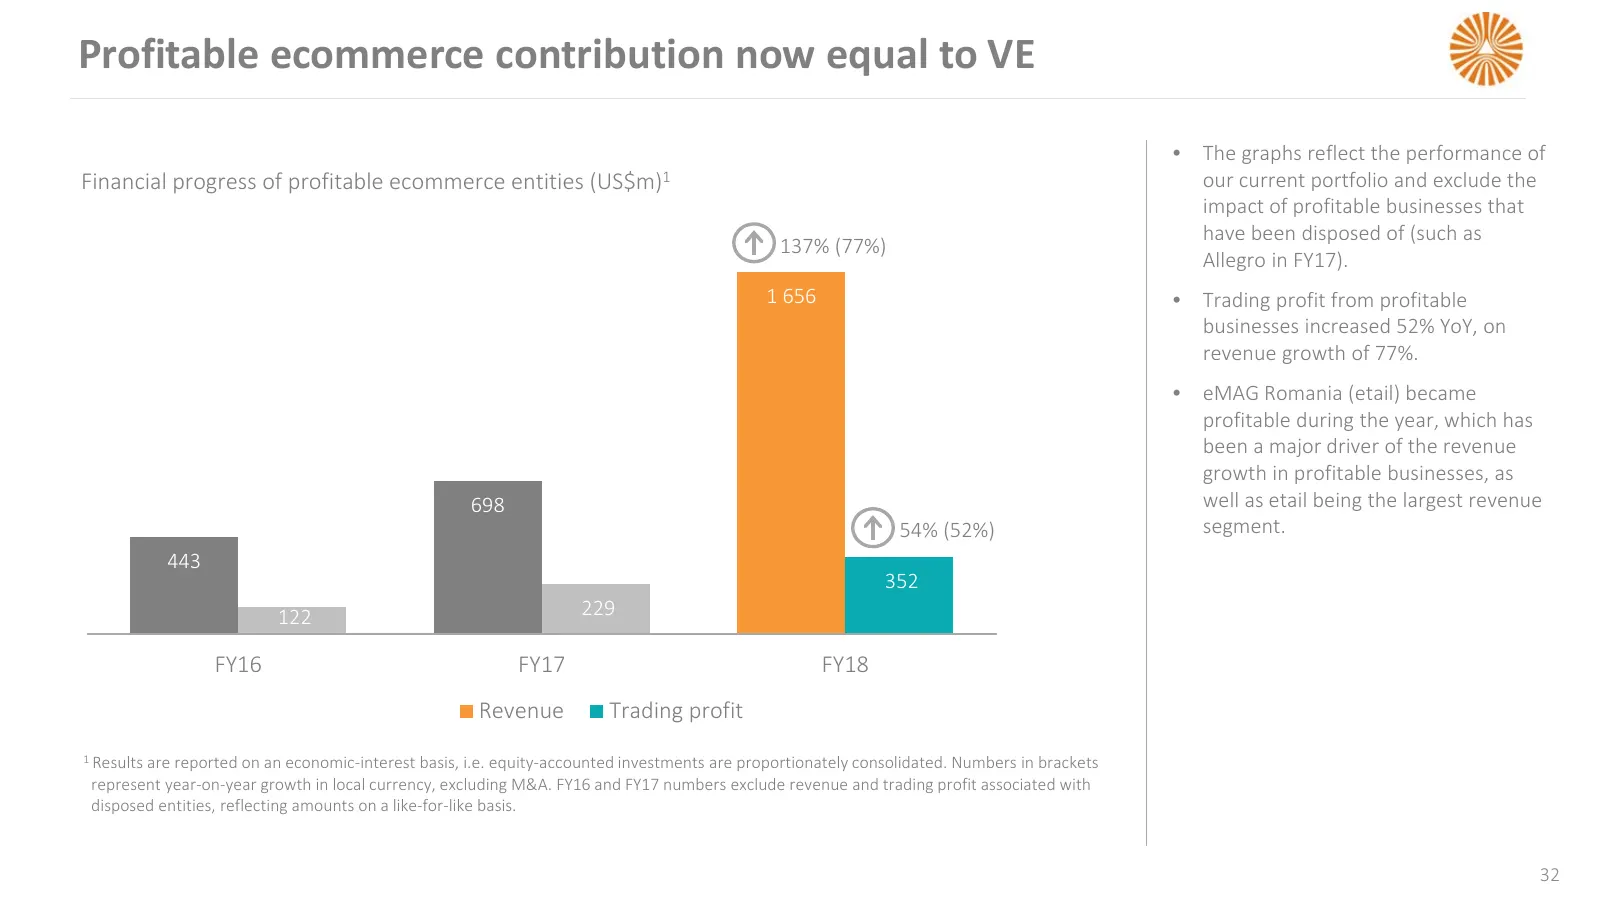
Slide 32: Profitable ecommerce contribution now equal to VE
Profitable ecommerce contribution now equal to VE • The graphs reflect the performance of Financial progress of profitable ecommerce entities (US$m)1 our current portfolio and exclude the impact of profitable businesses that have been disposed of (such as 137% (77%) Allegro in FY17). 1 656 • Trading
Slide 33: Classifieds: OLX turned profitable and FCF generative
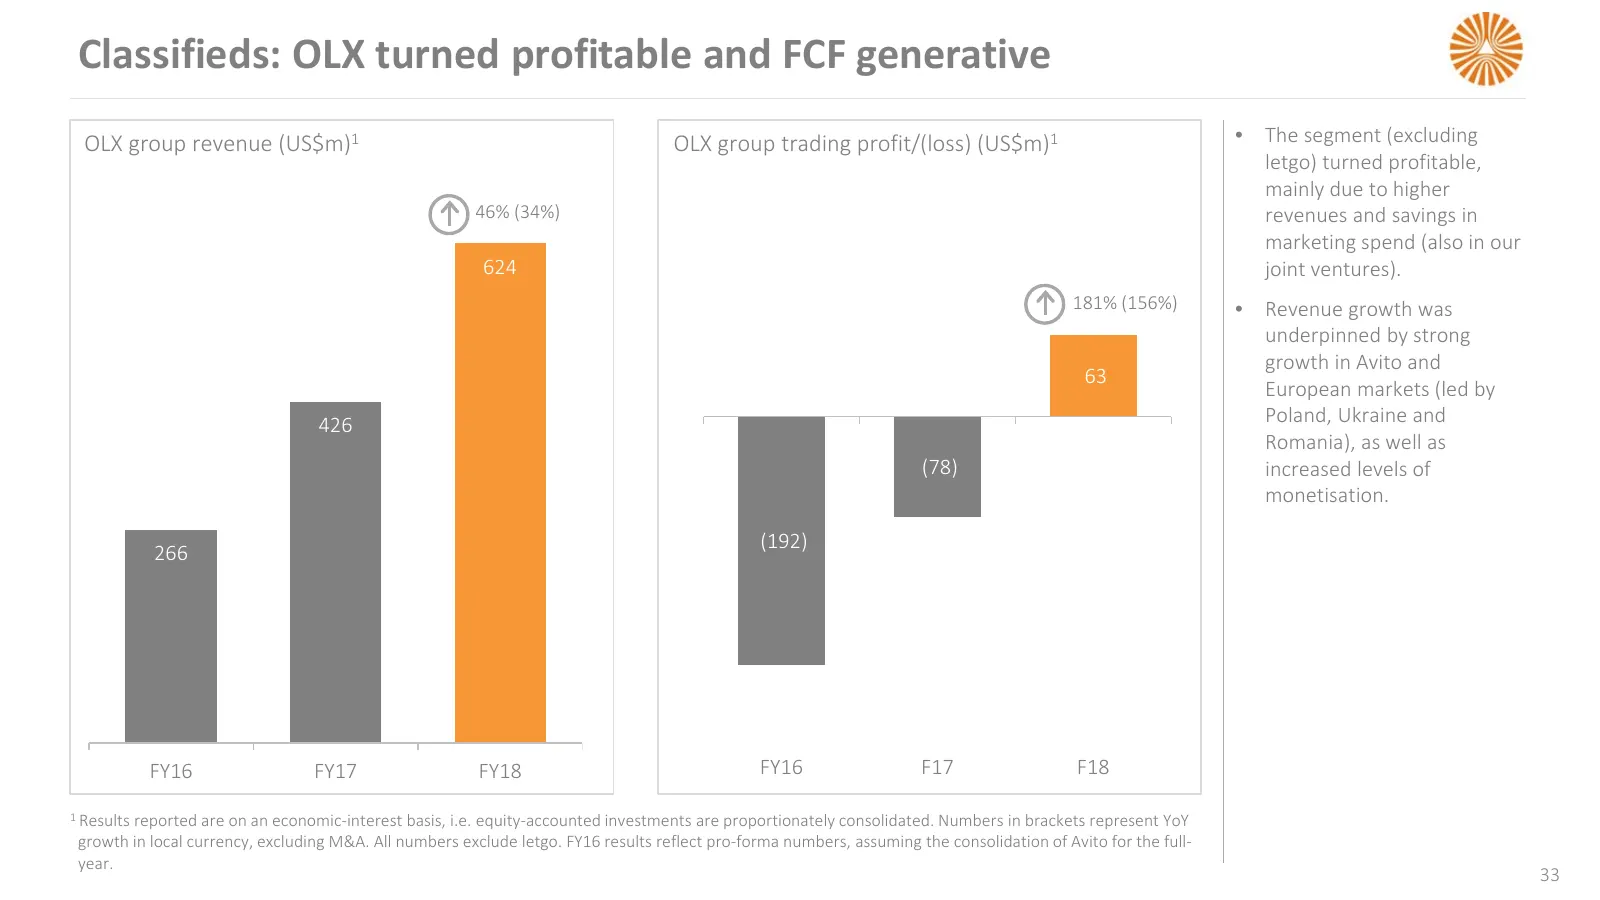
Classifieds: OLX turned profitable and FCF generative OLX group revenue (US$m)1 OLX group trading profit/(loss) (US$m)1 • The segment (excluding letgo) turned profitable, mainly due to higher 46% (34%) revenues and savings in marketing spend (also in our 624 joint ventures). 181% (156%) • Revenue gr
Slide 34: Payments: strong revenue growth and margin improvement
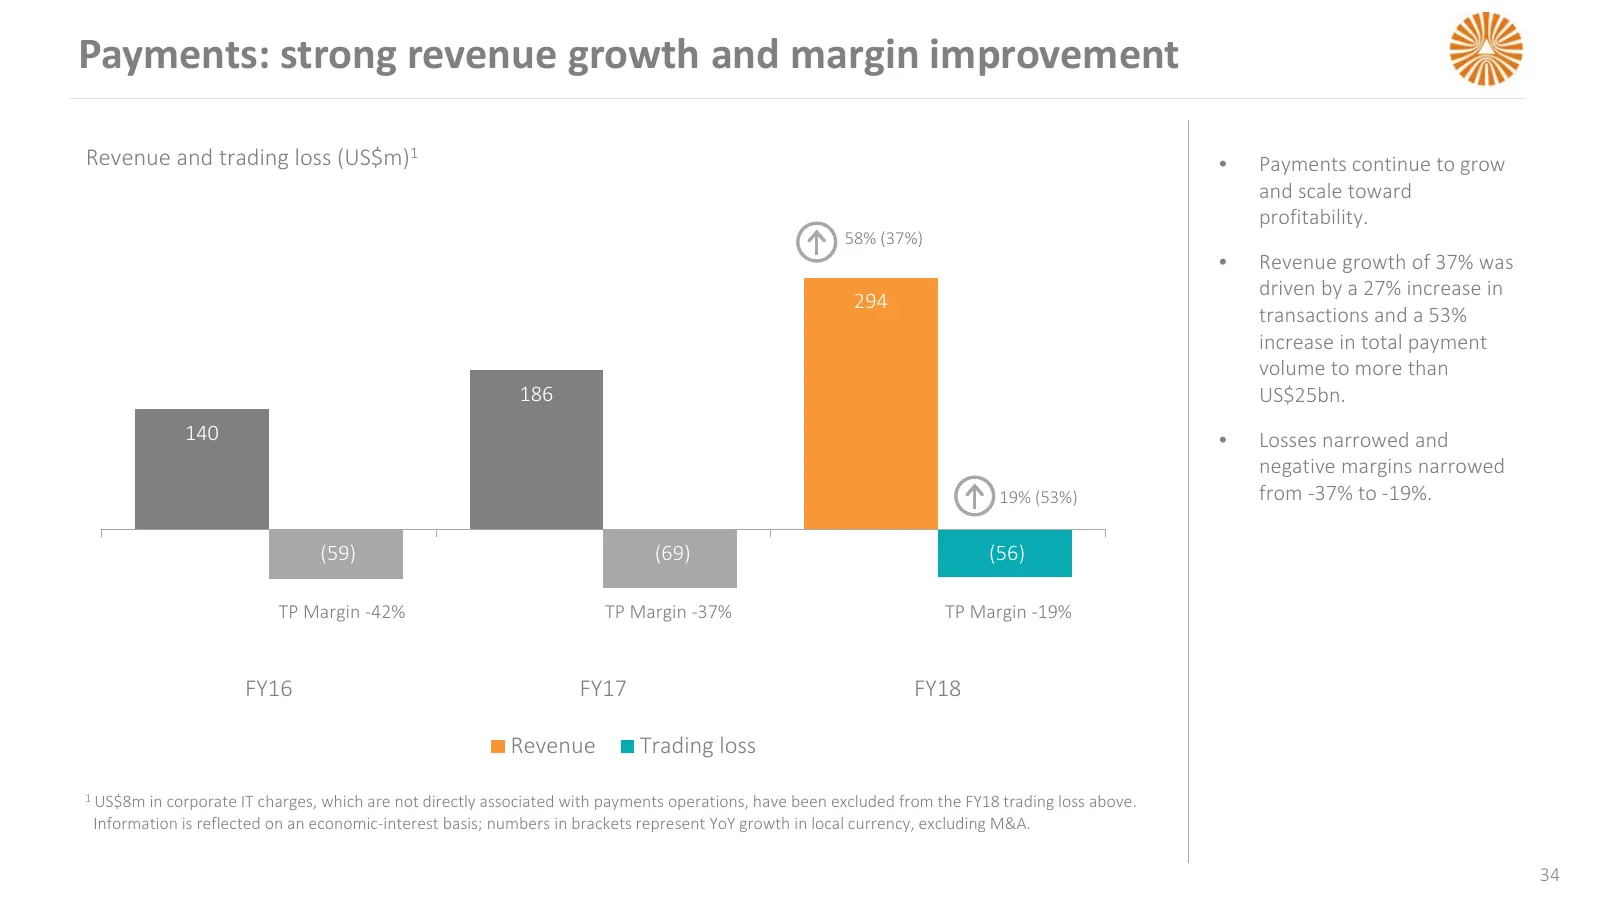
Payments: strong revenue growth and margin improvement Revenue and trading loss (US$m)1 • Payments continue to grow and scale toward profitability. 58% (37%) • Revenue growth of 37% was driven by a 27% increase in 294 transactions and a 53% increase in total payment volume to more than 186 US$25bn.
Slide 35: Food delivery: scaling fast and delivering topline growth
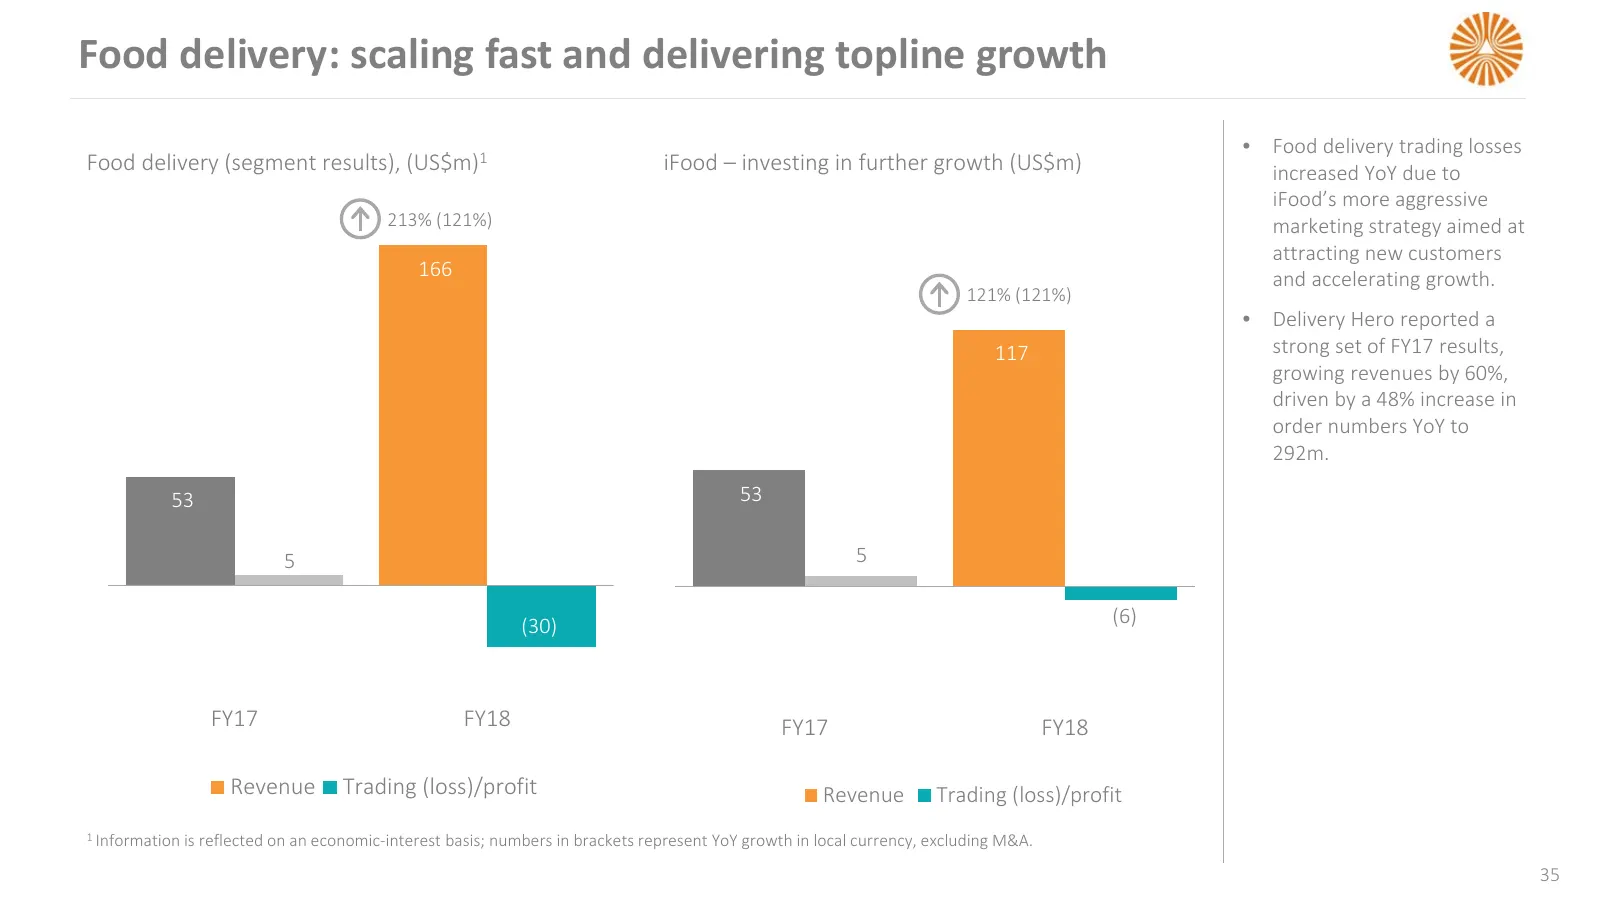
Food delivery: scaling fast and delivering topline growth • Food delivery trading losses Food delivery (segment results), (US$m)1 iFood – investing in further growth (US$m) increased YoY due to iFood’s more aggressive 213% (121%) marketing strategy aimed at attracting new customers 166 and accelerat
Slide 36: Travel: cost-saving opportunities created by the MMT/ibibo merger
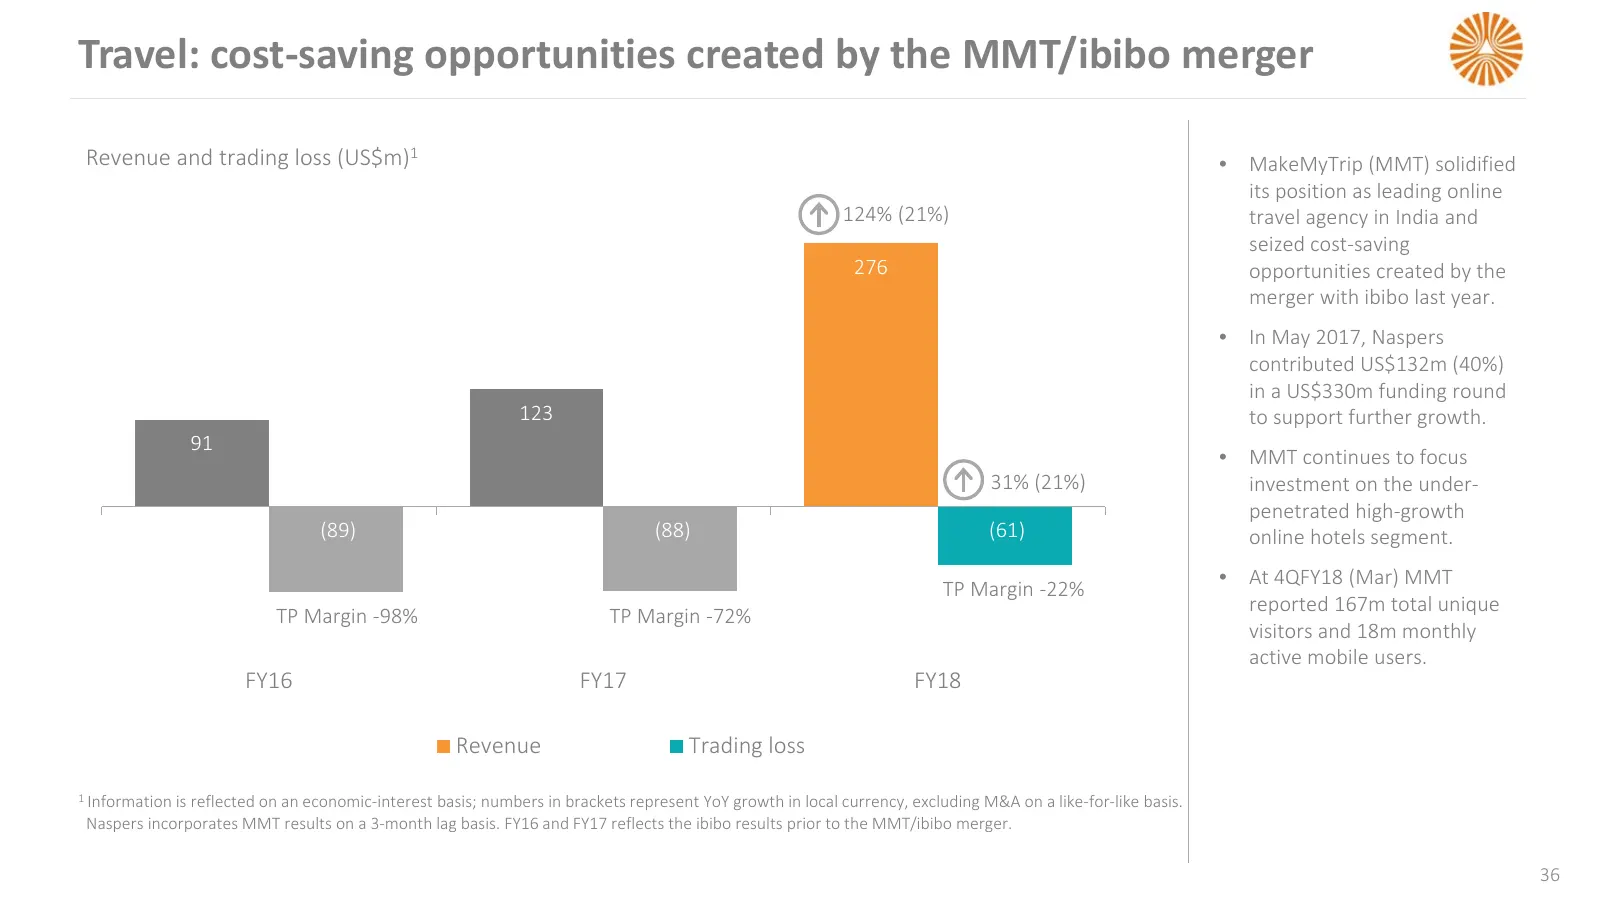
Travel: cost-saving opportunities created by the MMT/ibibo merger Revenue and trading loss (US$m)1 • MakeMyTrip (MMT) solidified its position as leading online 124% (21%) travel agency in India and seized cost-saving 276 opportunities created by the merger with ibibo last year. • In May 2017, Nasper
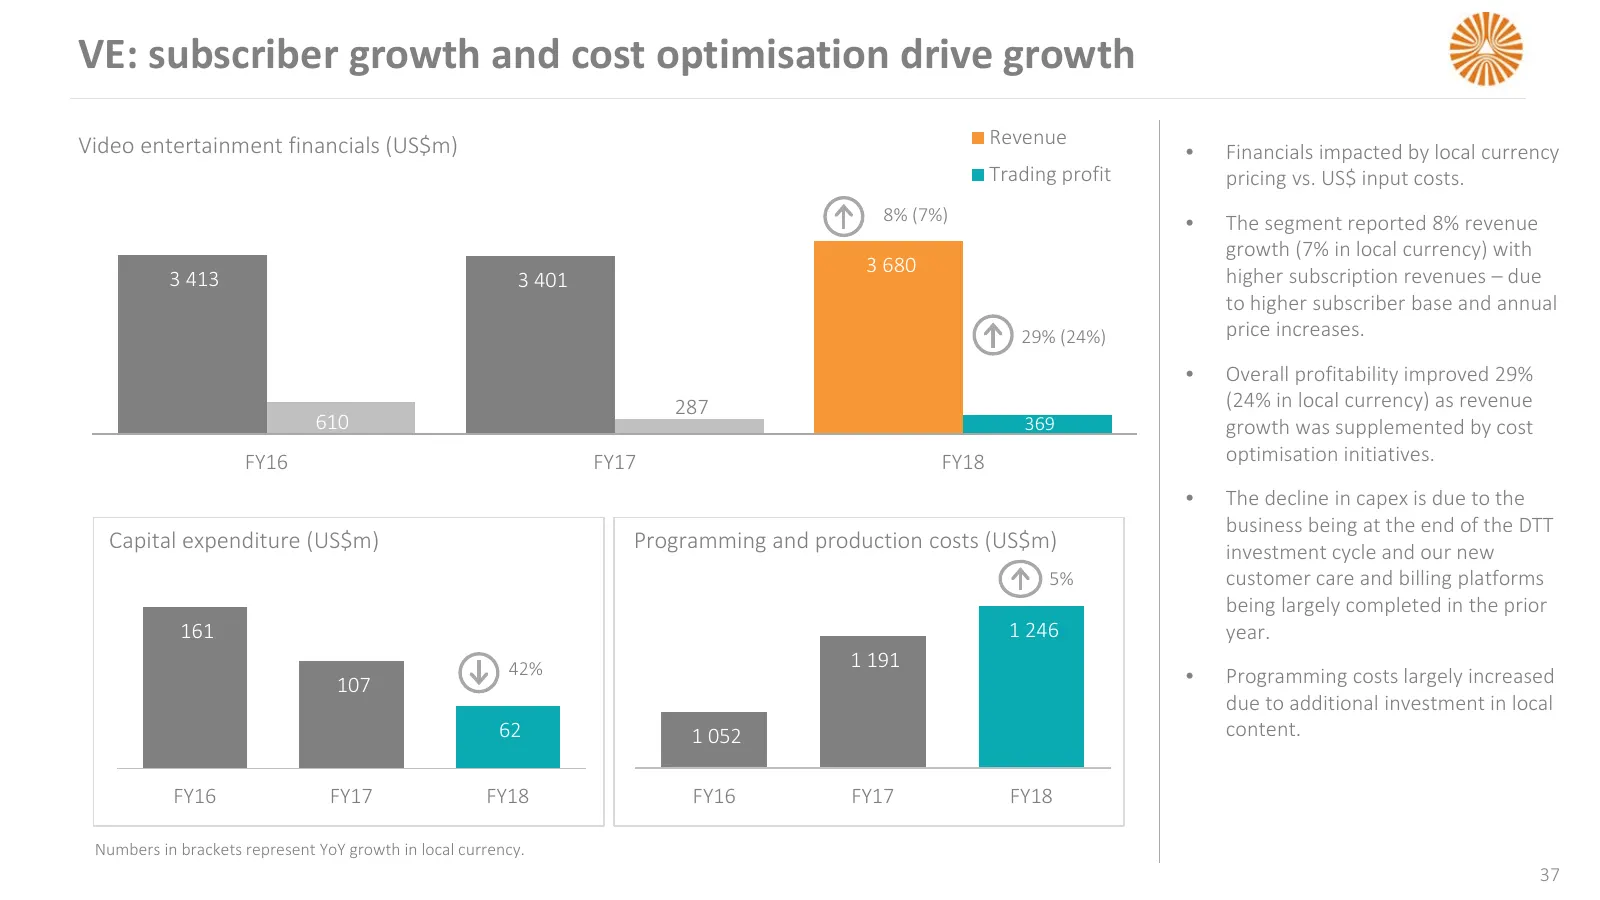
Slide 37: VE: subscriber growth and cost optimisation drive growth
VE: subscriber growth and cost optimisation drive growth Video entertainment financials (US$m) Revenue • Financials impacted by local currency Trading profit pricing vs. US$ input costs. 8% (7%) • The segment reported 8% revenue growth (7% in local currency) with 3 680 higher subscription revenues –
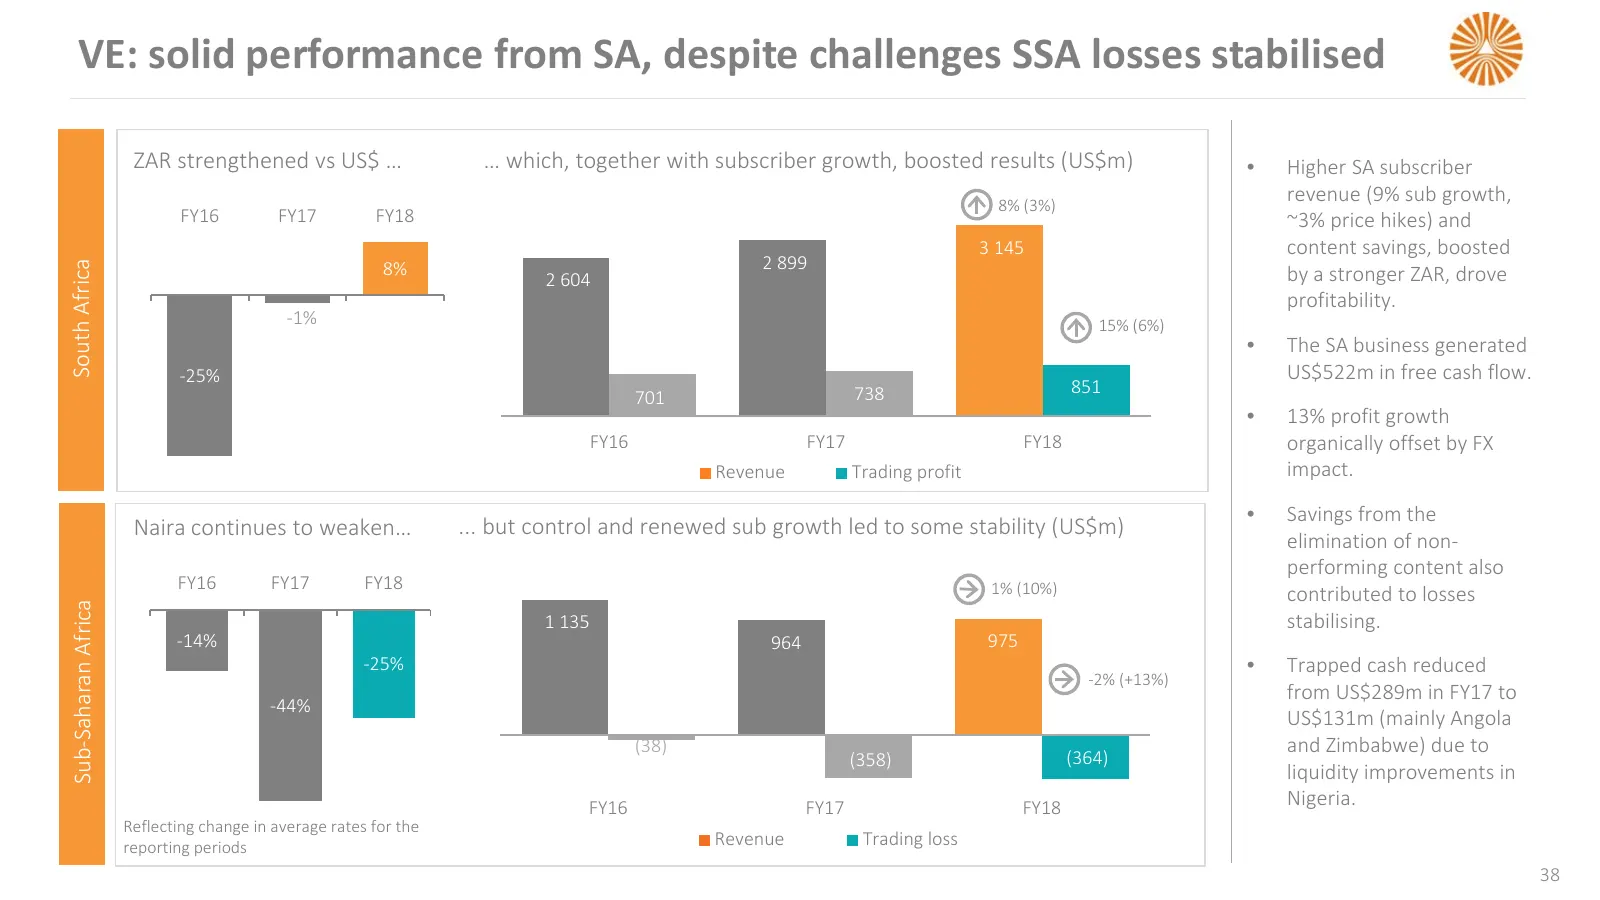
Slide 38: VE: solid performance from SA, despite challenges
VE: solid performance from SA, despite challenges SSA losses stabilised ZAR strengthened vs US$ … … which, together with subscriber growth, boosted results (US$m) • Higher SA subscriber 8% (3%) revenue (9% sub growth, FY16 FY17 FY18 ~3% price hikes) and 3 145 content savings, boosted 8% 2 899 South
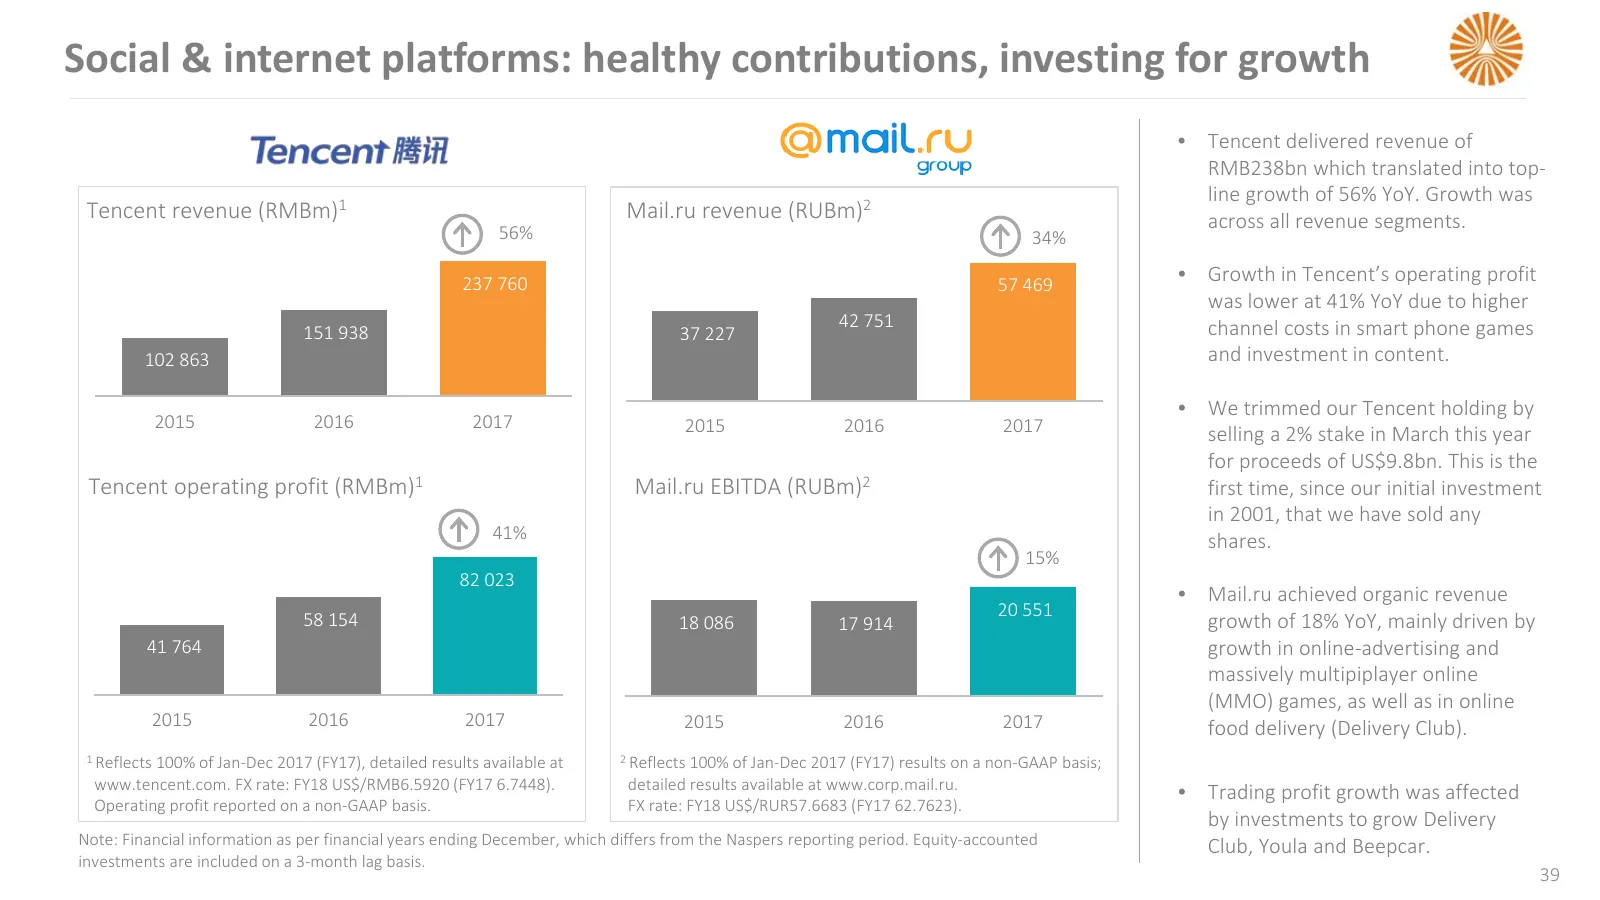
Slide 39: Social & internet platforms: healthy contributions, investing for growth
Social & internet platforms: healthy contributions, investing for growth • Tencent delivered revenue of RMB238bn which translated into top- line growth of 56% YoY. Growth was Tencent revenue (RMBm)1 Mail.ru revenue (RUBm)2 across all revenue segments. 56% 34% 237 760 57 469 • Growth in Tencent’s ope
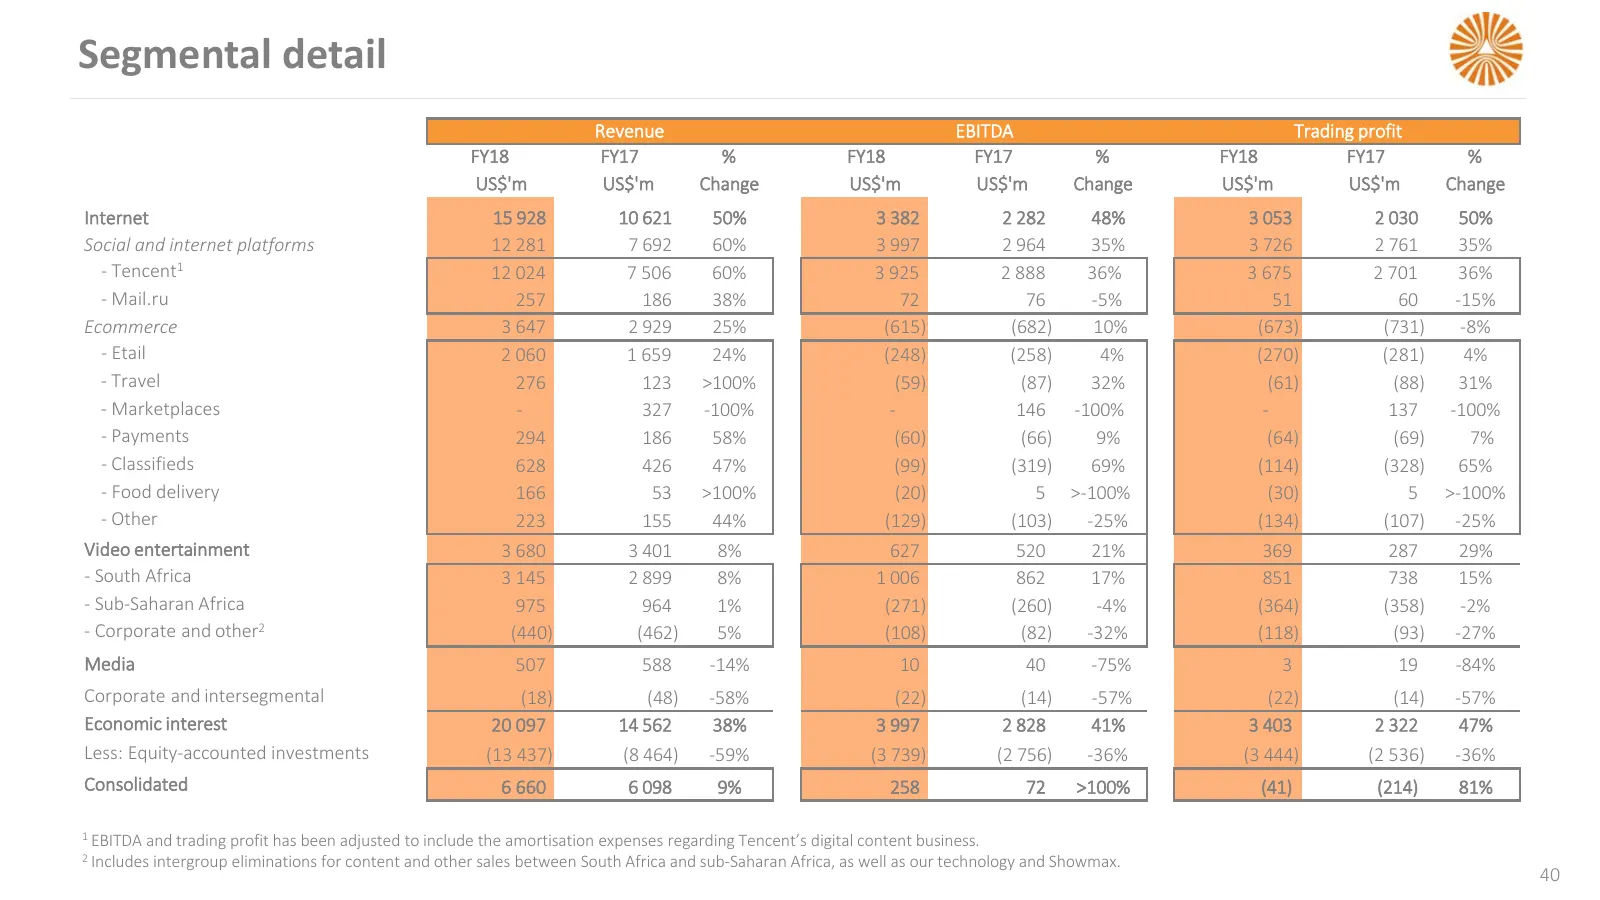
Slide 40: Segmental detail
Segmental detail Revenue EBITDA Trading profit FY18 FY17 % FY18 FY17 % FY18 FY17 % US$'m US$'m Change US$'m US$'m Change US$'m US$'m Change Internet 15 928 10 621 50% 3 382 2 282 48% 3 053 2 030 50% Social and internet platforms 12 281 7 692 60% 3 997 2 964 35% 3 726 2 761 35% - Tencent1 12 024 7 50
Slide 41: Free cash inflow: increased profitability converts into cash generation
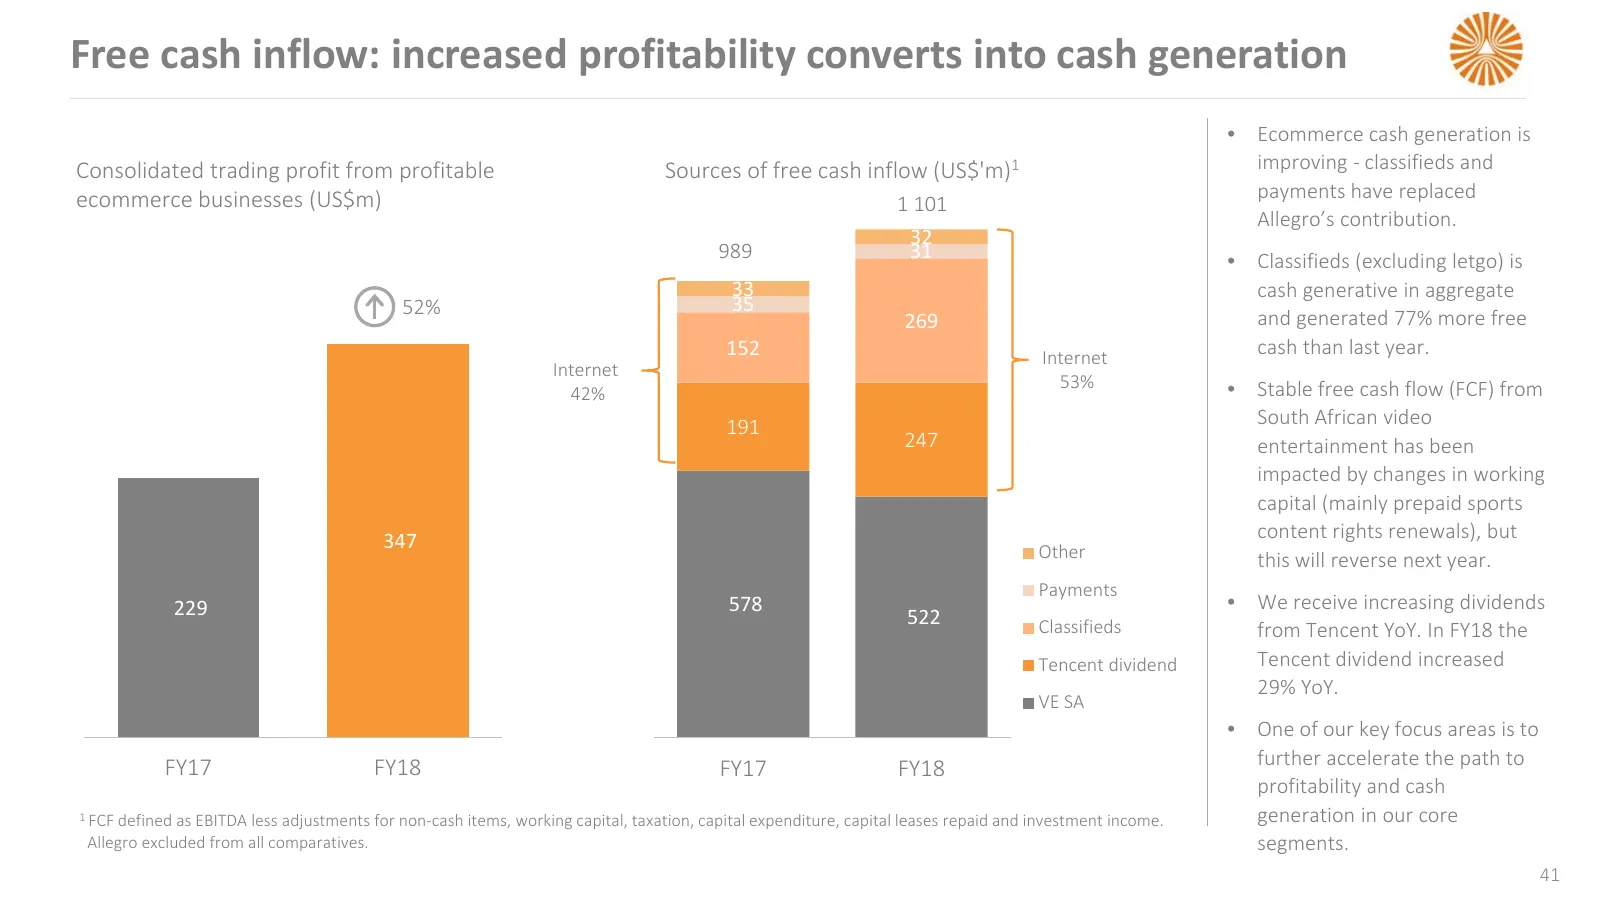
Free cash inflow: increased profitability converts into cash generation • Ecommerce cash generation is Consolidated trading profit from profitable Sources of free cash inflow (US$'m)1 improving - classifieds and ecommerce businesses (US$m) payments have replaced 1 101 Allegro’s contribution. 32 989
Slide 42: FCF from operations offset by changes in working capital
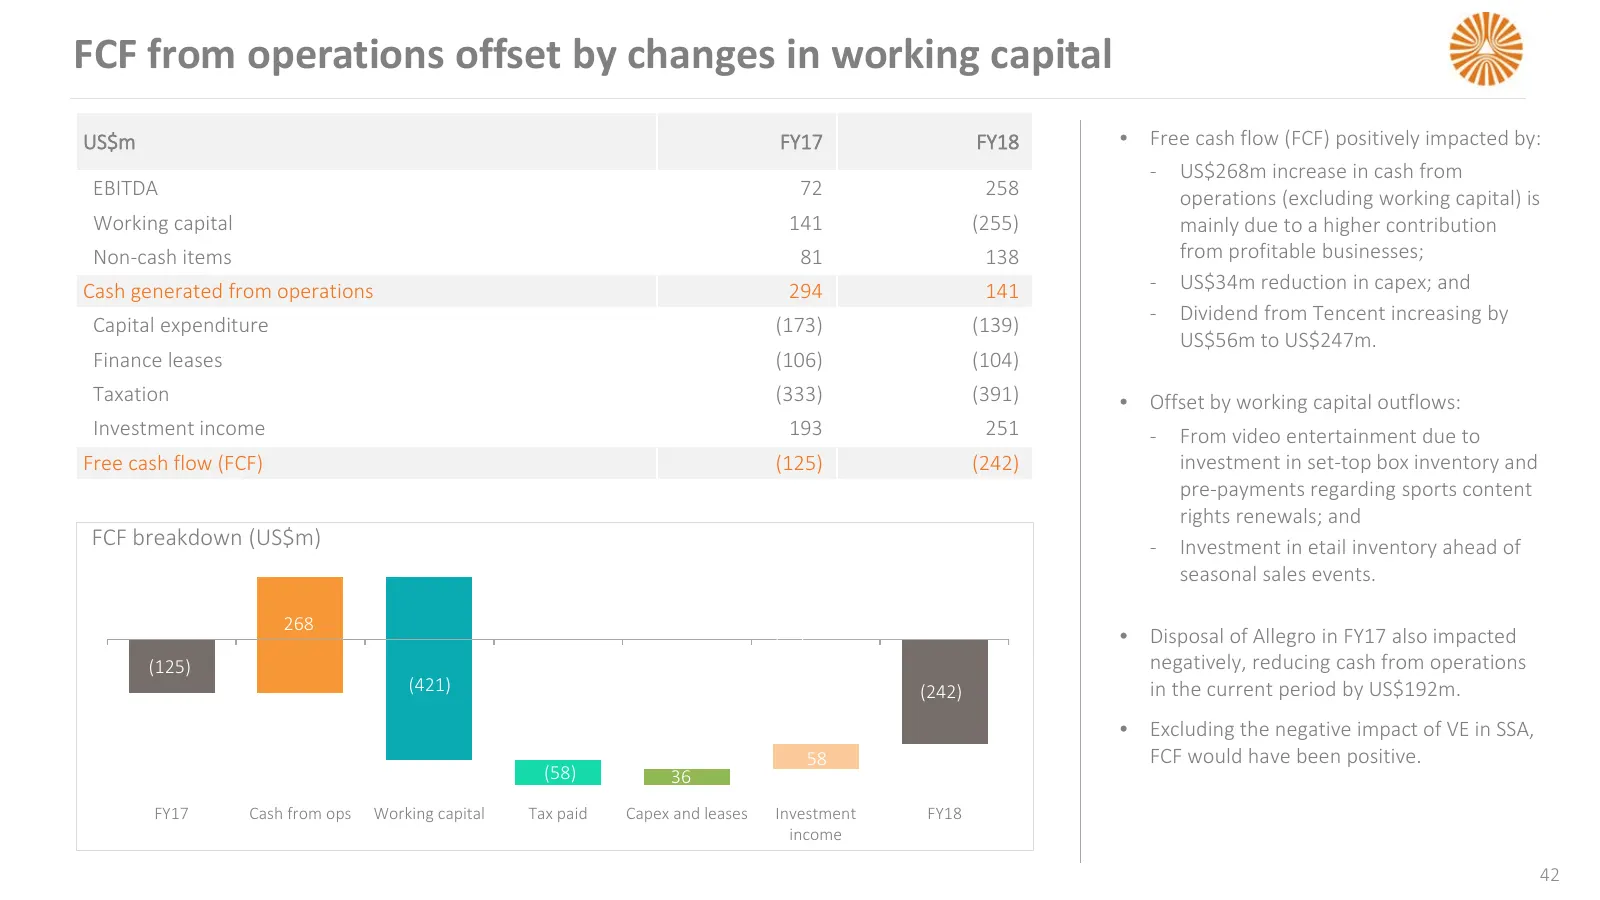
FCF from operations offset by changes in working capital US$m FY17 FY18 • Free cash flow (FCF) positively impacted by: ‐ US$268m increase in cash from EBITDA 72 258 operations (excluding working capital) is Working capital 141 (255) mainly due to a higher contribution Non-cash items 81 138 from prof
Slide 43: Holding company sources of cash and commitments
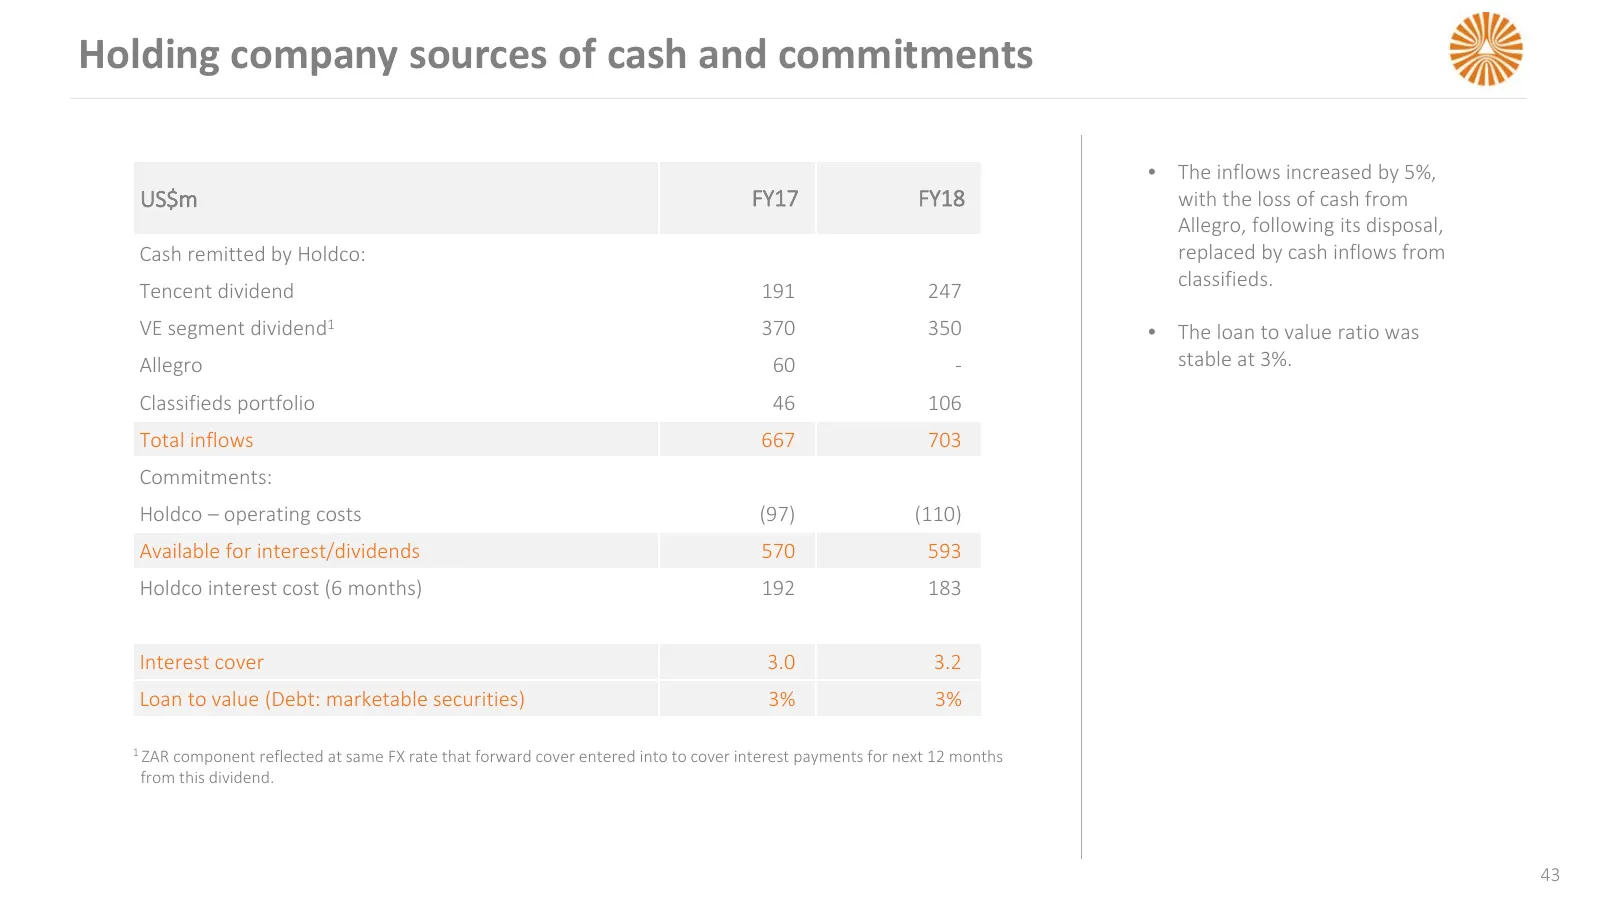
Holding company sources of cash and commitments • The inflows increased by 5%, US$m FY17 FY18 with the loss of cash from Allegro, following its disposal, Cash remitted by Holdco: replaced by cash inflows from classifieds. Tencent dividend 191 247 VE segment dividend1 370 350 • The loan to value rati
Slide 44: Recent M&A activity
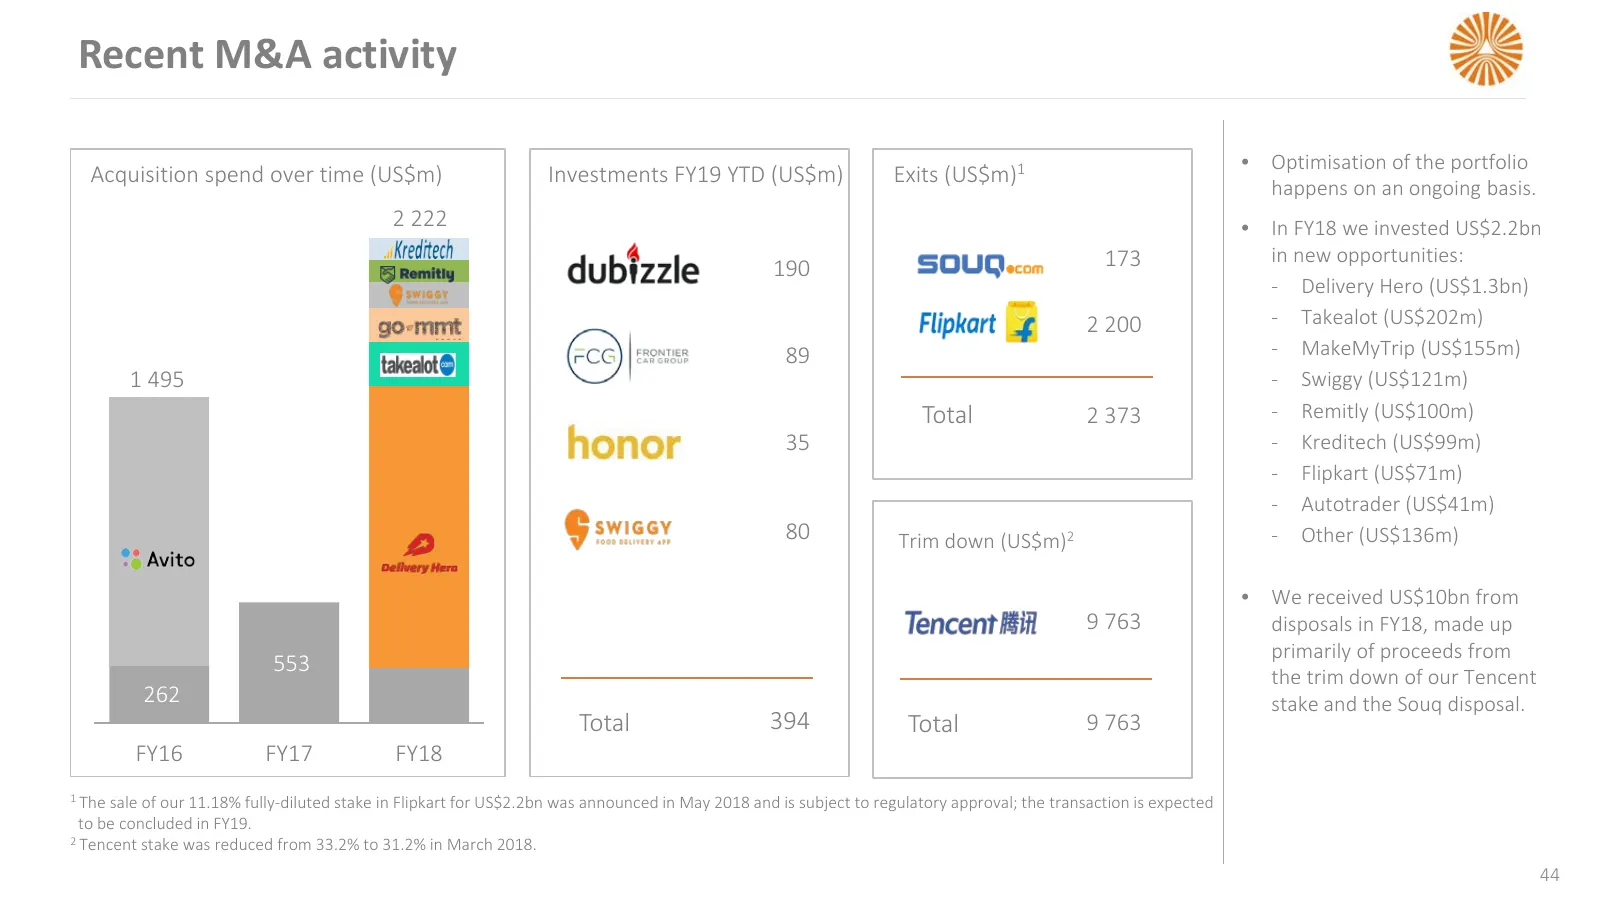
Recent M&A activity • Optimisation of the portfolio Acquisition spend over time (US$m) Investments FY19 YTD (US$m) Exits (US$m)1 happens on an ongoing basis. 2 222 • In FY18 we invested US$2.2bn 173 in new opportunities: 190 ‐ Delivery Hero (US$1.3bn) 2 200 ‐ Takealot (US$202m) 89 ‐ MakeMyTrip (US$1
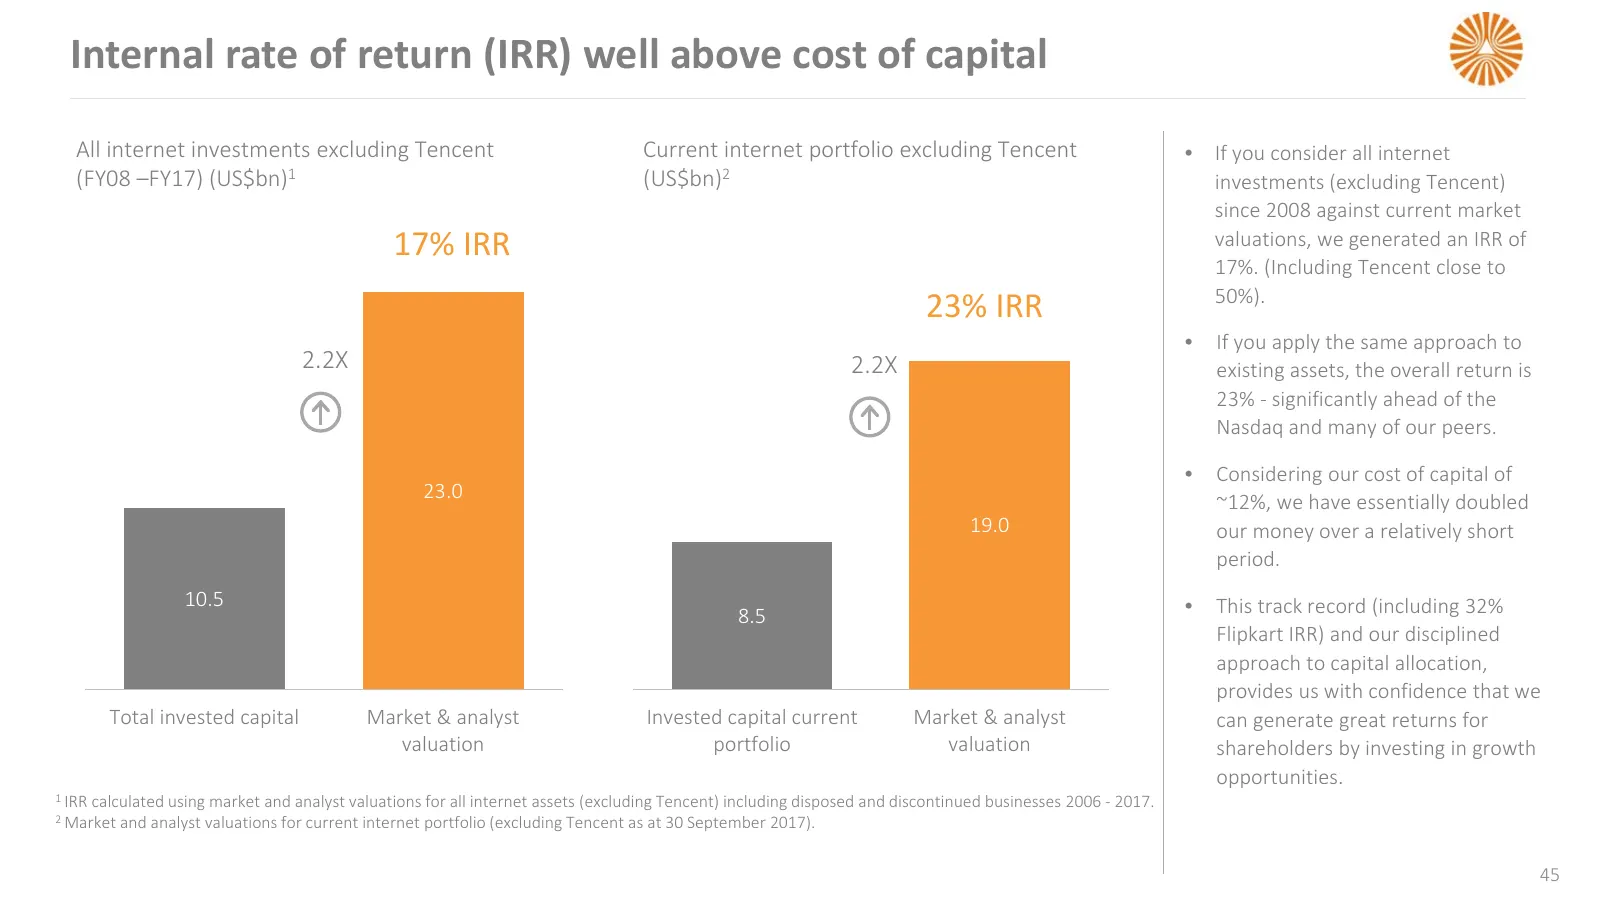
Slide 45: Internal rate of return (IRR) well above cost of capital
Internal rate of return (IRR) well above cost of capital All internet investments excluding Tencent Current internet portfolio excluding Tencent • If you consider all internet (FY08 –FY17) (US$bn)1 (US$bn)2 investments (excluding Tencent) since 2008 against current market 17% IRR valuations, we gene
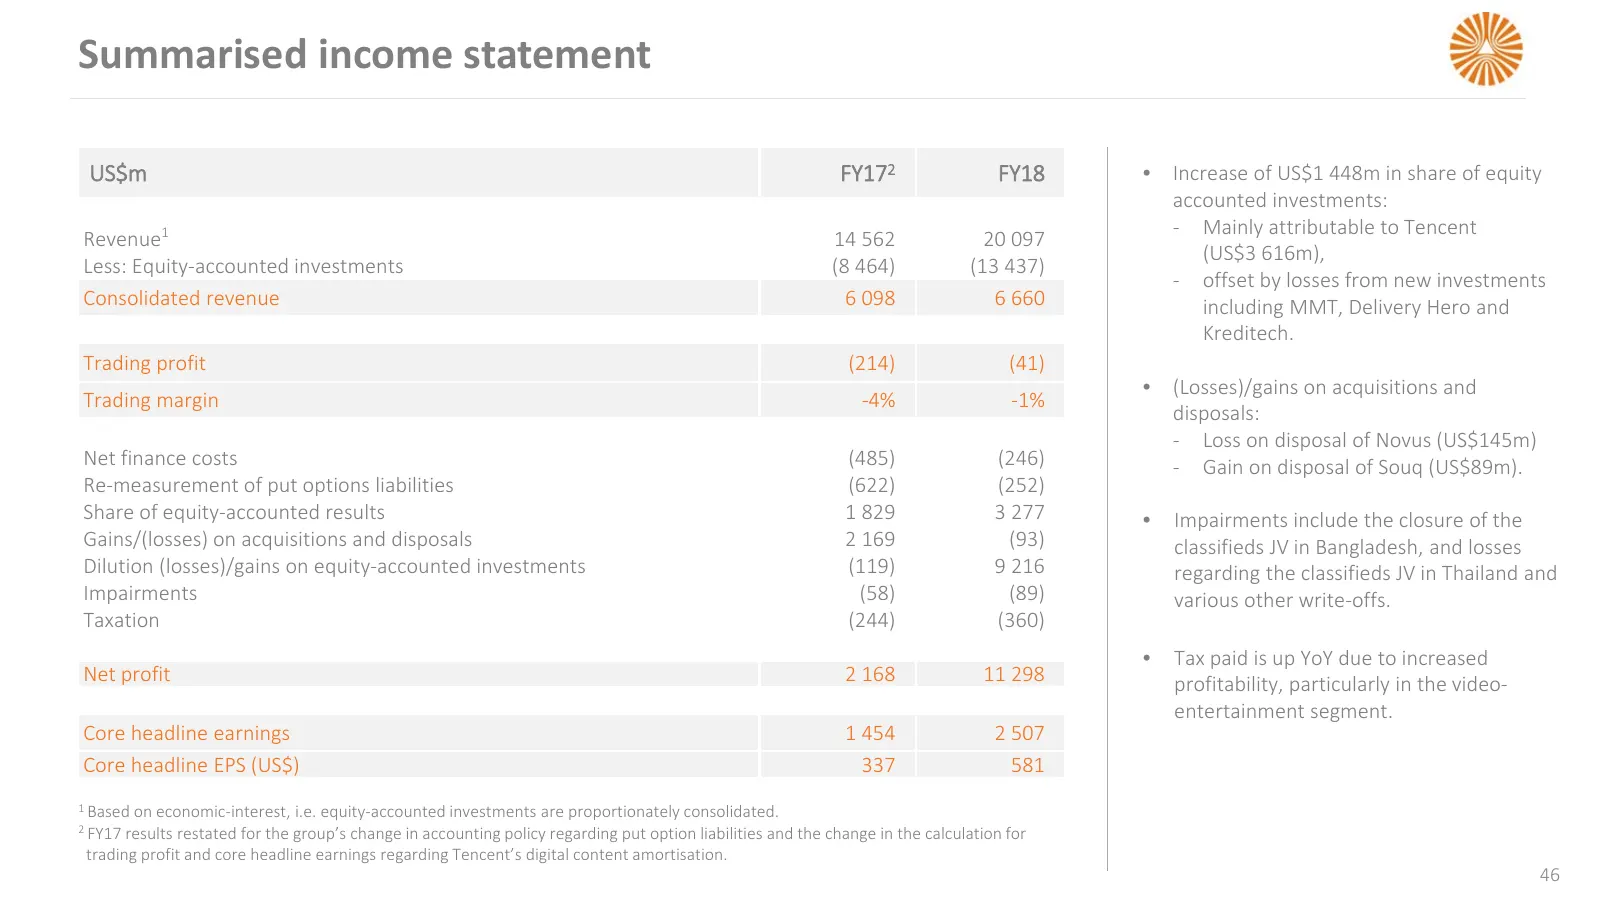
Slide 46: Summarised income statement
Summarised income statement US$m FY172 FY18 • Increase of US$1 448m in share of equity accounted investments: ‐ Mainly attributable to Tencent Revenue1 14 562 20 097 (US$3 616m), Less: Equity-accounted investments (8 464) (13 437) ‐ offset by losses from new investments Consolidated revenue 6 098 6
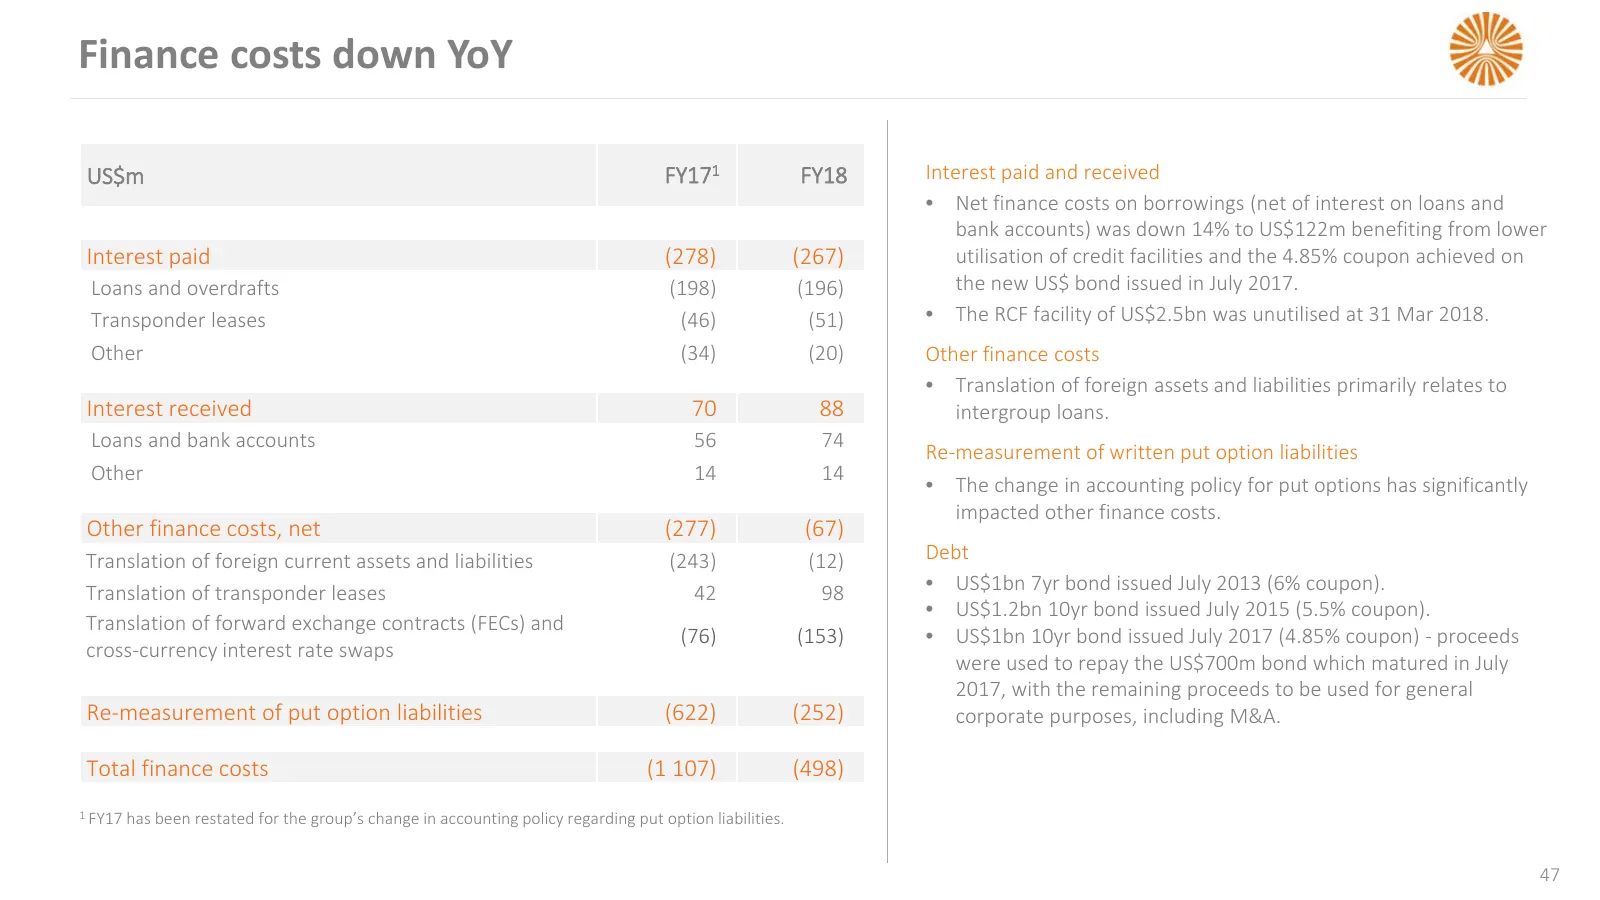
Slide 47: Finance costs down YoY
Finance costs down YoY US$m FY171 FY18 Interest paid and received • Net finance costs on borrowings (net of interest on loans and bank accounts) was down 14% to US$122m benefiting from lower Interest paid (278) (267) utilisation of credit facilities and the 4.85% coupon achieved on Loans and overdra
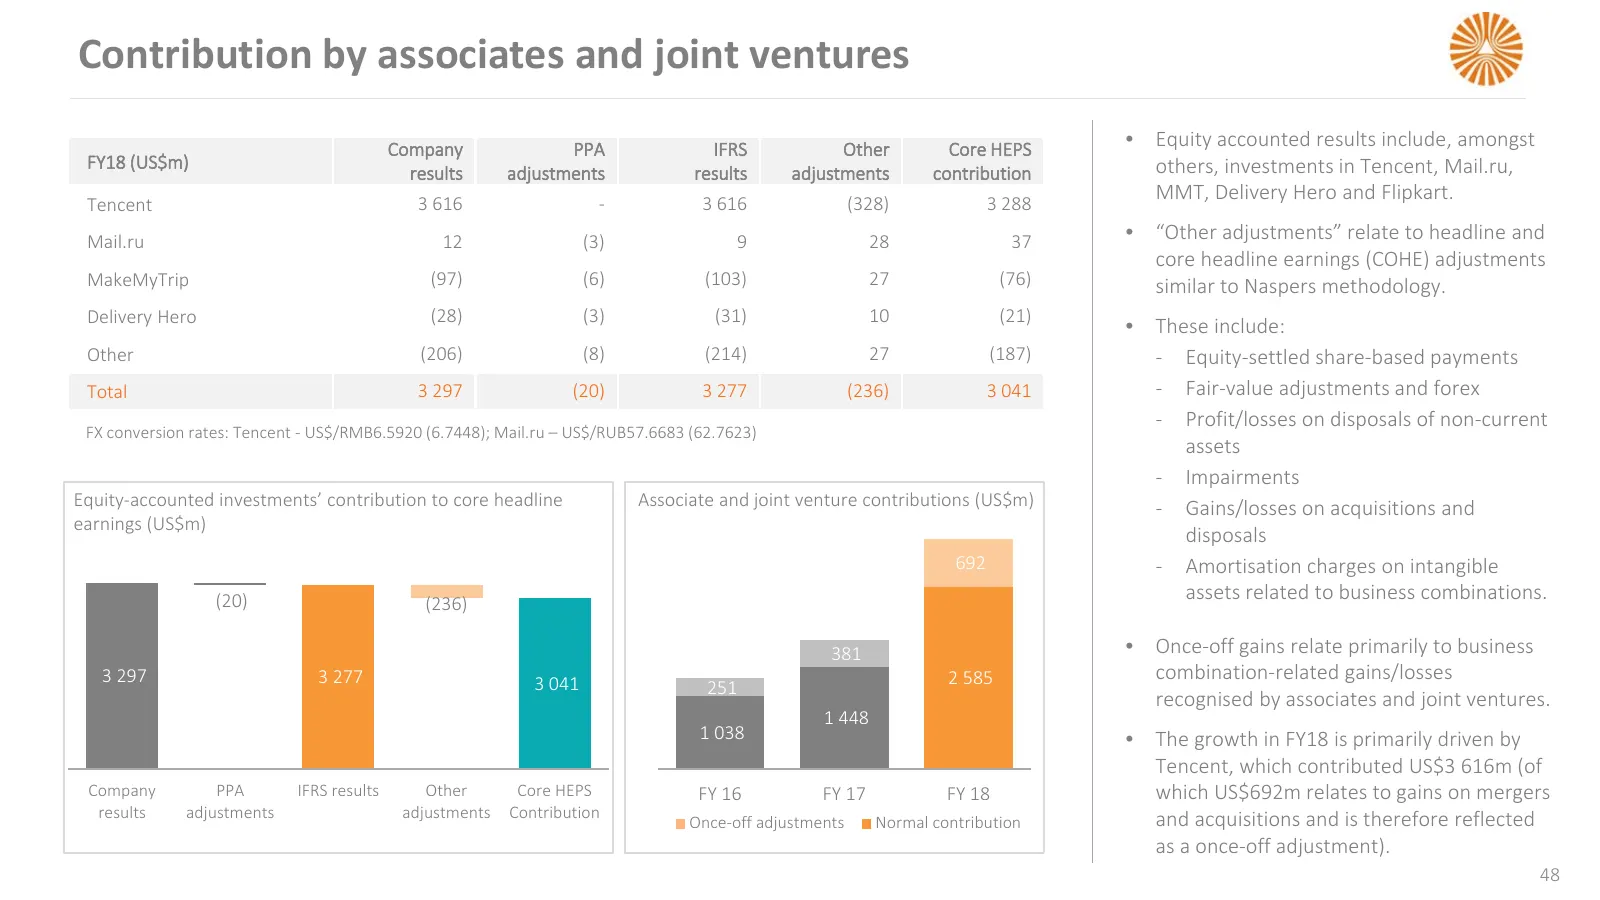
Slide 48: Contribution by associates and joint ventures
Contribution by associates and joint ventures Company PPA IFRS Other Core HEPS • Equity accounted results include, amongst FY18 (US$m) others, investments in Tencent, Mail.ru, results adjustments results adjustments contribution 3 616 - 3 616 (328) 3 288 MMT, Delivery Hero and Flipkart. Tencent Mail
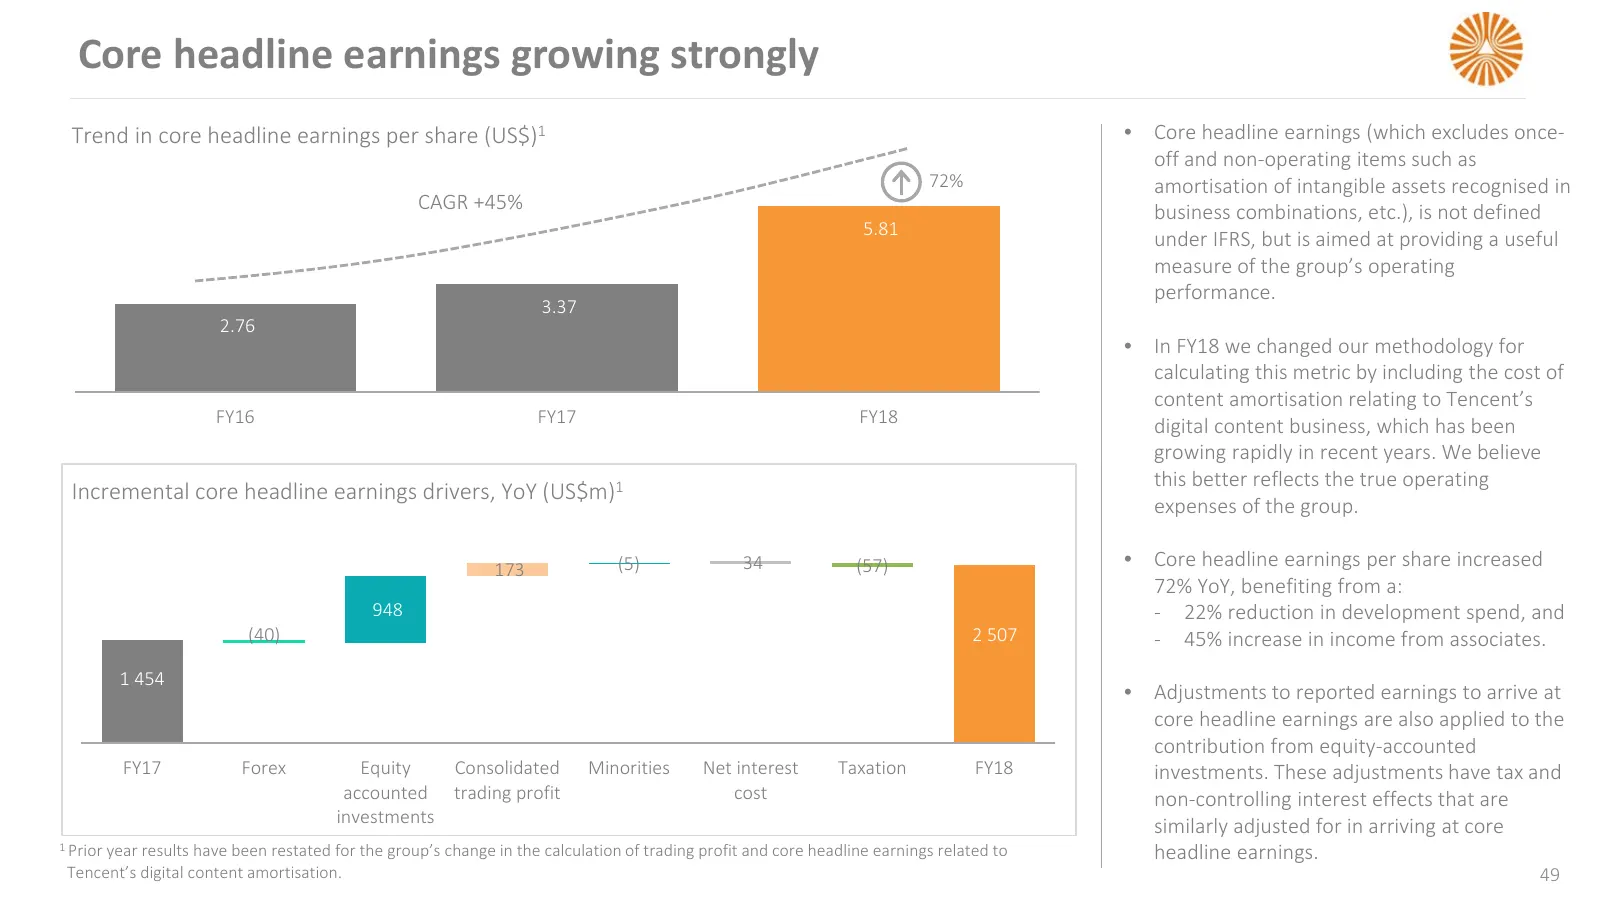
Slide 49: Core headline earnings growing strongly
Core headline earnings growing strongly Trend in core headline earnings per share (US$)1 • Core headline earnings (which excludes once- off and non-operating items such as 72% amortisation of intangible assets recognised in CAGR +45% business combinations, etc.), is not defined 5.81 under IFRS, but
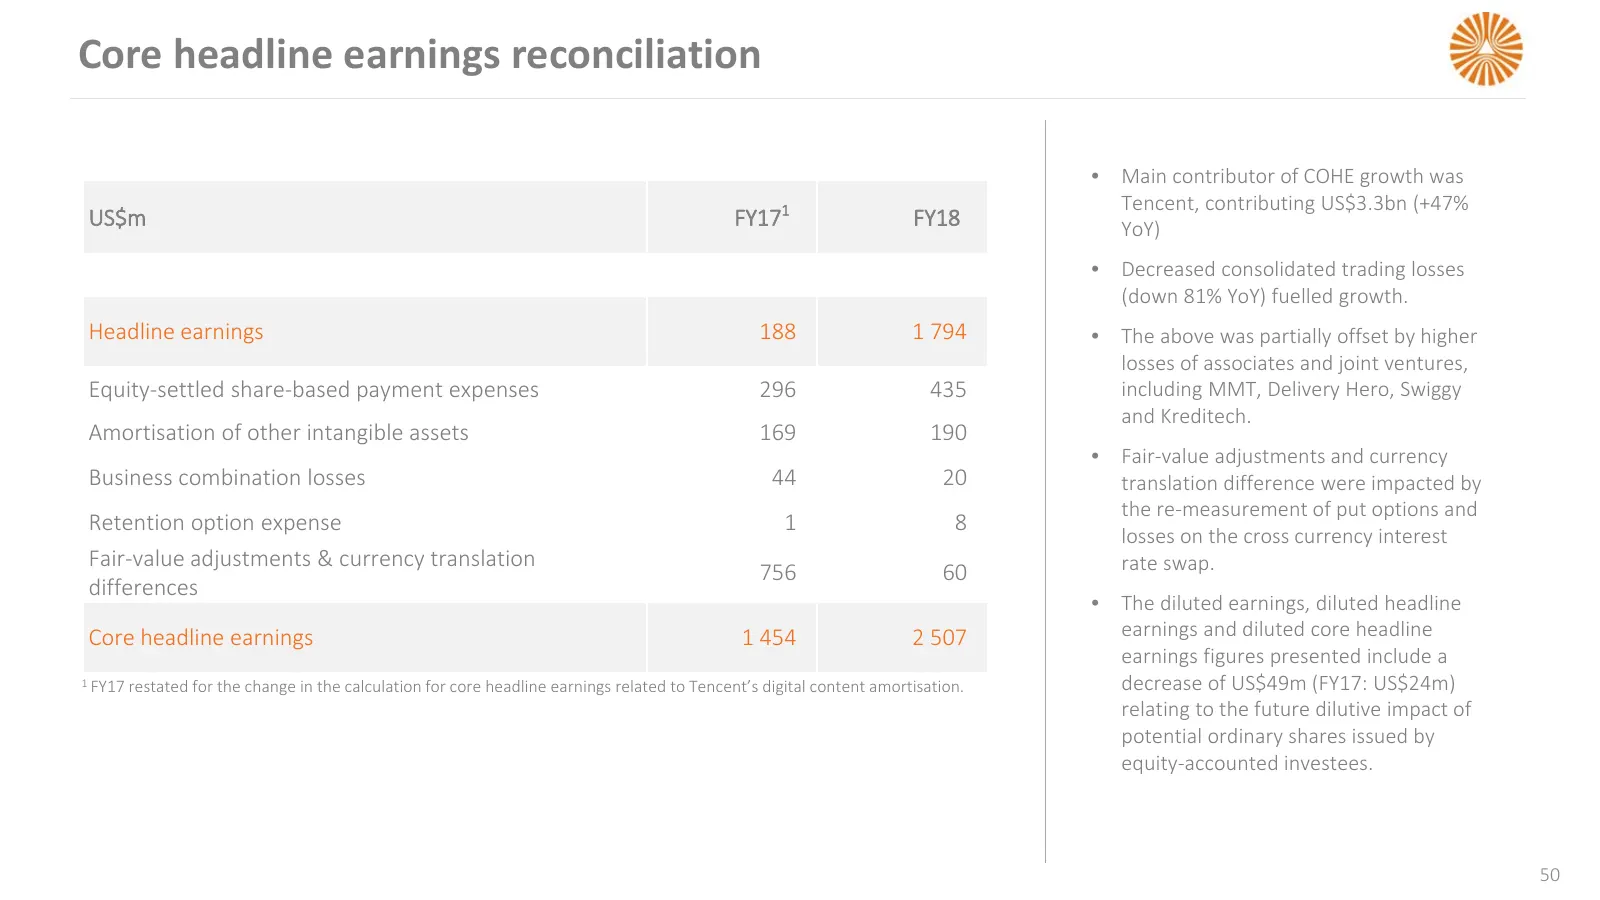
Slide 50: Core headline earnings reconciliation
Core headline earnings reconciliation • Main contributor of COHE growth was Tencent, contributing US$3.3bn (+47% US$m FY171 FY18 YoY) • Decreased consolidated trading losses (down 81% YoY) fuelled growth. Headline earnings 188 1 794 • The above was partially offset by higher losses of associates and
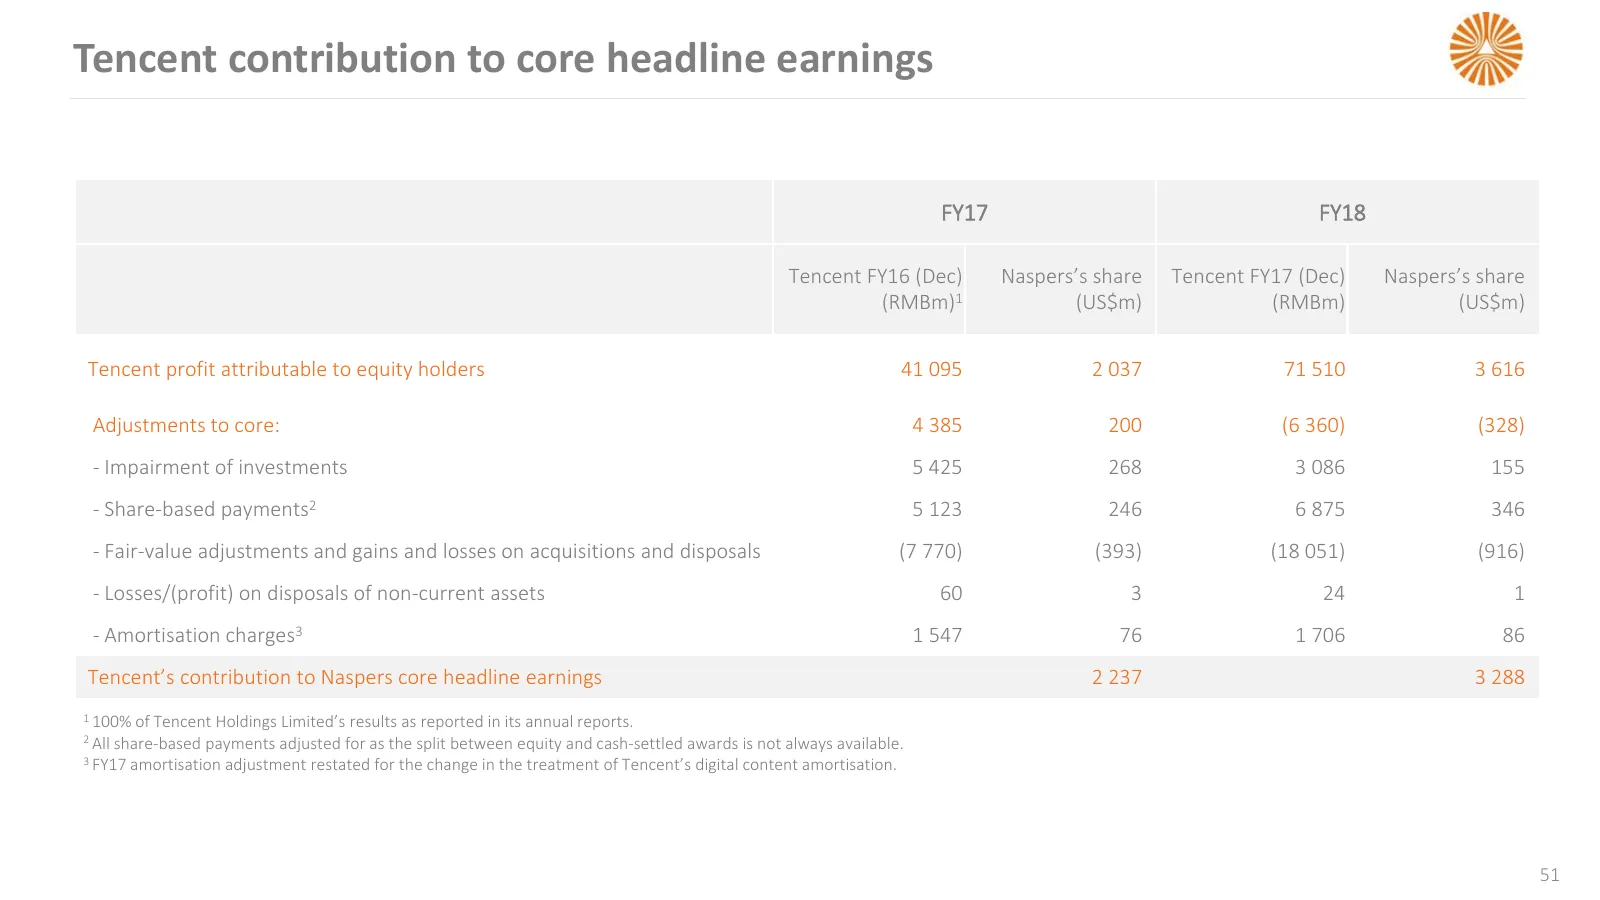
Slide 51: Tencent contribution to core headline earnings
Tencent contribution to core headline earnings FY17 FY18 Tencent FY16 (Dec) Naspers’s share Tencent FY17 (Dec) Naspers’s share (RMBm)1 (US$m) (RMBm) (US$m) Tencent profit attributable to equity holders 41 095 2 037 71 510 3 616 Adjustments to core: 4 385 200 (6 360) (328) - Impairment of investments
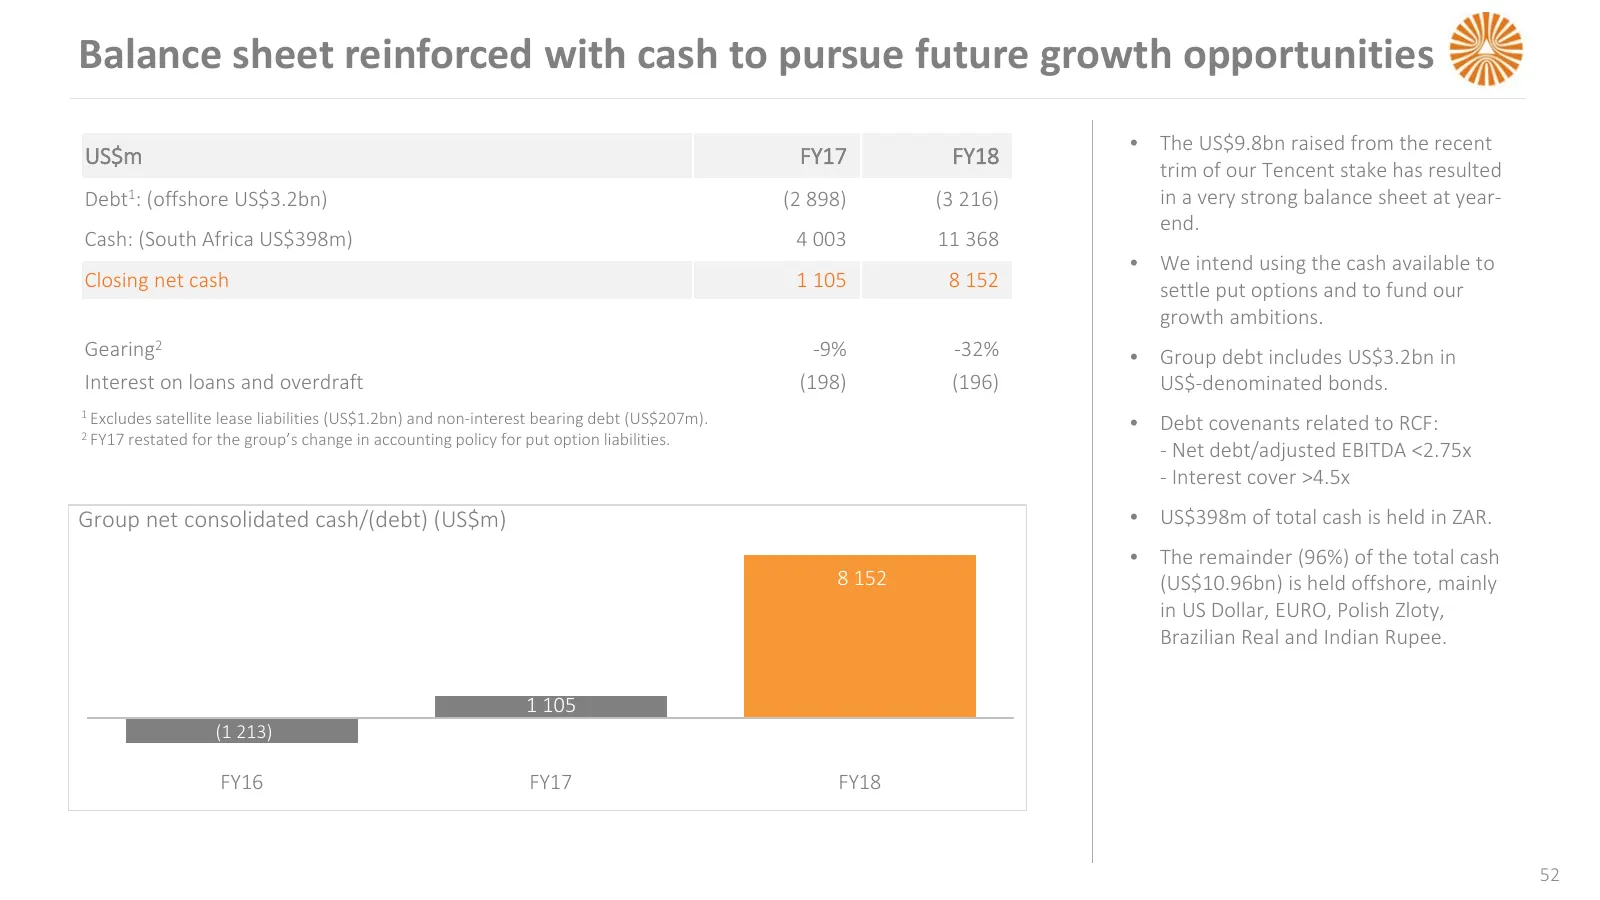
Slide 52: Balance sheet reinforced with cash to pursue future growth opportunities
Balance sheet reinforced with cash to pursue future growth opportunities • The US$9.8bn raised from the recent US$m FY17 FY18 trim of our Tencent stake has resulted Debt1: (offshore US$3.2bn) (2 898) (3 216) in a very strong balance sheet at year- end. Cash: (South Africa US$398m) 4 003 11 368 • We
Slide 53: Debt maturity profile and debt position
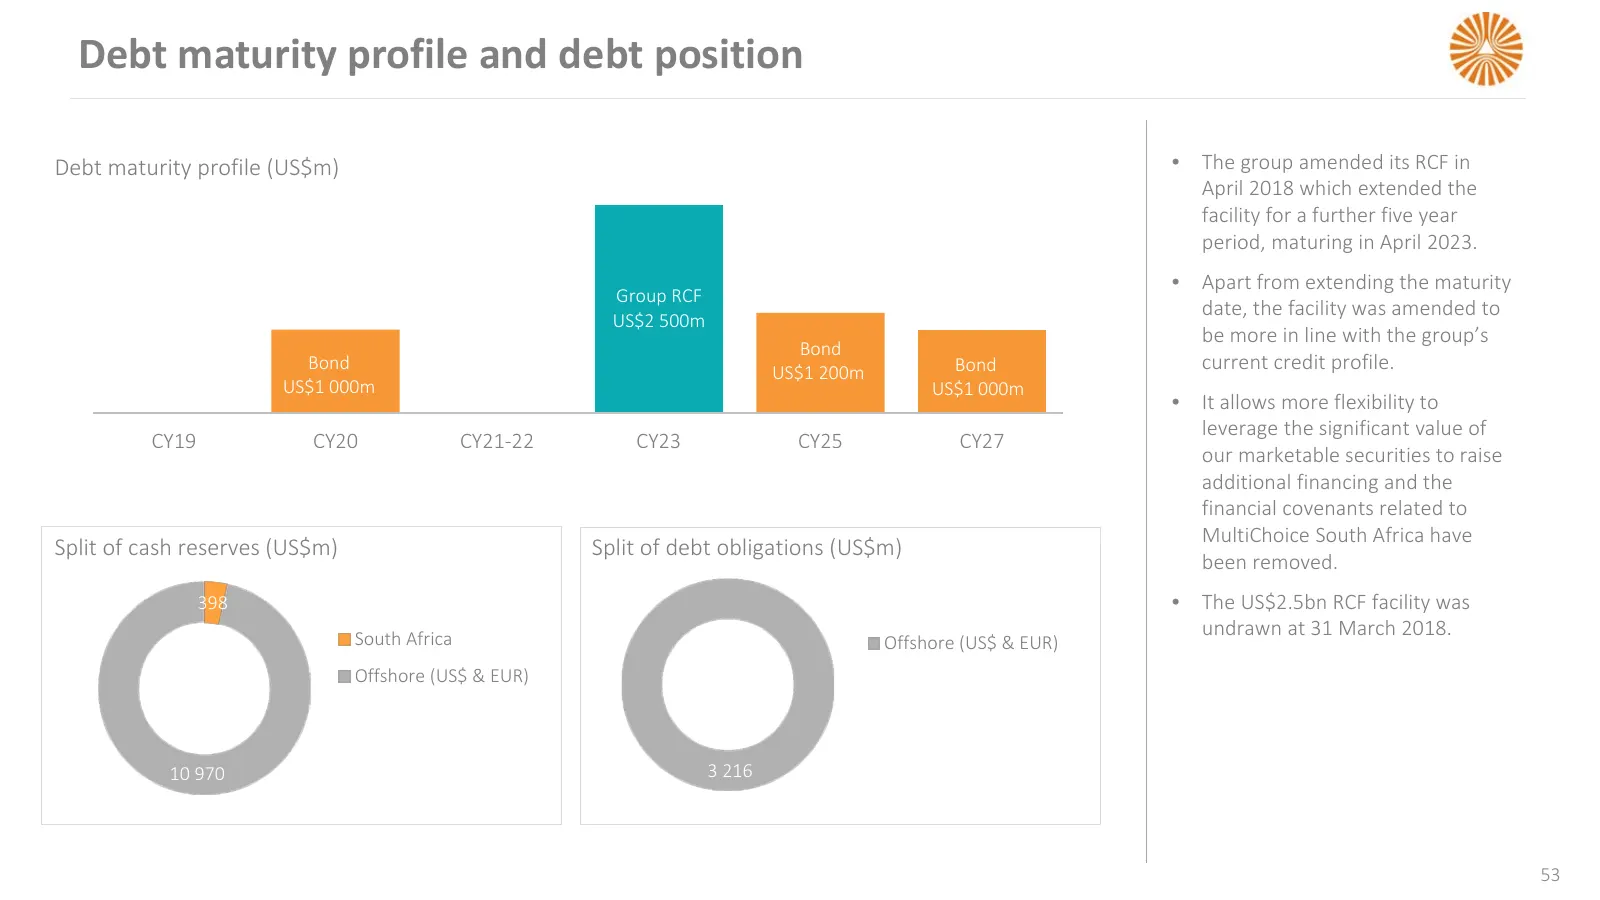
Debt maturity profile and debt position Debt maturity profile (US$m) • The group amended its RCF in April 2018 which extended the facility for a further five year period, maturing in April 2023. • Apart from extending the maturity Group RCF date, the facility was amended to US$2 500m be more in line
Slide 54: Current assets and liabilities
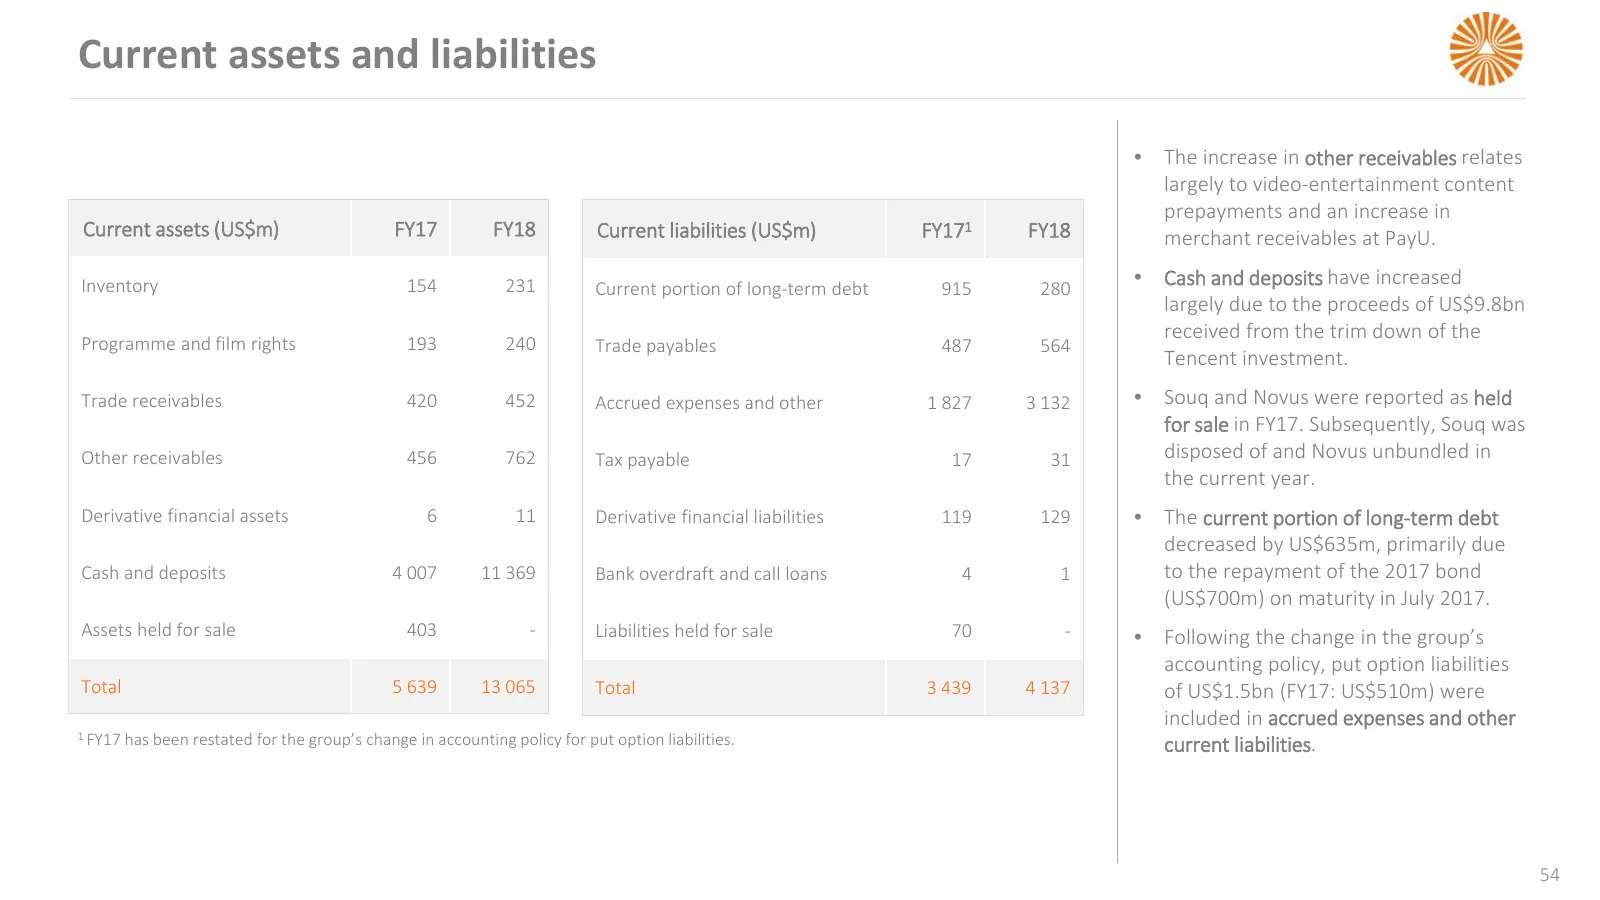
Current assets and liabilities • The increase in other receivables relates largely to video-entertainment content prepayments and an increase in Current assets (US$m) FY17 FY18 Current liabilities (US$m) FY171 FY18 merchant receivables at PayU. Inventory 154 231 Current portion of long-term debt 915
Slide 55: Capital expenditure
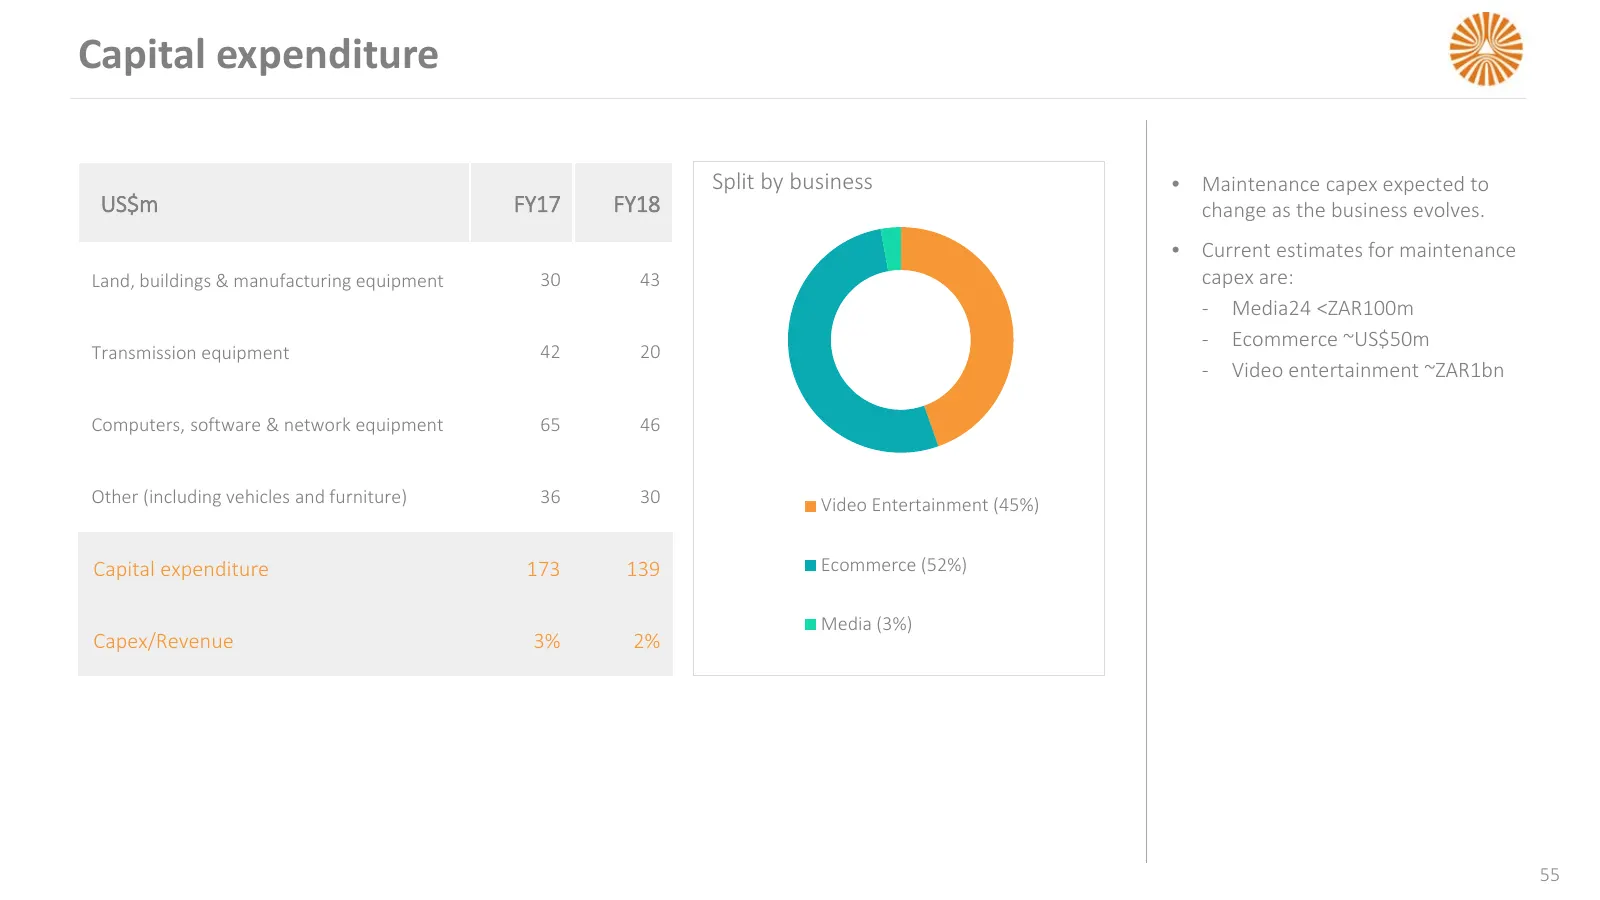
Capital expenditure Split by business • Maintenance capex expected to US$m FY17 FY18 change as the business evolves. • Current estimates for maintenance Land, buildings & manufacturing equipment 30 43 capex are: - Media24 <ZAR100m - Ecommerce ~US$50m Transmission equipment 42 20 - Video entertainmen
Slide 56: FX exposure: hedging
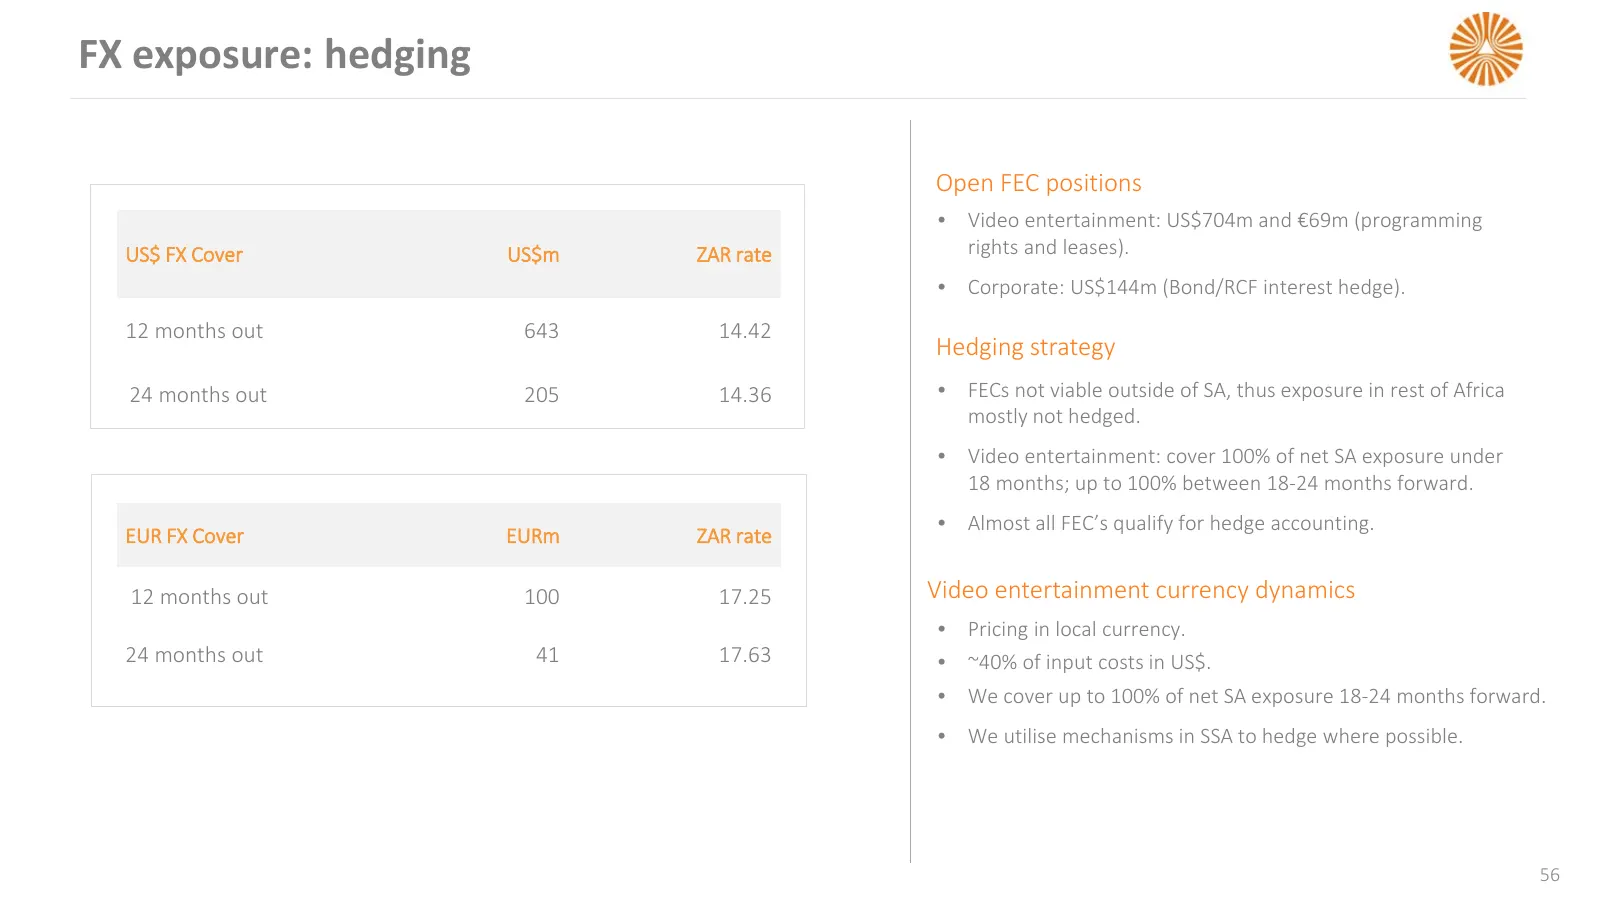
FX exposure: hedging Open FEC positions • Video entertainment: US$704m and €69m (programming US$ FX Cover US$m ZAR rate rights and leases). • Corporate: US$144m (Bond/RCF interest hedge). 12 months out 643 14.42 Hedging strategy 24 months out 205 14.36 • FECs not viable outside of SA, thus exposure

Slide 57: APPENDIX
APPENDIX
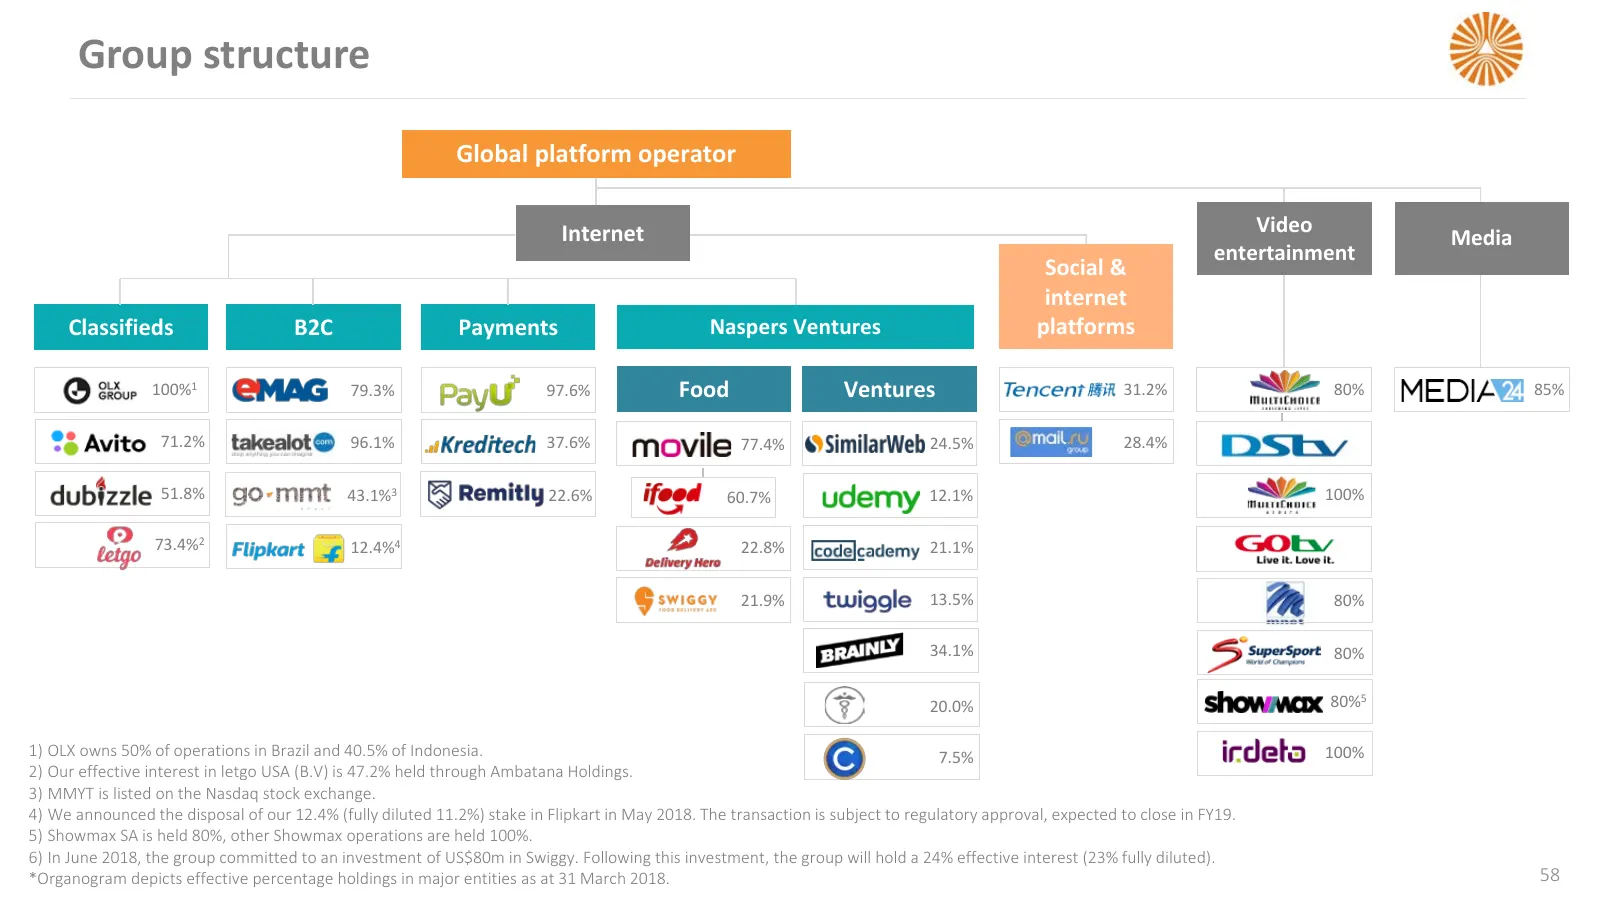
Slide 58: Group structure
Group structure Global platform operator Internet Video Media entertainment Social & internet Classifieds B2C Payments Naspers Ventures platforms 100%1 79.3% 97.6% Food Ventures 31.2% 80% 85% 71.2% 96.1% 37.6% 77.4% 24.5% 28.4% 51.8% 43.1%3 22.6% 60.7% 12.1% 100% 73.4%2 12.4%4 22.8% 21.1% 21.9% 13.5
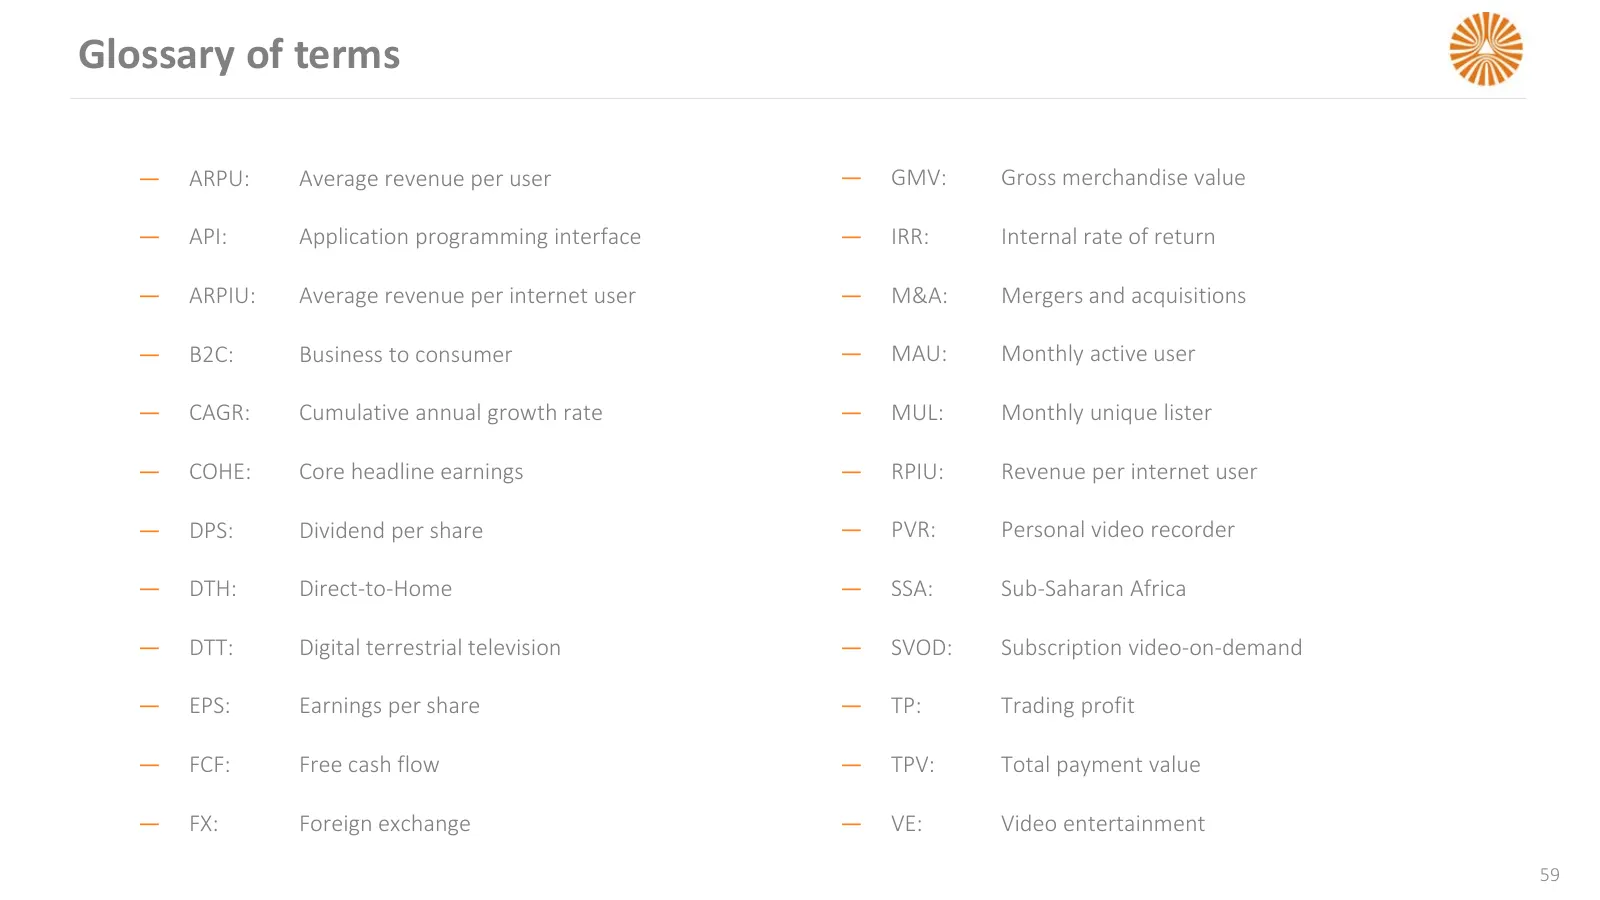
Slide 59: Glossary of terms
Glossary of terms — ARPU: Average revenue per user — GMV: Gross merchandise value — API: Application programming interface — IRR: Internal rate of return — ARPIU: Average revenue per internet user — M&A: Mergers and acquisitions — B2C: Business to consumer — MAU: Monthly active user — CAGR: Cumulati
Slide 60: THANK YOU
THANK YOU Meloy Horn +27 11 289 3320 +27 82 772 7123 InvestorRelations@naspers.com www.naspers.com
Source: Internet Archive copy of naspers.com
More decks from Naspers Limited Class N
 FY2026 Earnings Presentation60 slides · Jun 29, 2026
 FY2026 Earnings Presentation17 slides · Mar 31, 2026
 H1 2026 Earnings Presentation64 slides · Nov 24, 2025
 H1 FY26 Earnings Presentation17 slides · November 2025
 FY2025 Earnings Presentation51 slides · June 2025
 FY2025 Earnings Presentation17 slides · 2025