Railamerica — Q3 2009 Earnings Presentation
23 slides from Railamerica's earnings presentation, Nov 12, 2009

Slide 1: RailAmerica, Inc. Third Quarter 2009 Earnings Conference Call
RailAmerica, Inc. Third Quarter 2009 Earnings Conference Call November 12, 2009
Slide 2: Forward-looking statements
2 Certain items in this presentation and other information we provide from time to time may constitute forward-looking statements within the meaning of the Private Securities Litigation Reform Act of 1995 including, but not necessarily limited to, statements relating to future events and financial p
Slide 3: Executive Summary
3 Executive Summary John Giles, President and Chief Executive Officer
Slide 4: Highlights
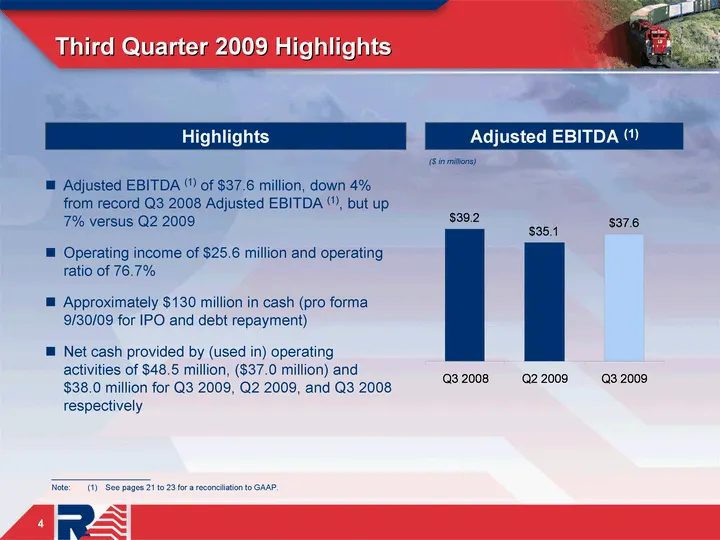
Third Quarter 2009 Highlights Adjusted EBITDA (1) of $37.6 million, down 4% from record Q3 2008 Adjusted EBITDA (1), but up 7% versus Q2 2009 Operating income of $25.6 million and operating ratio of 76.7% Approximately $130 million in cash (pro forma 9/30/09 for IPO and debt repayment) Net cash prov
Slide 5: Largest owner and operator of short line and regional freight railroads in North America
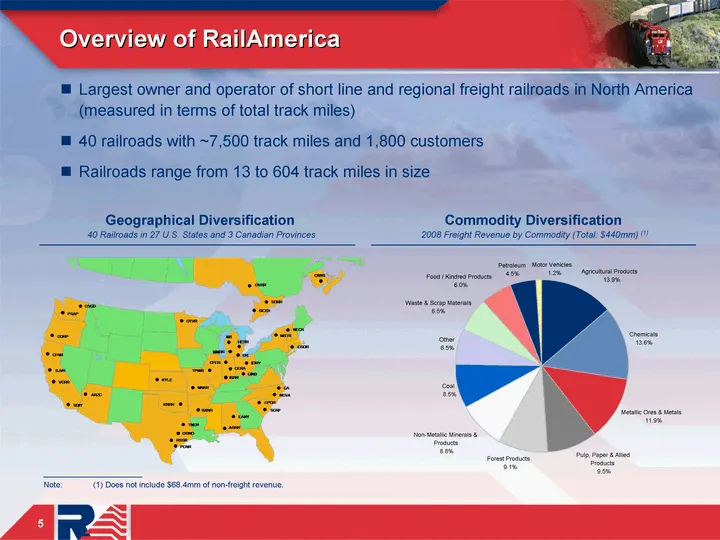
5 Largest owner and operator of short line and regional freight railroads in North America (measured in terms of total track miles) 40 railroads with ~7,500 track miles and 1,800 customers Railroads range from 13 to 604 track miles in size Overview of RailAmerica Commodity Diversification 2008 Freig
Slide 6: RailAmerica Investment Highlights
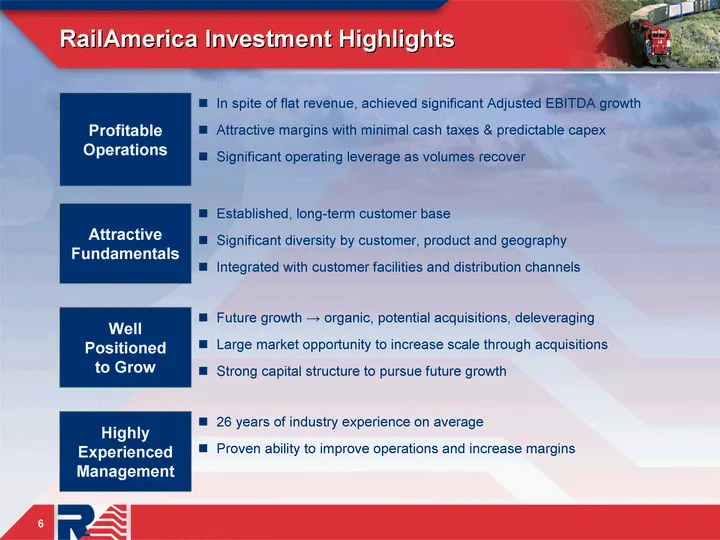
6 RailAmerica Investment Highlights Profitable Operations Attractive Fundamentals Well Positioned to Grow Highly Experienced Management In spite of flat revenue, achieved significant Adjusted EBITDA growth Attractive margins with minimal cash taxes & predictable capex Significant operating leverage
Slide 7: Revenue
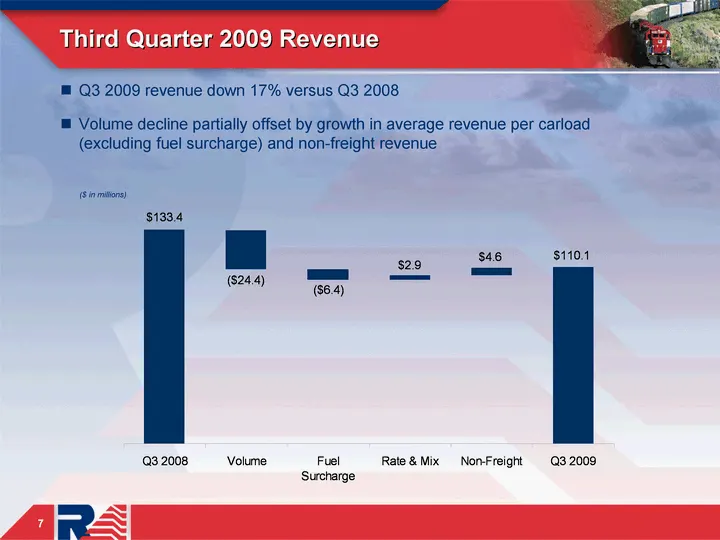
Third Quarter 2009 Revenue 7 Q3 2009 revenue down 17% versus Q3 2008 Volume decline partially offset by growth in average revenue per carload (excluding fuel surcharge) and non-freight revenue ($ in millions)
Slide 8: Carloads by Commodity
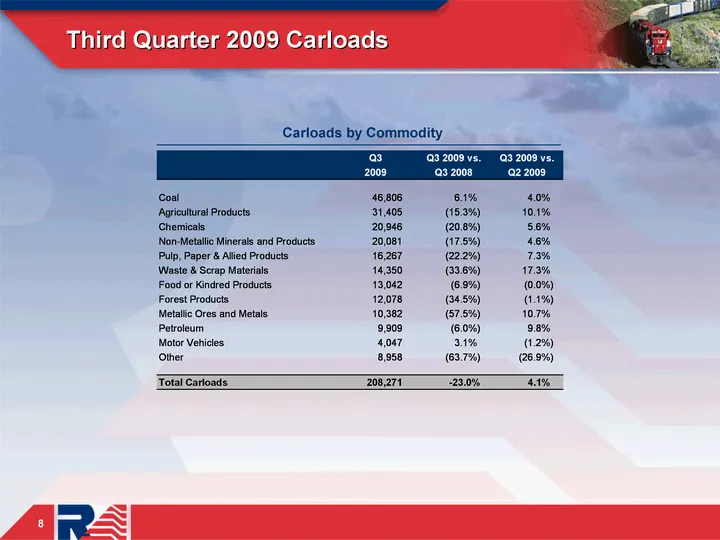
8 Third Quarter 2009 Carloads 8 Carloads by Commodity
Slide 9: Average Freight Revenue Per Carload
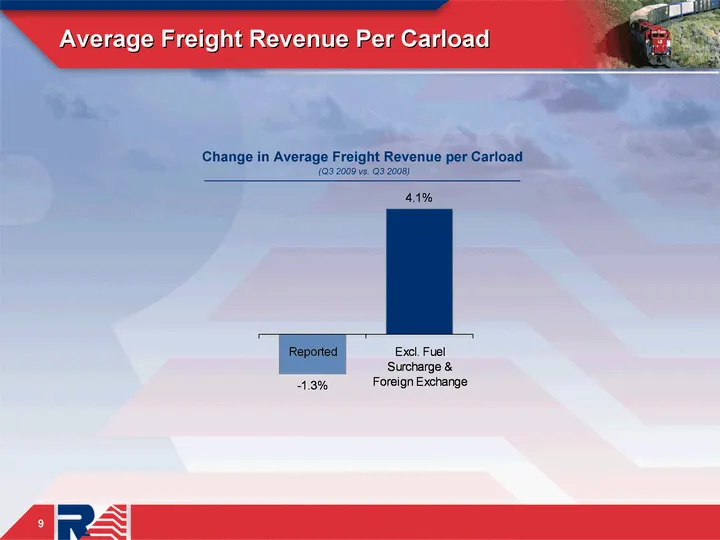
Average Freight Revenue Per Carload 9 Reported Excl. Fuel Surcharge & Foreign Exchange -0.013 0.041 Change in Average Freight Revenue per Carload (Q3 2009 vs. Q3 2008)
Slide 10: Non-Freight Revenue
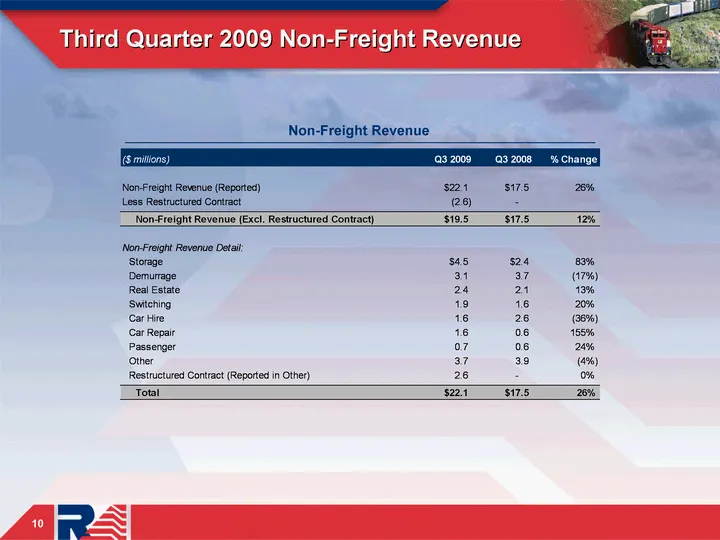
Third Quarter 2009 Non-Freight Revenue 10 Non-Freight Revenue
Slide 11: Expense Reductions
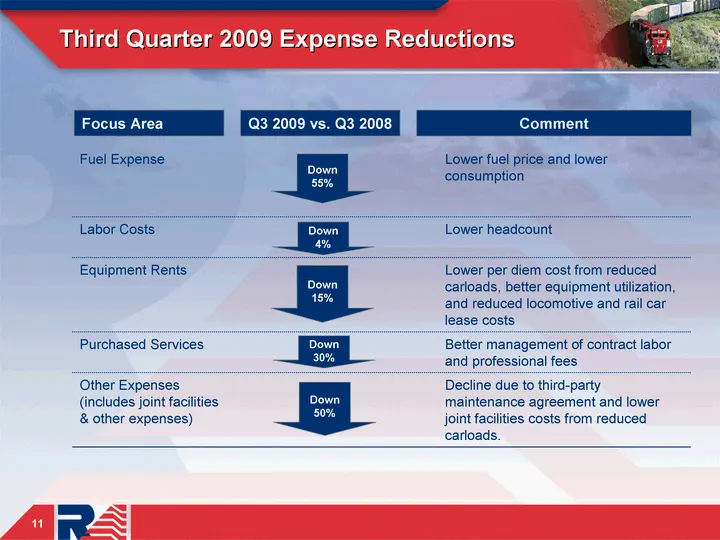
Third Quarter 2009 Expense Reductions 11 Fuel Expense Lower fuel price and lower consumption Labor Costs Lower headcount Equipment Rents Lower per diem cost from reduced carloads, better equipment utilization, and reduced locomotive and rail car lease costs Purchased Services Better management of co
Slide 12: Continuously Improving Safety Performance
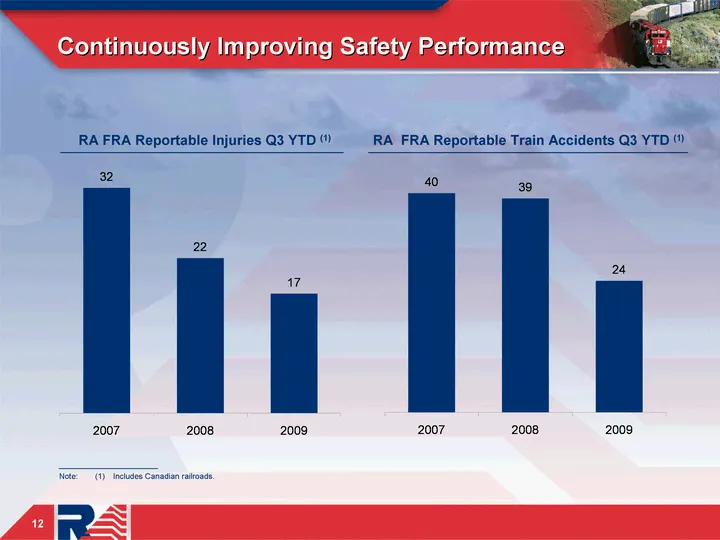
Continuously Improving Safety Performance 12 RA FRA Reportable Injuries Q3 YTD (1) RA FRA Reportable Train Accidents Q3 YTD (1) ______________________ Note: (1) Includes Canadian railroads.
Slide 13: Financial Review
13 Third Quarter 2009 Financial Review Clyde Preslar, Chief Financial Officer
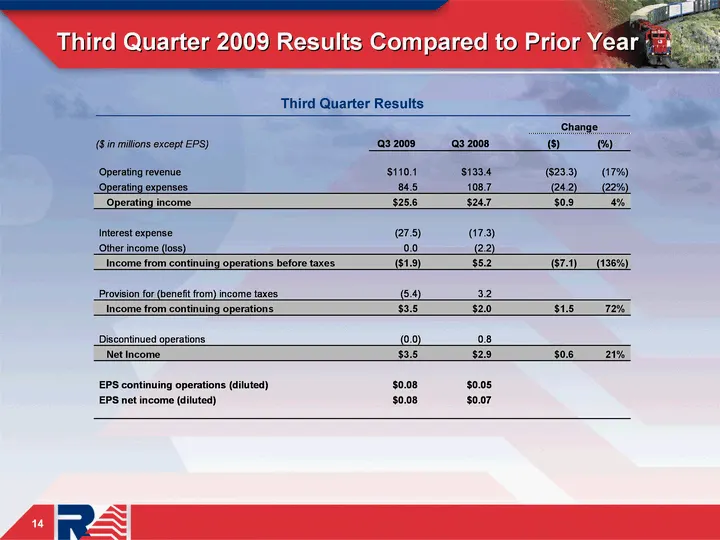
Slide 14: Results Compared to Prior Year Third Quarter Results
14 Third Quarter 2009 Results Compared to Prior Year 14 Third Quarter Results
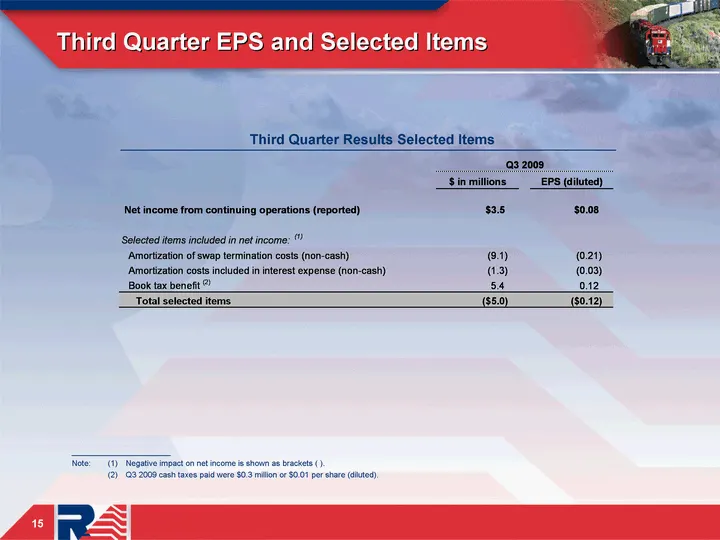
Slide 15: Third Quarter EPS and Selected Items
15 Third Quarter EPS and Selected Items 15 ______________________ Note: (1) Negative impact on net income is shown as brackets ( ). (2) Q3 2009 cash taxes paid were $0.3 million or $0.01 per share (diluted). Third Quarter Results Selected Items
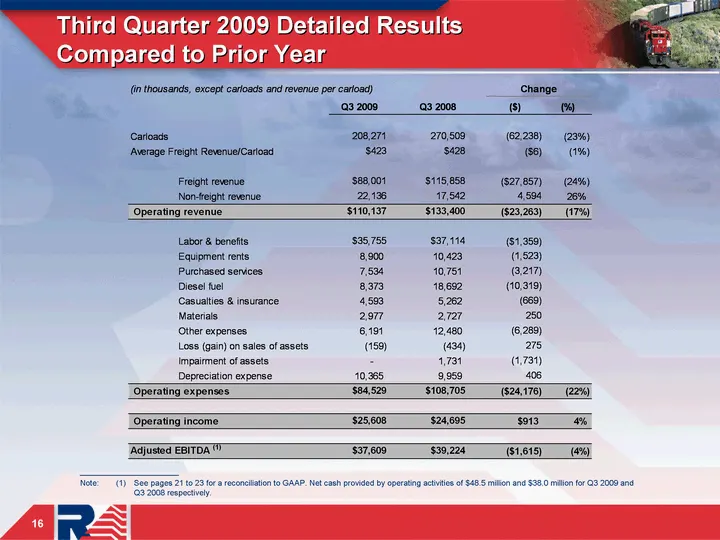
Slide 16: Detailed Results Compared to Prior Year
16 16 Third Quarter 2009 Detailed Results Compared to Prior Year ______________________ Note: (1) See pages 21 to 23 for a reconciliation to GAAP. Net cash provided by operating activities of $48.5 million and $38.0 million for Q3 2009 and Q3 2008 respectively.
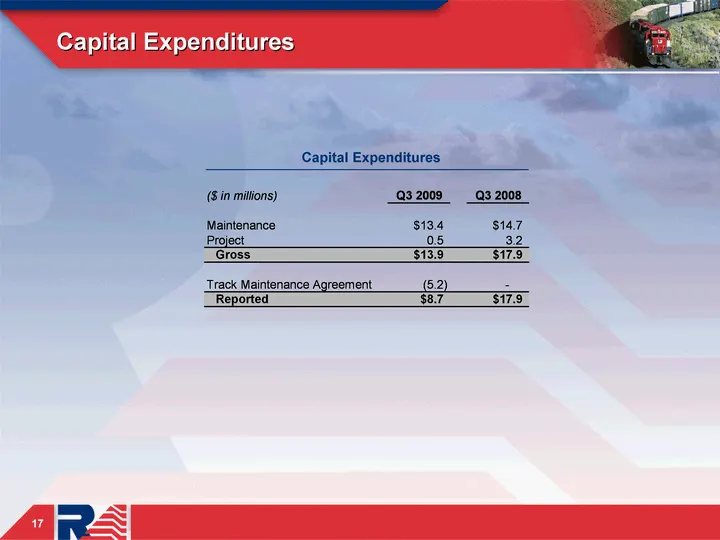
Slide 17: Capital Expenditures
17 Capital Expenditures 17 Capital Expenditures
Slide 18: Capitalization
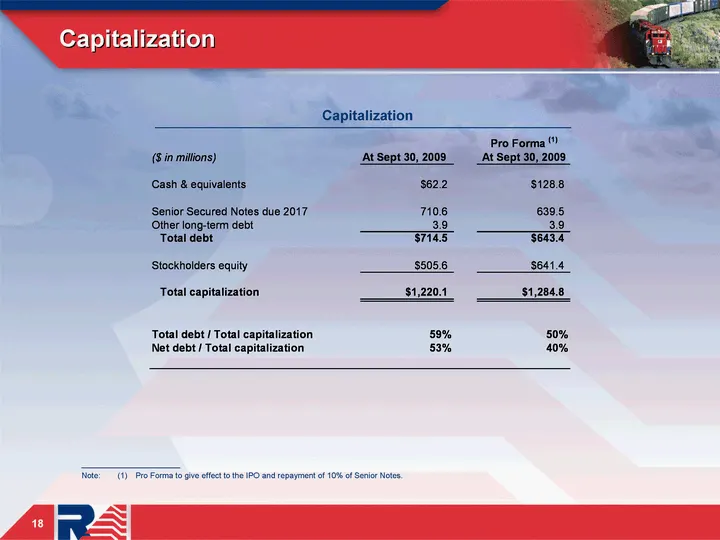
Capitalization 18 ______________________ Note: (1) Pro Forma to give effect to the IPO and repayment of 10% of Senior Notes. Capitalization
Slide 19: Other Financial Items Estimates
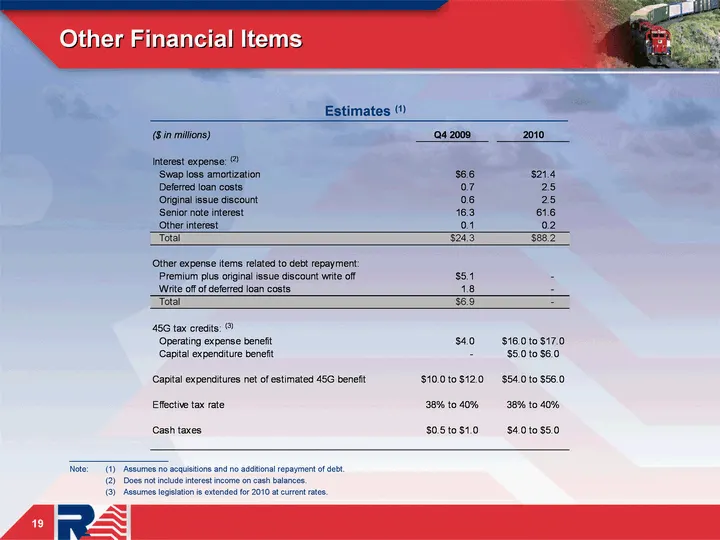
Other Financial Items 19 Estimates (1) ______________________ Note: (1) Assumes no acquisitions and no additional repayment of debt. (2) Does not include interest income on cash balances. (3) Assumes legislation is extended for 2010 at current rates.

Slide 20: Appendix
20 Appendix
Slide 21: Adjusted EBITDA Reconciliation to GAAP
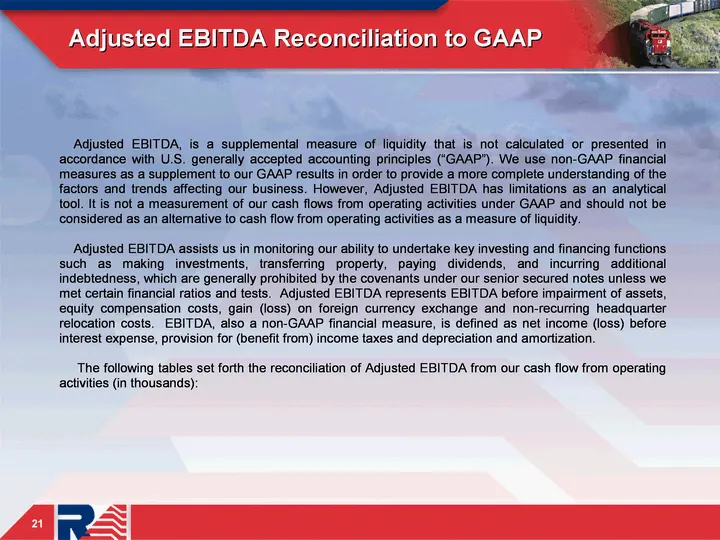
21 Adjusted EBITDA Reconciliation to GAAP 21
Slide 22: Adjusted EBITDA Reconciliation to GAAP (Continued)
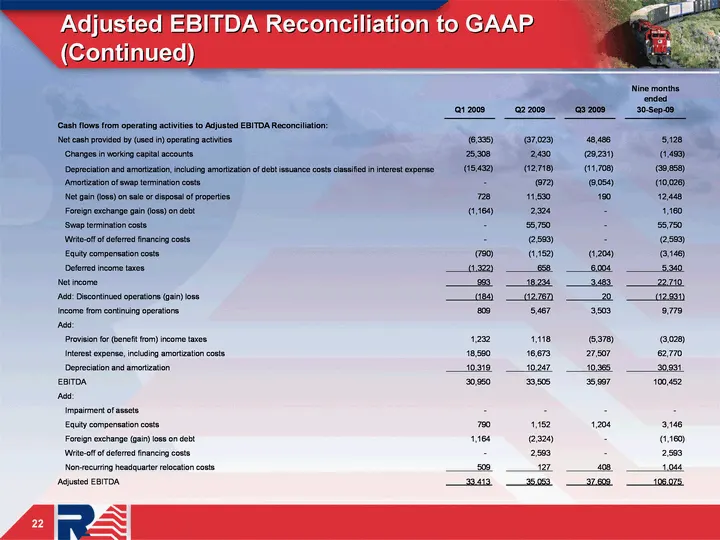
22 Adjusted EBITDA Reconciliation to GAAP (Continued) 22
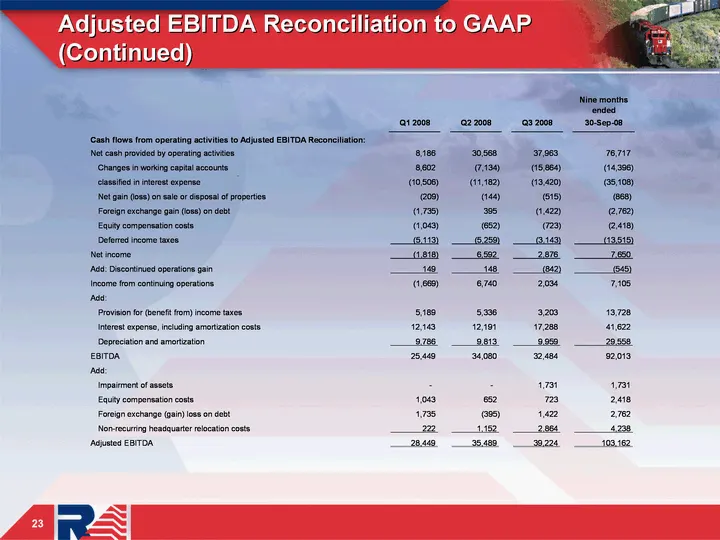
Slide 23: Adjusted EBITDA Reconciliation to GAAP (Continued)
23 Adjusted EBITDA Reconciliation to GAAP (Continued) 23
Source: SEC EDGAR · 8-K filed Nov 12, 2009
More decks from Railamerica Inc
 Q2 2012 Earnings Presentation25 slides · Jul 25, 2012
 Q1 2012 Earnings Presentation29 slides · Apr 26, 2012
 Q4 2011 Earnings Presentation33 slides · Feb 9, 2012
 Q3 2011 Earnings Presentation28 slides · Oct 26, 2011
 Q2 2011 Earnings Presentation27 slides · Jul 28, 2011
 Q1 2011 Earnings Presentation28 slides · Apr 28, 2011