Science Group PLC · LSE:SAG
Science — FY2021 Earnings Presentation
20 slides from Science's earnings presentation, Mar 16, 2022
Slide 1: 2021 Preliminary Results
2021 Preliminary Results Martyn Ratcliffe Executive Chair – Dan Edwards Group Managing Director – Jon Brett Finance Director To be read in conjunction with the audited preliminary results announcement released on 16 March 2022 In addition to IFRS measures, alternative performance measures are used i
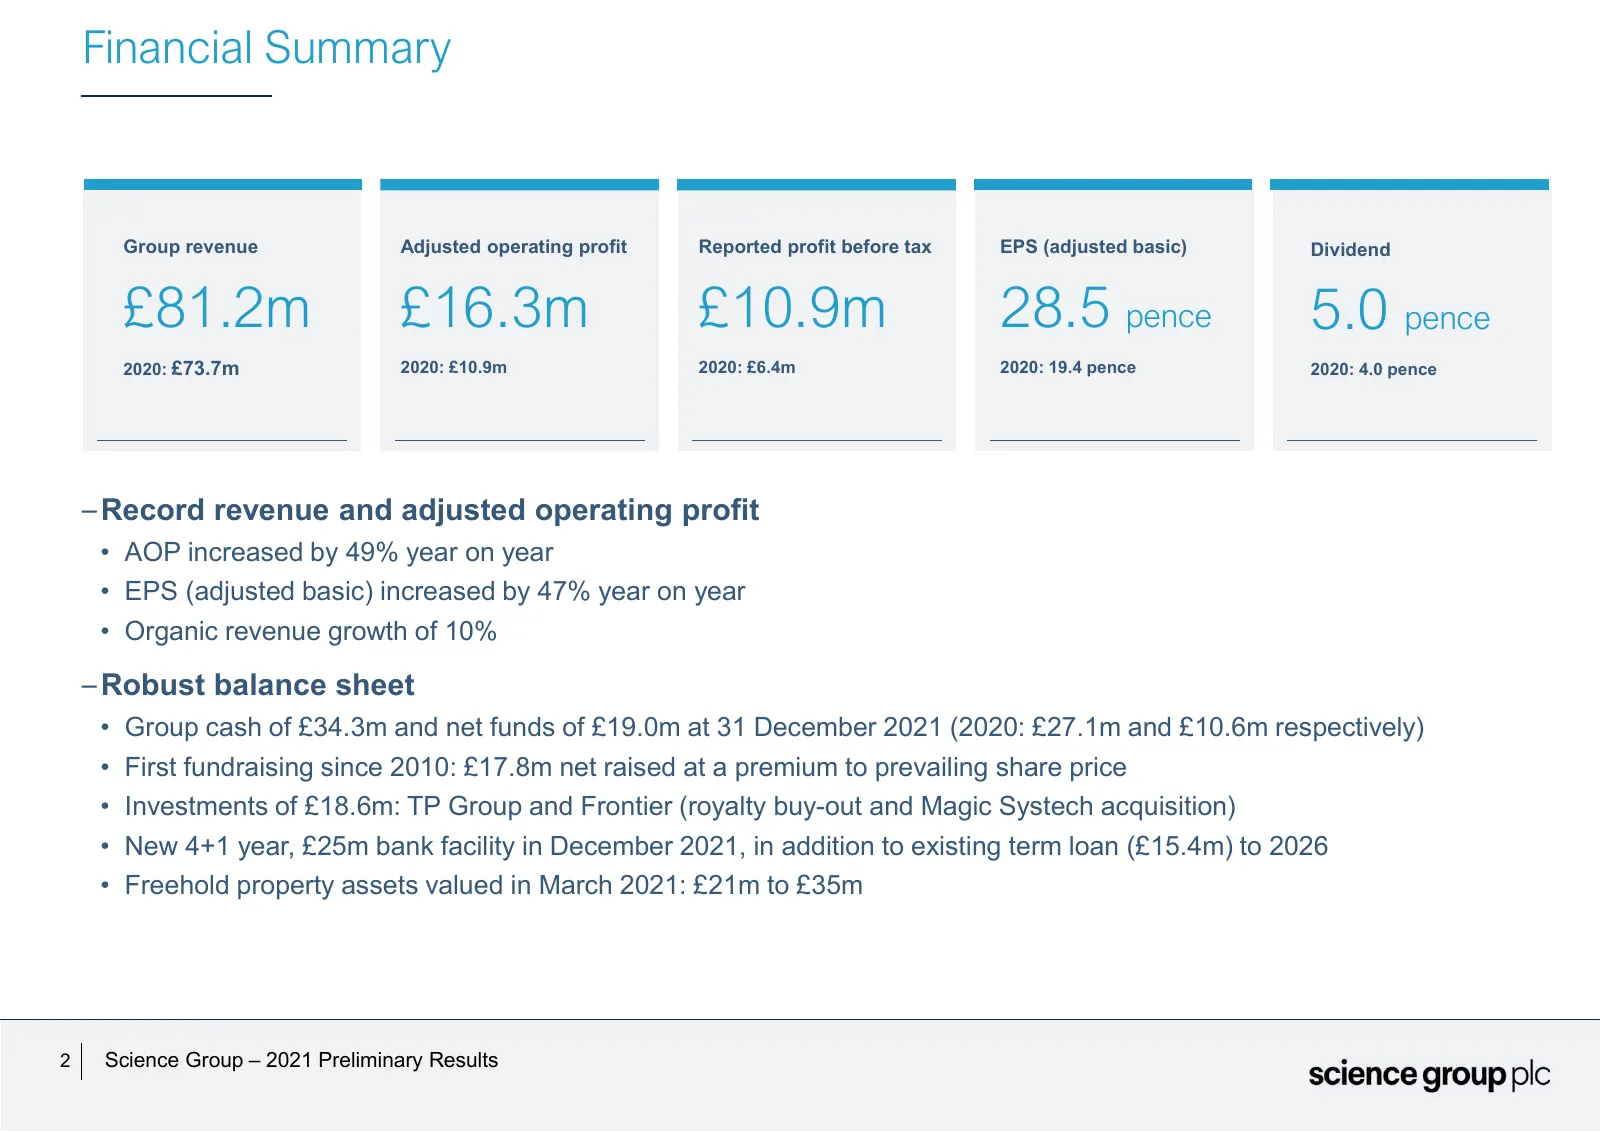
Slide 2: Financial Summary
Financial Summary Group revenue Adjusted operating profit Reported profit before tax EPS (adjusted basic) Dividend £81.2m £16.3m £10.9m 28.5 pence 5.0 pence 2020: £73.7m 2020: £10.9m 2020: £6.4m 2020: 19.4 pence 2020: 4.0 pence – Record revenue and adjusted operating profit • AOP increased by 49% ye
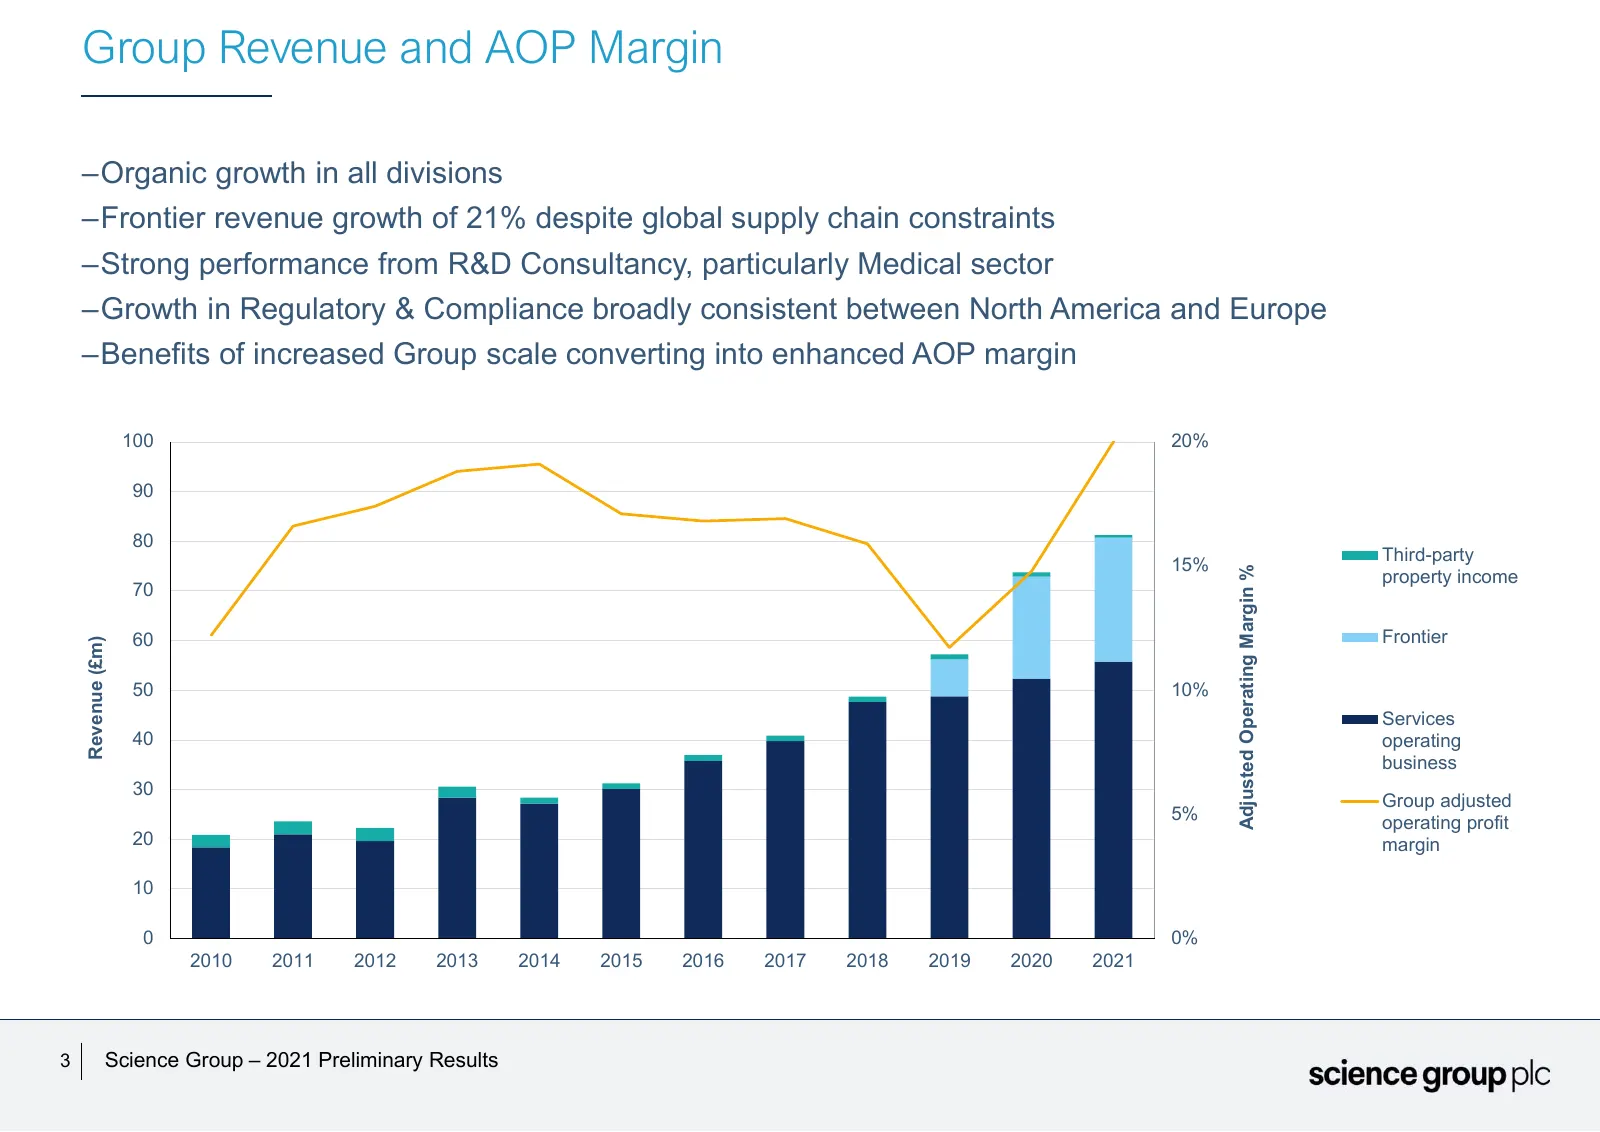
Slide 3: Group Revenue and AOP Margin
Group Revenue and AOP Margin –Organic growth in all divisions –Frontier revenue growth of 21% despite global supply chain constraints –Strong performance from R&D Consultancy, particularly Medical sector –Growth in Regulatory & Compliance broadly consistent between North America and Europe –Benefits
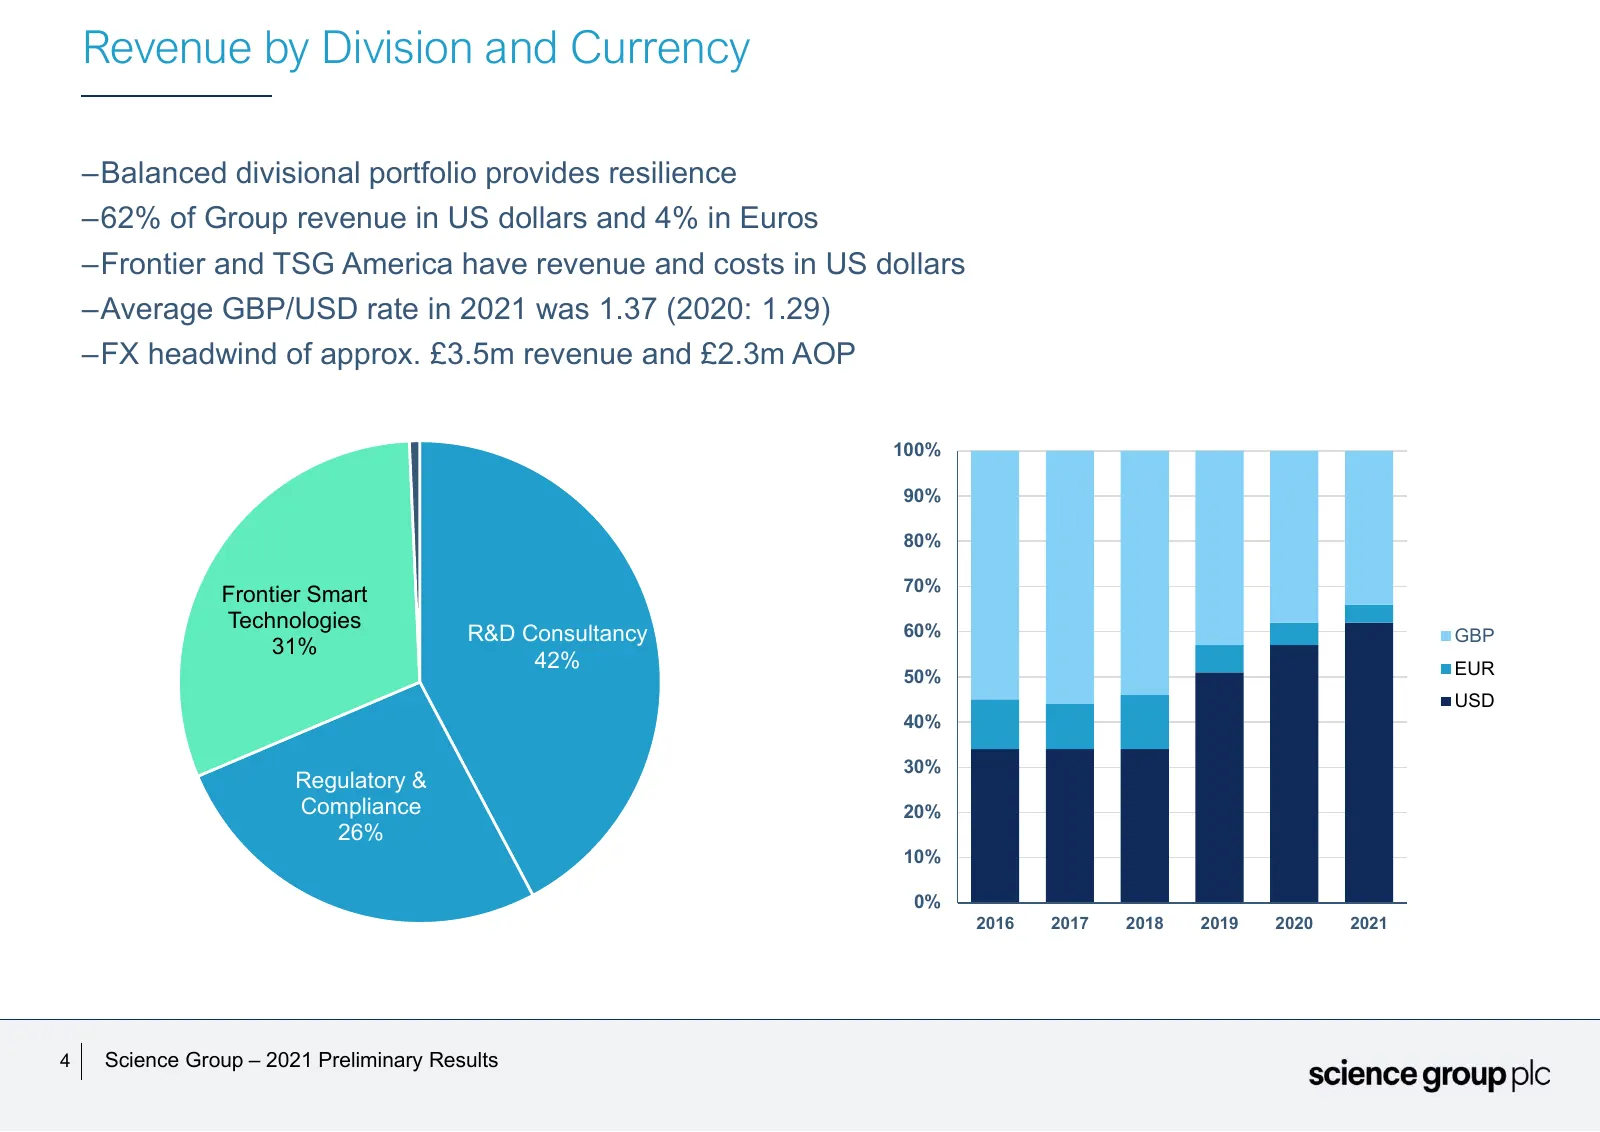
Slide 4: Revenue by Division and Currency
Revenue by Division and Currency –Balanced divisional portfolio provides resilience –62% of Group revenue in US dollars and 4% in Euros –Frontier and TSG America have revenue and costs in US dollars –Average GBP/USD rate in 2021 was 1.37 (2020: 1.29) –FX headwind of approx. £3.5m revenue and £2.3m A
Slide 5: Delivering Shareholder Value
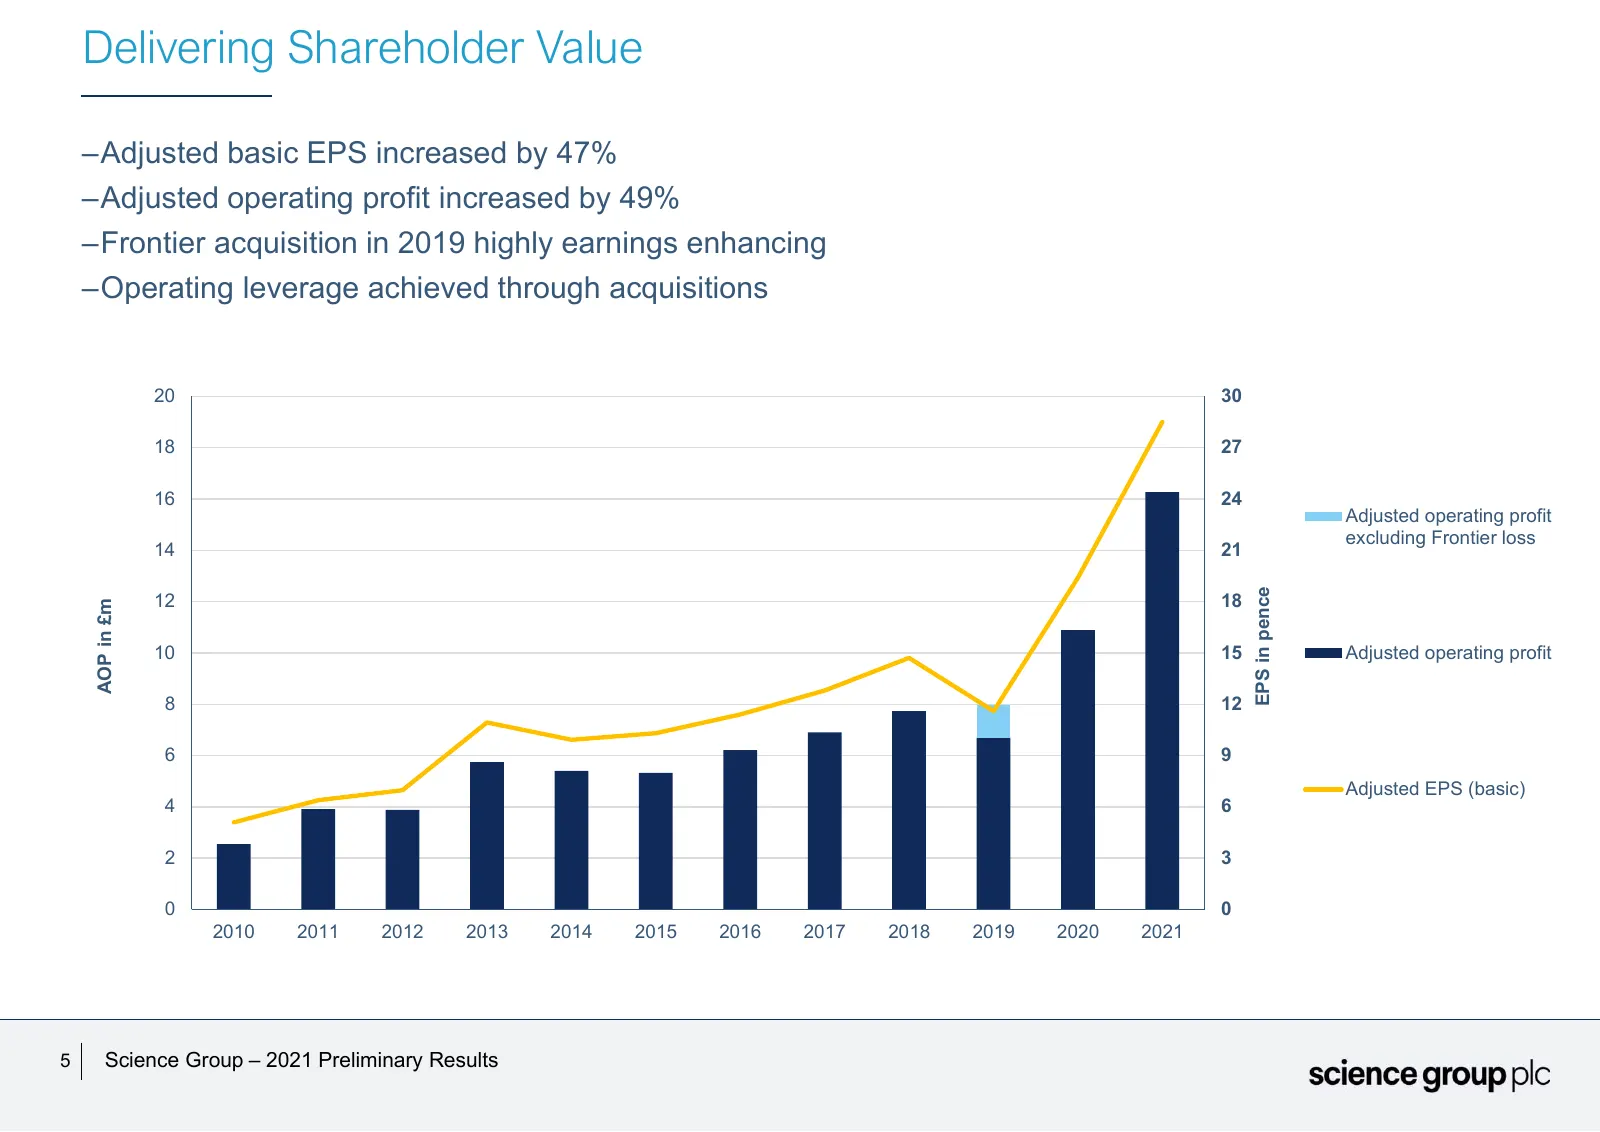
Delivering Shareholder Value –Adjusted basic EPS increased by 47% –Adjusted operating profit increased by 49% –Frontier acquisition in 2019 highly earnings enhancing –Operating leverage achieved through acquisitions 20 30 18 27 16 24 Adjusted operating profit excluding Frontier loss 14 21 EPS in pen
Slide 6: Cash Bridge
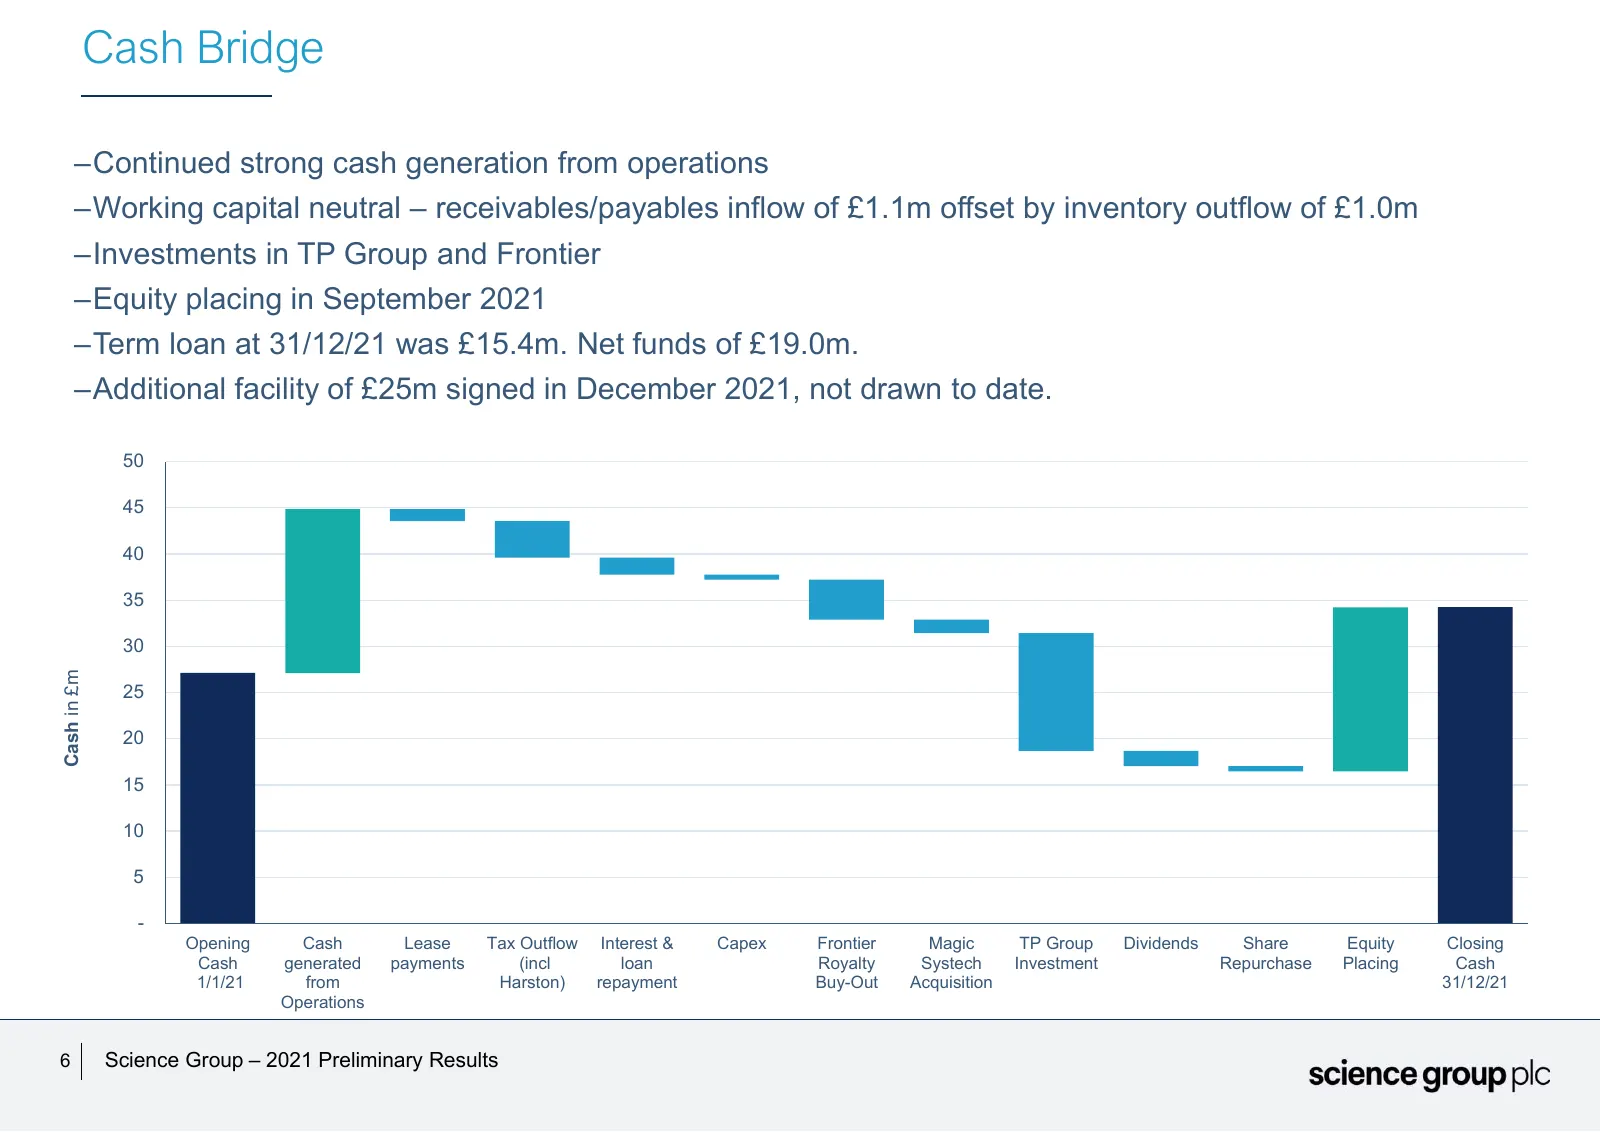
Cash Bridge –Continued strong cash generation from operations –Working capital neutral – receivables/payables inflow of £1.1m offset by inventory outflow of £1.0m –Investments in TP Group and Frontier –Equity placing in September 2021 –Term loan at 31/12/21 was £15.4m. Net funds of £19.0m. –Addition
Slide 7: Group Overview
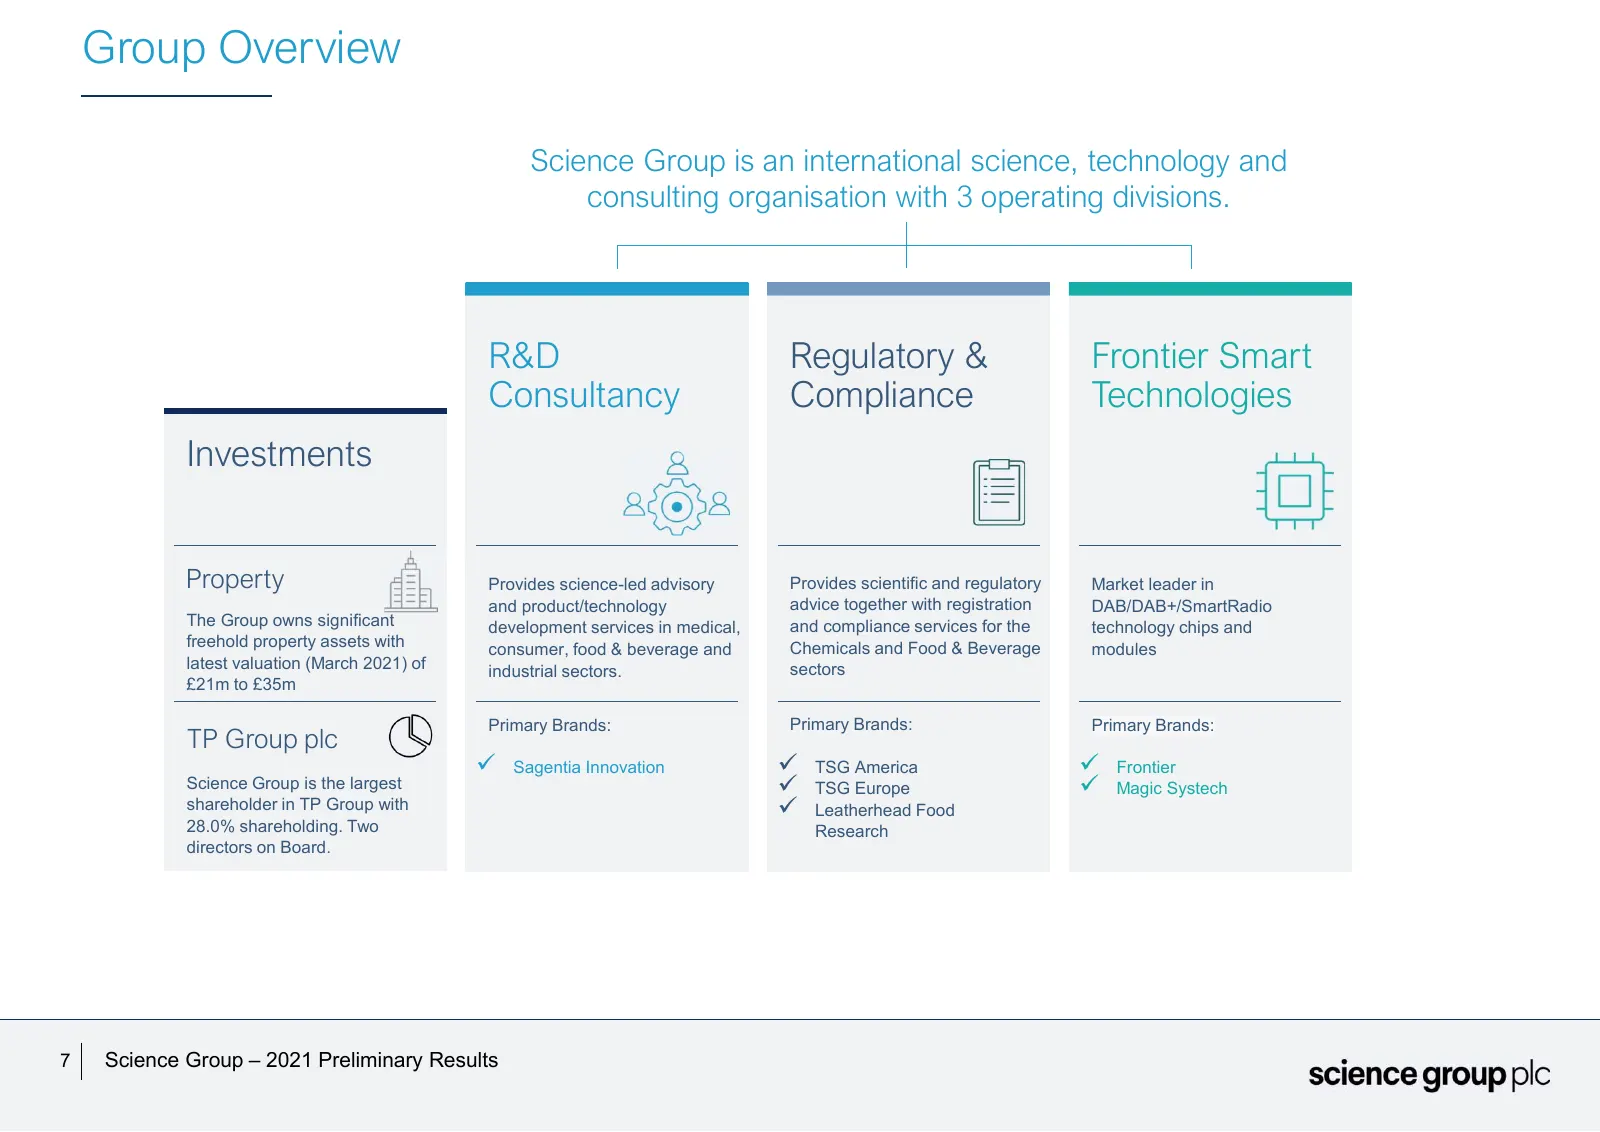
Group Overview Science Group is an international science, technology and consulting organisation with 3 operating divisions. R&D Regulatory & Frontier Smart Consultancy Compliance Technologies Investments Property Provides science-led advisory Provides scientific and regulatory Market leader in and
Slide 8: R&D Consultancy
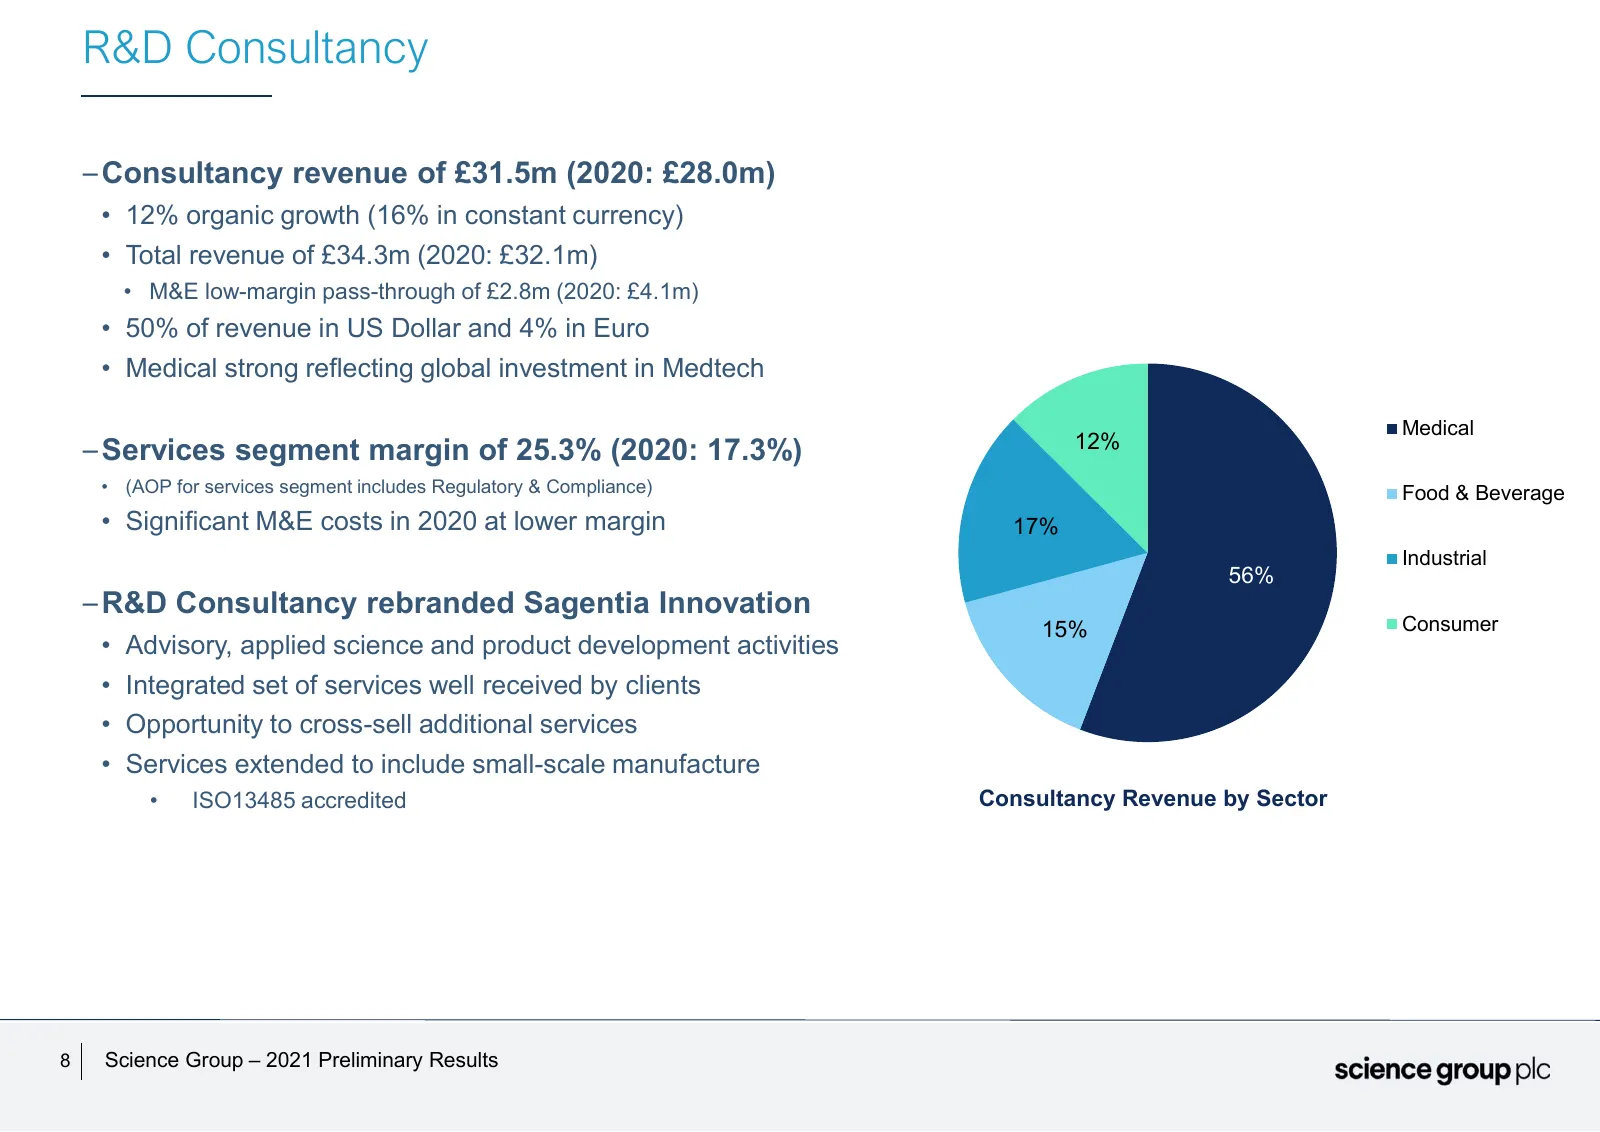
R&D Consultancy – Consultancy revenue of £31.5m (2020: £28.0m) • 12% organic growth (16% in constant currency) • Total revenue of £34.3m (2020: £32.1m) • M&E low-margin pass-through of £2.8m (2020: £4.1m) • 50% of revenue in US Dollar and 4% in Euro • Medical strong reflecting global investment in M
Slide 9: Regulatory & Compliance
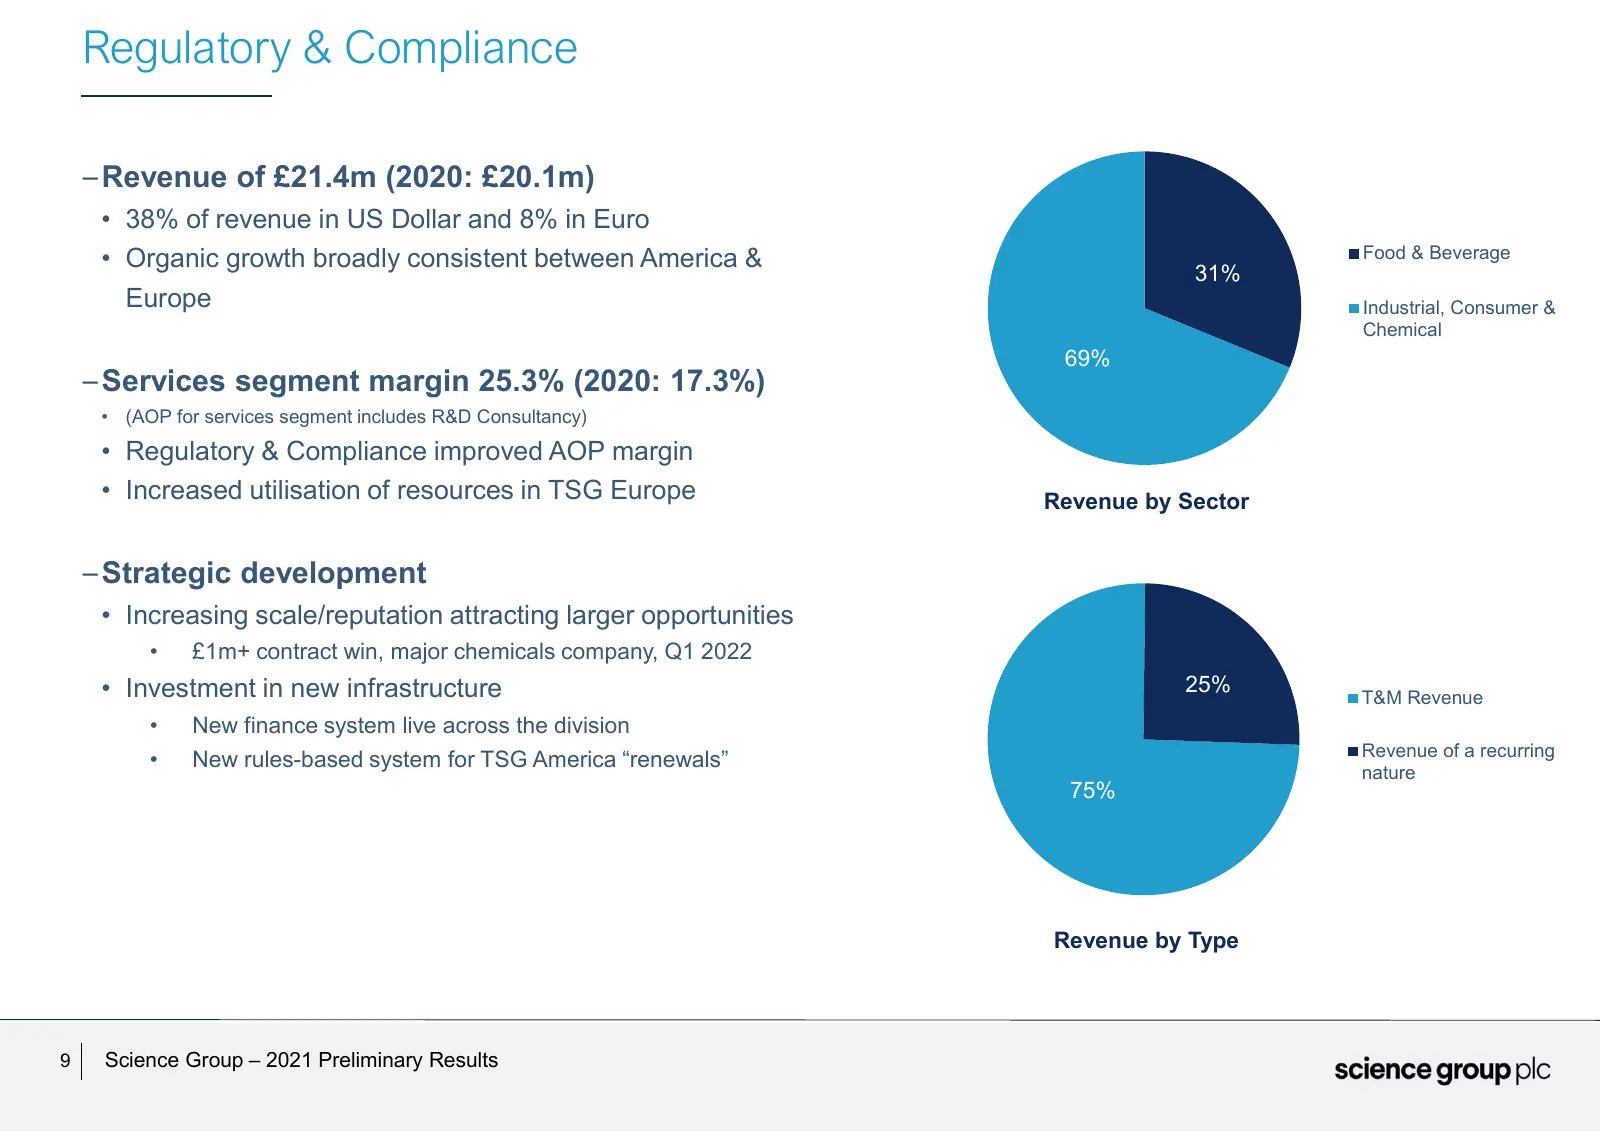
Regulatory & Compliance – Revenue of £21.4m (2020: £20.1m) • 38% of revenue in US Dollar and 8% in Euro • Organic growth broadly consistent between America & Food & Beverage 31% Europe Industrial, Consumer & Chemical 69% – Services segment margin 25.3% (2020: 17.3%) • (AOP for services segment inclu
Slide 10: Frontier Smart Technologies
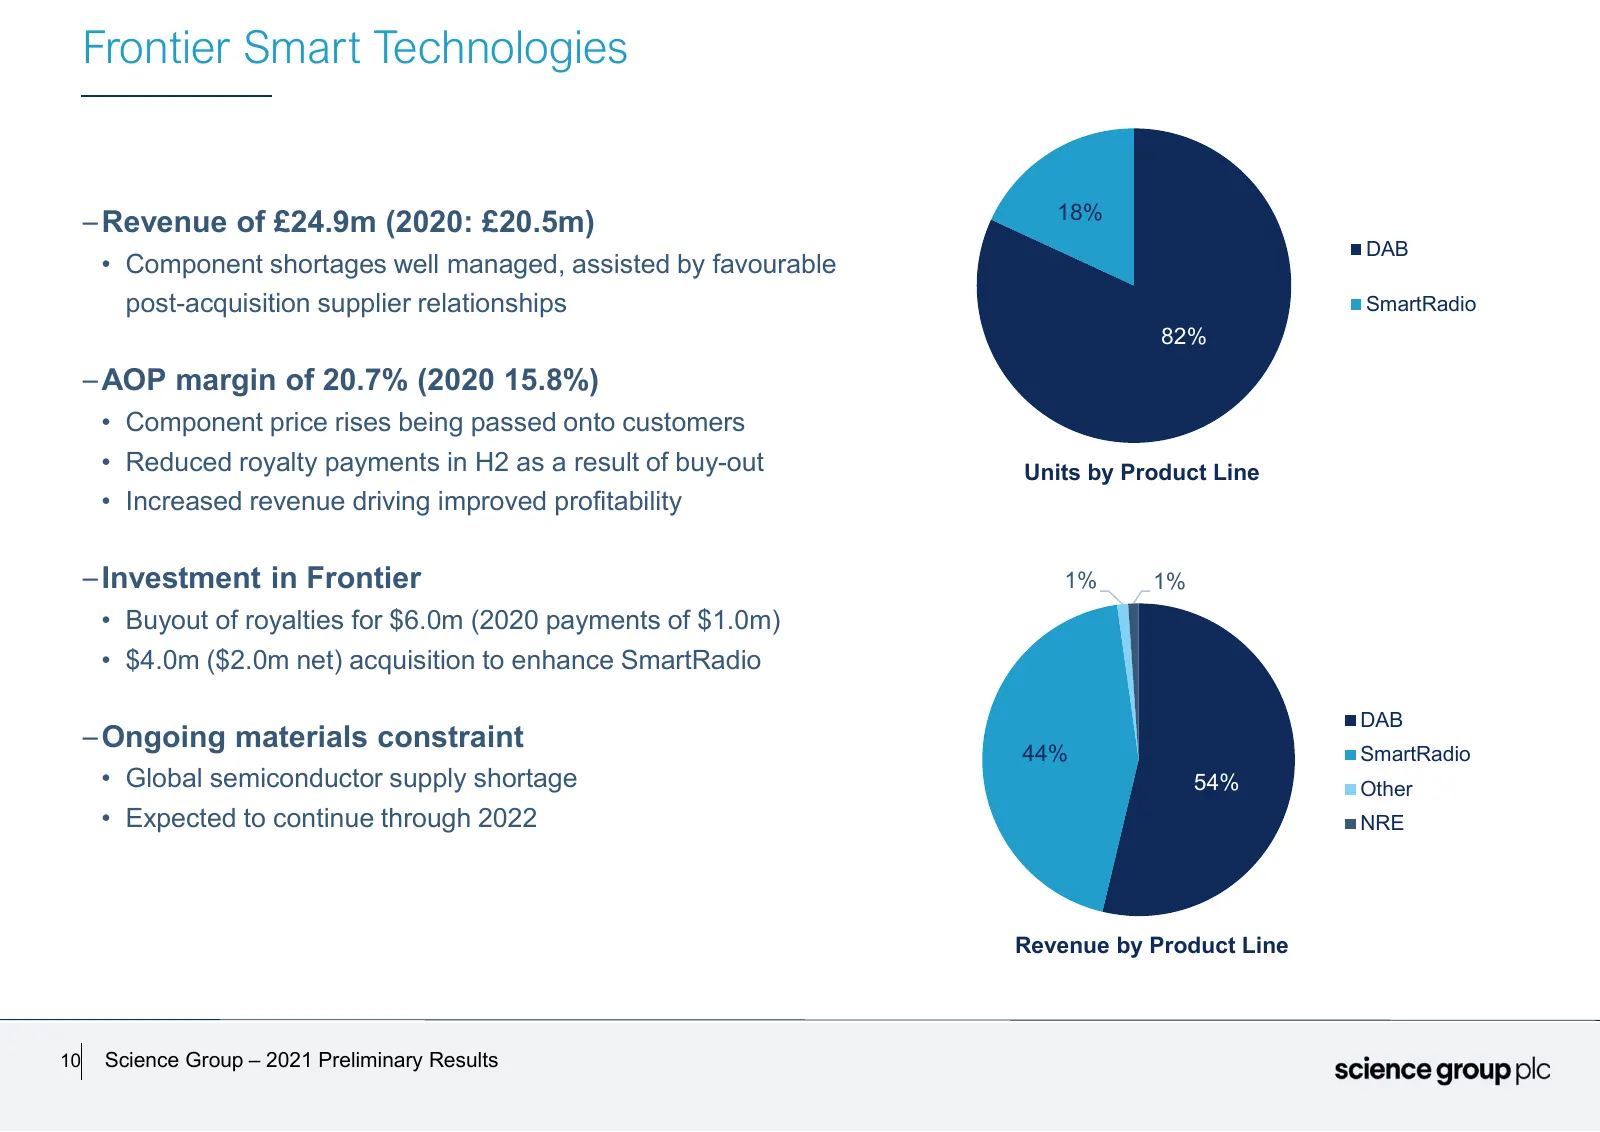
Frontier Smart Technologies – Revenue of £24.9m (2020: £20.5m) 18% DAB • Component shortages well managed, assisted by favourable post-acquisition supplier relationships SmartRadio 82% – AOP margin of 20.7% (2020 15.8%) • Component price rises being passed onto customers • Reduced royalty payments i
Slide 11: Corporate
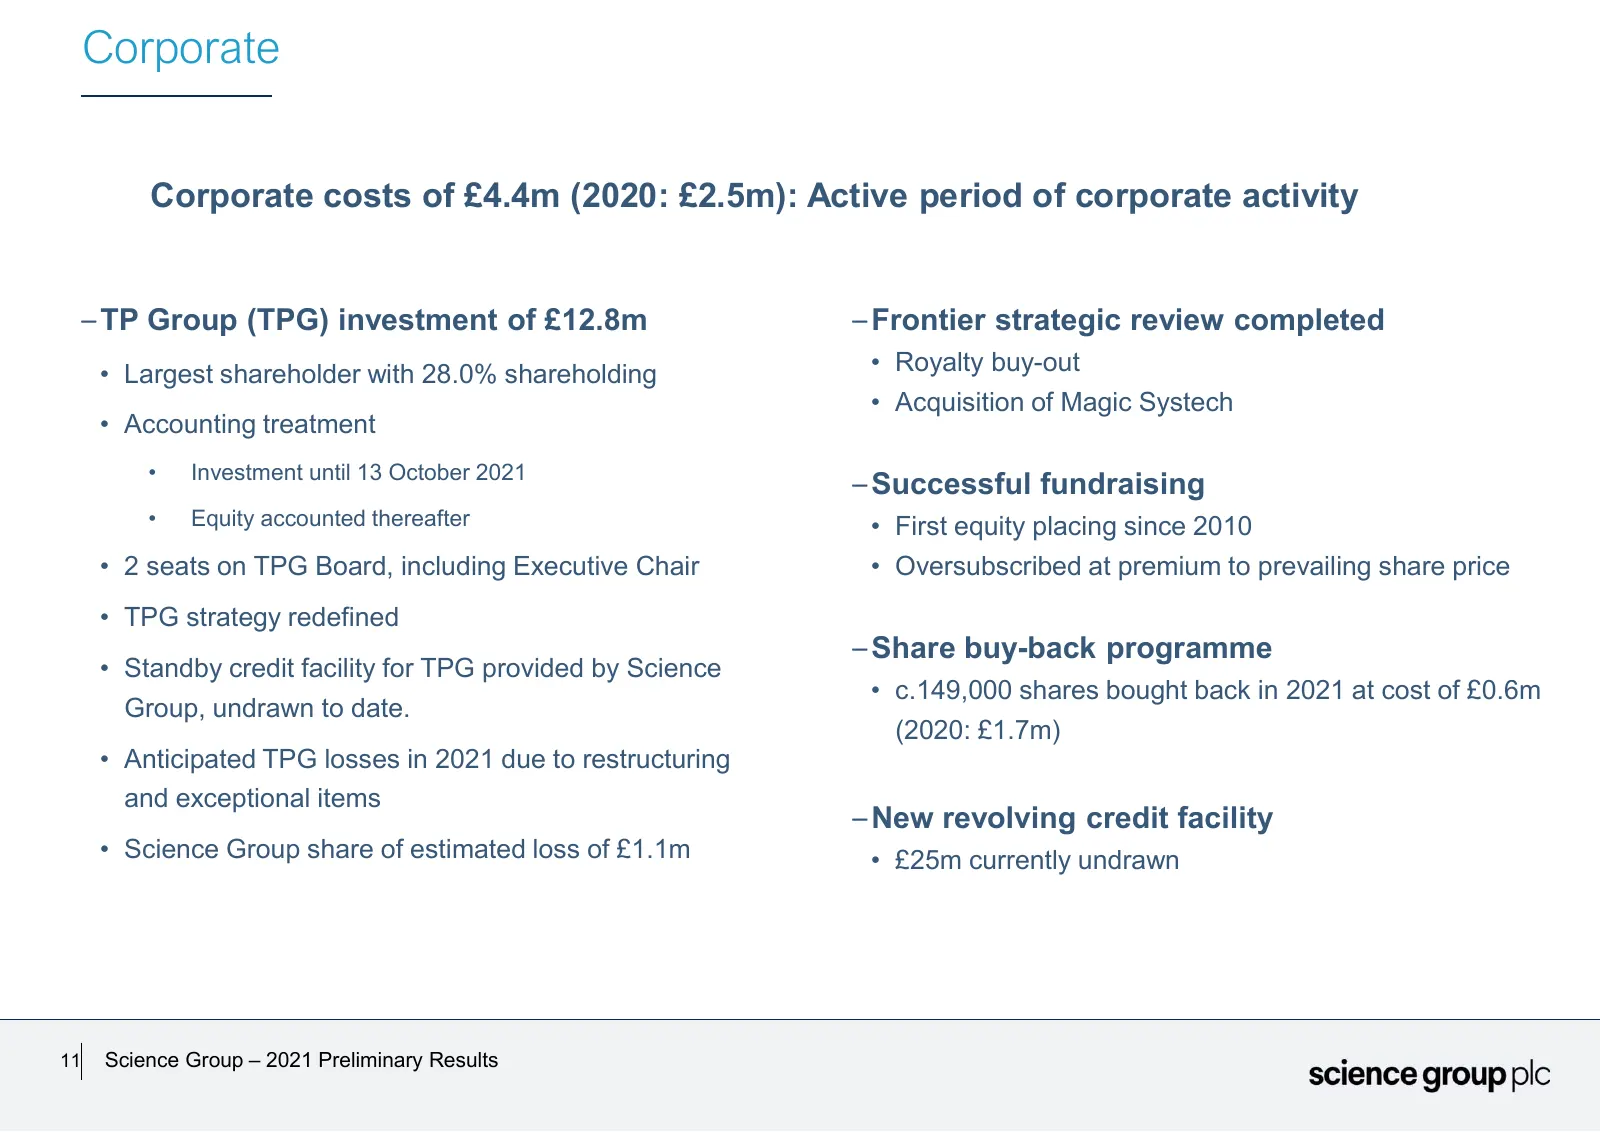
Corporate Corporate costs of £4.4m (2020: £2.5m): Active period of corporate activity – TP Group (TPG) investment of £12.8m – Frontier strategic review completed • Largest shareholder with 28.0% shareholding • Royalty buy-out • Acquisition of Magic Systech • Accounting treatment • Investment until 1
Slide 12: ESG
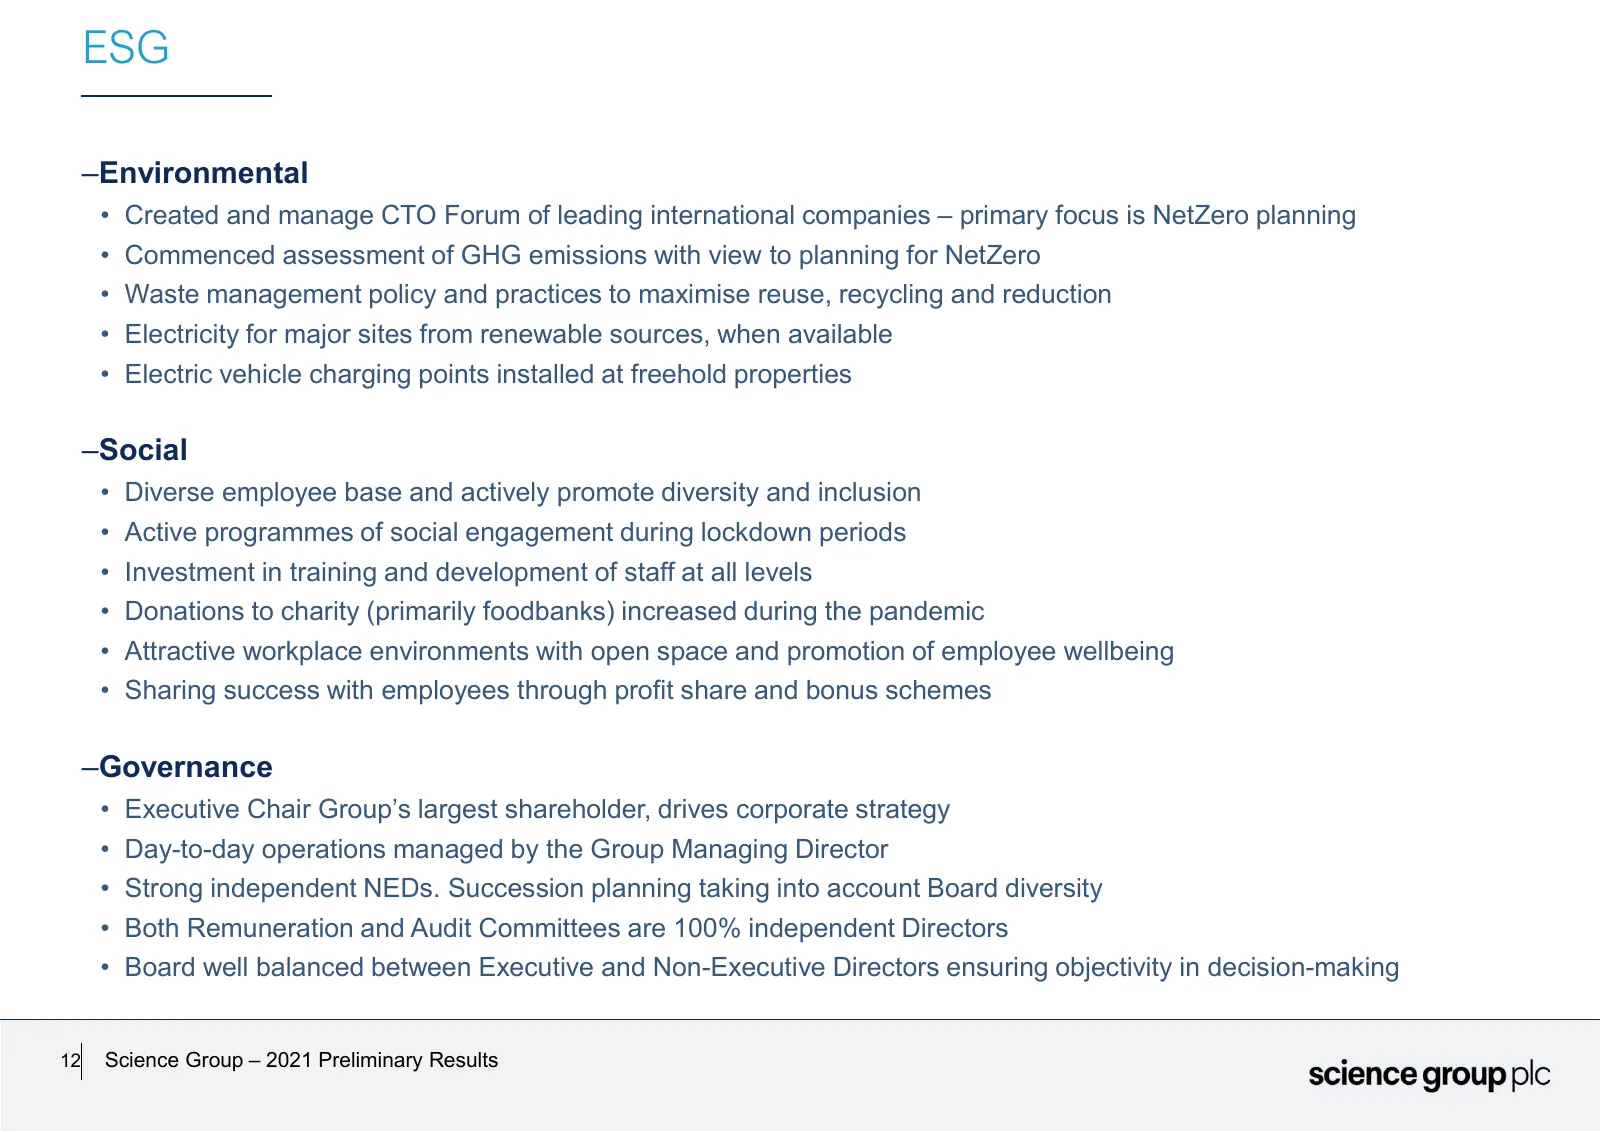
ESG –Environmental • Created and manage CTO Forum of leading international companies – primary focus is NetZero planning • Commenced assessment of GHG emissions with view to planning for NetZero • Waste management policy and practices to maximise reuse, recycling and reduction • Electricity for majo
Slide 13: People
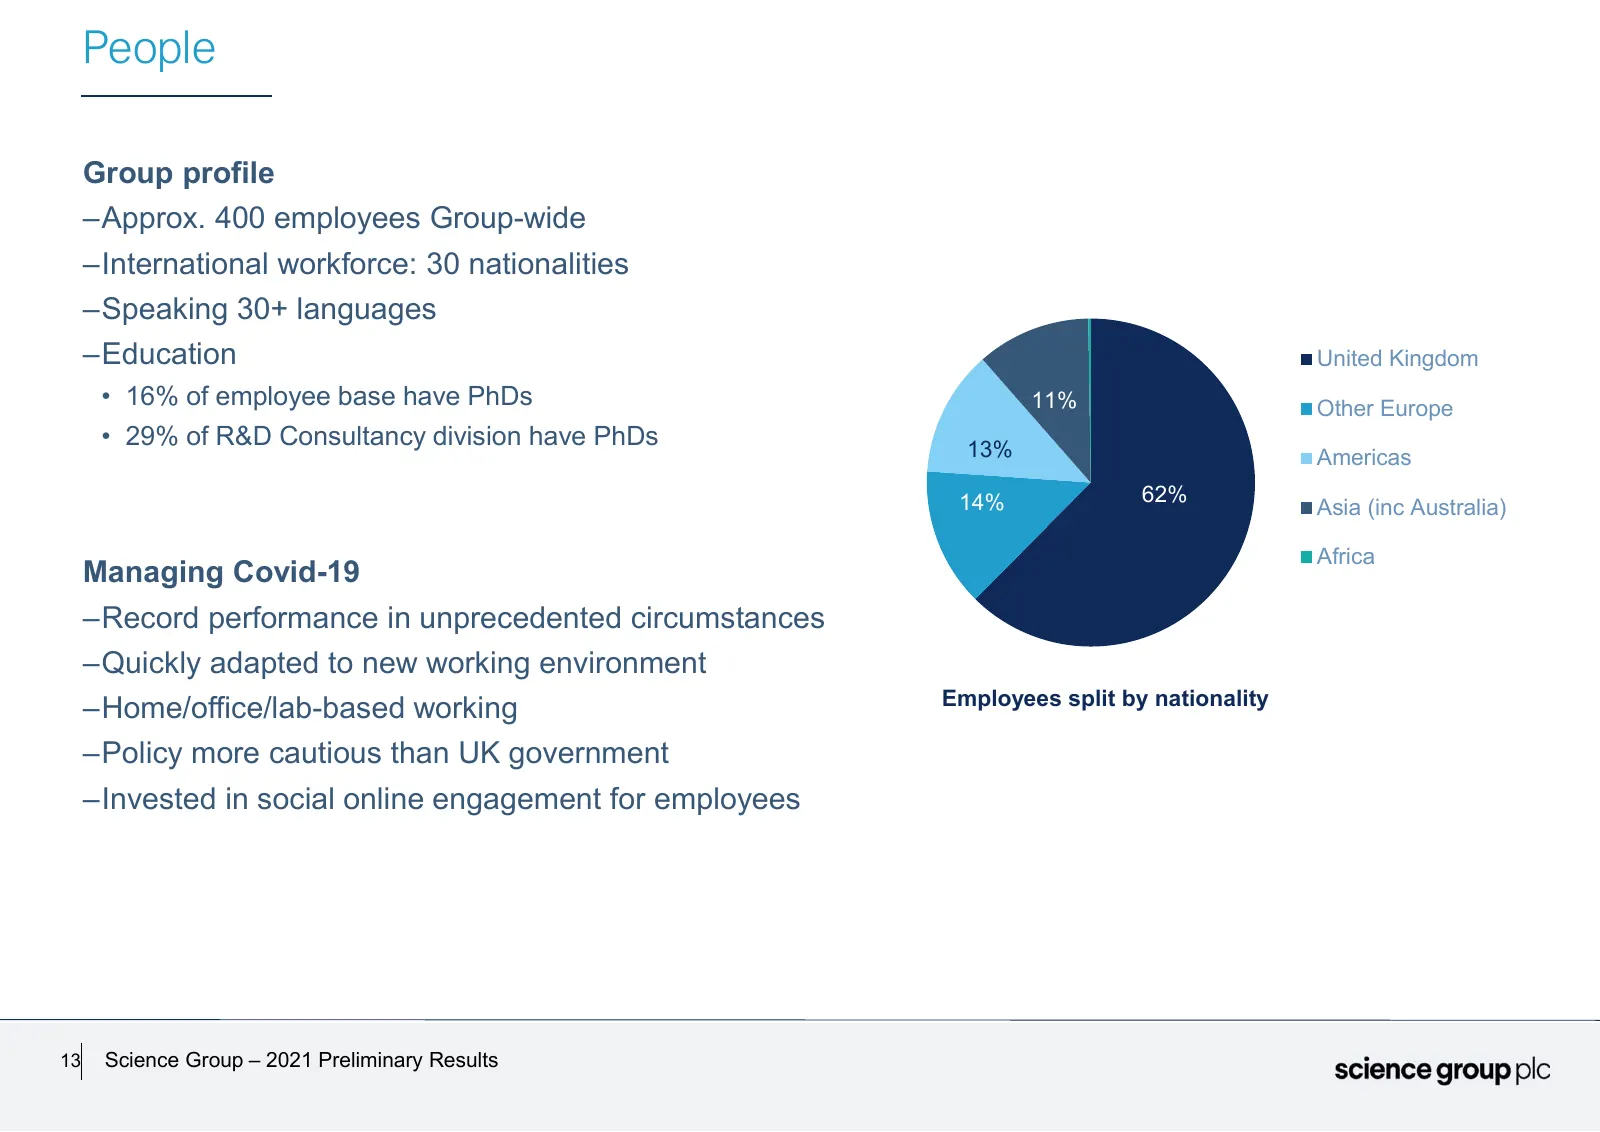
People Group profile –Approx. 400 employees Group-wide –International workforce: 30 nationalities –Speaking 30+ languages –Education United Kingdom • 16% of employee base have PhDs 11% Other Europe • 29% of R&D Consultancy division have PhDs 13% Americas 14% 62% Asia (inc Australia) Africa Managing
Slide 14: Freehold Properties
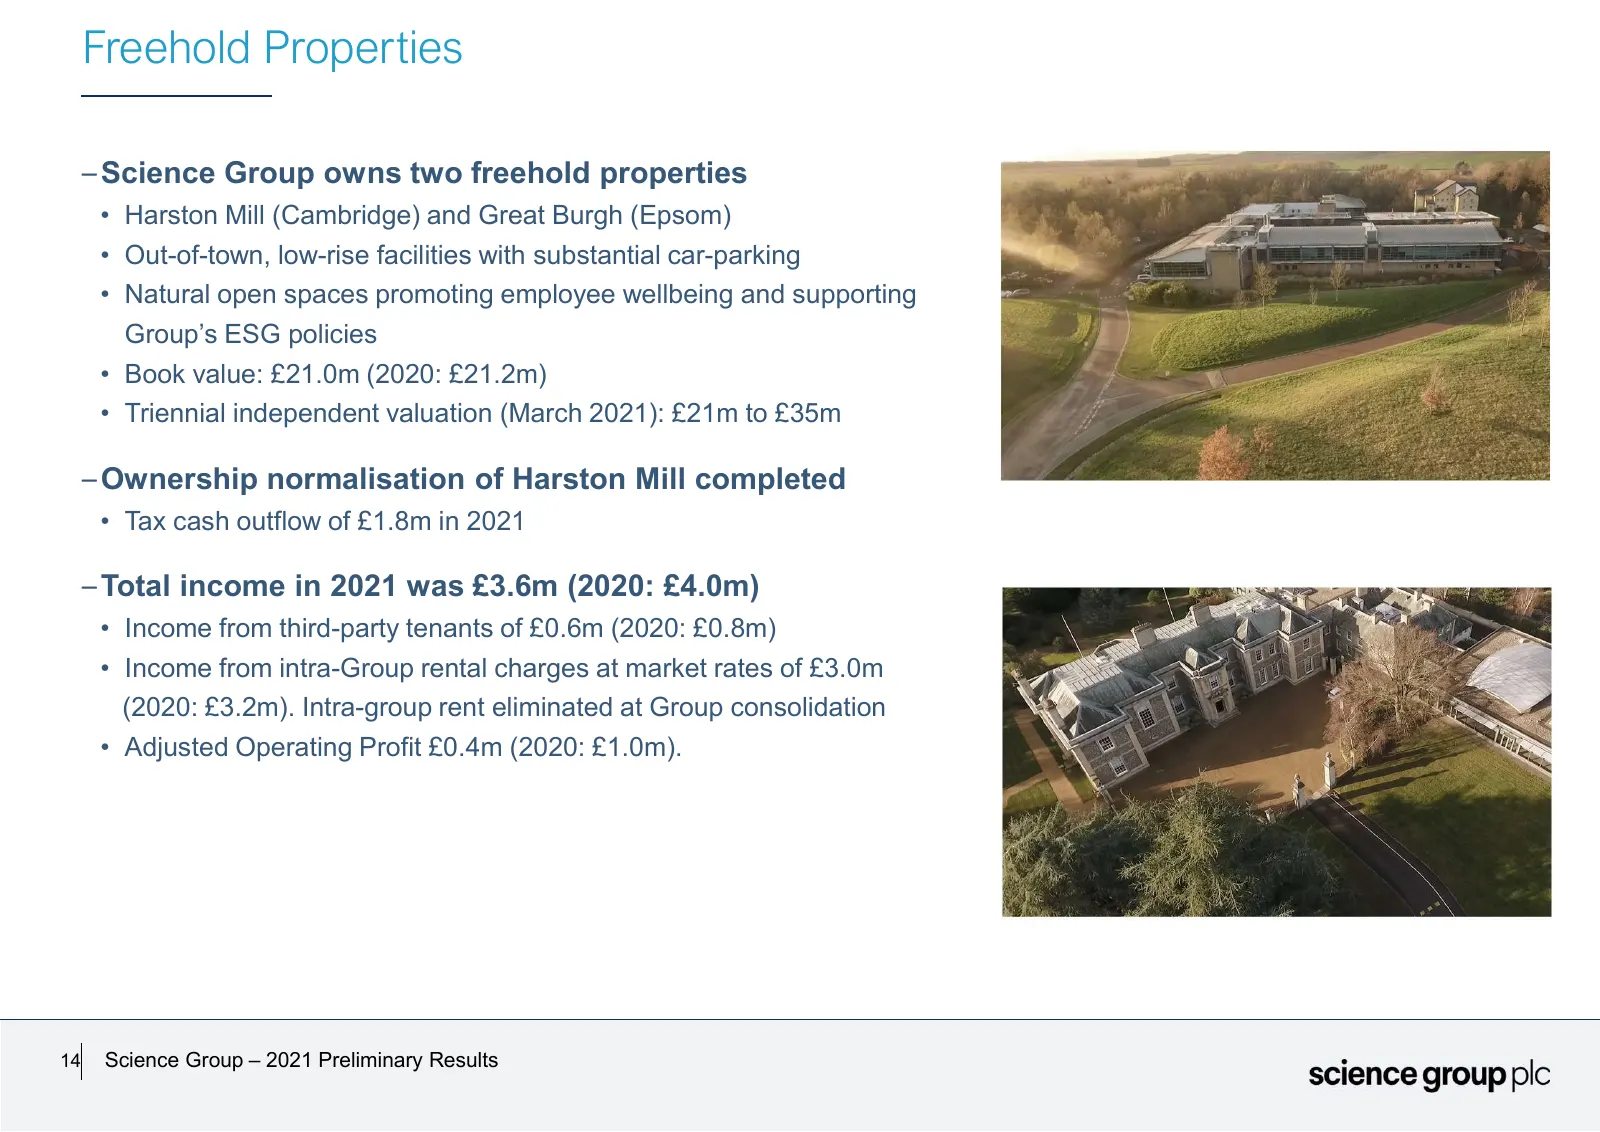
Freehold Properties – Science Group owns two freehold properties • Harston Mill (Cambridge) and Great Burgh (Epsom) • Out-of-town, low-rise facilities with substantial car-parking • Natural open spaces promoting employee wellbeing and supporting Group’s ESG policies • Book value: £21.0m (2020: £21.2
Slide 15: Corporation Tax
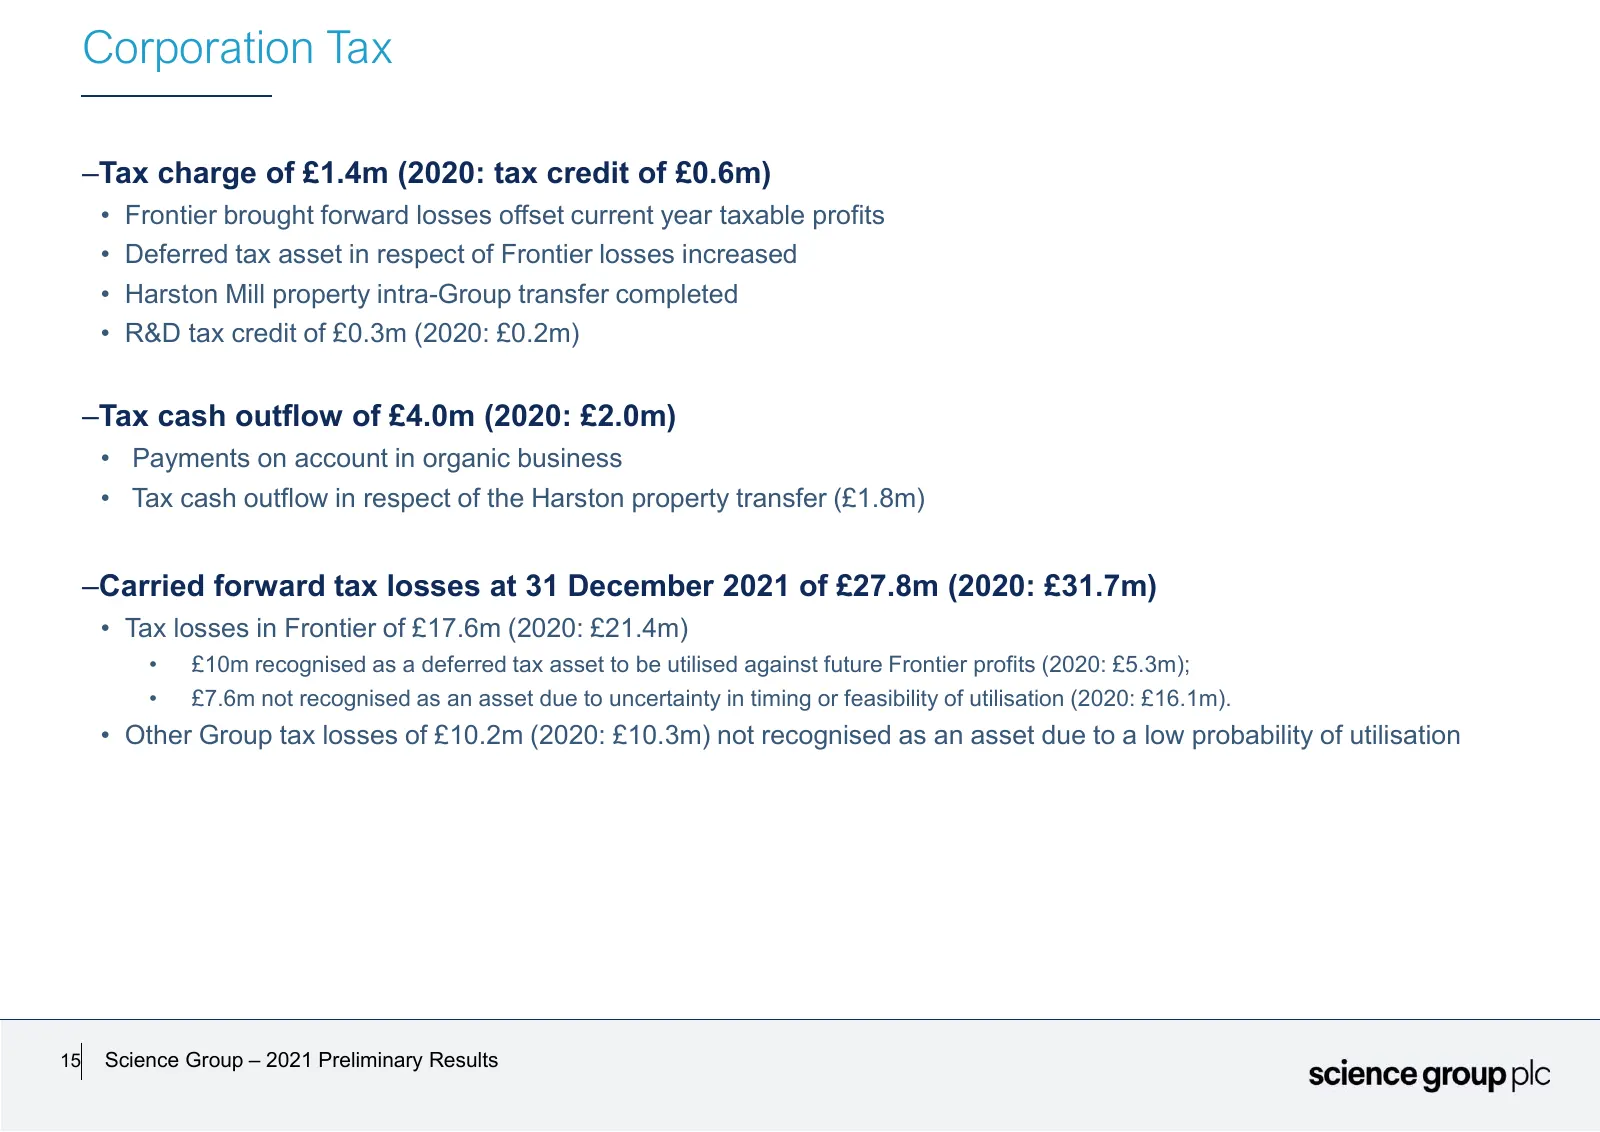
Corporation Tax –Tax charge of £1.4m (2020: tax credit of £0.6m) • Frontier brought forward losses offset current year taxable profits • Deferred tax asset in respect of Frontier losses increased • Harston Mill property intra-Group transfer completed • R&D tax credit of £0.3m (2020: £0.2m) –Tax cash
Slide 16: Appendix: Annual Review of Capital Sources & Allocation
Appendix Annual Review of Capital Sources & Allocation 16
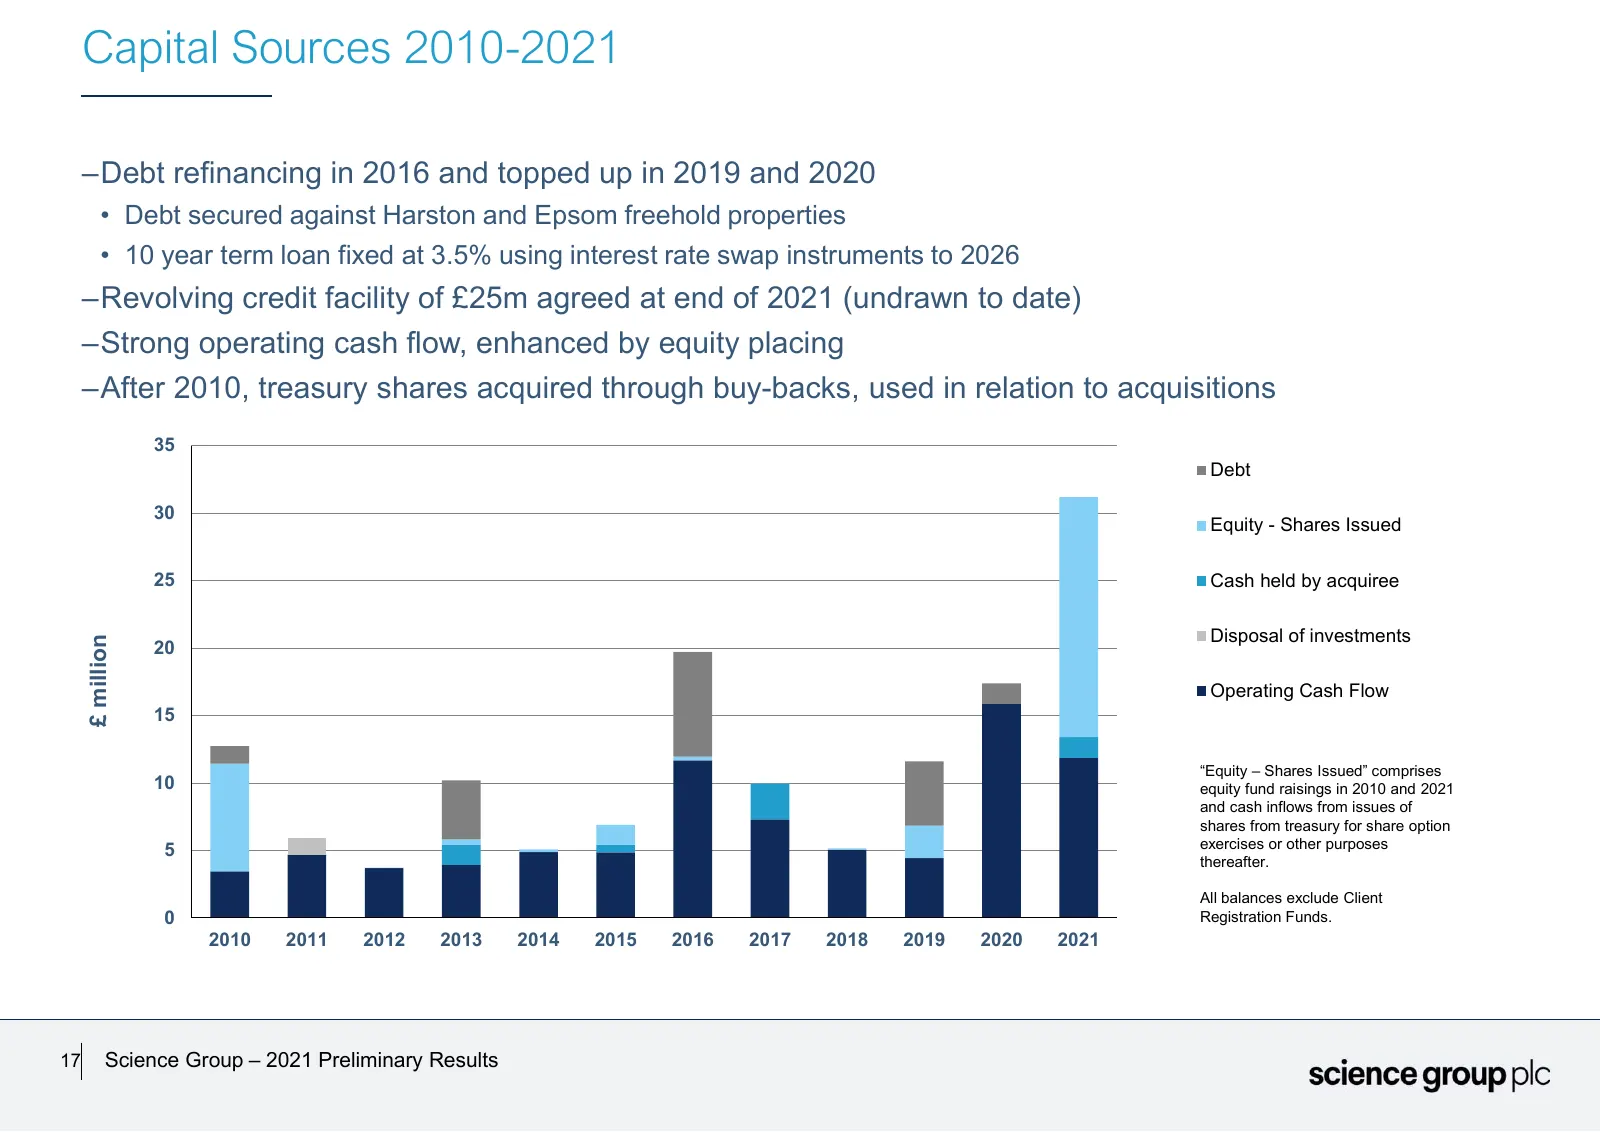
Slide 17: Capital Sources 2010-2021
Capital Sources 2010-2021 –Debt refinancing in 2016 and topped up in 2019 and 2020 • Debt secured against Harston and Epsom freehold properties • 10 year term loan fixed at 3.5% using interest rate swap instruments to 2026 –Revolving credit facility of £25m agreed at end of 2021 (undrawn to date) –S
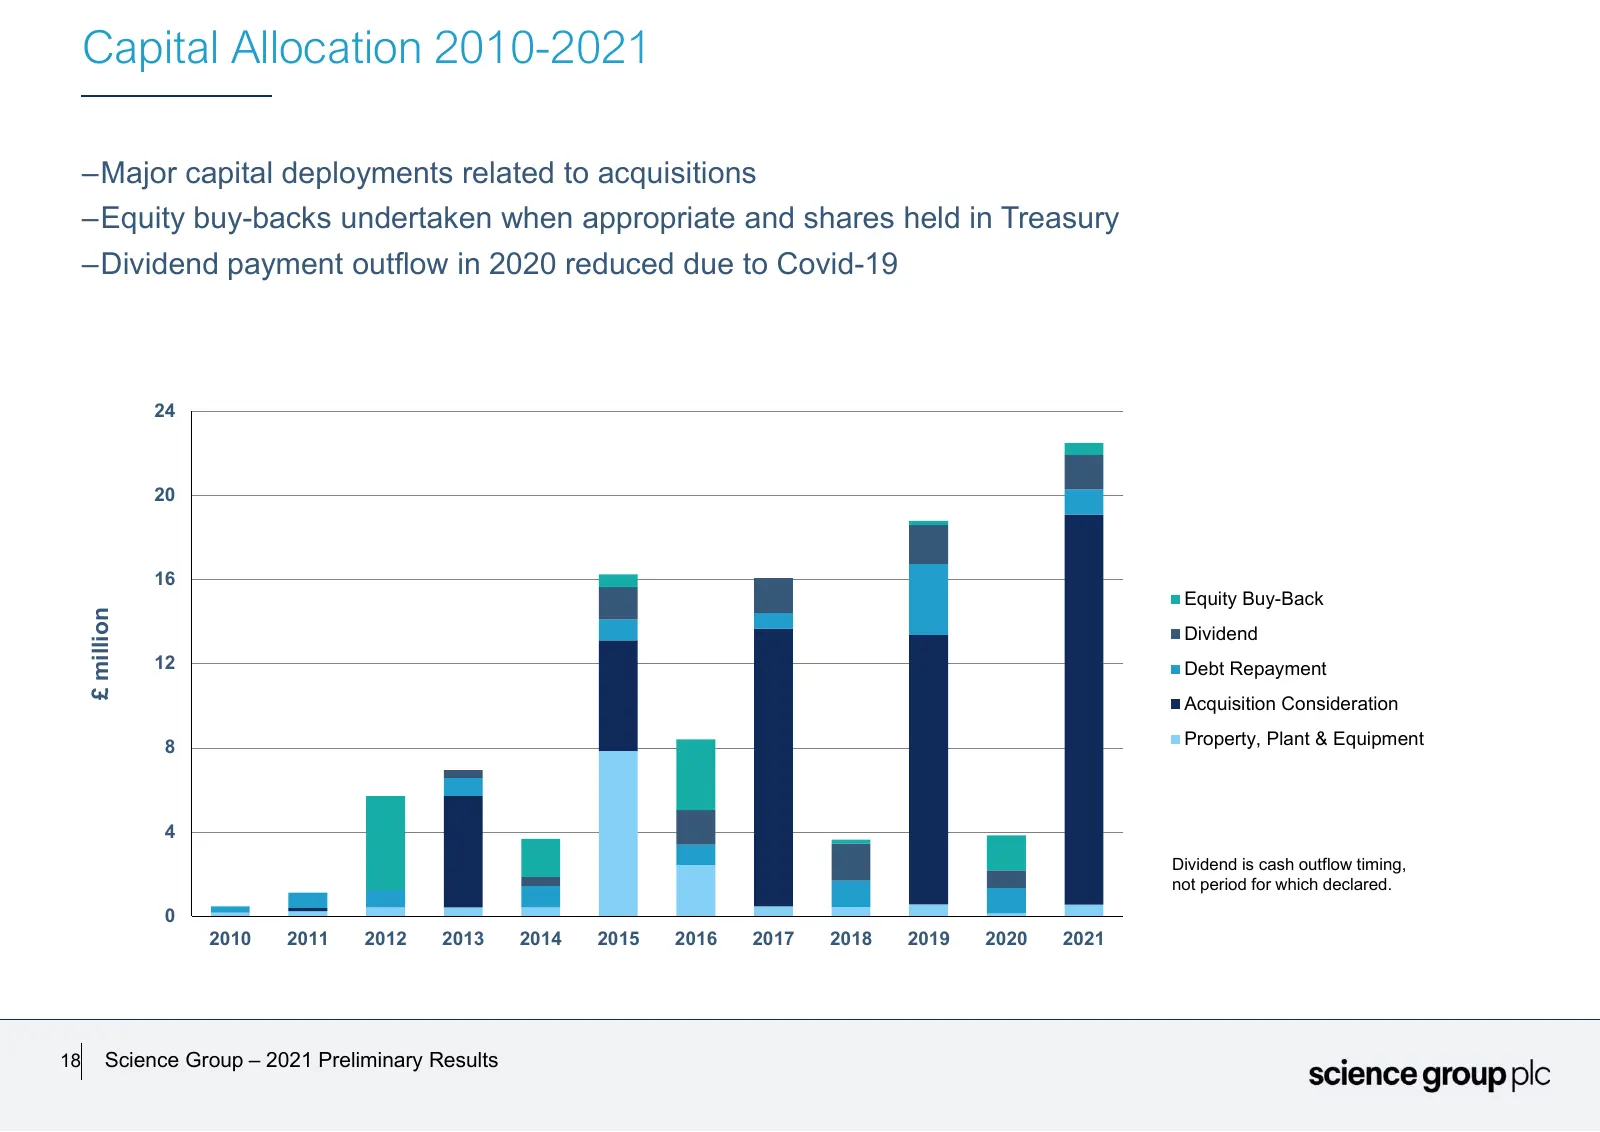
Slide 18: Capital Allocation 2010-2021
Capital Allocation 2010-2021 –Major capital deployments related to acquisitions –Equity buy-backs undertaken when appropriate and shares held in Treasury –Dividend payment outflow in 2020 reduced due to Covid-19 24 20 16 Equity Buy-Back £ million Dividend 12 Debt Repayment Acquisition Consideration
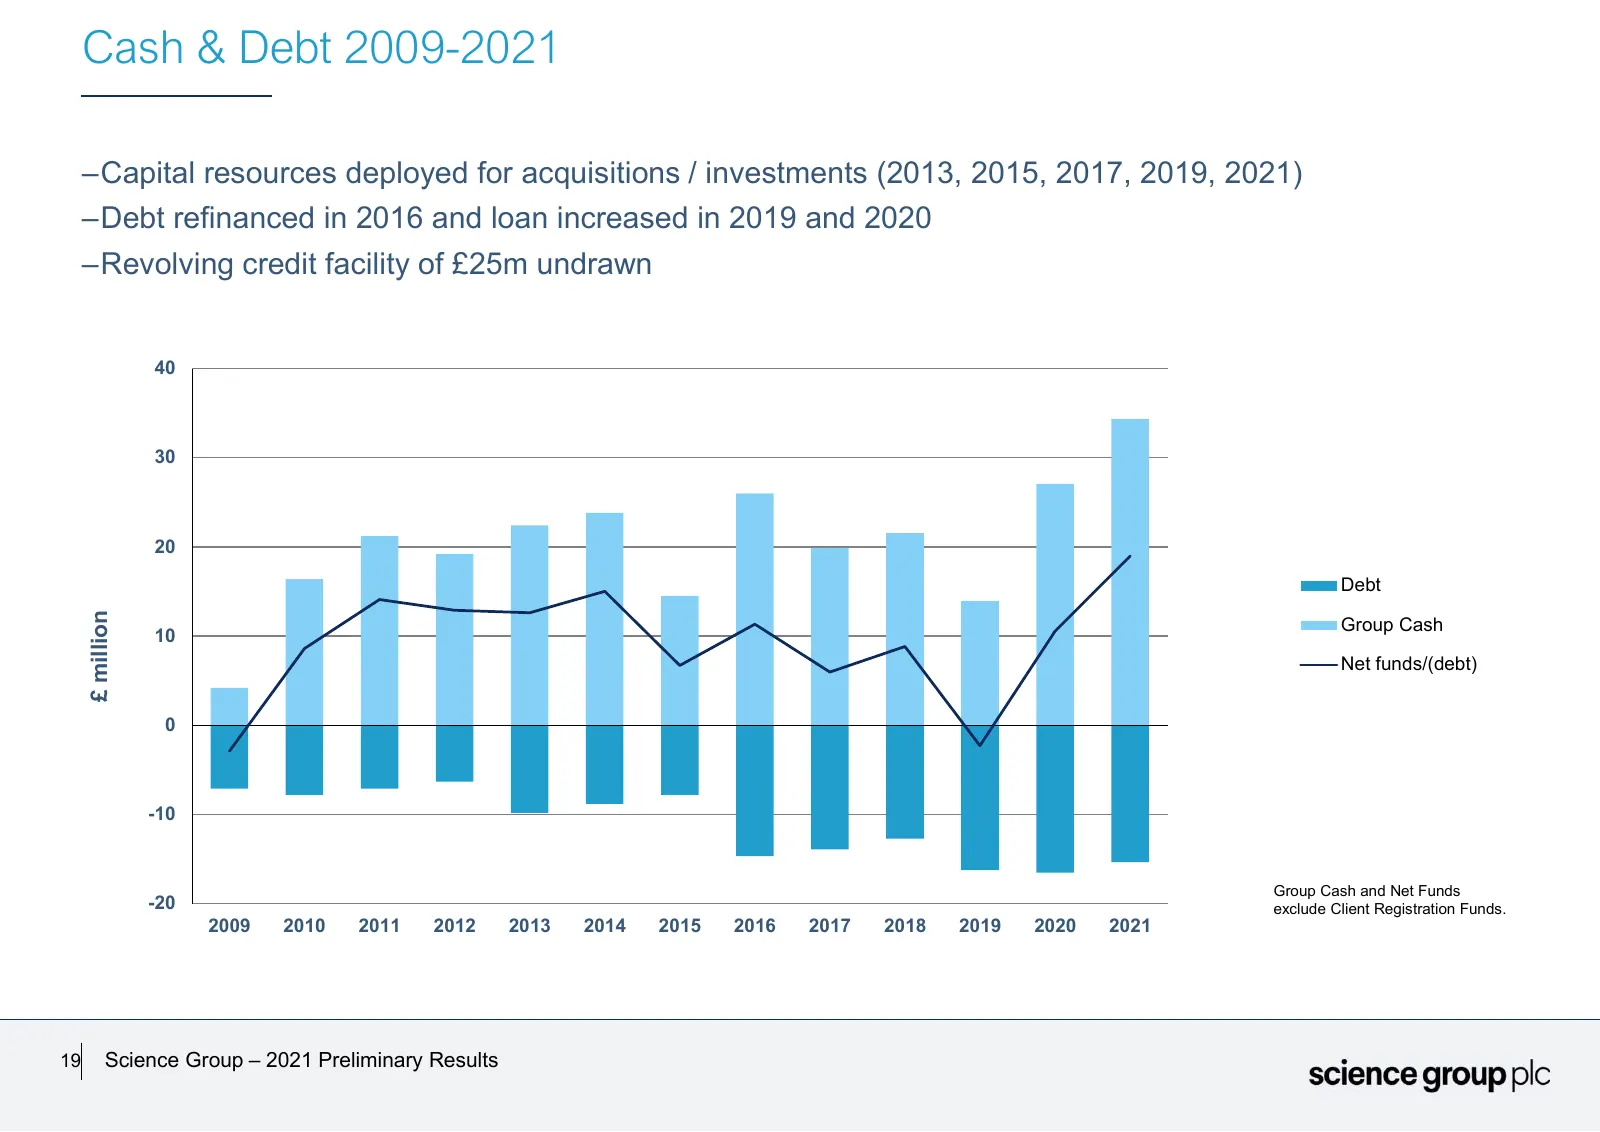
Slide 19: Cash & Debt 2009-2021
Cash & Debt 2009-2021 –Capital resources deployed for acquisitions / investments (2013, 2015, 2017, 2019, 2021) –Debt refinanced in 2016 and loan increased in 2019 and 2020 –Revolving credit facility of £25m undrawn 40 30 20 Debt £ million Group Cash 10 Net funds/(debt) 0 -10 Group Cash and Net Fund
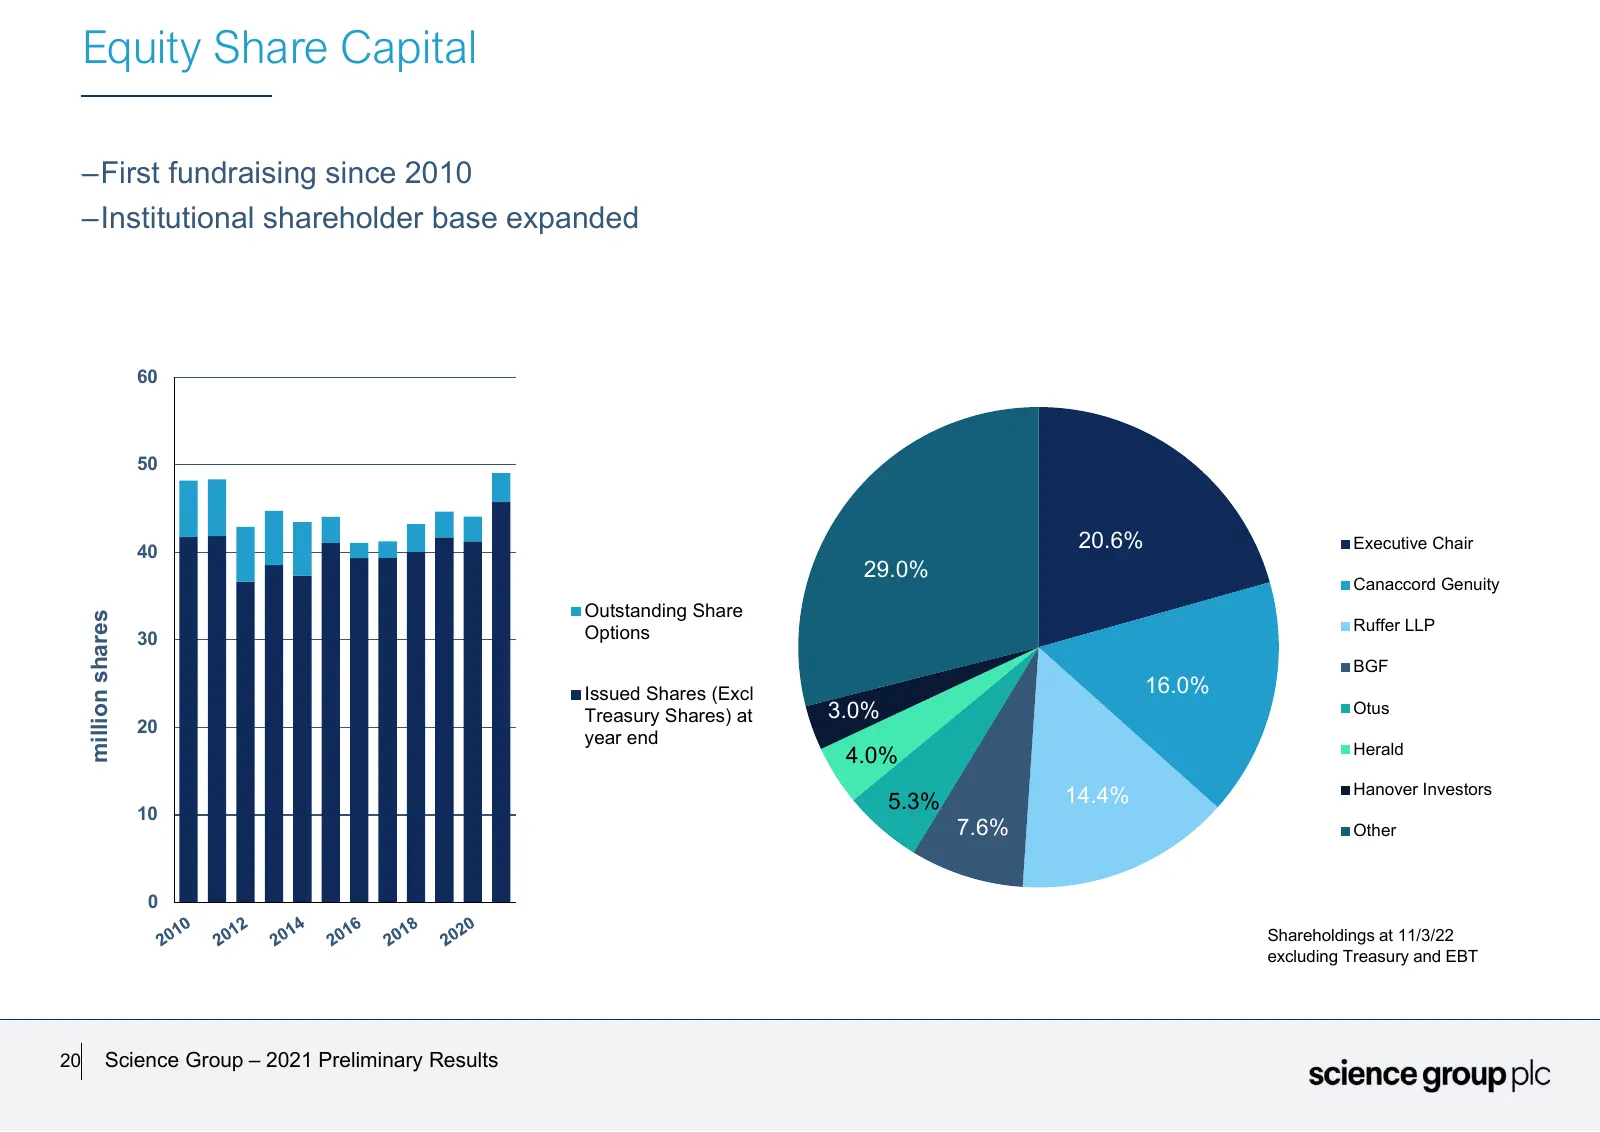
Slide 20: Equity Share Capital
Equity Share Capital –First fundraising since 2010 –Institutional shareholder base expanded 60 50 40 20.6% Executive Chair 29.0% Canaccord Genuity Outstanding Share million shares Options Ruffer LLP 30 BGF Issued Shares (Excl 16.0% Treasury Shares) at 3.0% Otus 20 year end 4.0% Herald 14.4% Hanover
Source: Internet Archive copy of sciencegroup.com
More decks from Science Group PLC
 FY2025 Earnings Presentation18 slides · Mar 17, 2026
 Leatherhead Food Research — Technical Presentation (March 2026)37 slides · Mar 4, 2026
 H1 2025 Earnings Presentation12 slides · Jul 28, 2025
 FY2024 Earnings Presentation16 slides · Mar 24, 2025
 H1 2024 Earnings Presentation10 slides · Jul 23, 2024
 FY2023 Earnings Presentation19 slides · Mar 21, 2024