Naspers Limited Class N · JSE:NPN
Naspers Limited Class N — FY2017 Earnings Presentation
57 slides from Naspers Limited Class N's earnings presentation, May 2017

Slide 1: Analyst Booklet – detailed financials
Analyst Booklet – detailed financials For the year ended 31 March 2017
Slide 2: Important information
Important information This presentation contains forward-looking statements as defined in the United States Private Securities Litigation Reform Act of 1995. Words such as “believe”, “anticipate”, “intend”, “seek”, “will”, “plan”, “could”, “may”, “endeavour” and similar expressions are intended to i

Slide 3: Strategy
STRATEGY
Slide 4: Strategy: building blocks in place
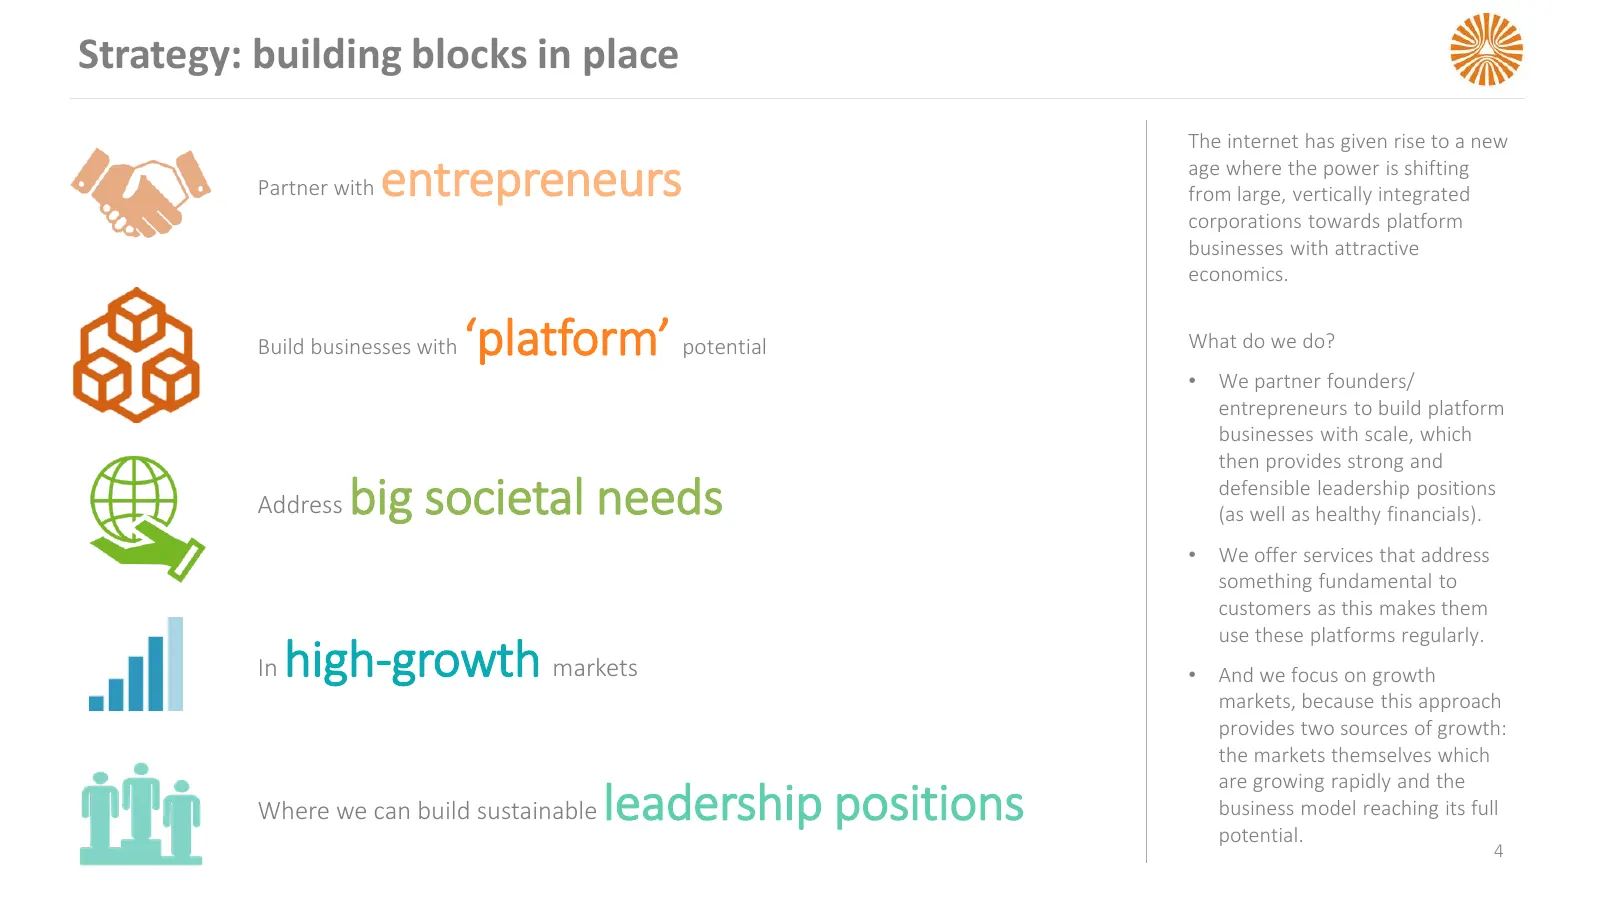
Strategy: building blocks in place The internet has given rise to a new Partner with entrepreneurs age where the power is shifting from large, vertically integrated corporations towards platform businesses with attractive economics. Build businesses with ‘platform’ potential What do we do? • We part
Slide 5: Naspers creates value
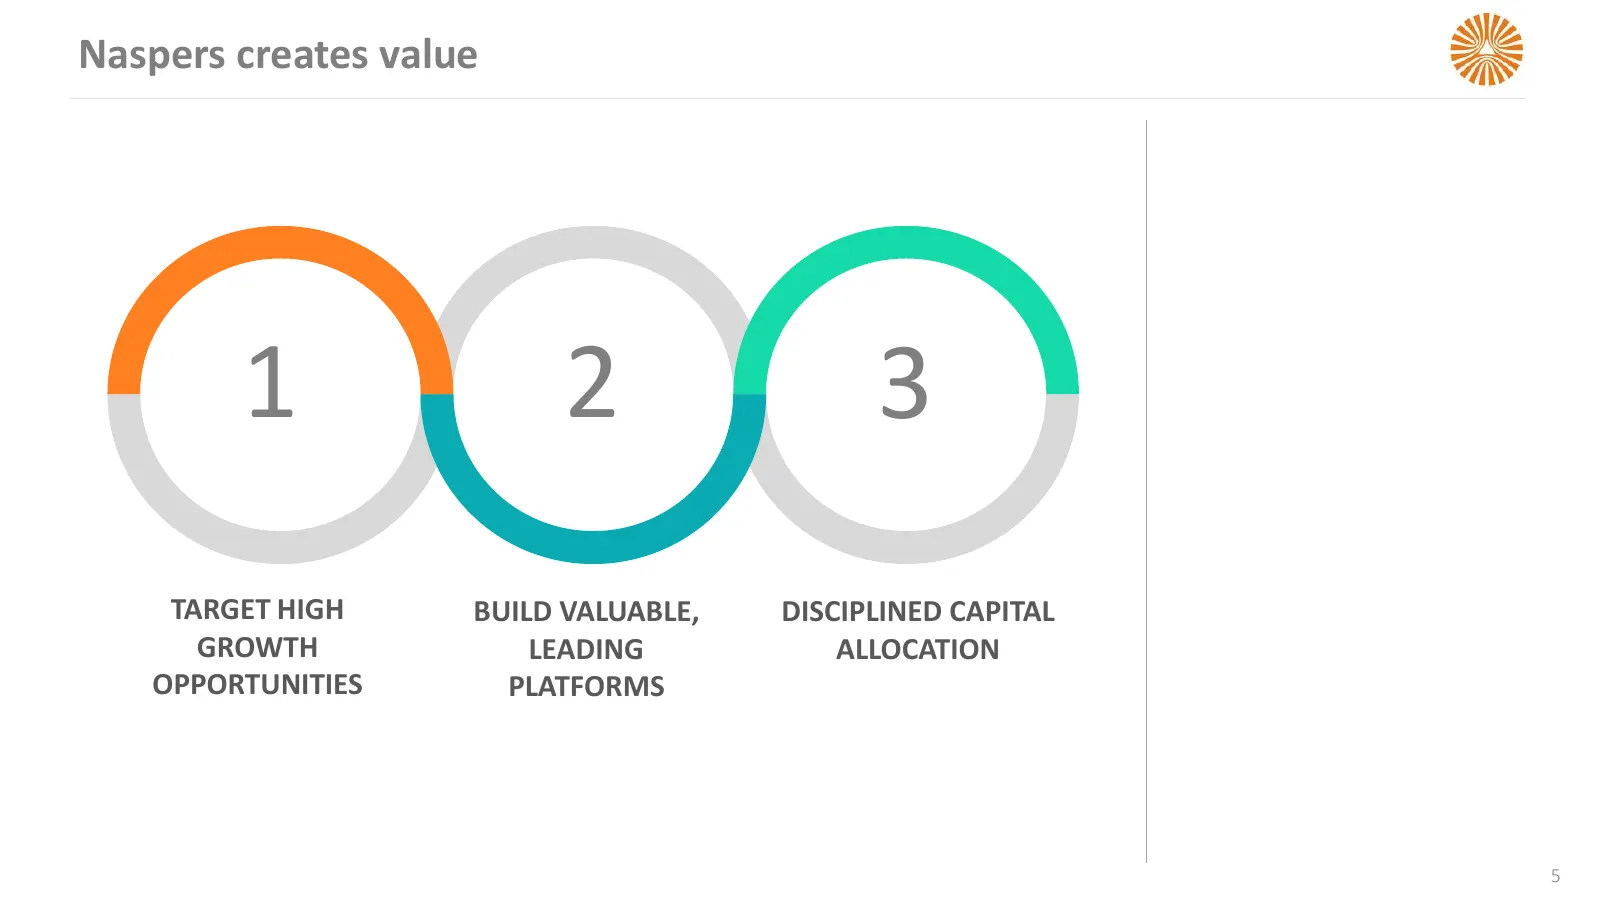
Naspers creates value 1 2 3 TARGET HIGH BUILD VALUABLE, DISCIPLINED CAPITAL GROWTH LEADING ALLOCATION OPPORTUNITIES PLATFORMS 5
Slide 6: Target high growth opportunities
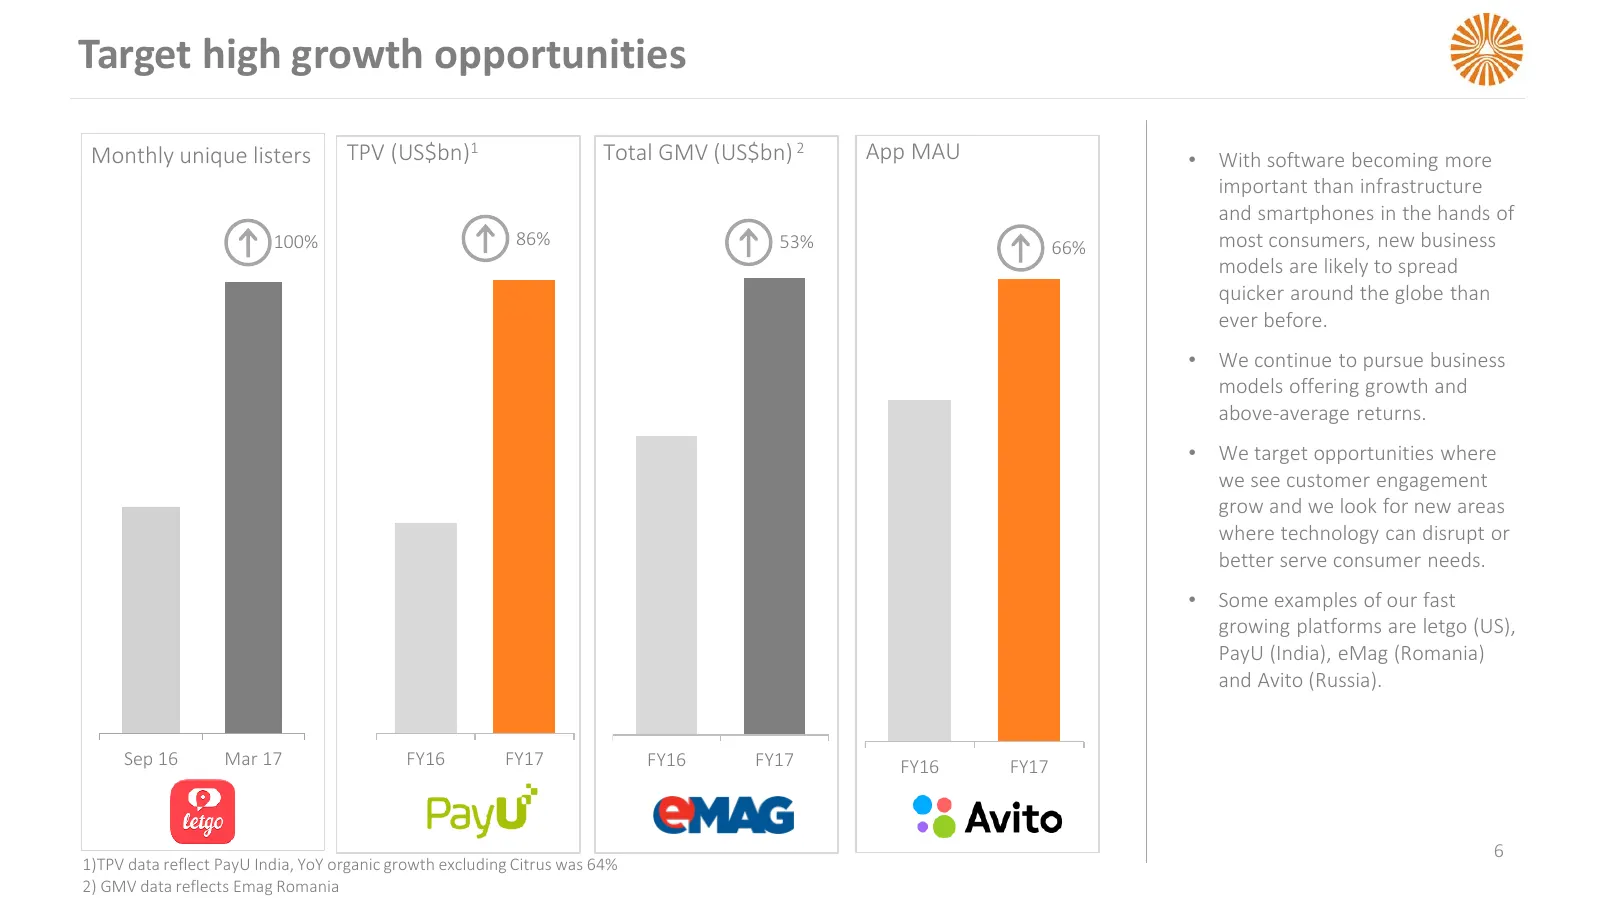
Target high growth opportunities Monthly unique listers TPV (US$bn)1 Total GMV (US$bn) 2 App MAU • With software becoming more important than infrastructure and smartphones in the hands of 100% 86% 53% 66% most consumers, new business models are likely to spread quicker around the globe than ever be
Slide 7: Online food delivery: another high-growth opportunity
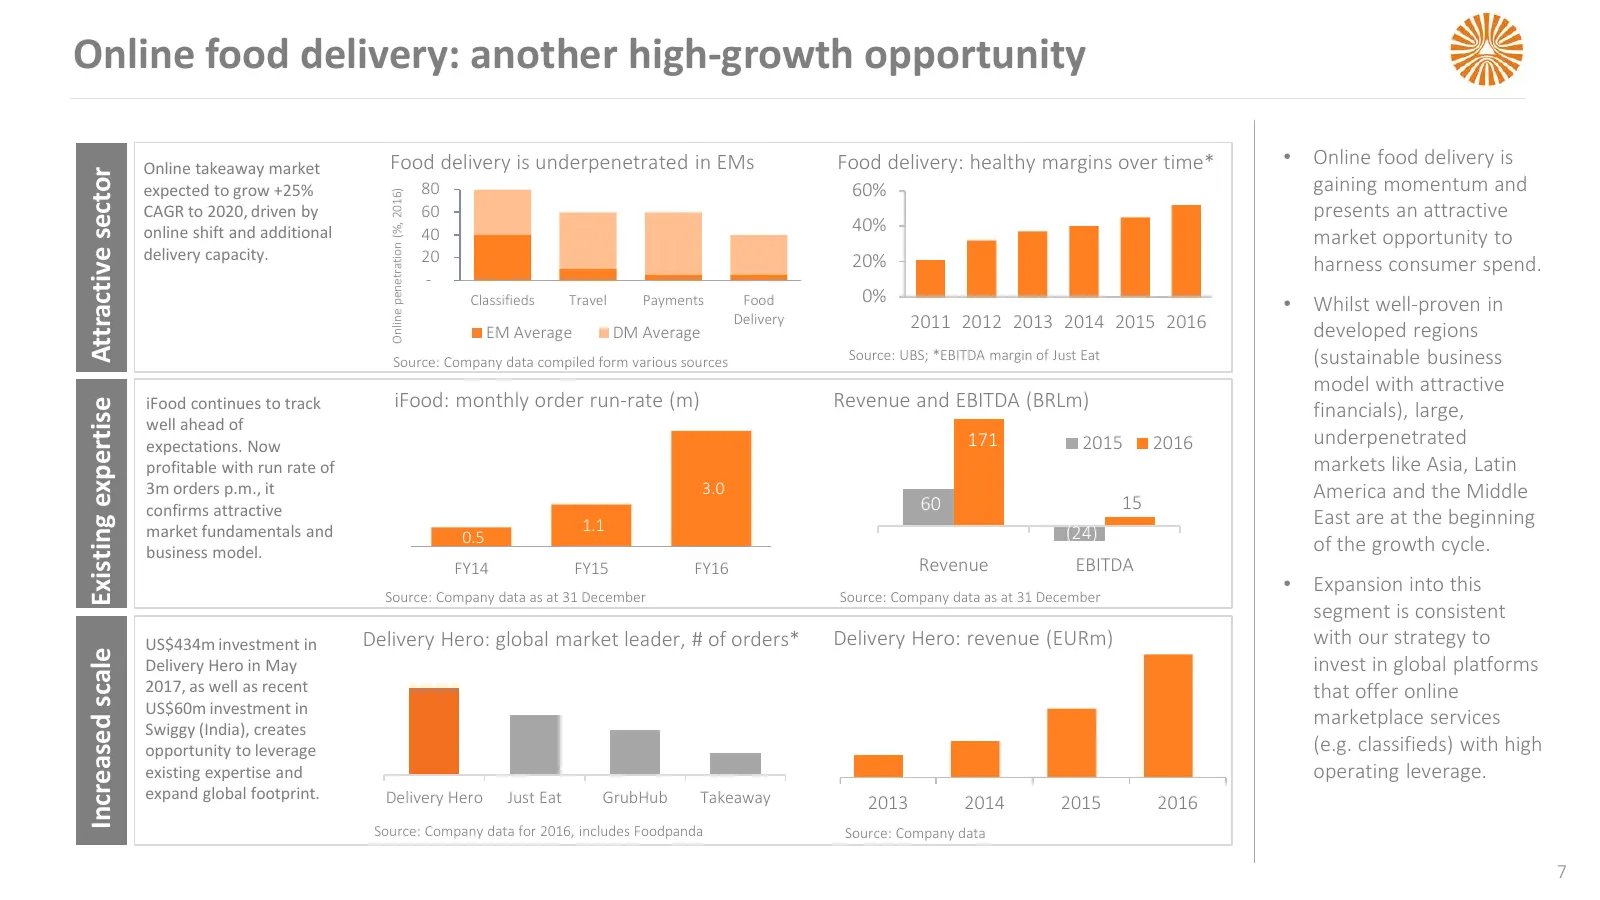
Online food delivery: another high-growth opportunity Online takeaway market Food delivery is underpenetrated in EMs Food delivery: healthy margins over time* • Online food delivery is Attractive sector expected to grow +25% 80 60% gaining momentum and Online penetration (%, 2016) CAGR to 2020, driv
Slide 8: Leadership positions in large, growing markets
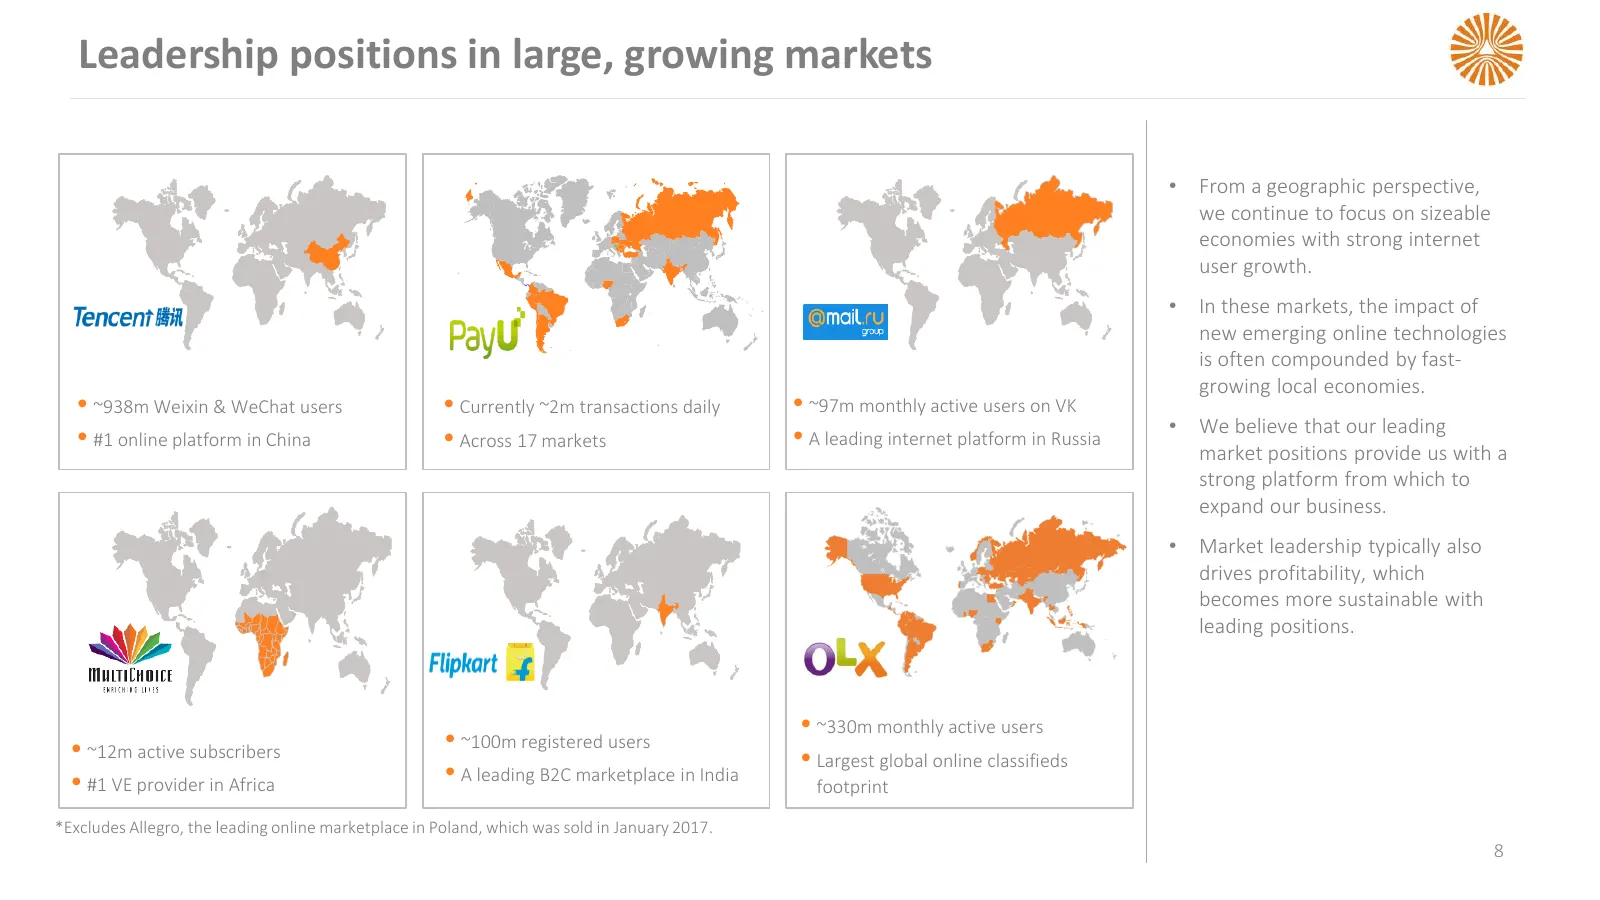
Leadership positions in large, growing markets • From a geographic perspective, we continue to focus on sizeable economies with strong internet user growth. • In these markets, the impact of new emerging online technologies is often compounded by fast- growing local economies. ~938m Weixin & WeCha
Slide 9: Building valuable platforms
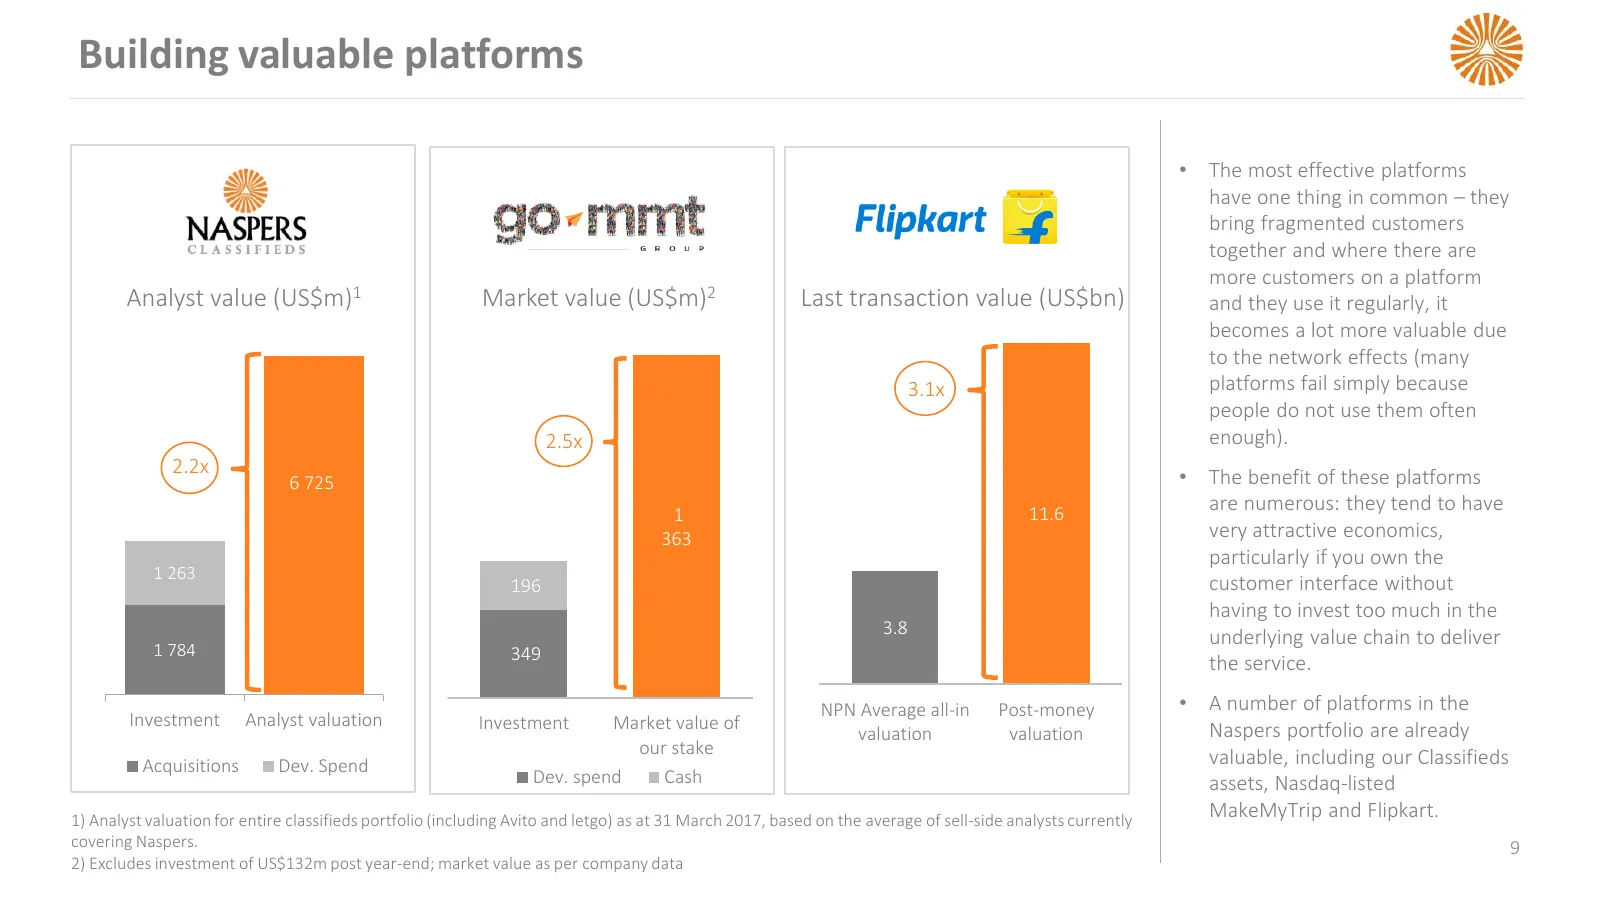
Building valuable platforms • The most effective platforms have one thing in common – they bring fragmented customers together and where there are more customers on a platform Analyst value (US$m)1 Market value (US$m)2 Last transaction value (US$bn) and they use it regularly, it becomes a lot more v
Slide 10: Deliberate capital allocation to sustain growth
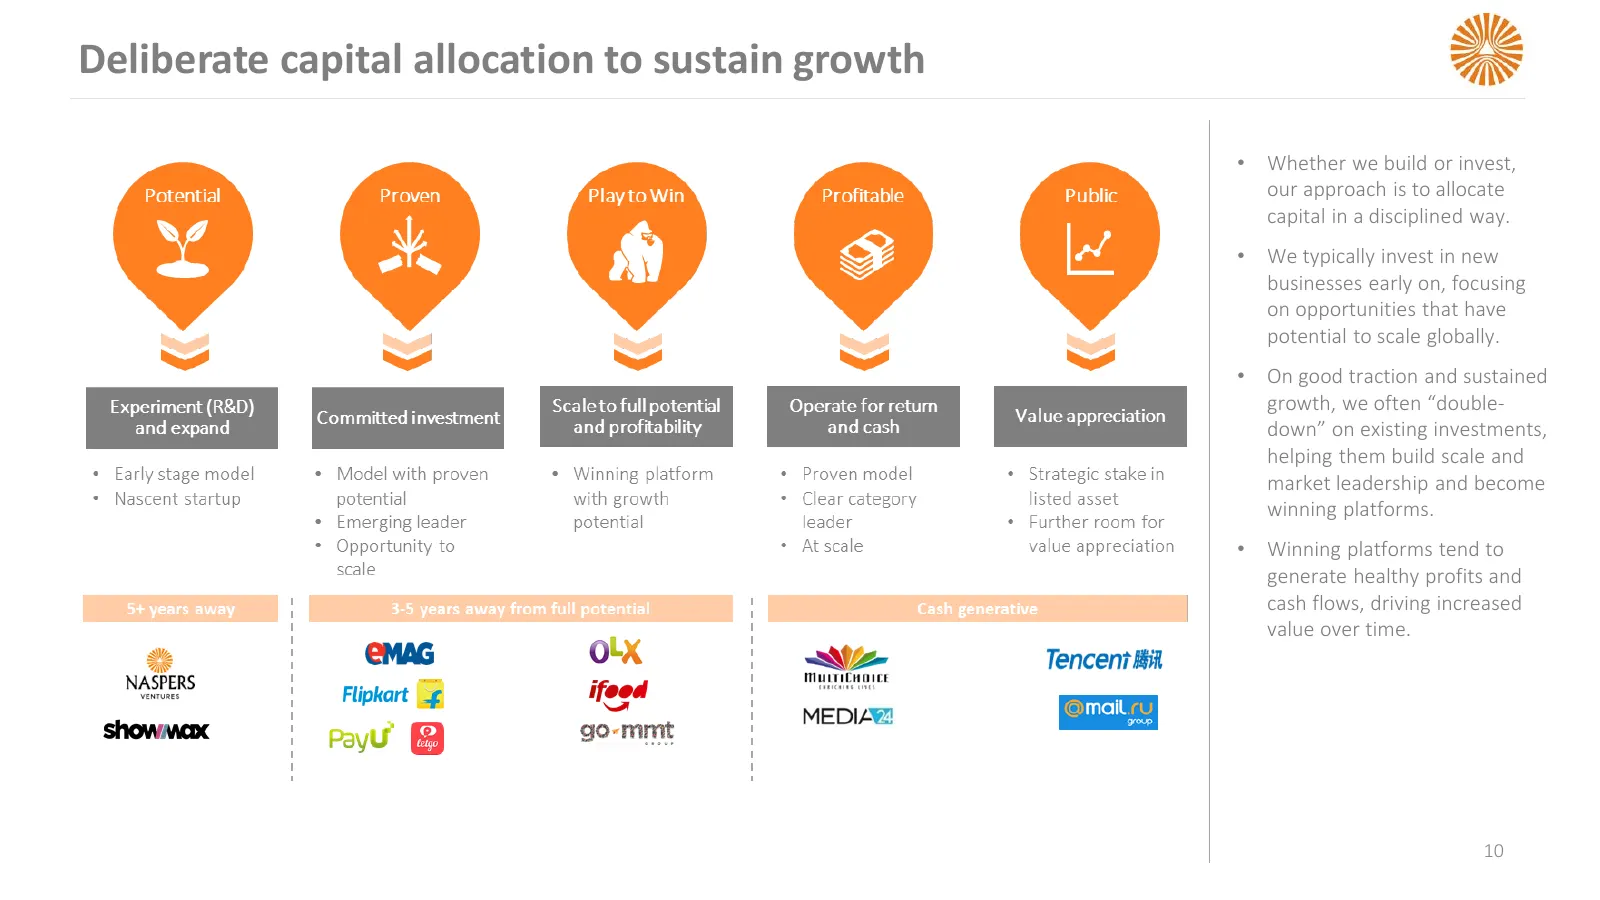
Deliberate capital allocation to sustain growth • Whether we build or invest, our approach is to allocate capital in a disciplined way. • We typically invest in new businesses early on, focusing on opportunities that have potential to scale globally. • On good traction and sustained growth, we often
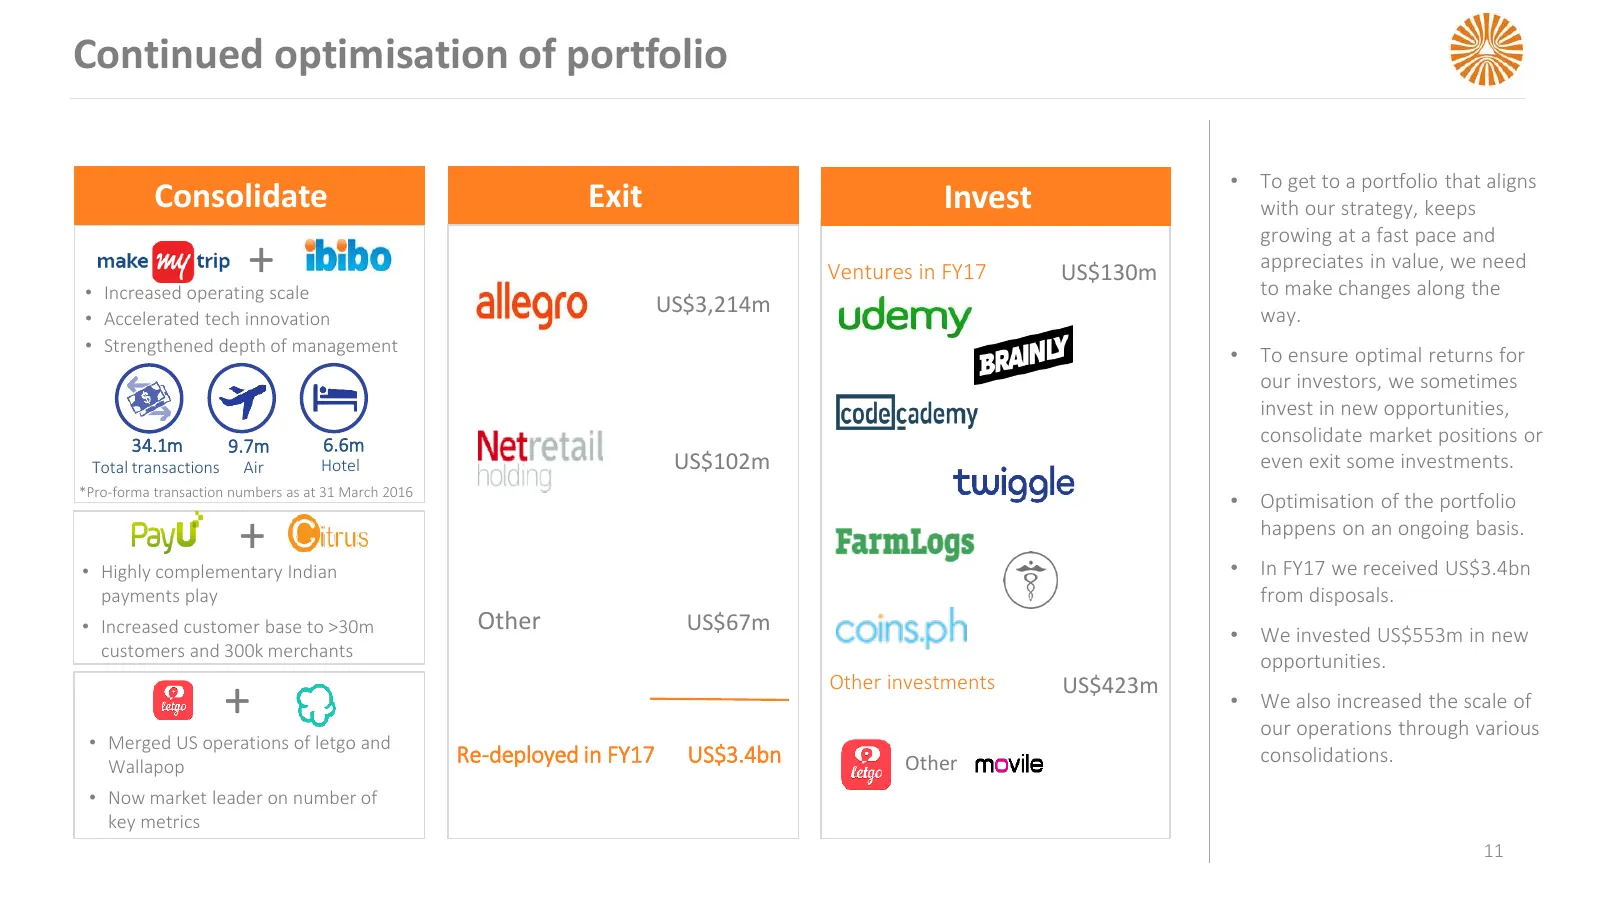
Slide 11: Continued optimisation of portfolio
Continued optimisation of portfolio • To get to a portfolio that aligns Consolidate Exit Invest with our strategy, keeps growing at a fast pace and + • Increased operating scale Ventures in FY17 US$130m appreciates in value, we need to make changes along the US$3,214m way. • Accelerated tech innovat

Slide 12: Operations
OPERATIONS
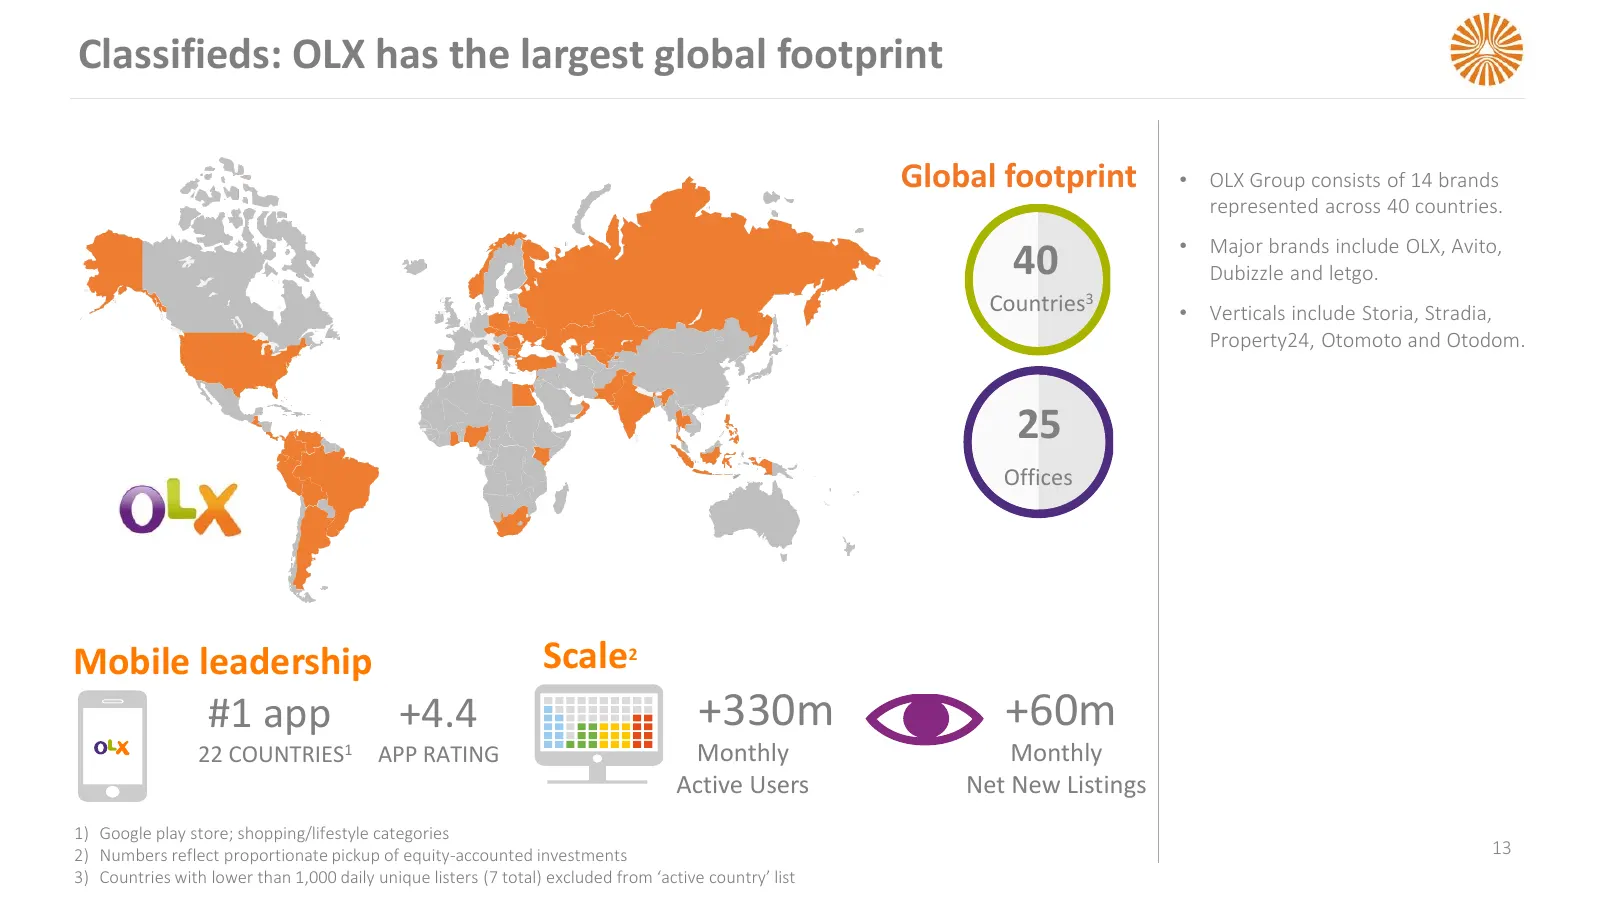
Slide 13: Classifieds: OLX has the largest global footprint
Classifieds: OLX has the largest global footprint Global footprint • OLX Group consists of 14 brands represented across 40 countries. • Major brands include OLX, Avito, 40 Dubizzle and letgo. Countries3 • Verticals include Storia, Stradia, Property24, Otomoto and Otodom. 25 Offices Mobile leadership
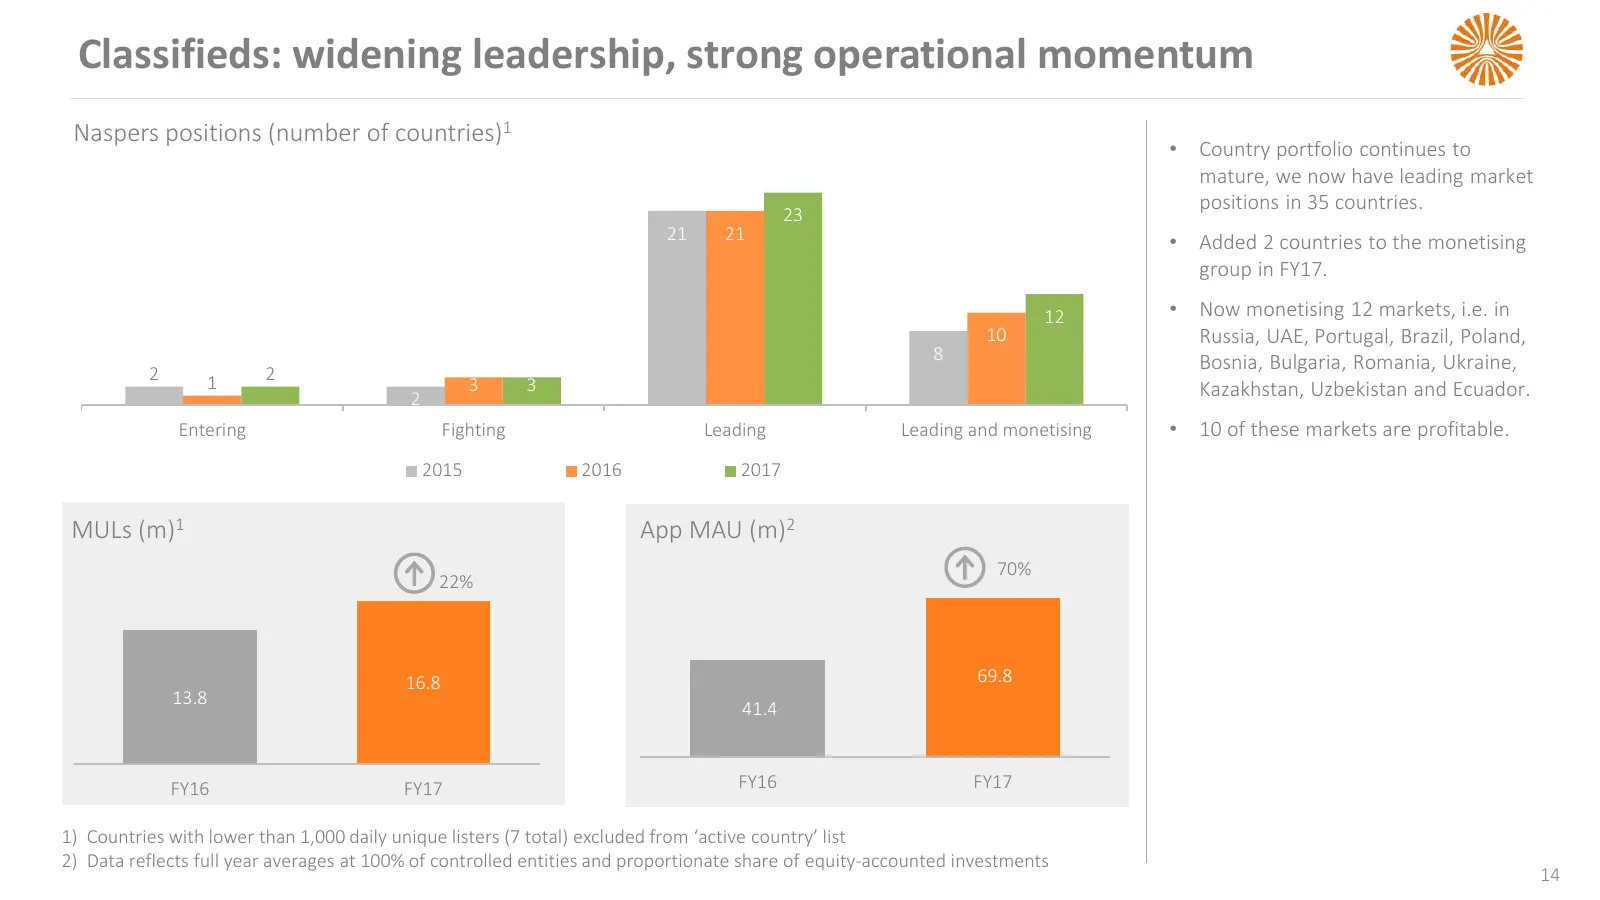
Slide 14: Classifieds: widening leadership, strong operational momentum
Classifieds: widening leadership, strong operational momentum Naspers positions (number of countries)1 • Country portfolio continues to mature, we now have leading market positions in 35 countries. 23 21 21 • Added 2 countries to the monetising group in FY17. 12 • Now monetising 12 markets, i.e. in
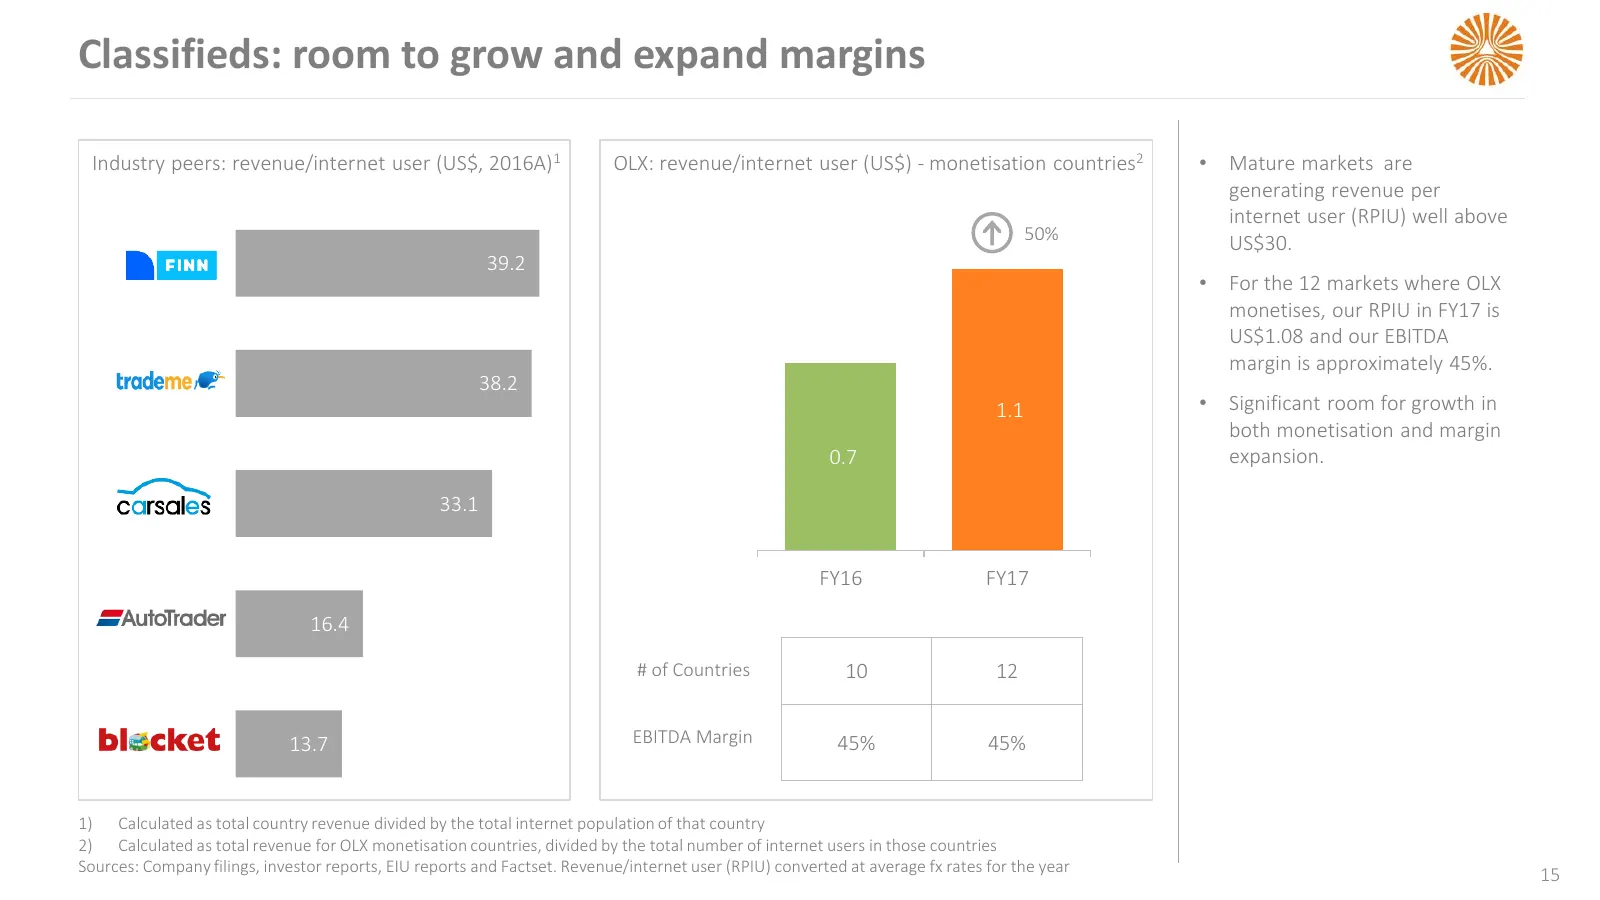
Slide 15: Classifieds: room to grow and expand margins
Classifieds: room to grow and expand margins Industry peers: revenue/internet user (US$, 2016A)1 OLX: revenue/internet user (US$) - monetisation countries2 • Mature markets are generating revenue per internet user (RPIU) well above 50% US$30. 39.2 • For the 12 markets where OLX monetises, our RPIU i
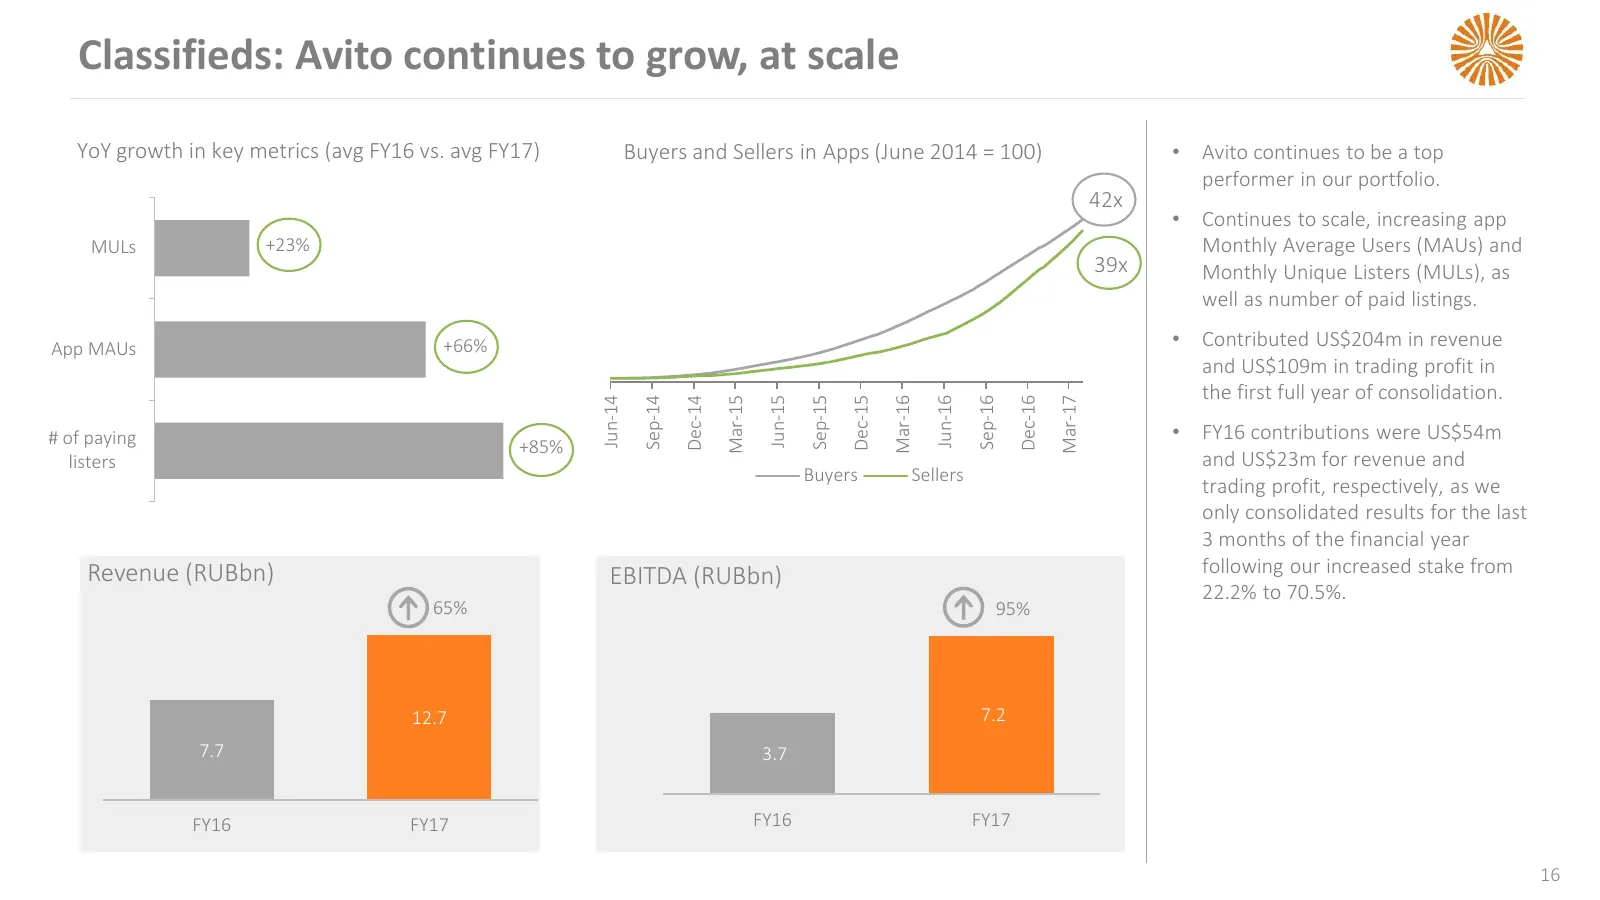
Slide 16: Classifieds: Avito continues to grow, at scale
Classifieds: Avito continues to grow, at scale YoY growth in key metrics (avg FY16 vs. avg FY17) Buyers and Sellers in Apps (June 2014 = 100) • Avito continues to be a top performer in our portfolio. 42x • Continues to scale, increasing app MULs +23% Monthly Average Users (MAUs) and 39x Monthly Uniq
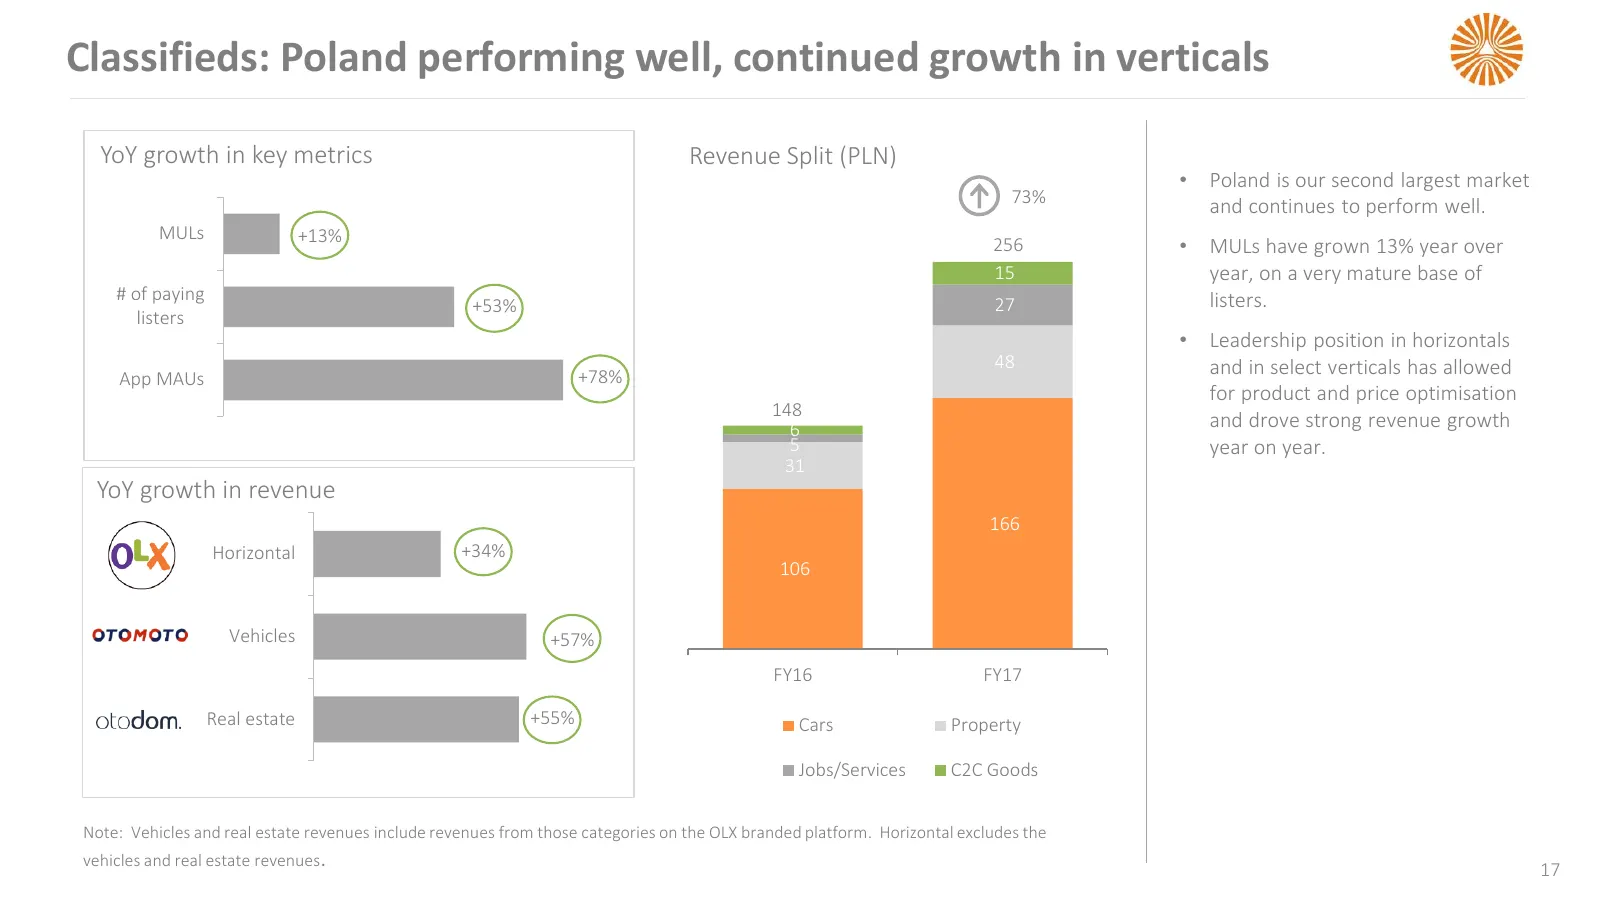
Slide 17: Classifieds: Poland performing well, continued growth in verticals
Classifieds: Poland performing well, continued growth in verticals YoY growth in key metrics Revenue Split (PLN) • Poland is our second largest market 73% and continues to perform well. MULs +13% 256 • MULs have grown 13% year over 15 year, on a very mature base of # of paying listers. +53% 27 liste
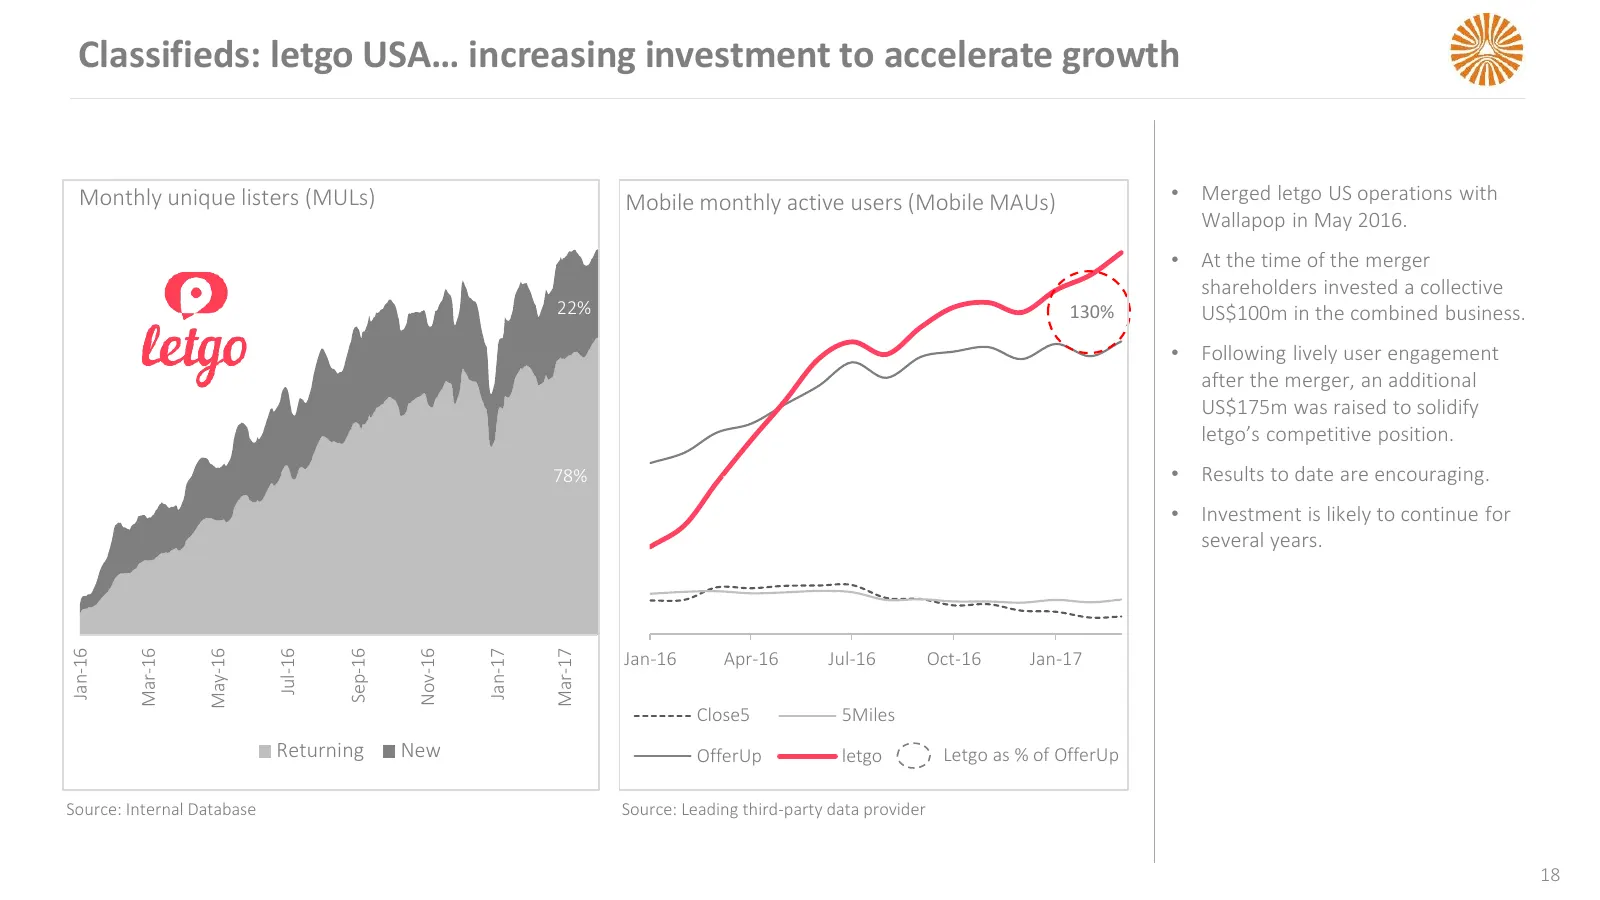
Slide 18: Classifieds: letgo USA increasing investment to accelerate growth
Classifieds: letgo USA… increasing investment to accelerate growth Monthly unique listers (MULs) Mobile monthly active users (Mobile MAUs) • Merged letgo US operations with Wallapop in May 2016. • At the time of the merger shareholders invested a collective 22% 22% 130% US$100m in the combined busin
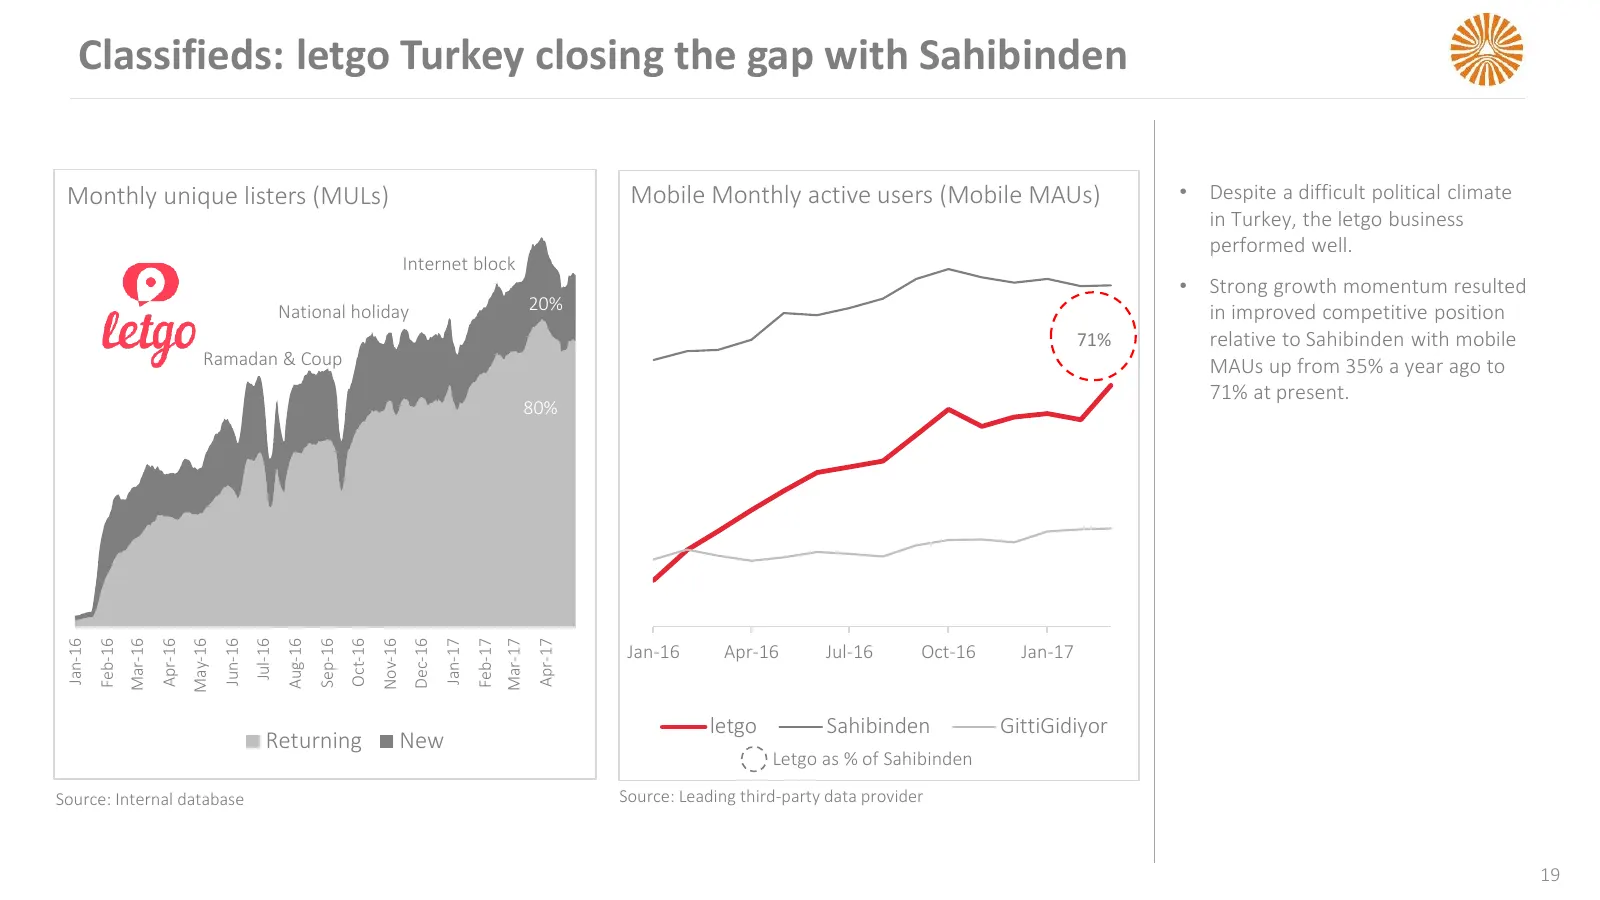
Slide 19: Classifieds: letgo Turkey closing the gap with Sahibinden
Classifieds: letgo Turkey closing the gap with Sahibinden Monthly unique listers (MULs) Mobile Monthly active users (Mobile MAUs) • Despite a difficult political climate in Turkey, the letgo business performed well. Internet block • Strong growth momentum resulted National holiday 20% in improved co
Slide 20: B2C etail: retain strong line-up of local leaders
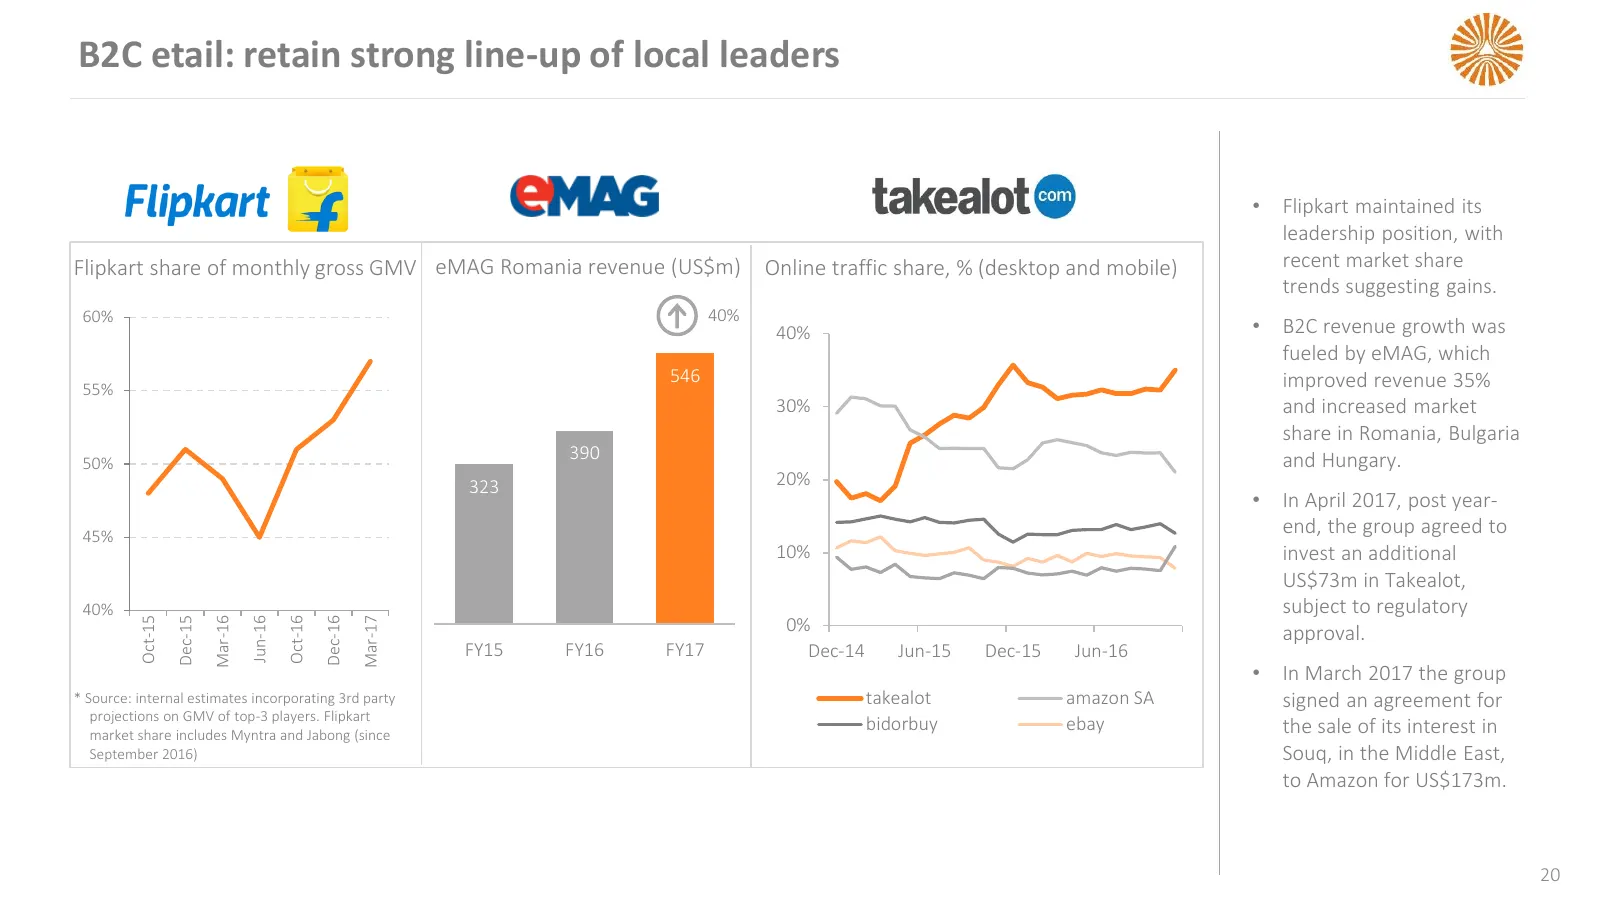
B2C etail: retain strong line-up of local leaders • Flipkart maintained its leadership position, with Flipkart share of monthly gross GMV eMAG Romania revenue (US$m) Online traffic share, % (desktop and mobile) recent market share trends suggesting gains. 60% 40% 40% • B2C revenue growth was fueled
Slide 21: Payment: PayU consolidation in India generated lively growth
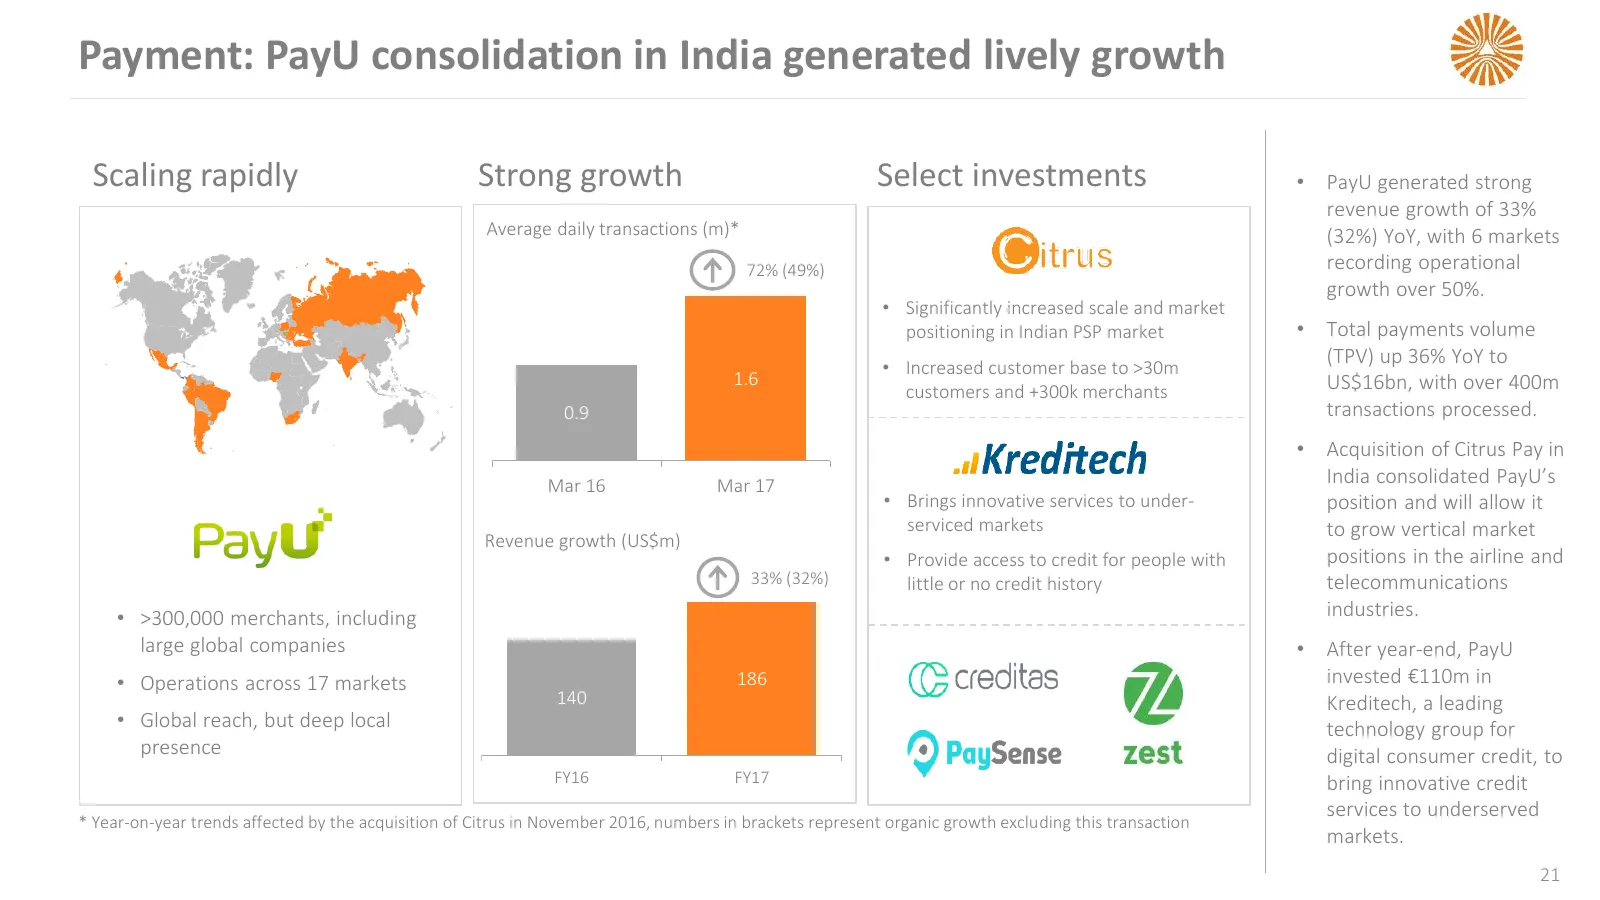
Payment: PayU consolidation in India generated lively growth Scaling rapidly Strong growth Select investments • PayU generated strong revenue growth of 33% Average daily transactions (m)* (32%) YoY, with 6 markets 72% (49%) recording operational growth over 50%. • Significantly increased scale and m
Slide 22: Naspers Ventures: preparing for the next phase of growth
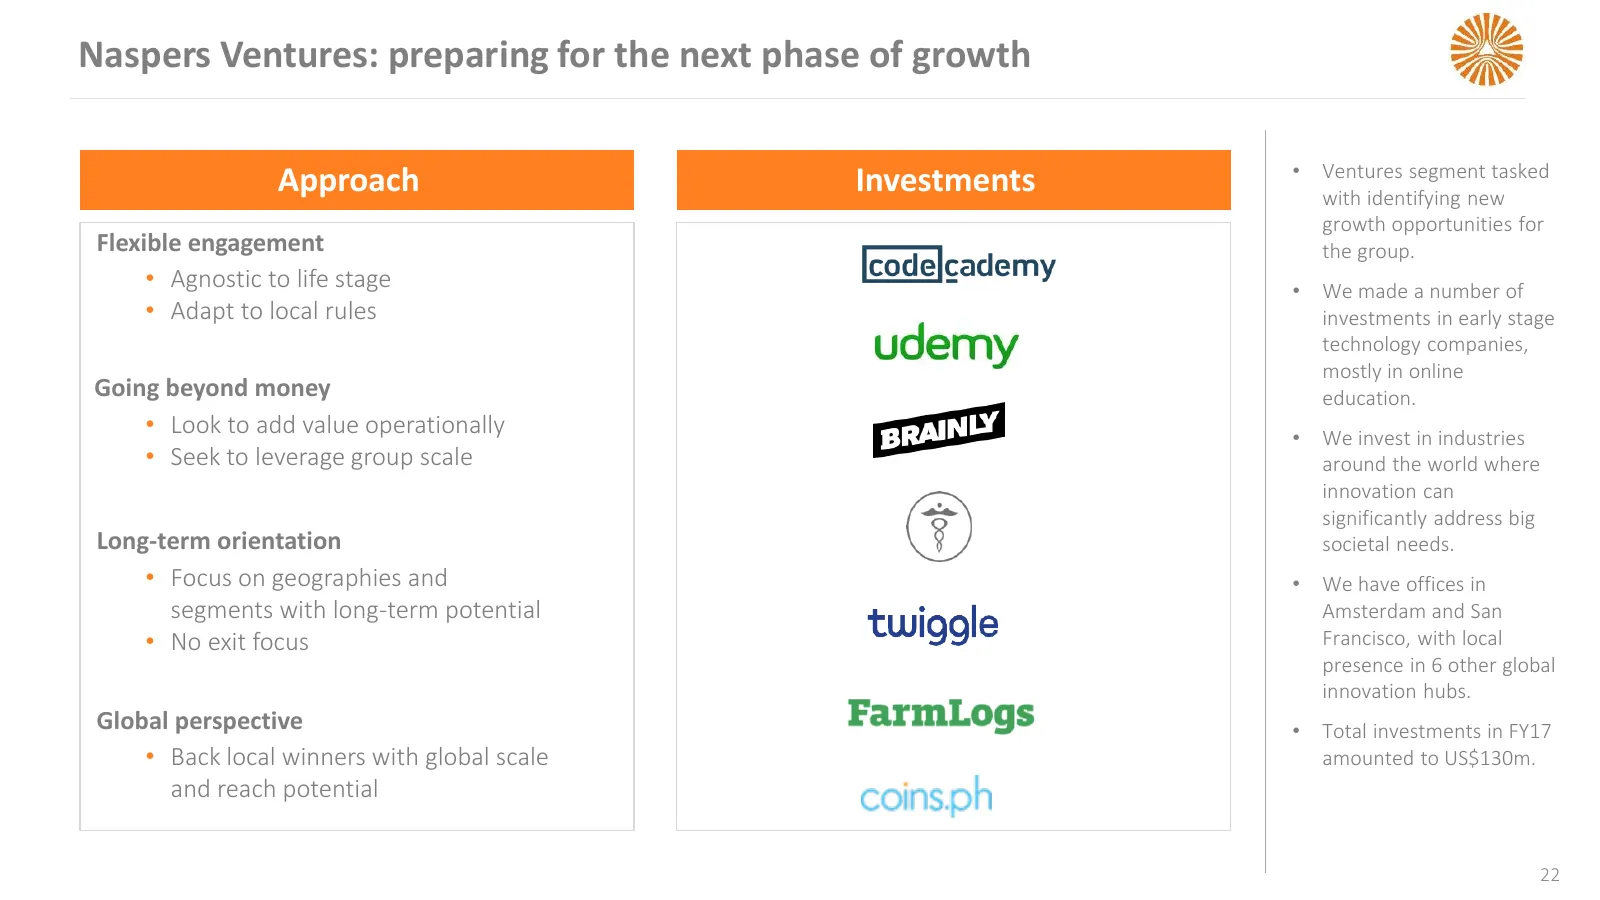
Naspers Ventures: preparing for the next phase of growth • Ventures segment tasked Approach Investments with identifying new growth opportunities for Flexible engagement the group. • Agnostic to life stage • We made a number of • Adapt to local rules investments in early stage technology companies,
Slide 23: VE: solid subscriber growth, changing mix
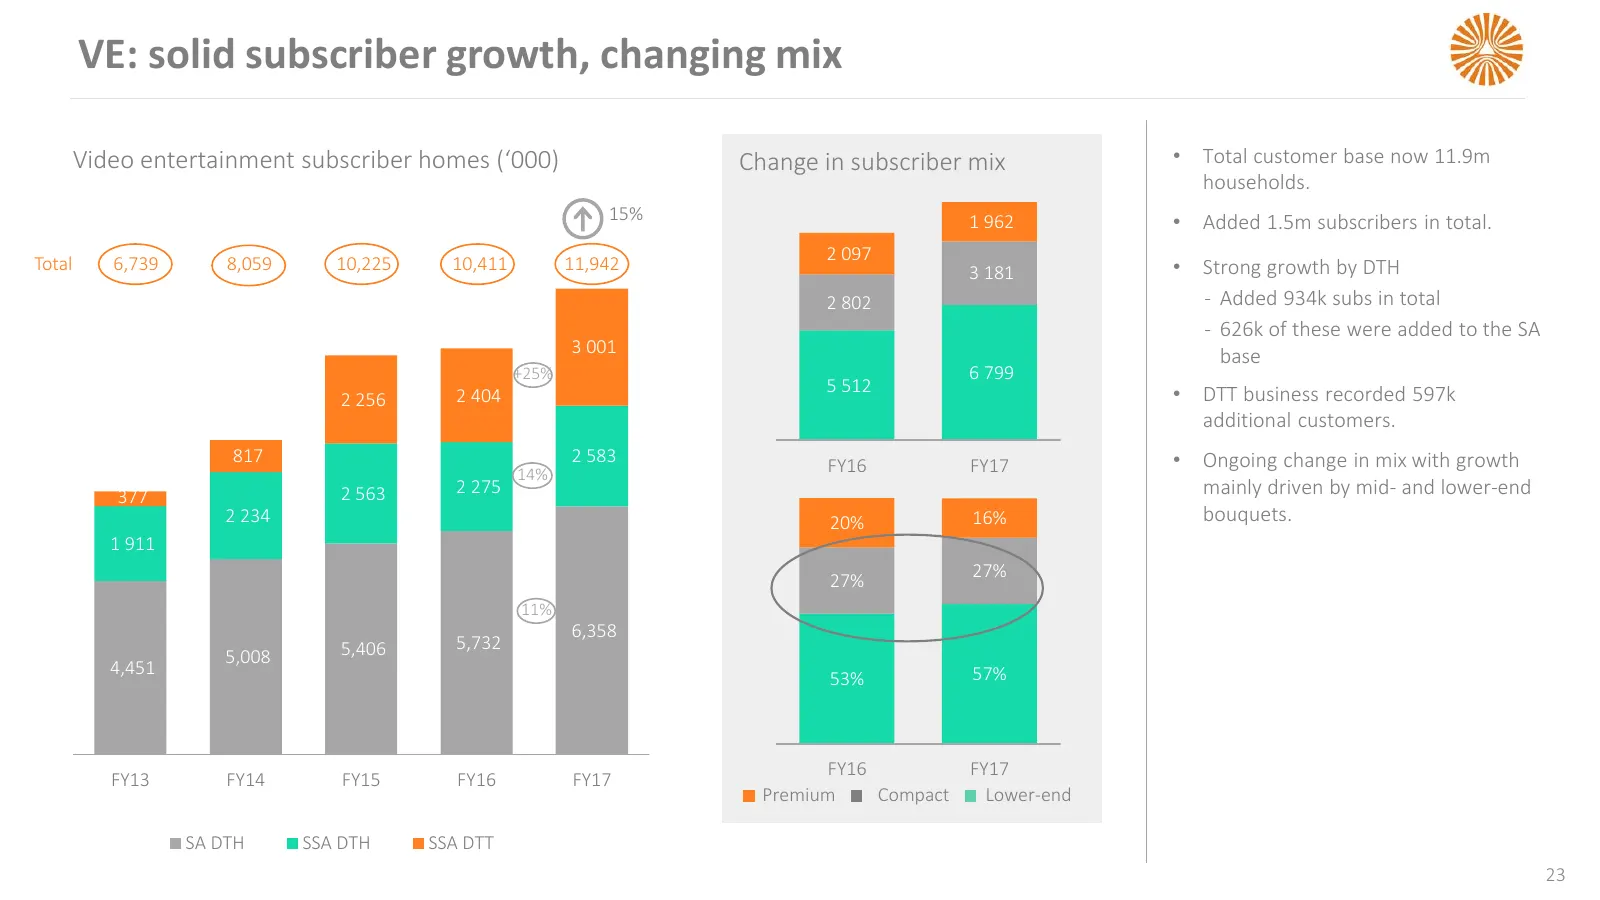
VE: solid subscriber growth, changing mix Video entertainment subscriber homes (‘000) Change in subscriber mix • Total customer base now 11.9m households. 15% 1 962 • Added 1.5m subscribers in total. 2 097 Total 6,739 8,059 10,225 10,411 11,942 3 181 • Strong growth by DTH 2 802 ‐ Added 934k subs in
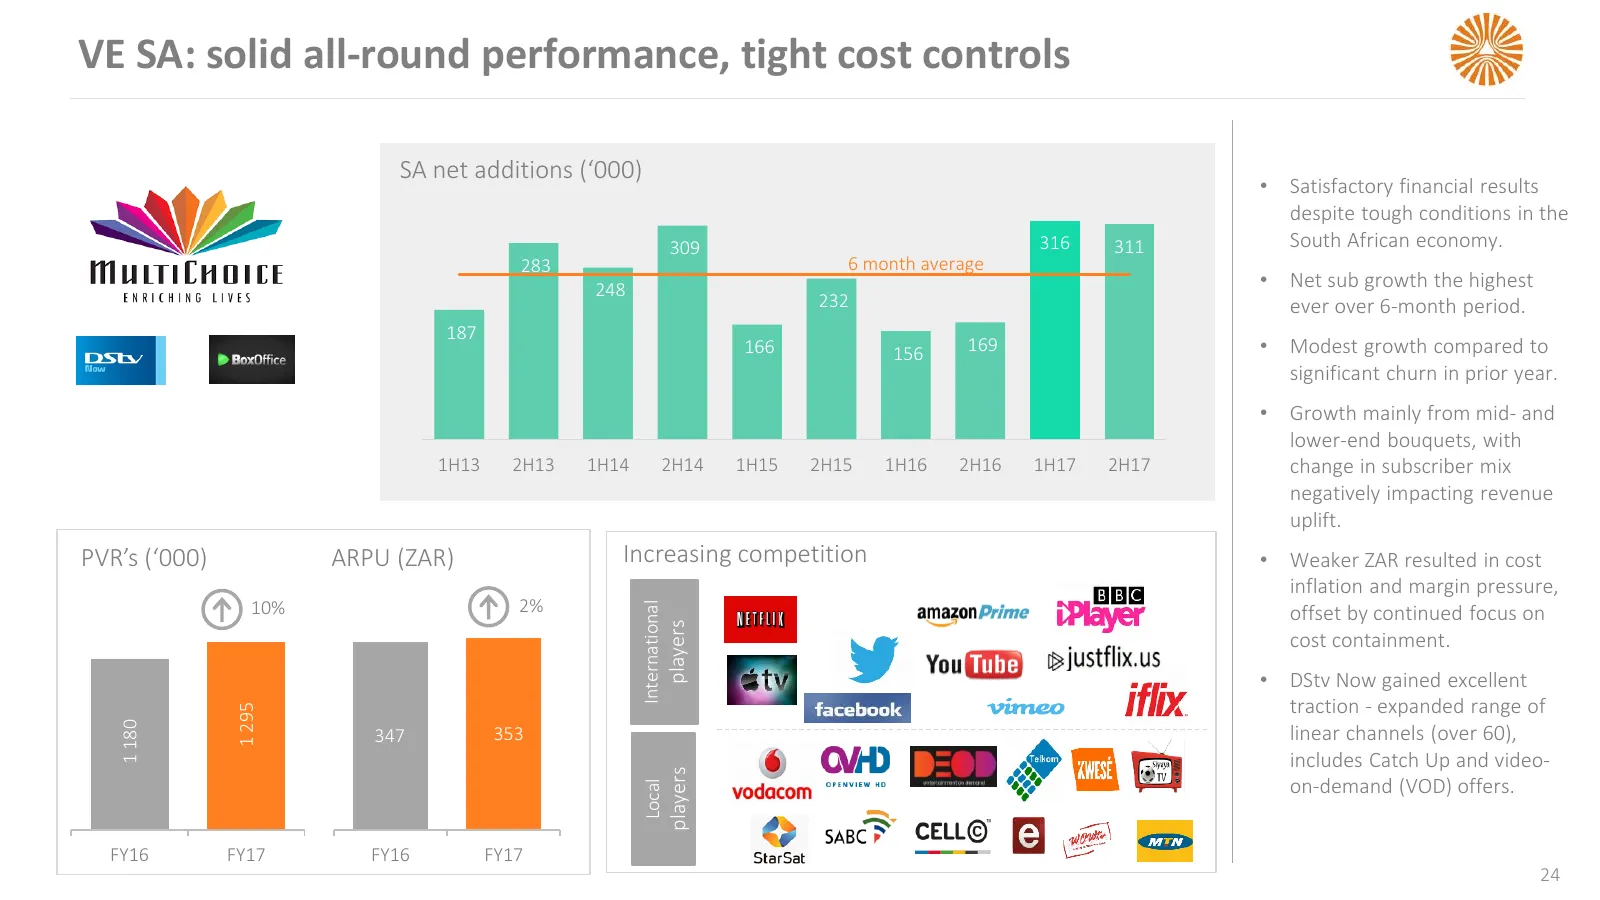
Slide 24: VE SA: solid all-round performance, tight cost controls
VE SA: solid all-round performance, tight cost controls SA net additions (‘000) • Satisfactory financial results despite tough conditions in the 309 316 311 South African economy. 283 6 month average 248 • Net sub growth the highest 232 ever over 6-month period. 187 166 156 169 • Modest growth compa
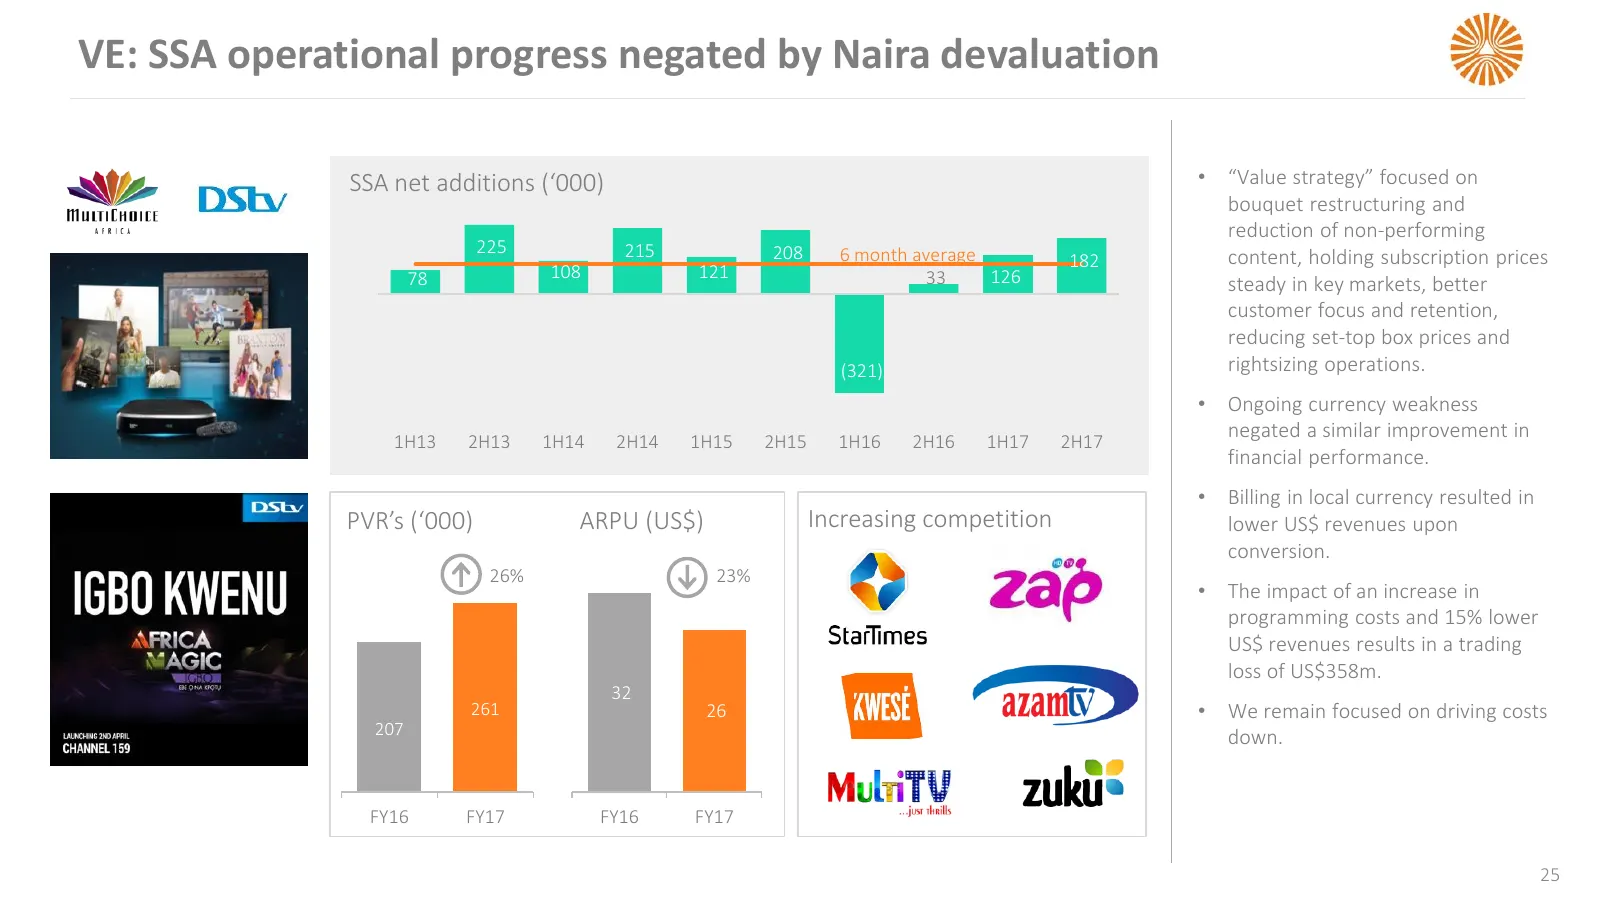
Slide 25: VE: SSA operational progress negated by Naira devaluation
VE: SSA operational progress negated by Naira devaluation SSA net additionsSSA (‘000) net additions (‘000) • “Value strategy” focused on bouquet restructuring and reduction of non-performing 225 215 208 6 month average 182 content, holding subscription prices 78 108 121 33 126 steady in key markets,
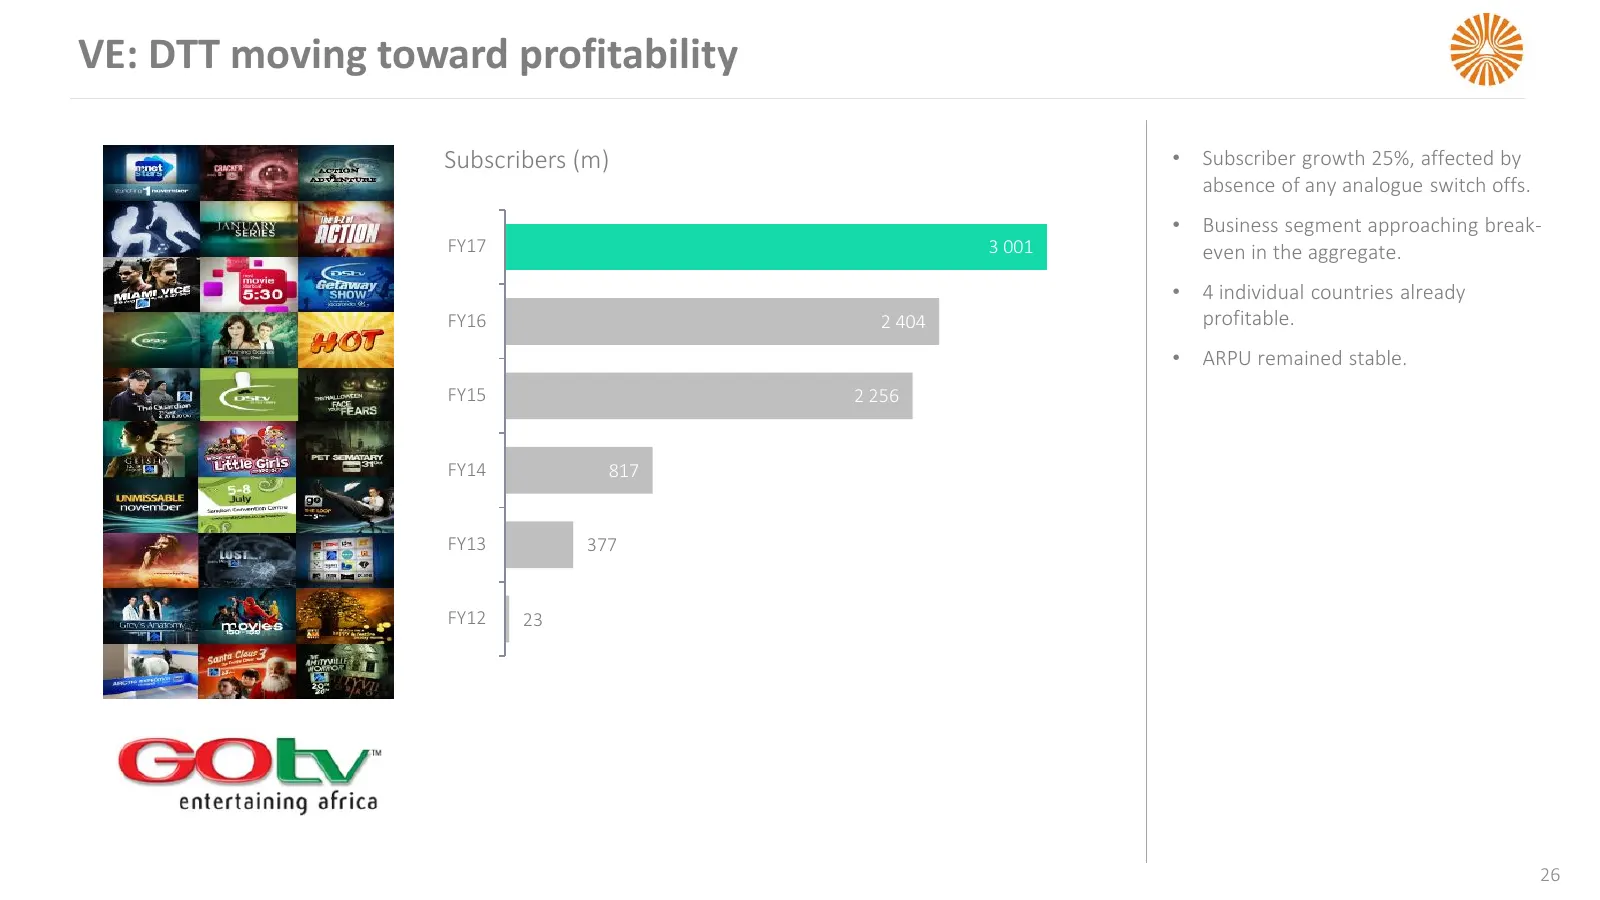
Slide 26: VE: DTT moving toward profitability
VE: DTT moving toward profitability Subscribers (m) • Subscriber growth 25%, affected by absence of any analogue switch offs. • Business segment approaching break- FY17 3 001 even in the aggregate. • 4 individual countries already FY16 2 404 profitable. • ARPU remained stable. FY15 2 256 FY14 817 FY
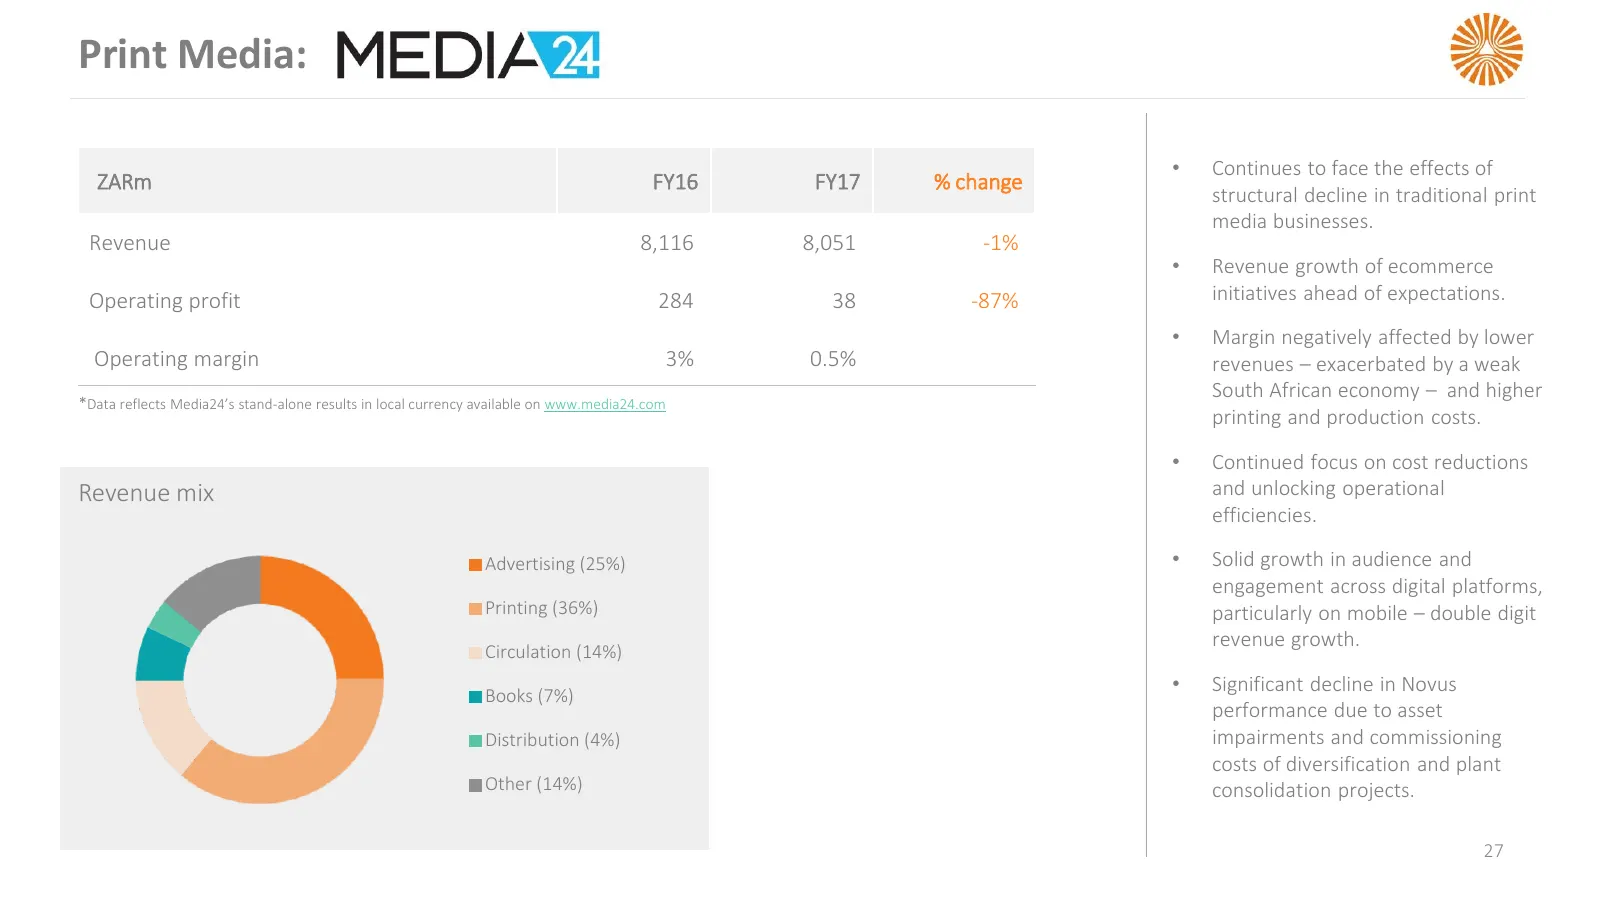
Slide 27: Print Media
Print Media: • Continues to face the effects of ZARm FY16 FY17 % change structural decline in traditional print media businesses. Revenue 8,116 8,051 -1% • Revenue growth of ecommerce Operating profit 284 38 -87% initiatives ahead of expectations. • Margin negatively affected by lower Operating marg

Slide 28: Financials
FINANCIALS
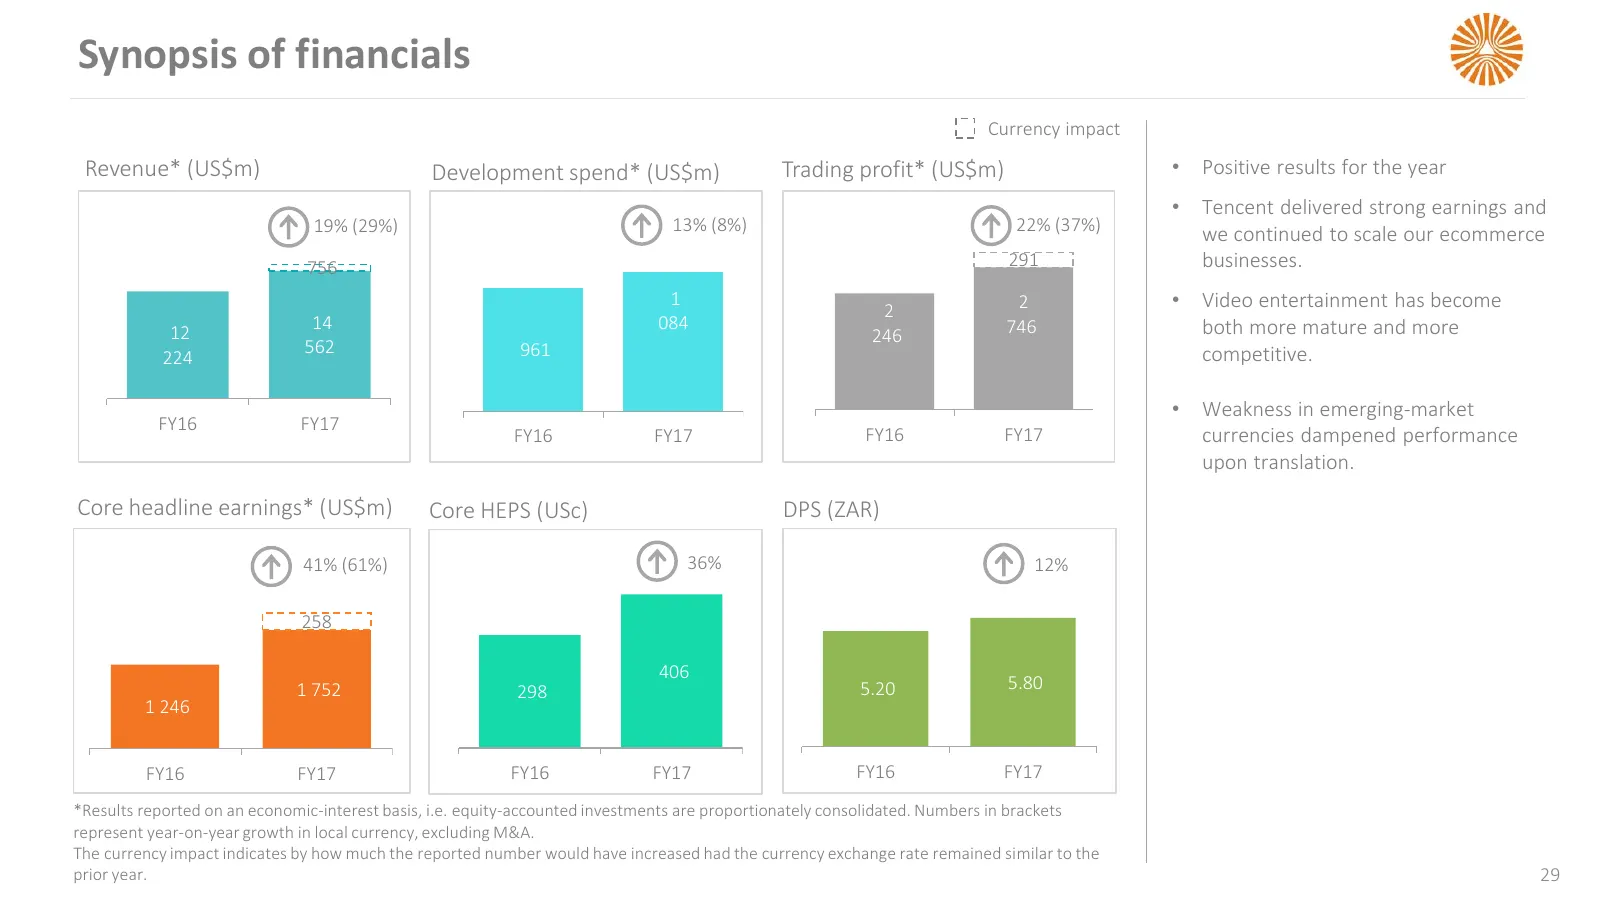
Slide 29: Synopsis of financials
Synopsis of financials Currency impact Revenue* (US$m) Development spend* (US$m) Trading profit* (US$m) • Positive results for the year • Tencent delivered strong earnings and 19% (29%) 13% (8%) 22% (37%) we continued to scale our ecommerce 756 291 businesses. 1 2 2 • Video entertainment has become
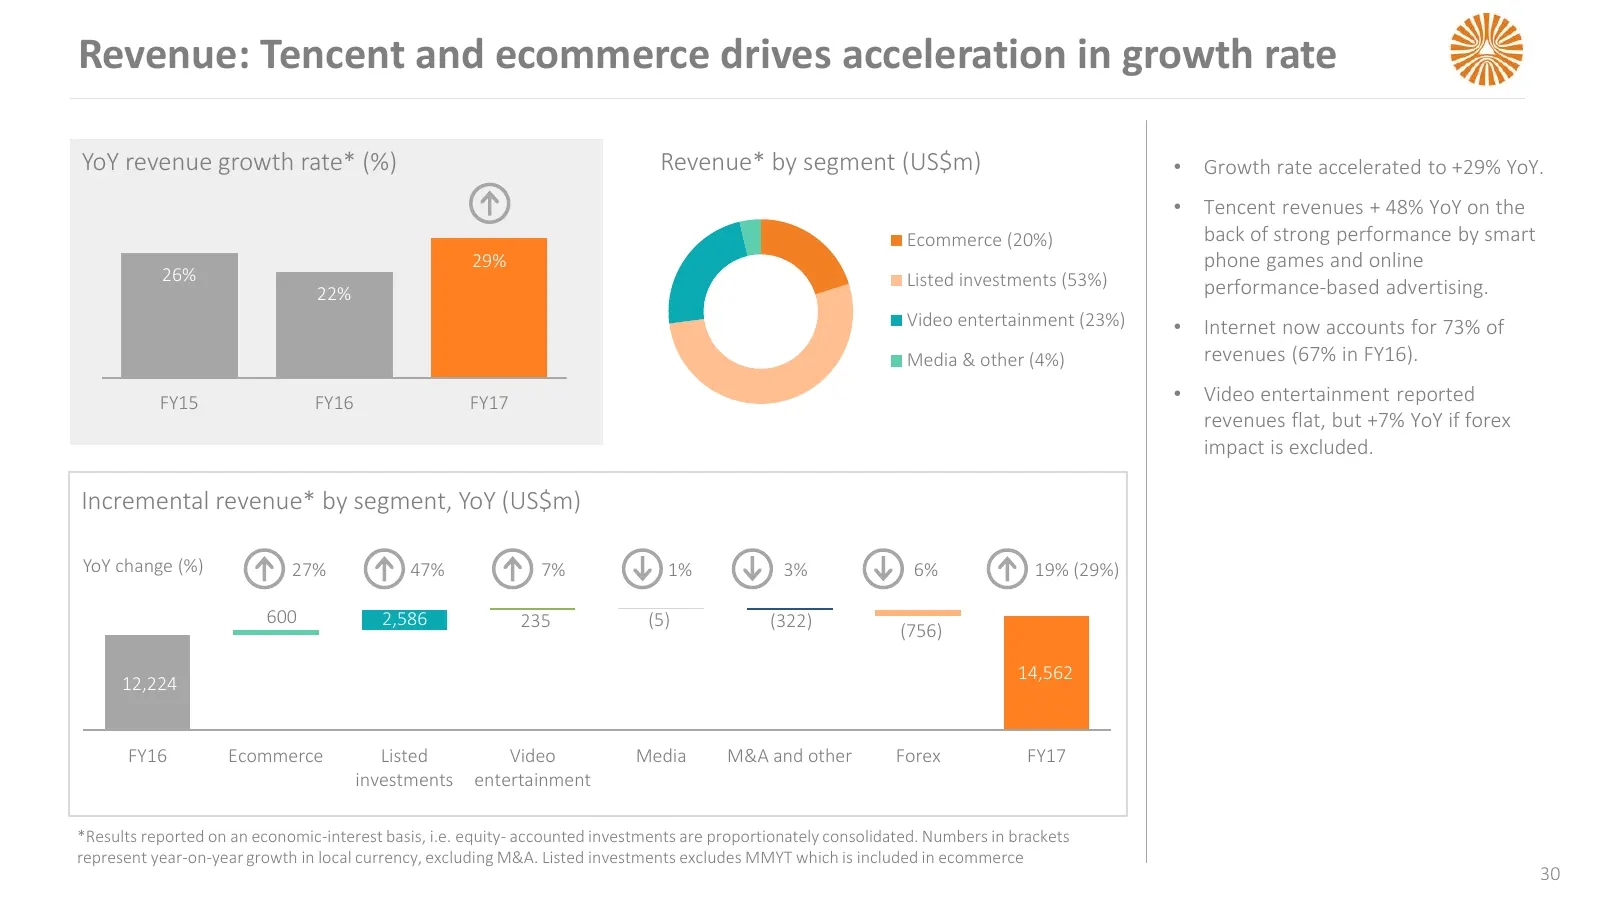
Slide 30: Revenue: Tencent and ecommerce drives acceleration in growth rate
Revenue: Tencent and ecommerce drives acceleration in growth rate YoY revenue growth rate* (%) Revenue* by segment (US$m) • Growth rate accelerated to +29% YoY. • Tencent revenues + 48% YoY on the Ecommerce (20%) back of strong performance by smart 29% phone games and online 26% Listed investments (
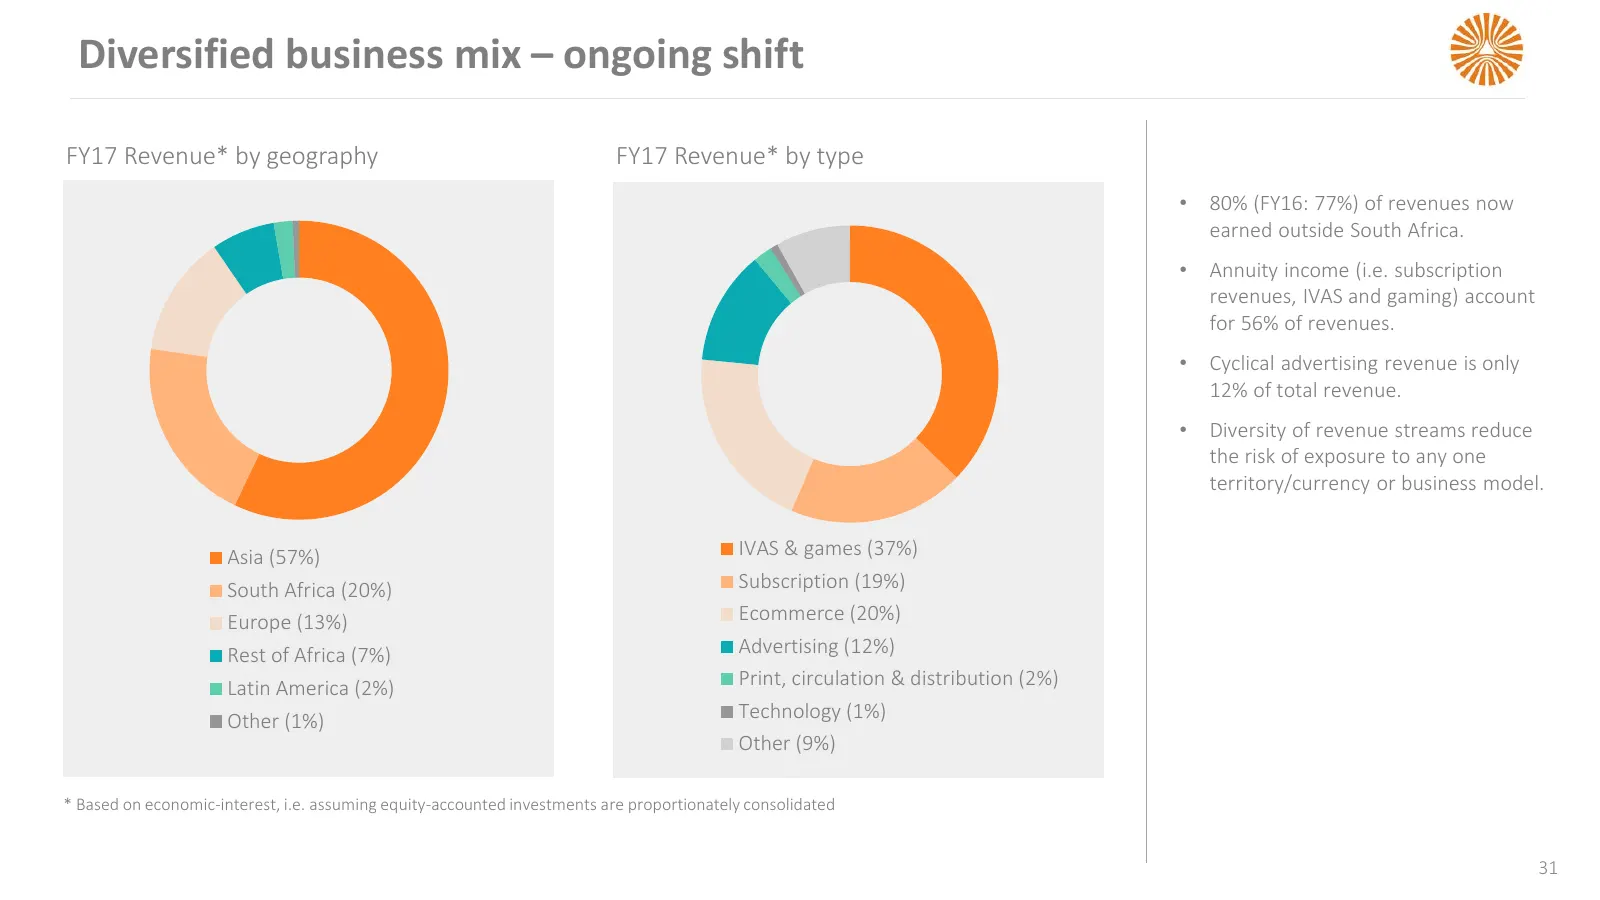
Slide 31: Diversified business mix – ongoing shift
Diversified business mix – ongoing shift FY17 Revenue* by geography FY17 Revenue* by type • 80% (FY16: 77%) of revenues now earned outside South Africa. • Annuity income (i.e. subscription revenues, IVAS and gaming) account for 56% of revenues. • Cyclical advertising revenue is only 12% of total rev
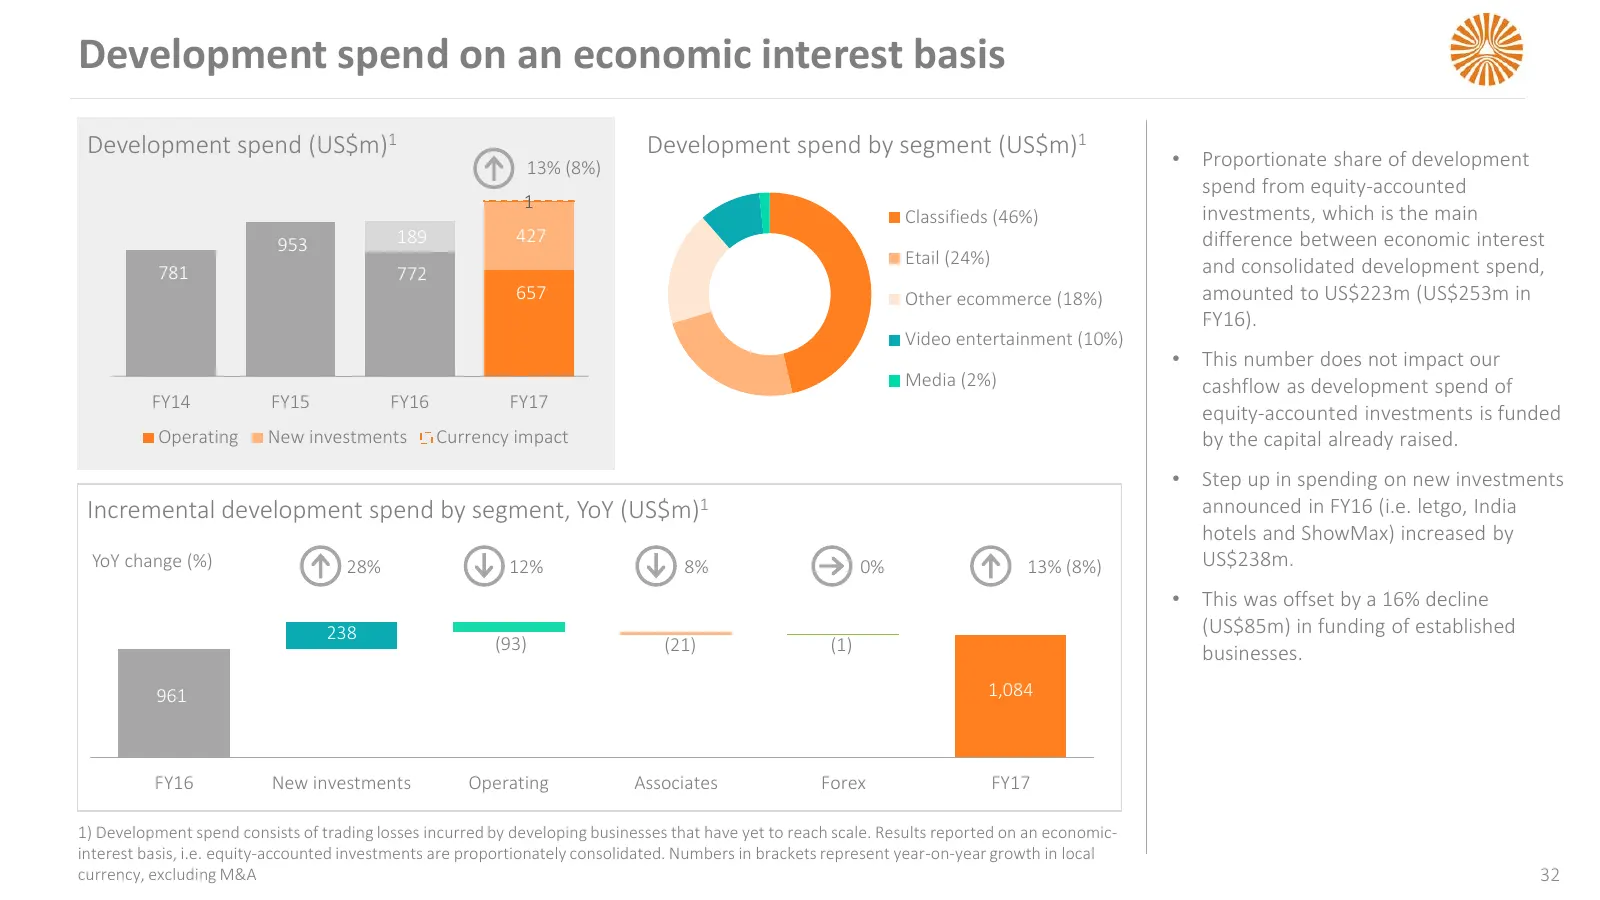
Slide 32: Development spend on an economic interest basis
Development spend on an economic interest basis Development spend (US$m)1 Development spend by segment (US$m)1 13% (8%) • Proportionate share of development spend from equity-accounted 1 Classifieds (46%) investments, which is the main 953 189 427 difference between economic interest Etail (24%) and
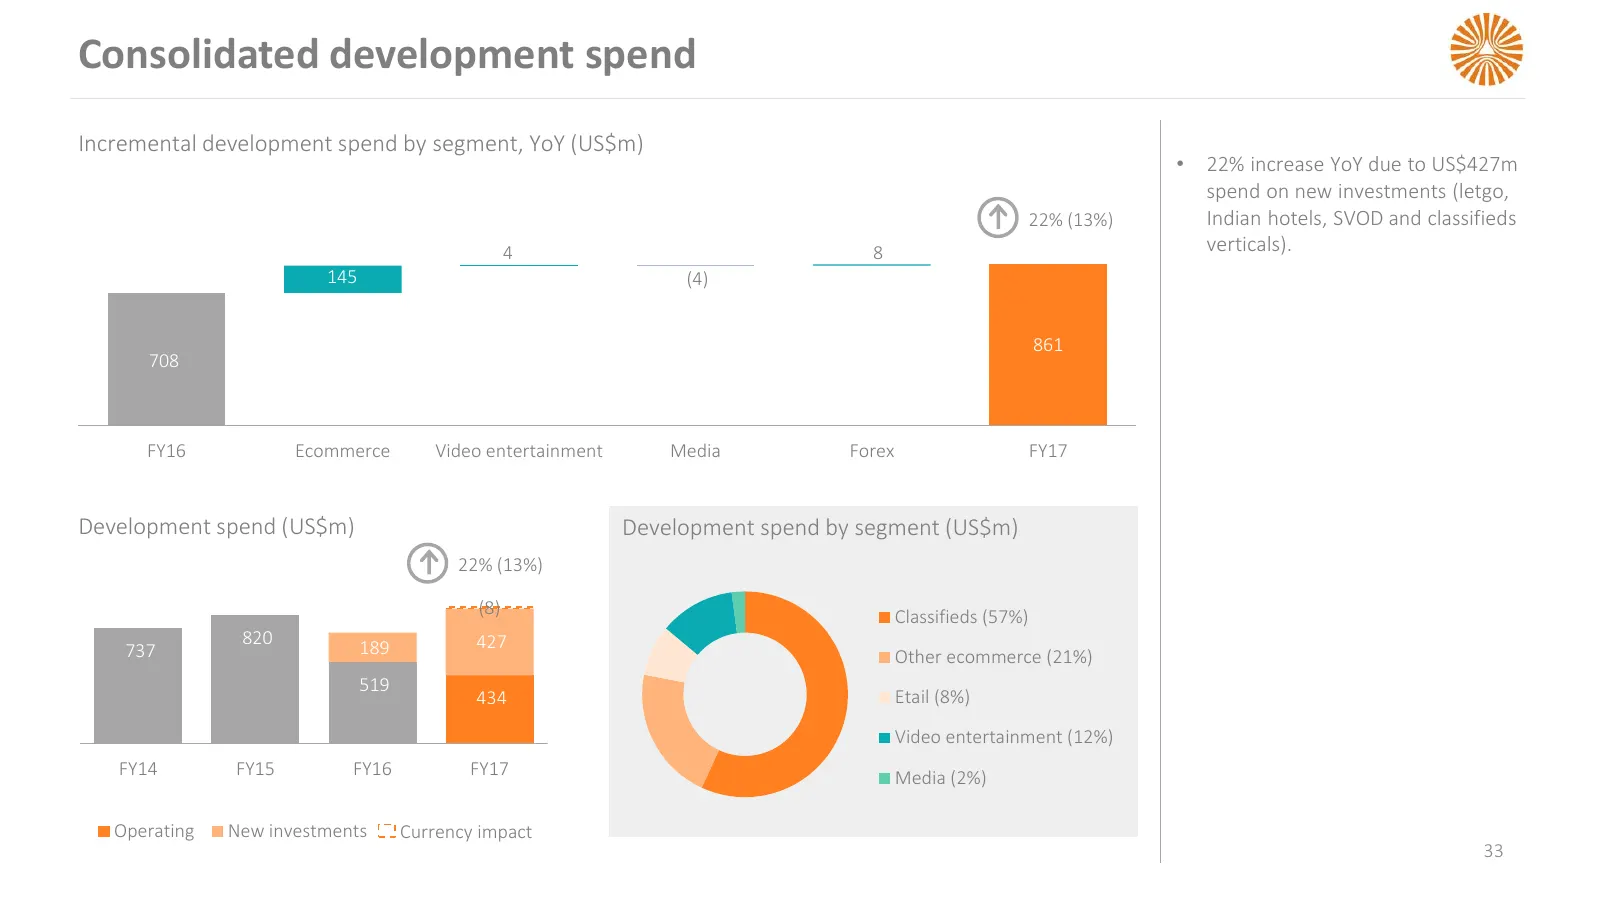
Slide 33: Consolidated development spend
Consolidated development spend Incremental development spend by segment, YoY (US$m) • 22% increase YoY due to US$427m spend on new investments (letgo, 22% (13%) Indian hotels, SVOD and classifieds 4 8 verticals). 145 (4) 861 708 FY16 Ecommerce Video entertainment Media Forex FY17 Development spend (
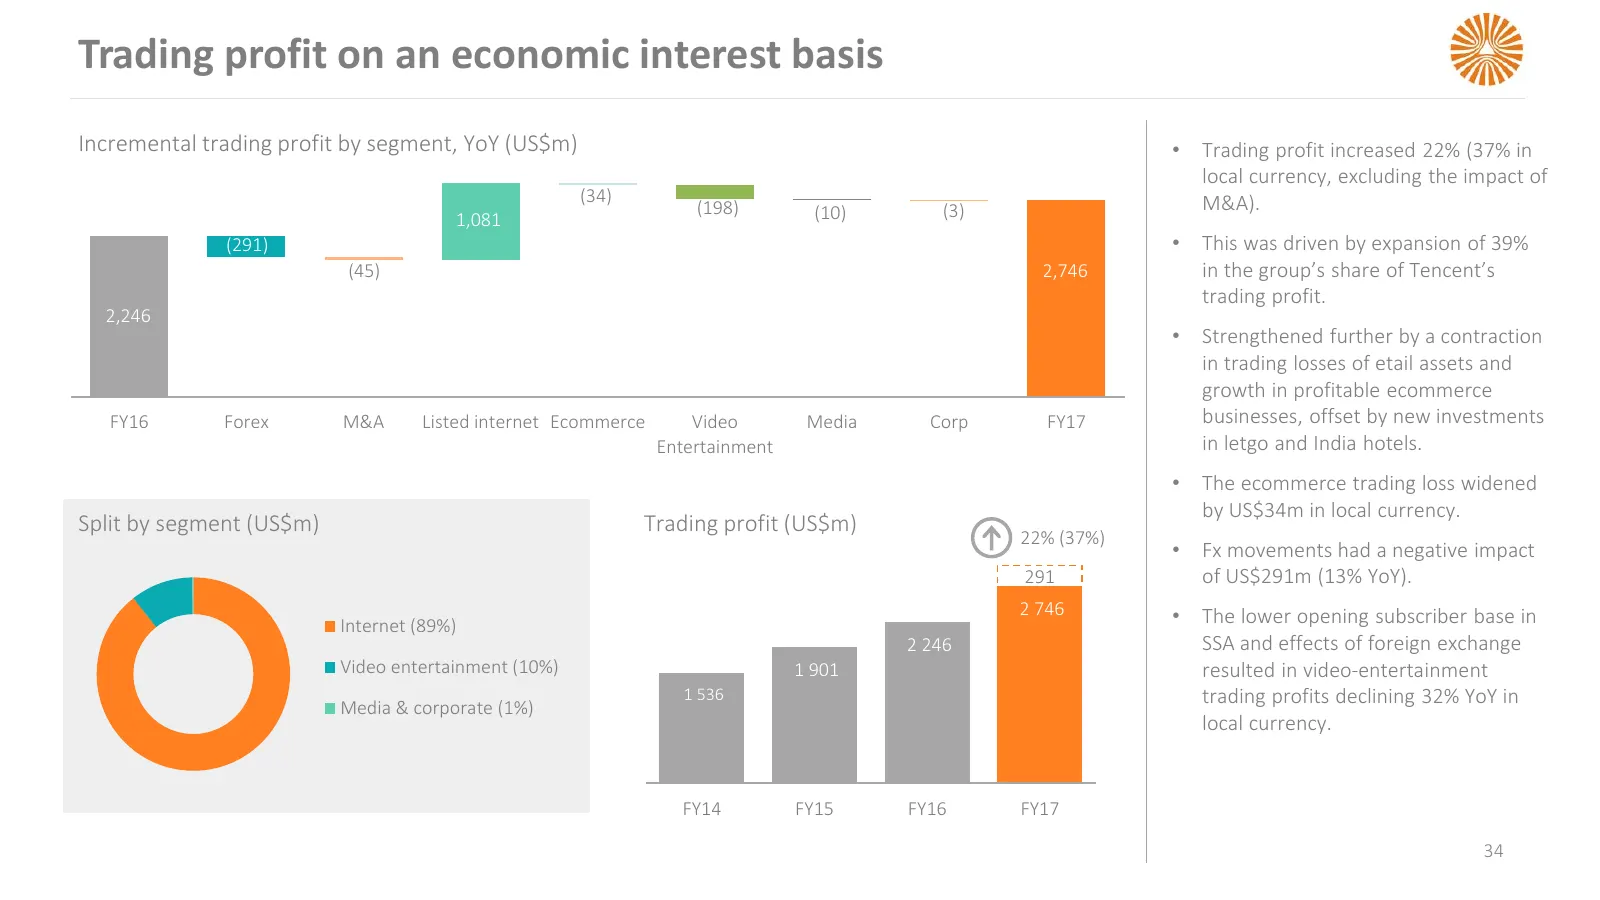
Slide 34: Trading profit on an economic interest basis
Trading profit on an economic interest basis Incremental trading profit by segment, YoY (US$m) • Trading profit increased 22% (37% in local currency, excluding the impact of (34) M&A). (198) (10) (3) 1,081 (291) • This was driven by expansion of 39% (45) 2,746 in the group’s share of Tencent’s tradi
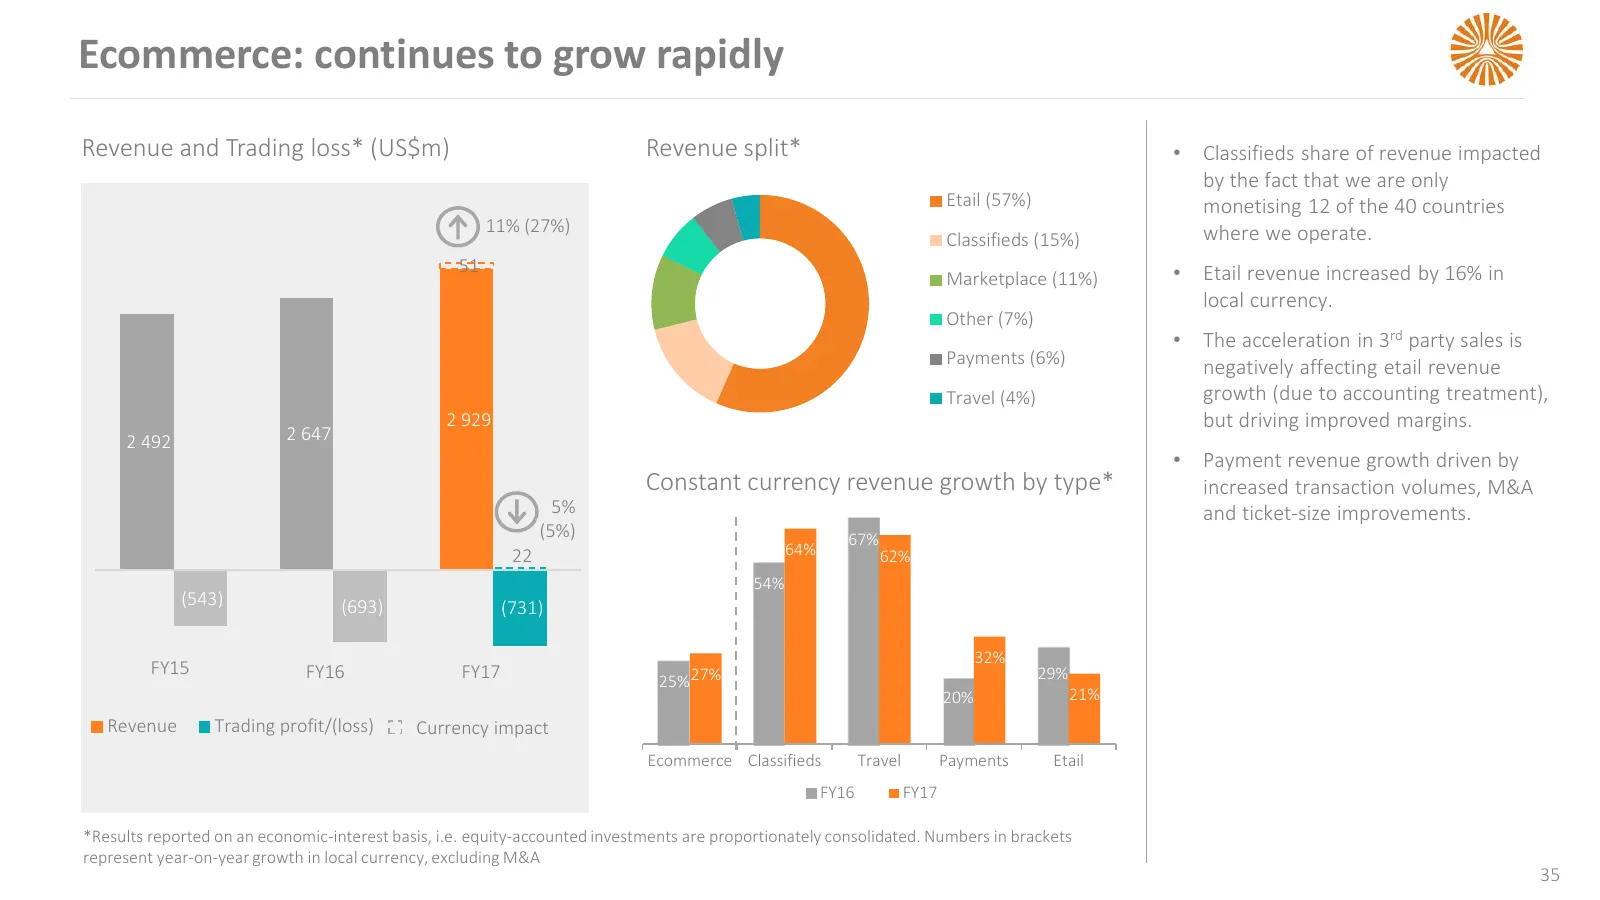
Slide 35: Ecommerce: continues to grow rapidly
Ecommerce: continues to grow rapidly Revenue and Trading loss* (US$m) Revenue split* • Classifieds share of revenue impacted by the fact that we are only Etail (57%) monetising 12 of the 40 countries 11% (27%) where we operate. Classifieds (15%) 51 • Etail revenue increased by 16% in Marketplace (11
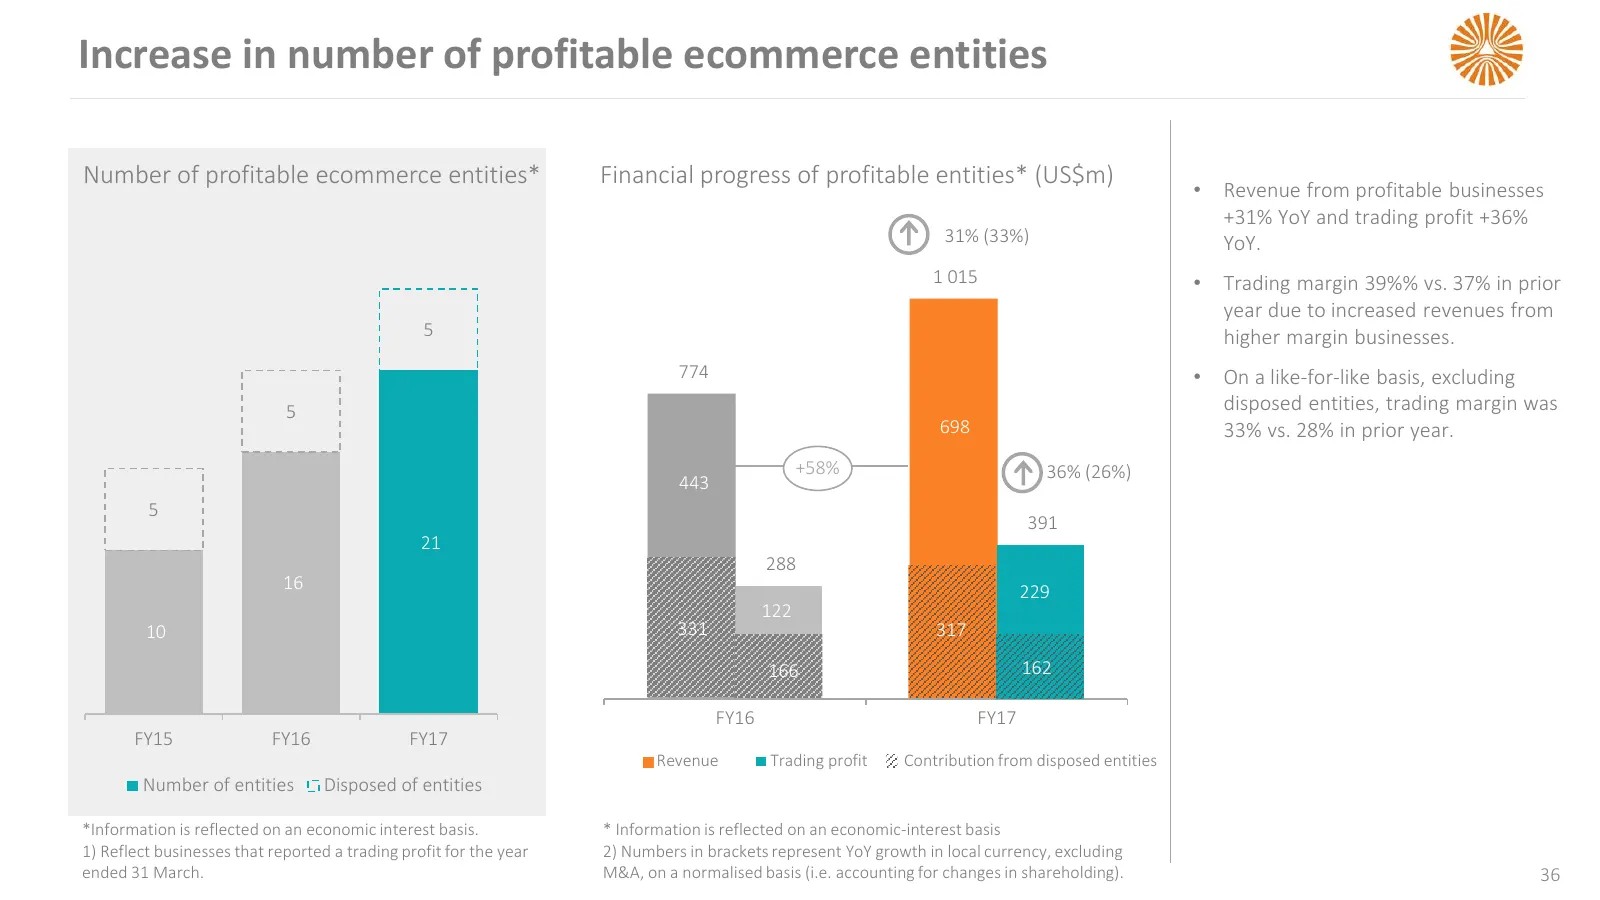
Slide 36: Increase in number of profitable ecommerce entities
Increase in number of profitable ecommerce entities Number of profitable ecommerce entities* Financial progress of profitable entities* (US$m) • Revenue from profitable businesses +31% YoY and trading profit +36% 31% (33%) YoY. 1 015 • Trading margin 39%% vs. 37% in prior year due to increased reven
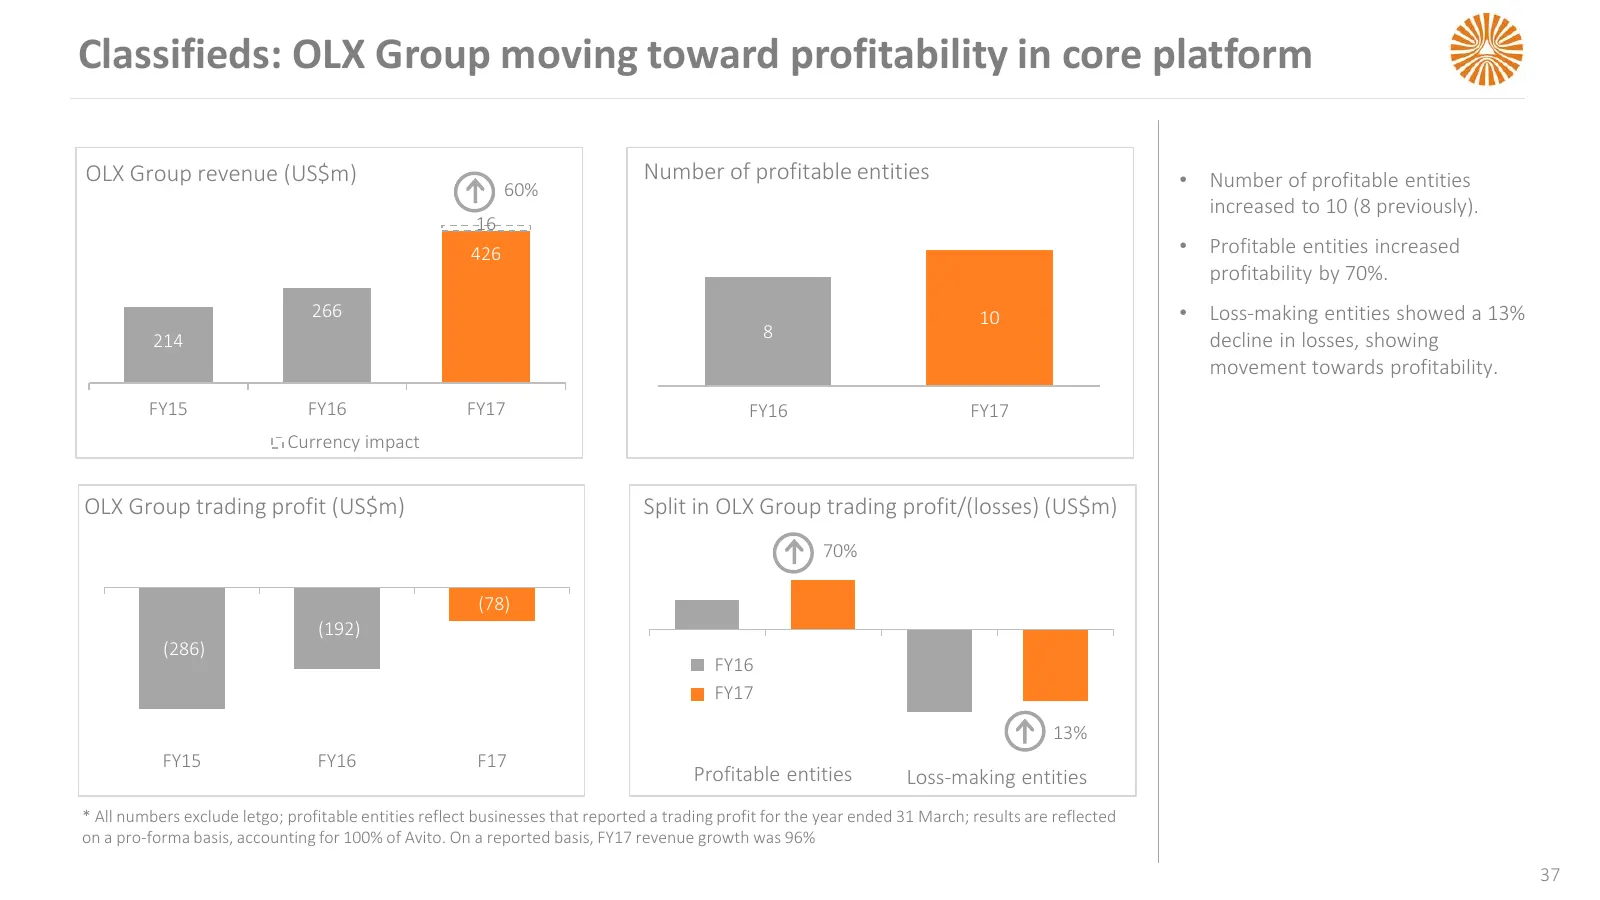
Slide 37: Classifieds: OLX Group moving toward profitability in core platform
Classifieds: OLX Group moving toward profitability in core platform OLX Group revenue (US$m) Number of profitable entities • Number of profitable entities 60% increased to 10 (8 previously). 16 426 • Profitable entities increased profitability by 70%. 266 10 • Loss-making entities showed a 13% 214 8
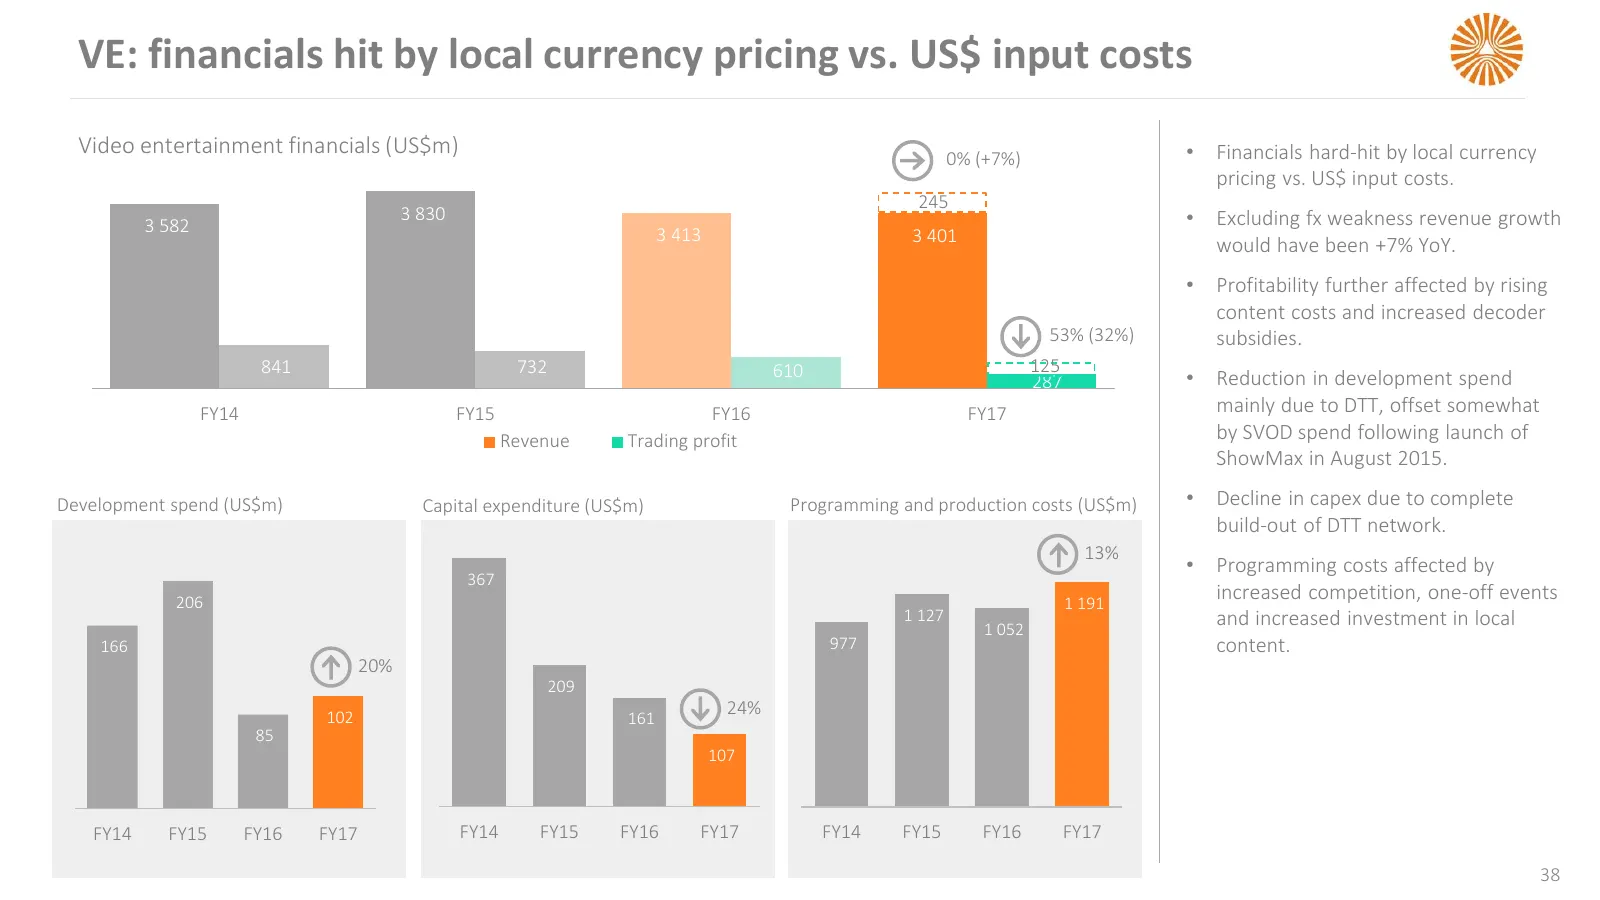
Slide 38: VE: financials hit by local currency pricing vs. US$ input costs
VE: financials hit by local currency pricing vs. US$ input costs Video entertainment financials (US$m) 0% (+7%) • Financials hard-hit by local currency pricing vs. US$ input costs. 245 3 830 • Excluding fx weakness revenue growth 3 582 3 413 3 401 would have been +7% YoY. • Profitability further aff
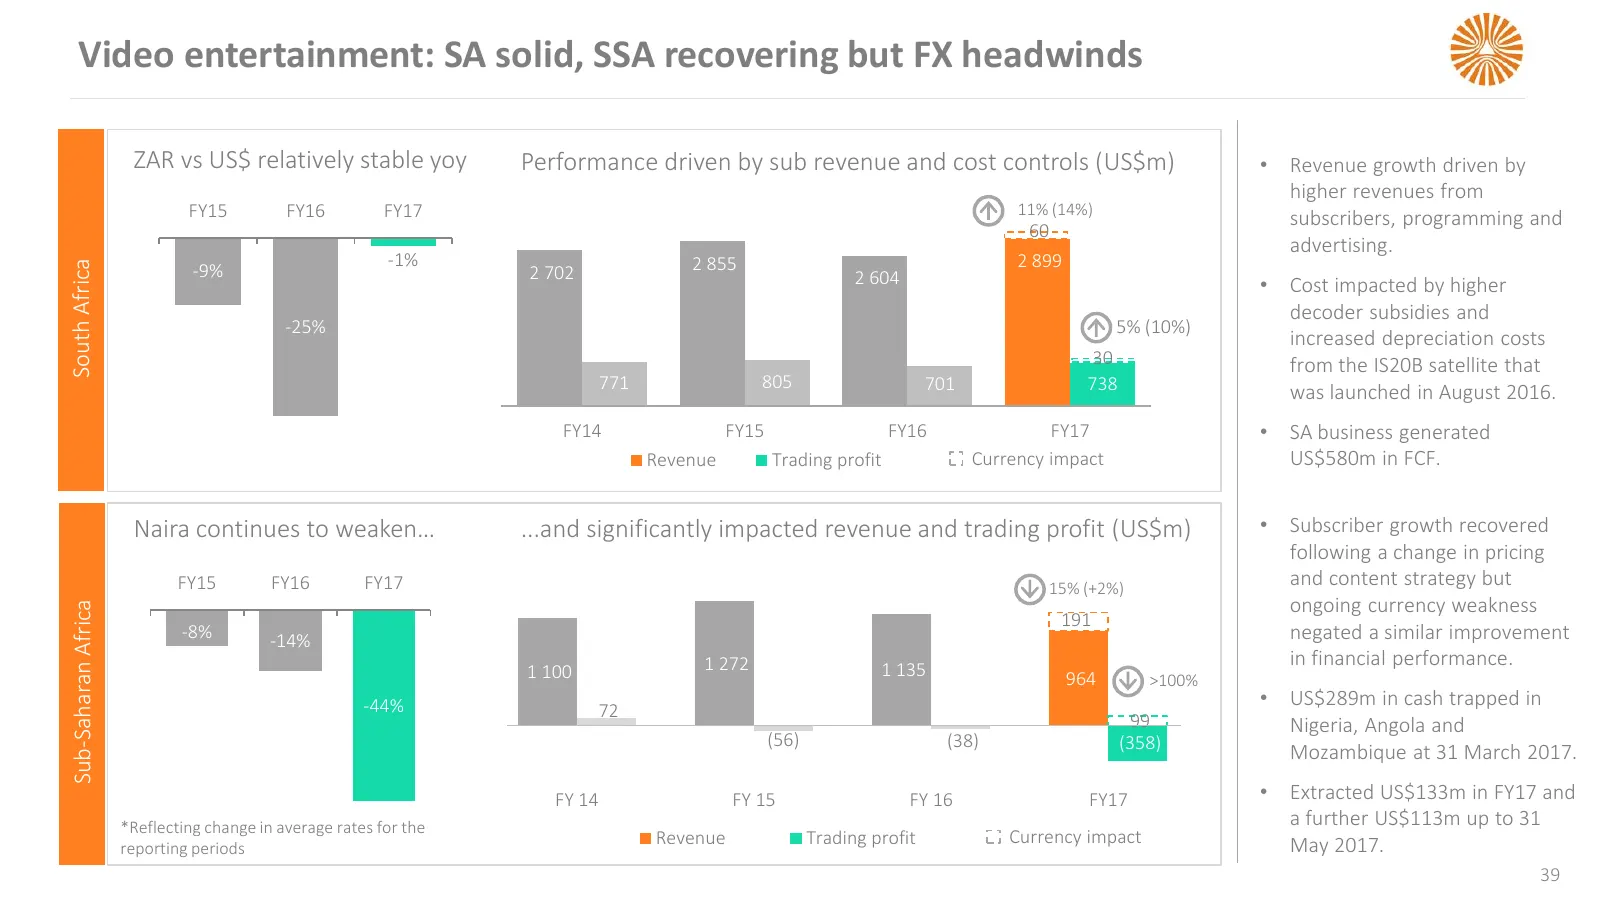
Slide 39: Video entertainment: SA solid, SSA recovering but FX headwinds
Video entertainment: SA solid, SSA recovering but FX headwinds ZAR vs US$ relatively stable yoy Performance driven by sub revenue and cost controls (US$m) • Revenue growth driven by higher revenues from FY15 FY16 FY17 11% (14%) subscribers, programming and 60 advertising. -1% 2 855 2 899 South Afric
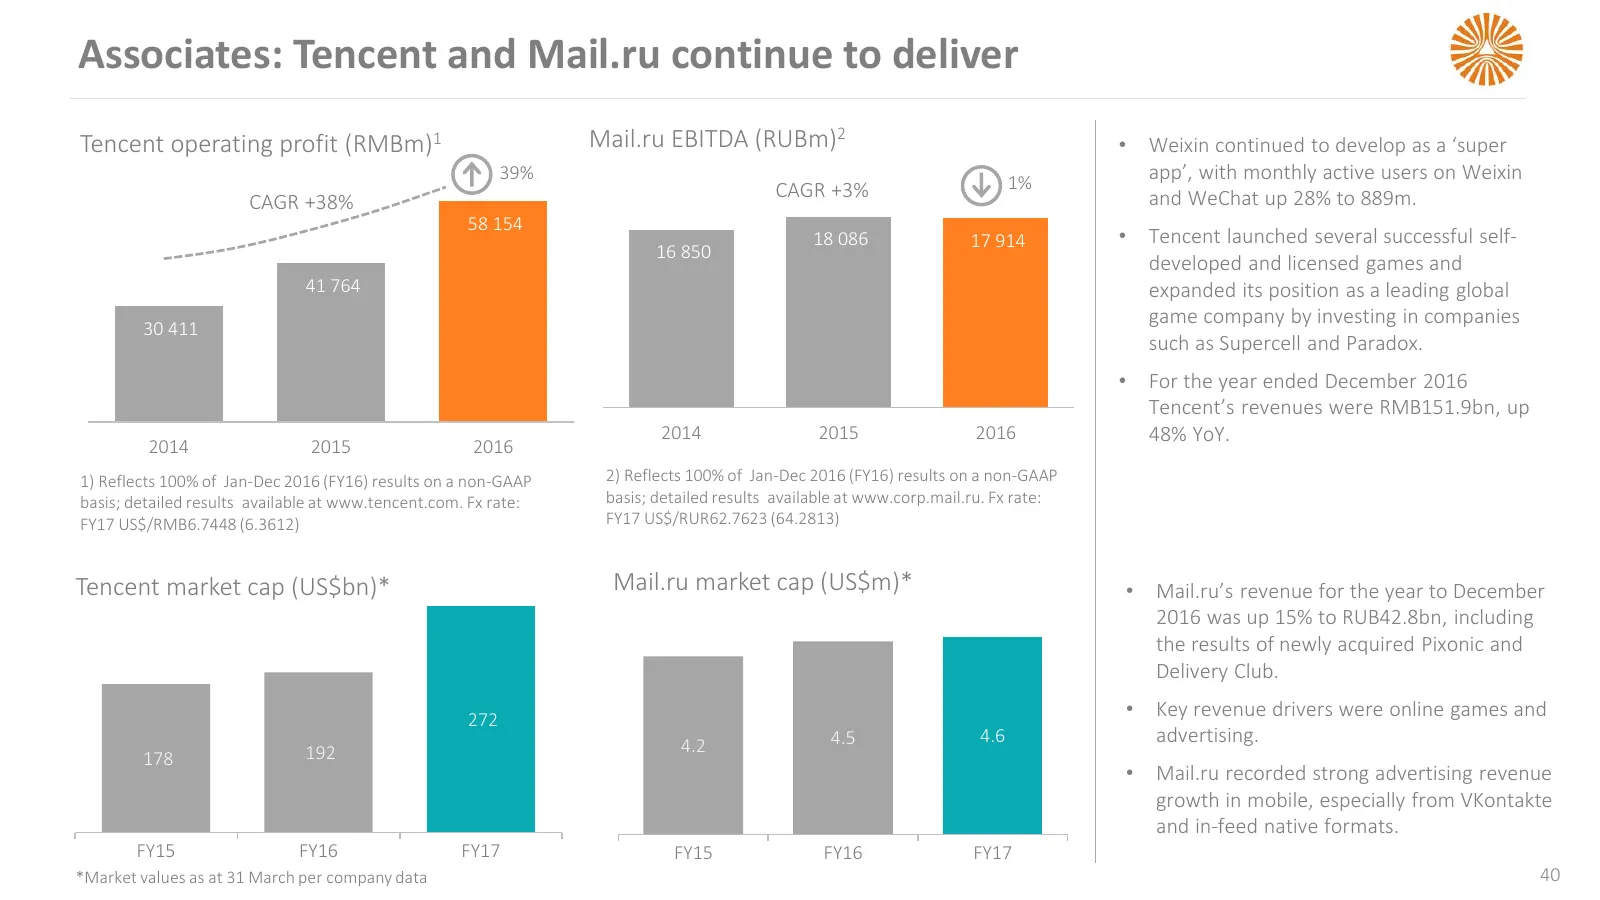
Slide 40: Associates: Tencent and Mail.ru continue to deliver
Associates: Tencent and Mail.ru continue to deliver Tencent operating profit (RMBm)1 Mail.ru EBITDA (RUBm)2 • Weixin continued to develop as a ‘super 39% 1% app’, with monthly active users on Weixin CAGR +3% and WeChat up 28% to 889m. CAGR +38% 58 154 18 086 17 914 • Tencent launched several success
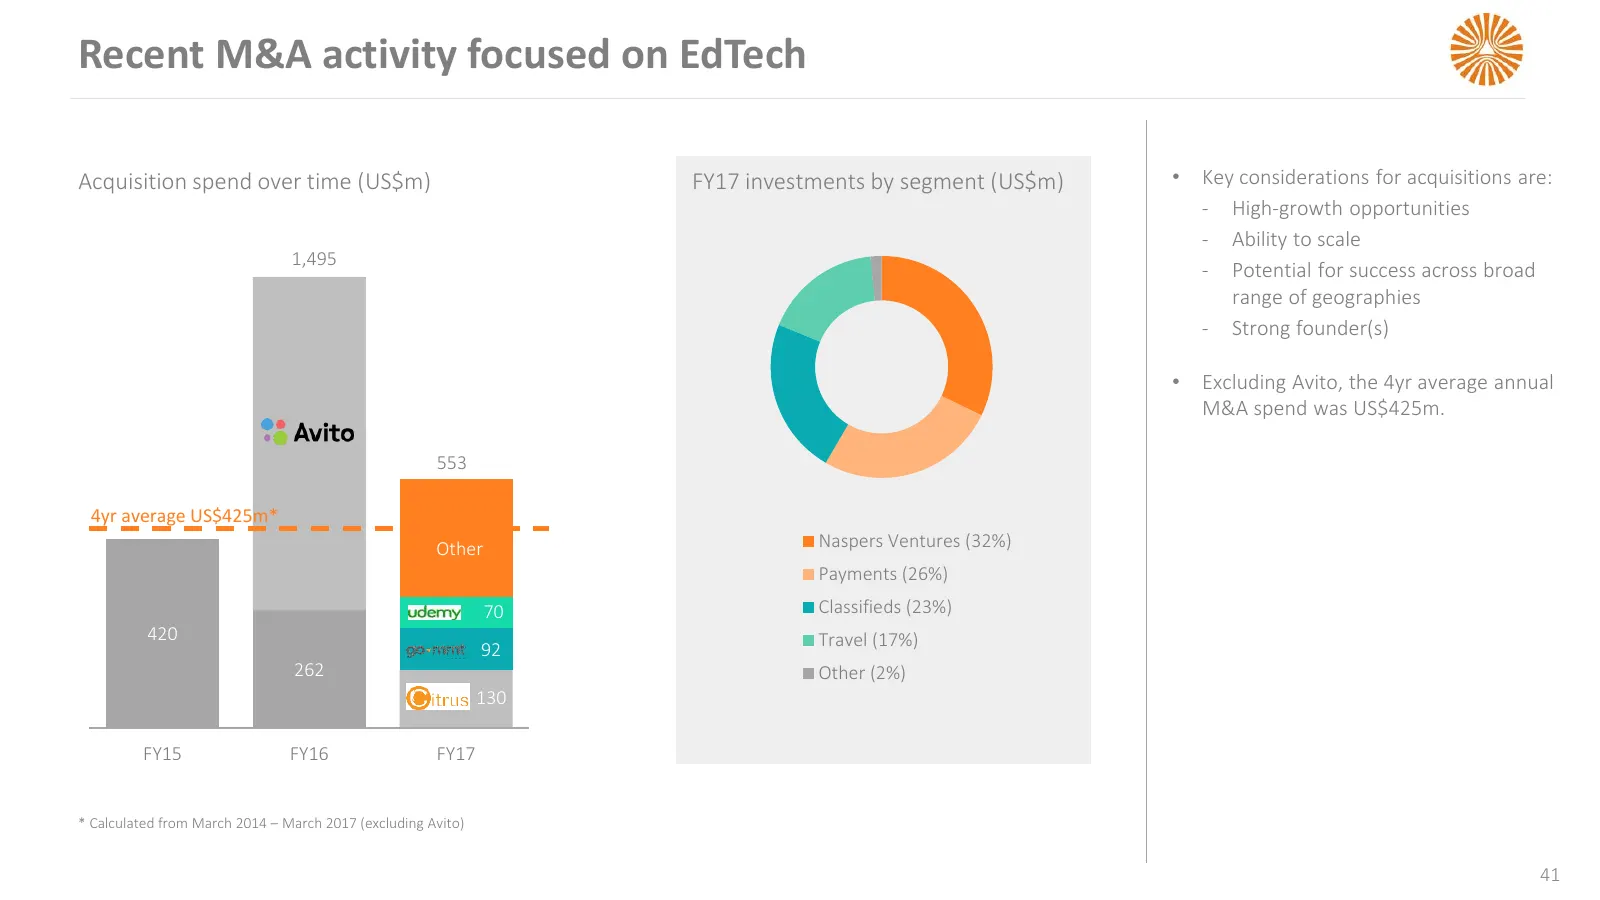
Slide 41: Recent M&A activity focused on EdTech
Recent M&A activity focused on EdTech Acquisition spend over time (US$m) FY17 investments by segment (US$m) • Key considerations for acquisitions are: ‐ High-growth opportunities ‐ Ability to scale 1,495 Other ‐ Potential for success across broad range of geographies ‐ Strong founder(s) • Excluding
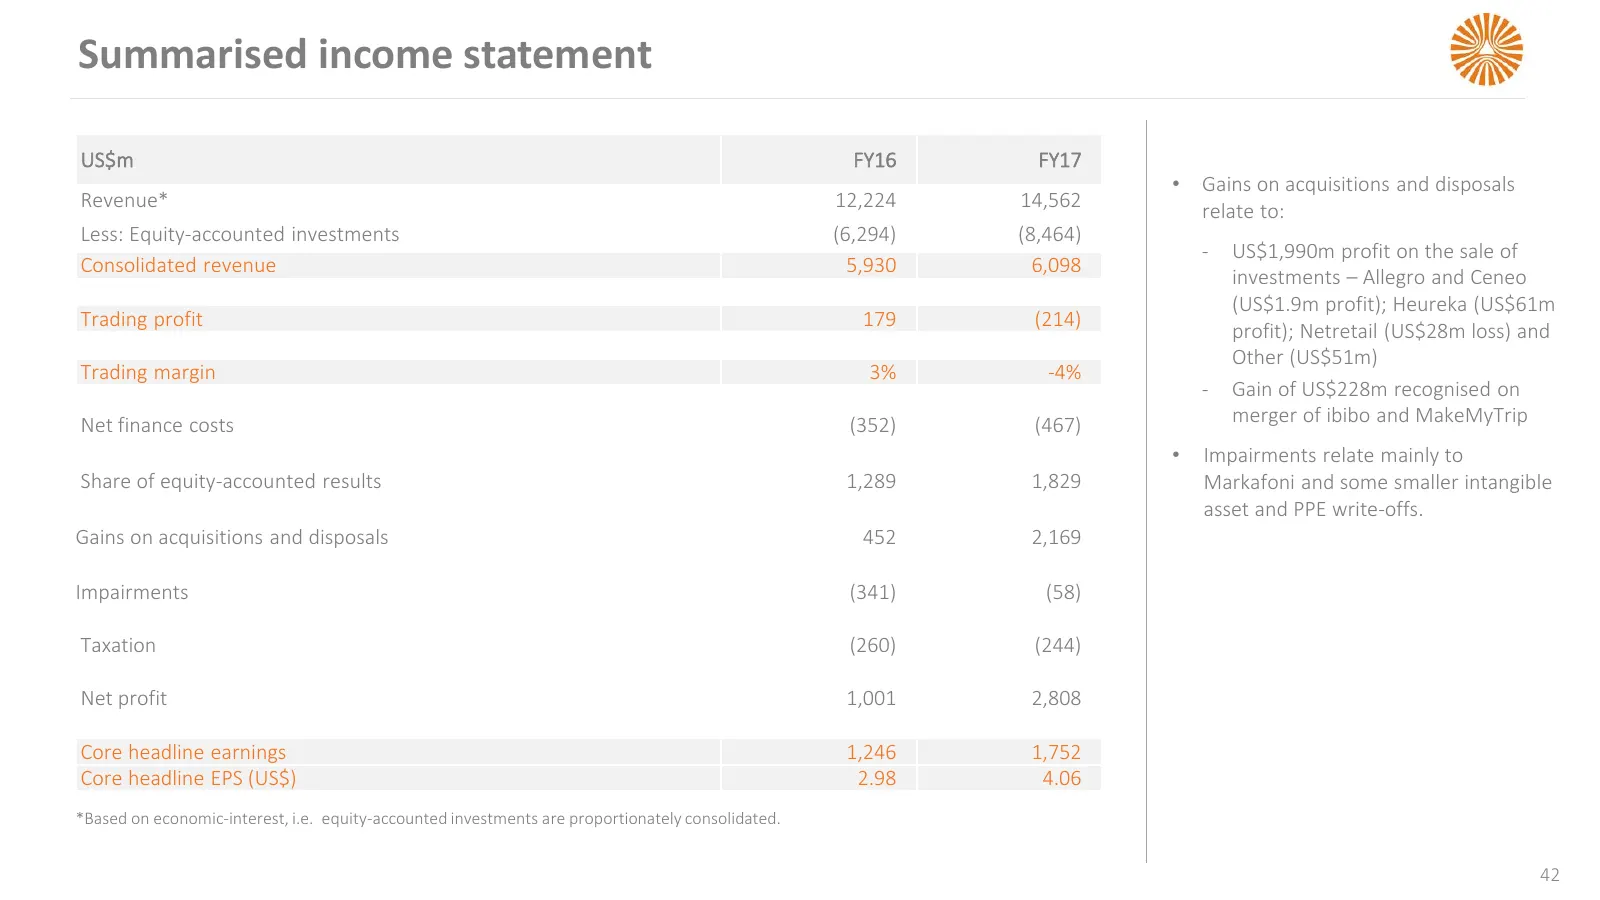
Slide 42: Summarised income statement
Summarised income statement US$m FY16 FY17 • Gains on acquisitions and disposals Revenue* 12,224 14,562 relate to: Less: Equity-accounted investments (6,294) (8,464) ‐ US$1,990m profit on the sale of Consolidated revenue 5,930 6,098 investments – Allegro and Ceneo (US$1.9m profit); Heureka (US$61m T
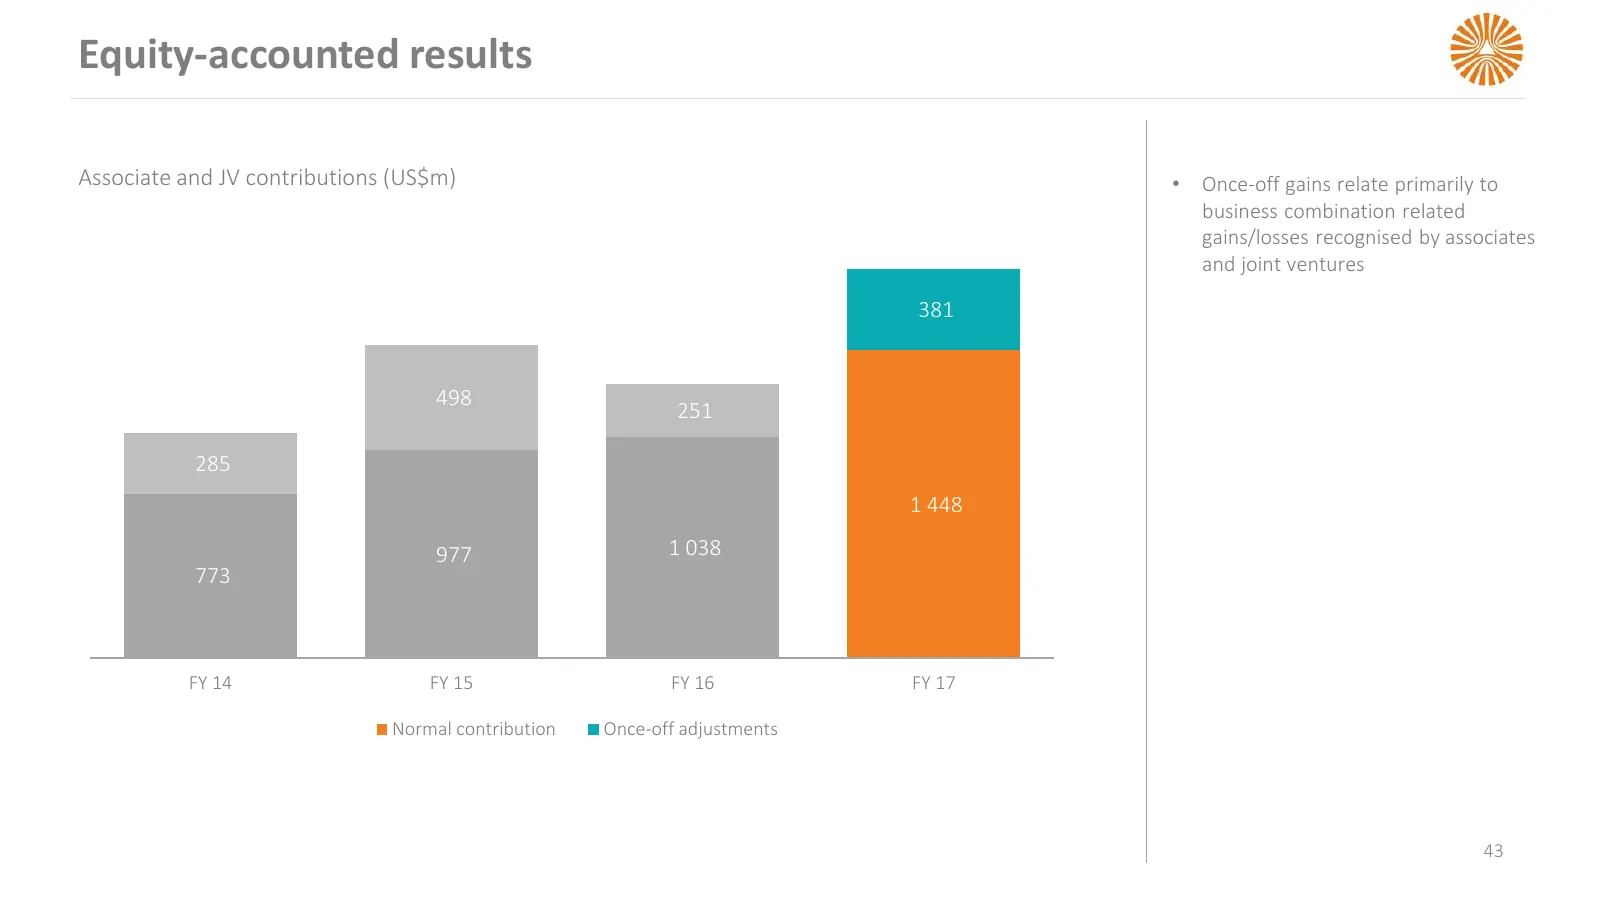
Slide 43: Equity-accounted results
Equity-accounted results Associate and JV contributions (US$m) • Once-off gains relate primarily to business combination related gains/losses recognised by associates and joint ventures 381 498 251 285 1 448 977 1 038 773 FY 14 FY 15 FY 16 FY 17 Normal contribution Once-off adjustments 43
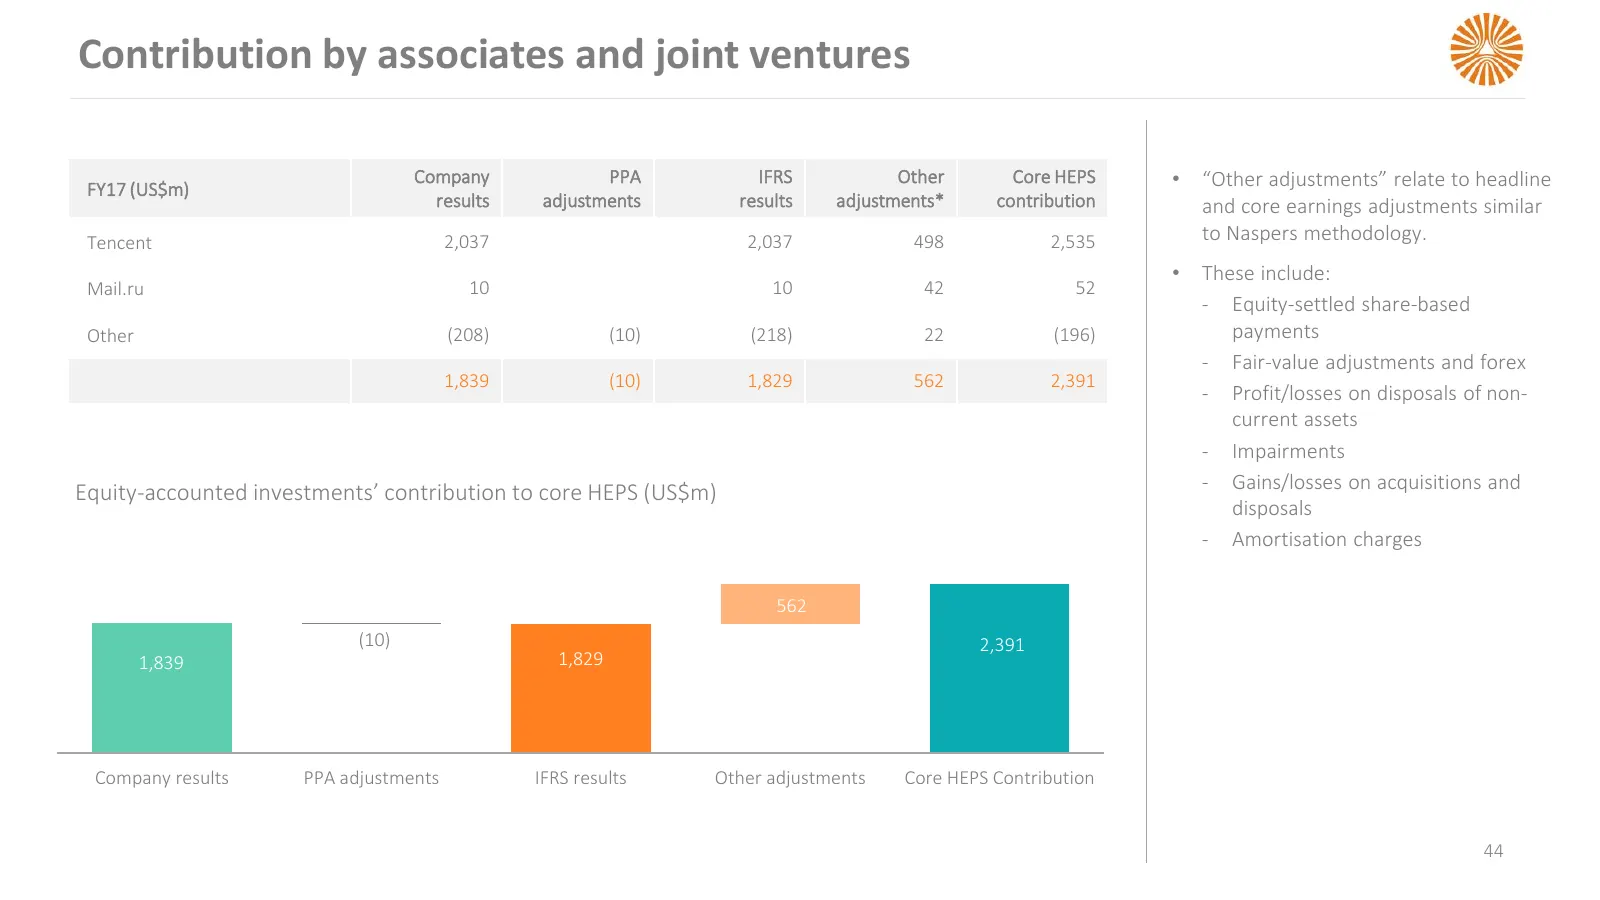
Slide 44: Contribution by associates and joint ventures
Contribution by associates and joint ventures FY17 (US$m) Company PPA IFRS Other Core HEPS • “Other adjustments” relate to headline results adjustments results adjustments* contribution and core earnings adjustments similar Tencent 2,037 2,037 498 2,535 to Naspers methodology. • These include: Mail.
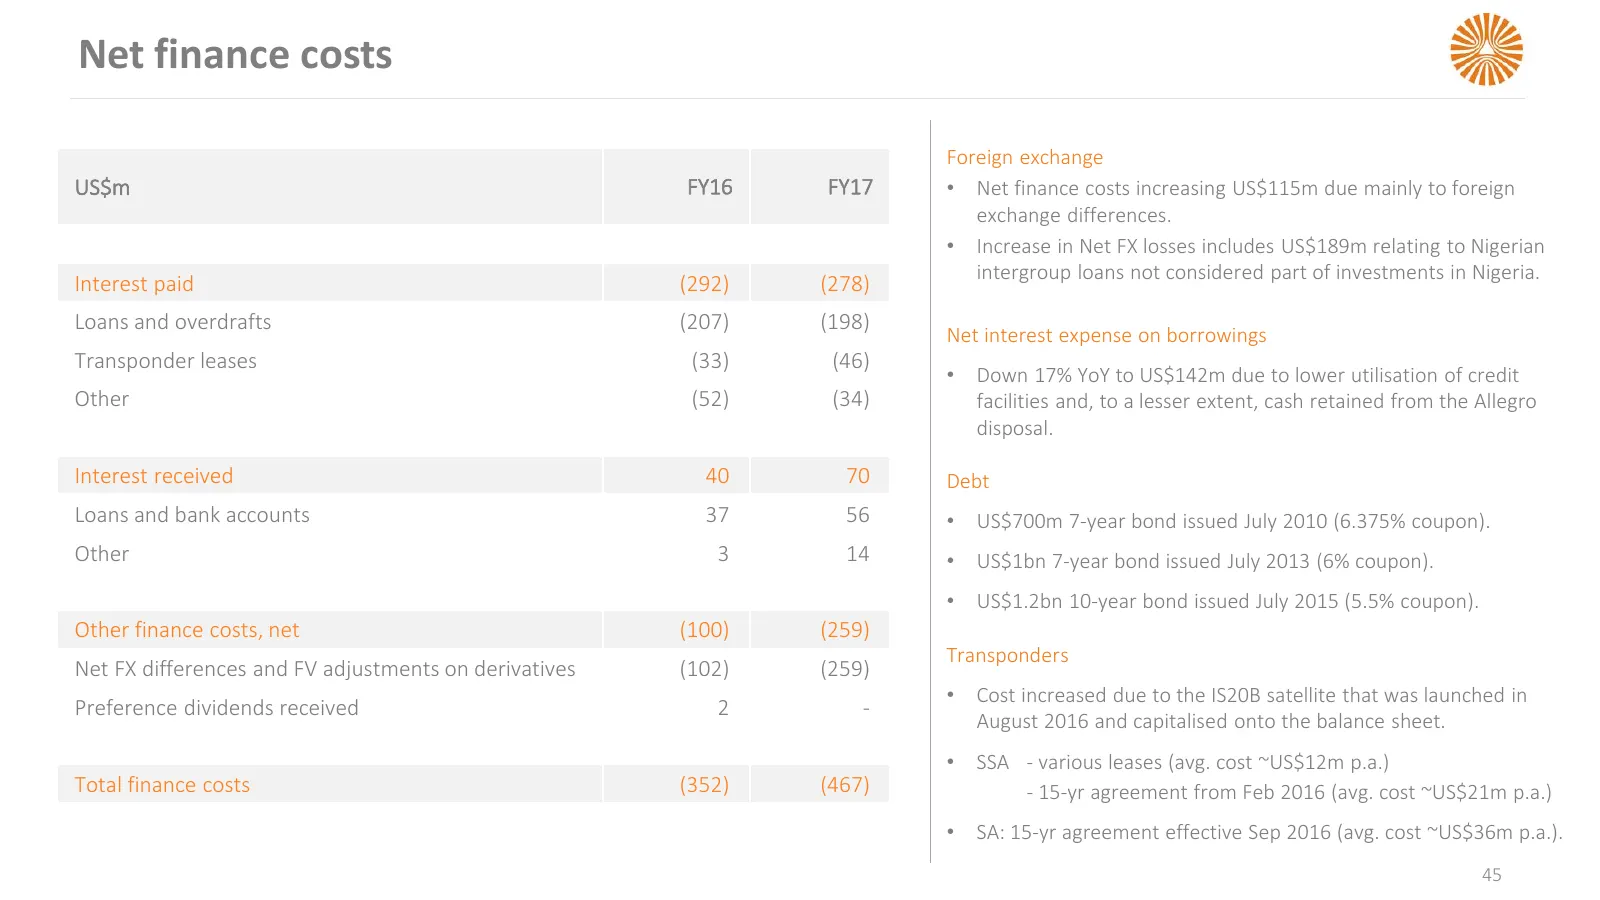
Slide 45: Net finance costs
Net finance costs Foreign exchange US$m FY16 FY17 • Net finance costs increasing US$115m due mainly to foreign exchange differences. • Increase in Net FX losses includes US$189m relating to Nigerian intergroup loans not considered part of investments in Nigeria. Interest paid (292) (278) Loans and o
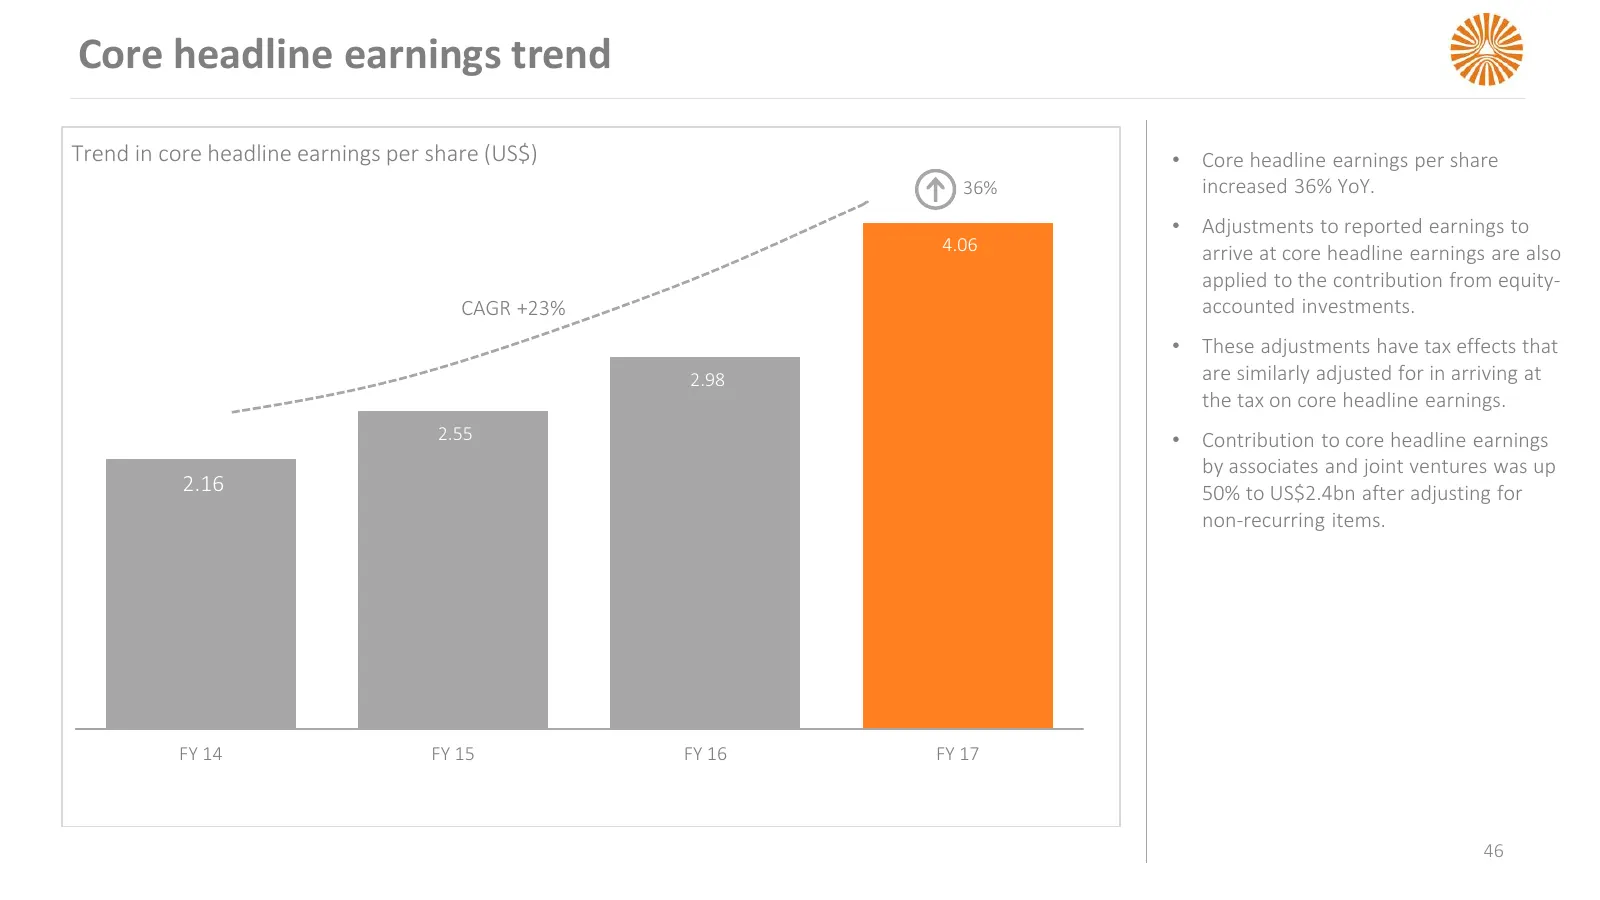
Slide 46: Core headline earnings trend
Core headline earnings trend Trend in core headline earnings per share (US$) • Core headline earnings per share 36% increased 36% YoY. • Adjustments to reported earnings to 4.06 arrive at core headline earnings are also applied to the contribution from equity- CAGR +23% accounted investments. • Thes
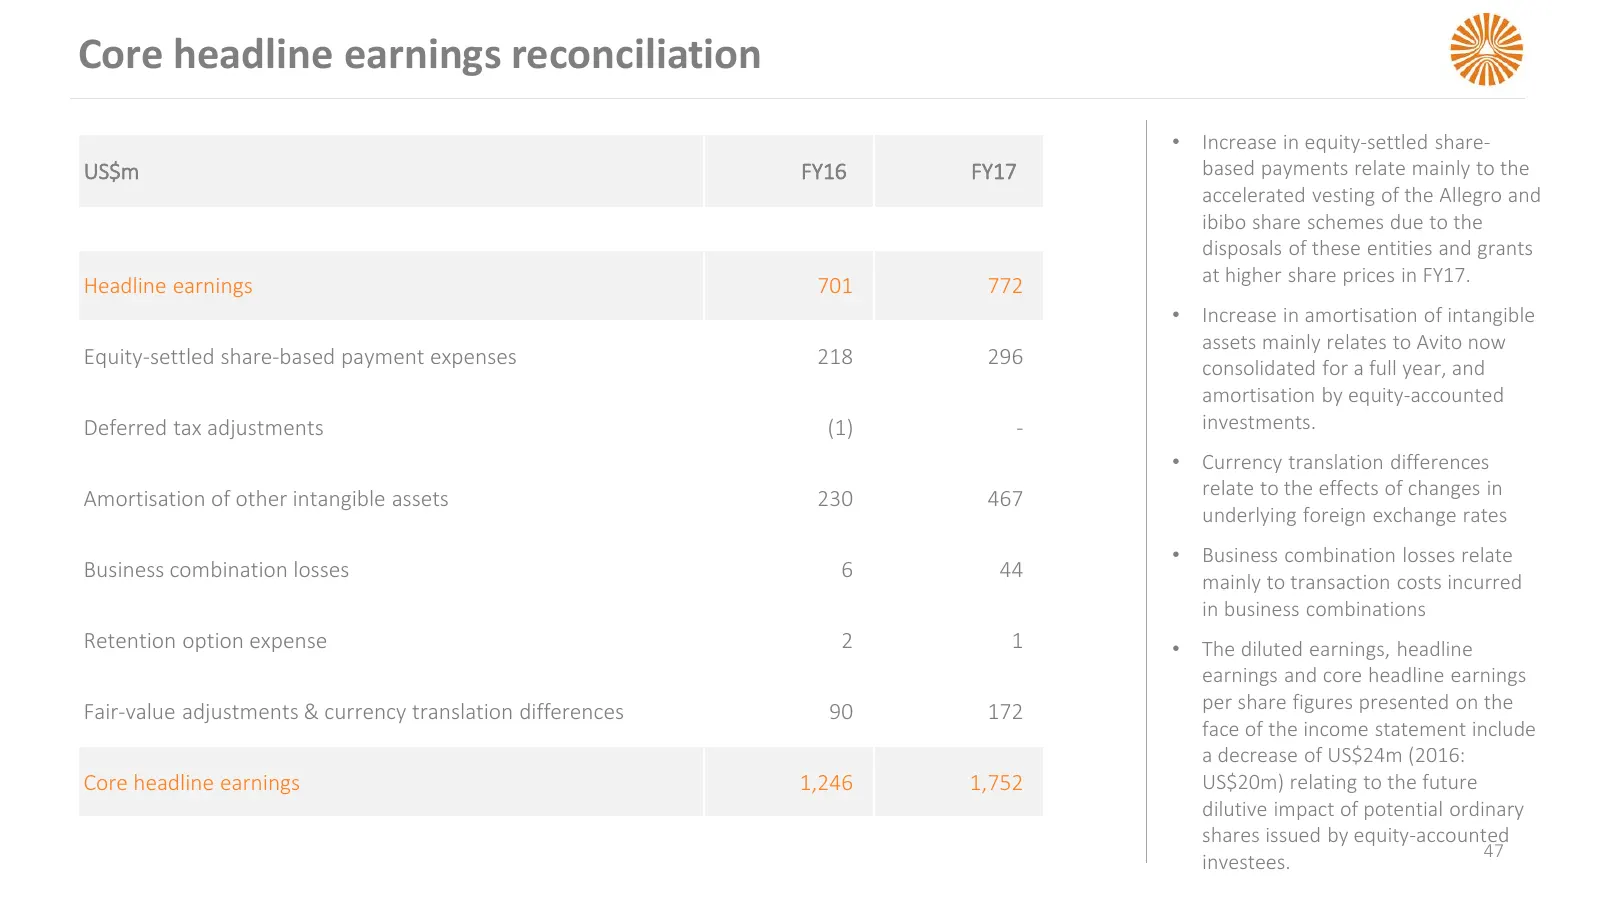
Slide 47: Core headline earnings reconciliation
Core headline earnings reconciliation • Increase in equity-settled share- US$m FY16 FY17 based payments relate mainly to the accelerated vesting of the Allegro and ibibo share schemes due to the disposals of these entities and grants Headline earnings 701 772 at higher share prices in FY17. • Increa
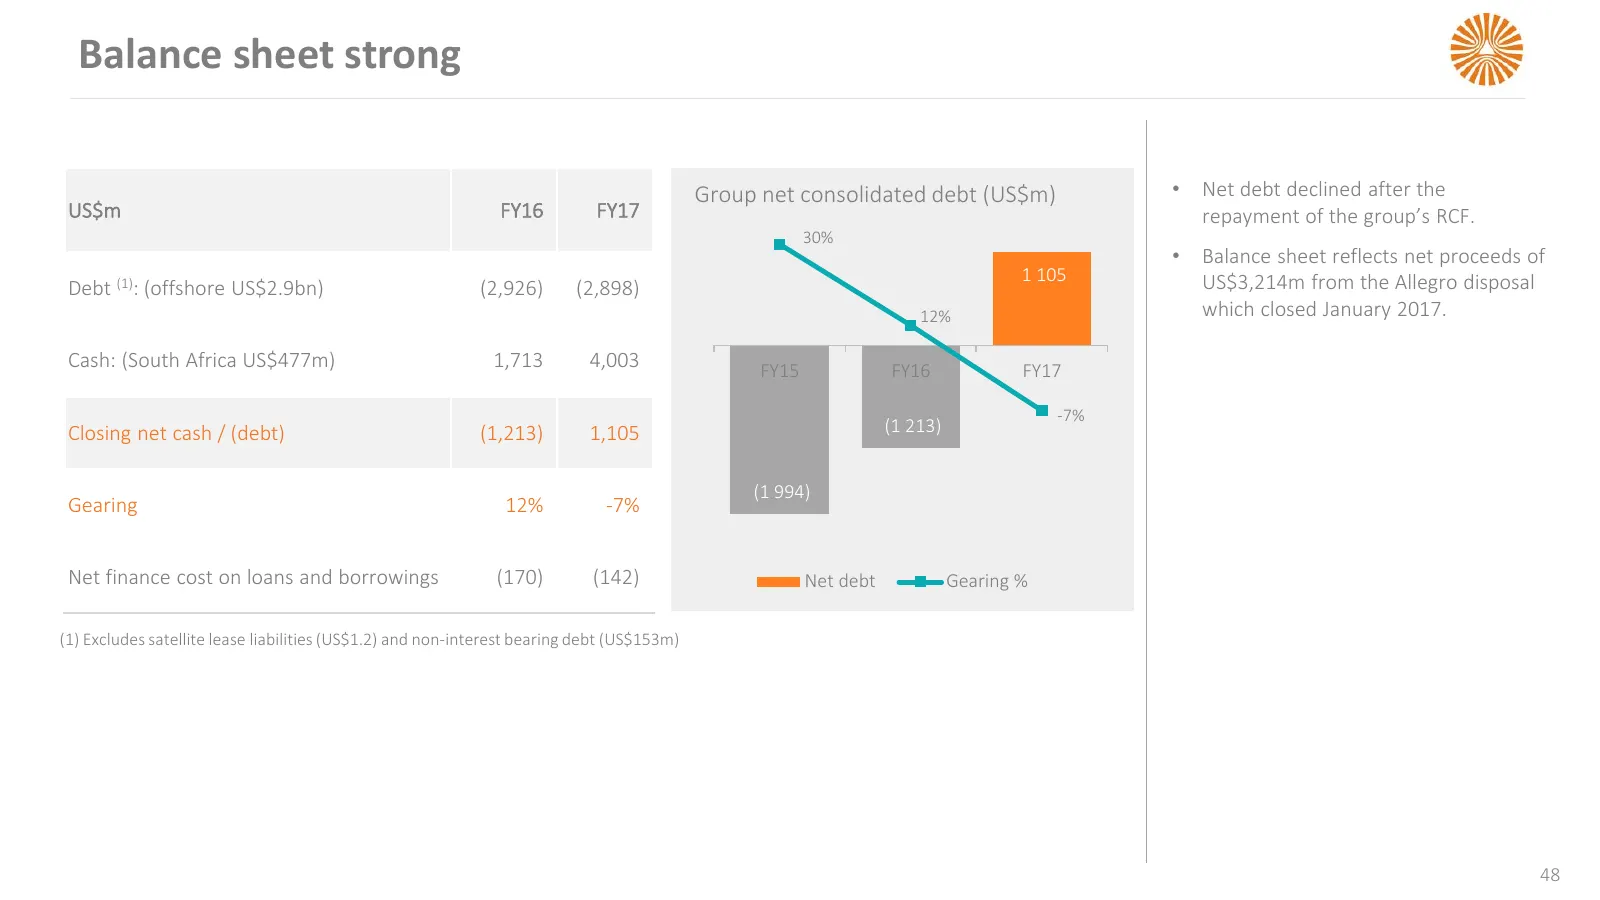
Slide 48: Balance sheet strong
Balance sheet strong Group net consolidated debt (US$m) • Net debt declined after the US$m FY16 FY17 repayment of the group’s RCF. 30% 30% • Balance sheet reflects net proceeds of 1 105 US$3,214m from the Allegro disposal Debt (1): (offshore US$2.9bn) (2,926) (2,898) 20% 12% which closed January 201
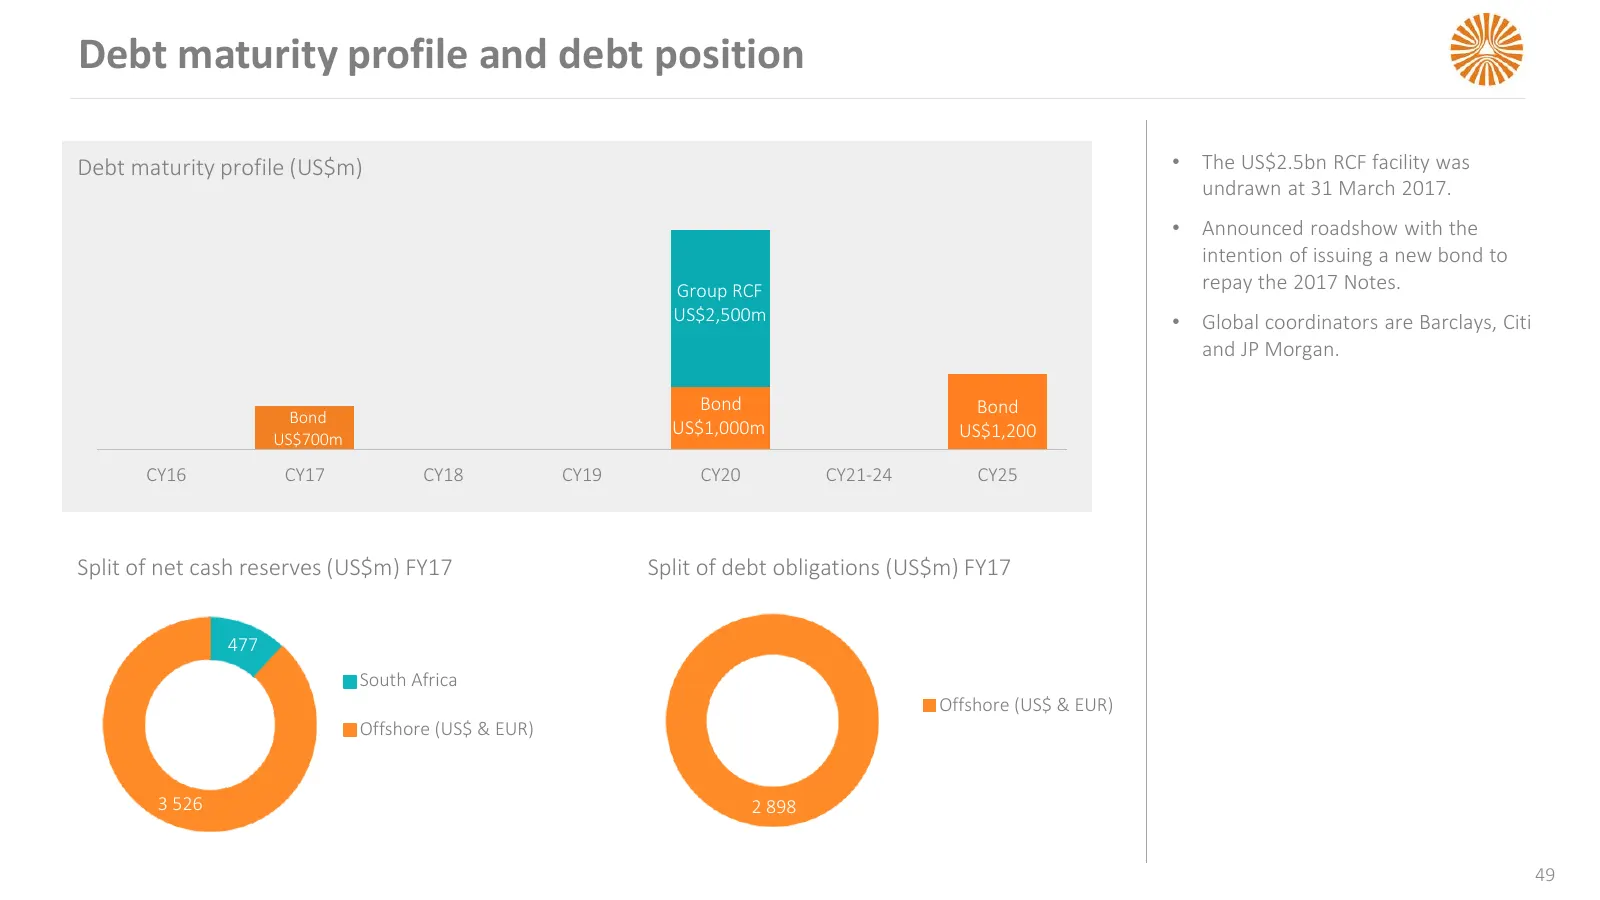
Slide 49: Debt maturity profile and debt position
Debt maturity profile and debt position Debt maturity profile (US$m) • The US$2.5bn RCF facility was undrawn at 31 March 2017. • Announced roadshow with the intention of issuing a new bond to Group RCF repay the 2017 Notes. US$2,500m • Global coordinators are Barclays, Citi and JP Morgan. Bond Bond
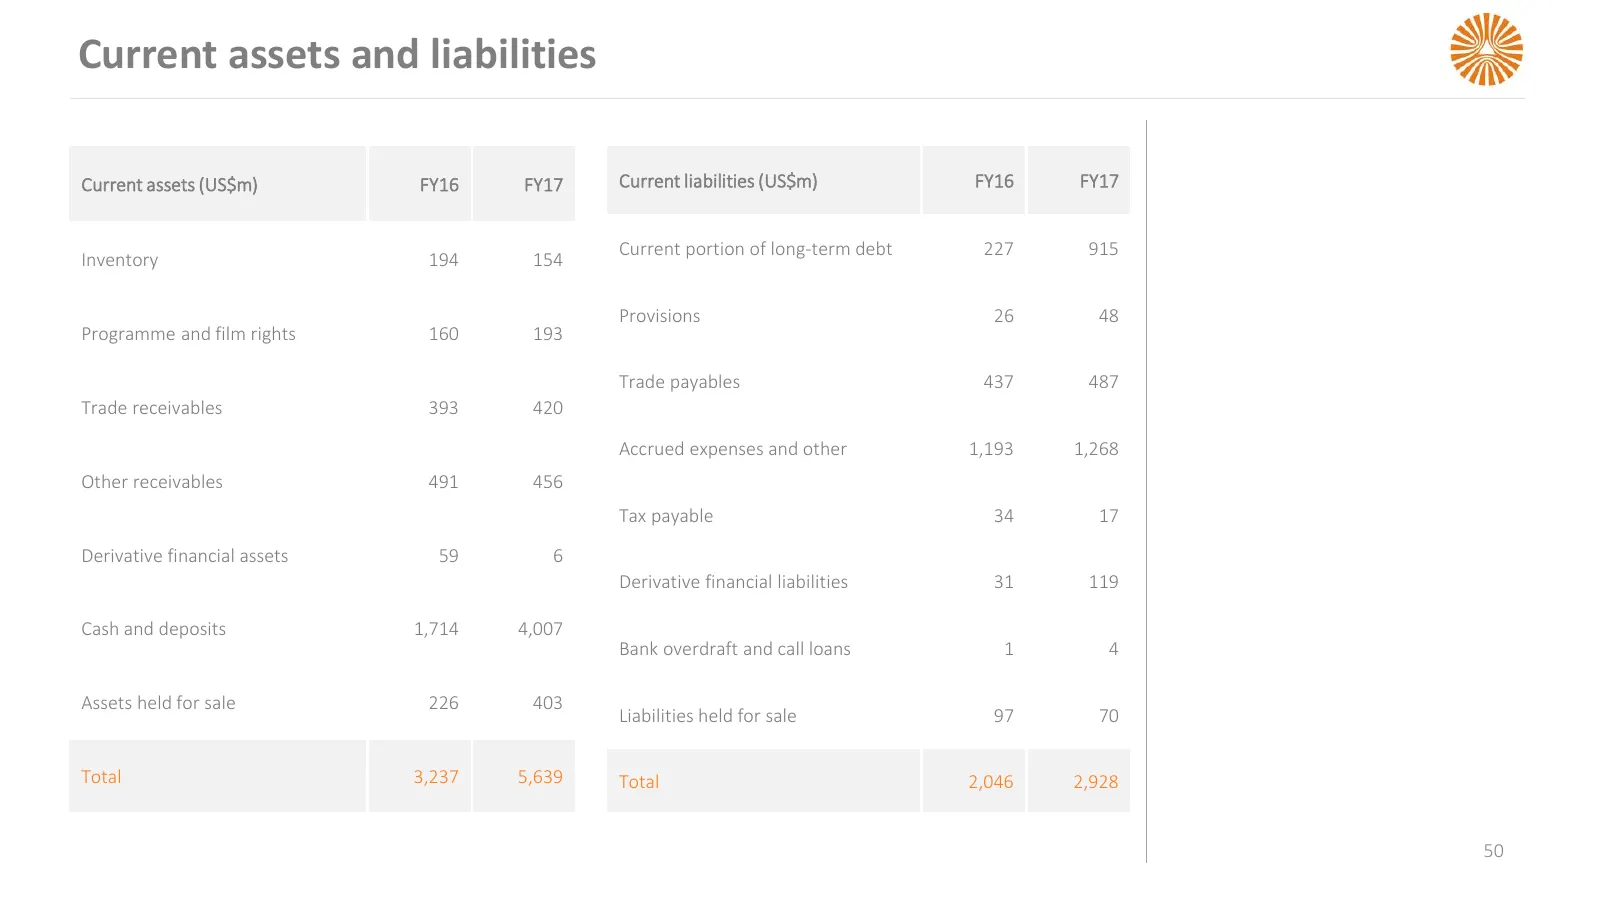
Slide 50: Current assets and liabilities
Current assets and liabilities Current assets (US$m) FY16 FY17 Current liabilities (US$m) FY16 FY17 Current portion of long-term debt 227 915 Inventory 194 154 Provisions 26 48 Programme and film rights 160 193 Trade payables 437 487 Trade receivables 393 420 Accrued expenses and other 1,193 1,268 O
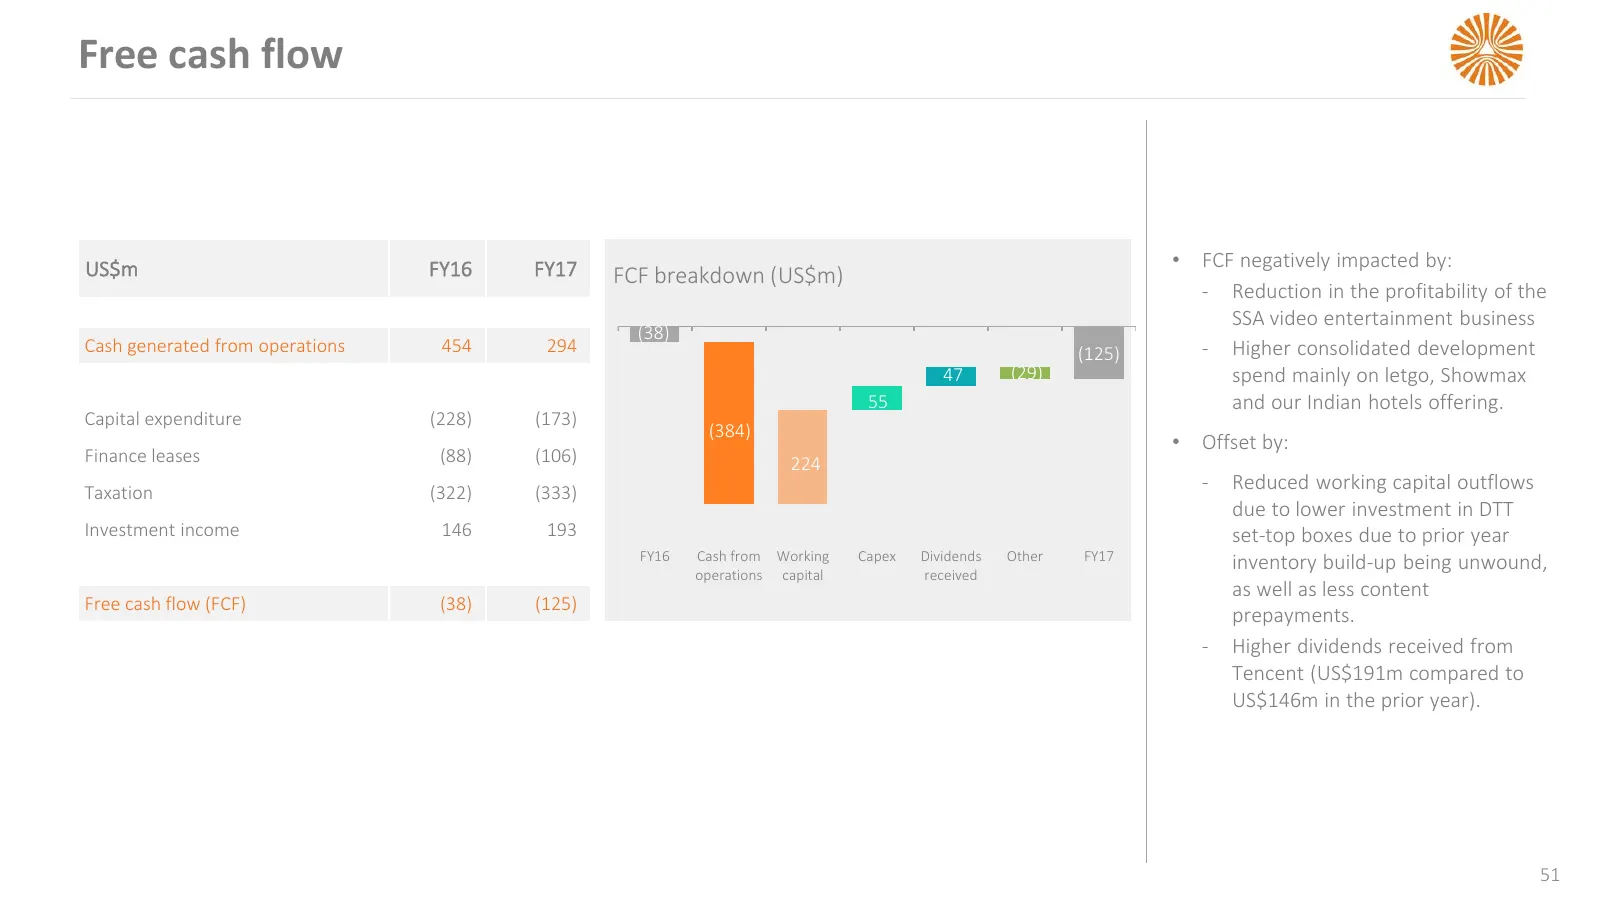
Slide 51: Free cash flow
Free cash flow US$m FY16 FY17 • FCF negatively impacted by: FCF breakdown (US$m) ‐ Reduction in the profitability of the SSA video entertainment business (38) Cash generated from operations 454 294 (125) ‐ Higher consolidated development 47 (29) spend mainly on letgo, Showmax 55 and our Indian hotel
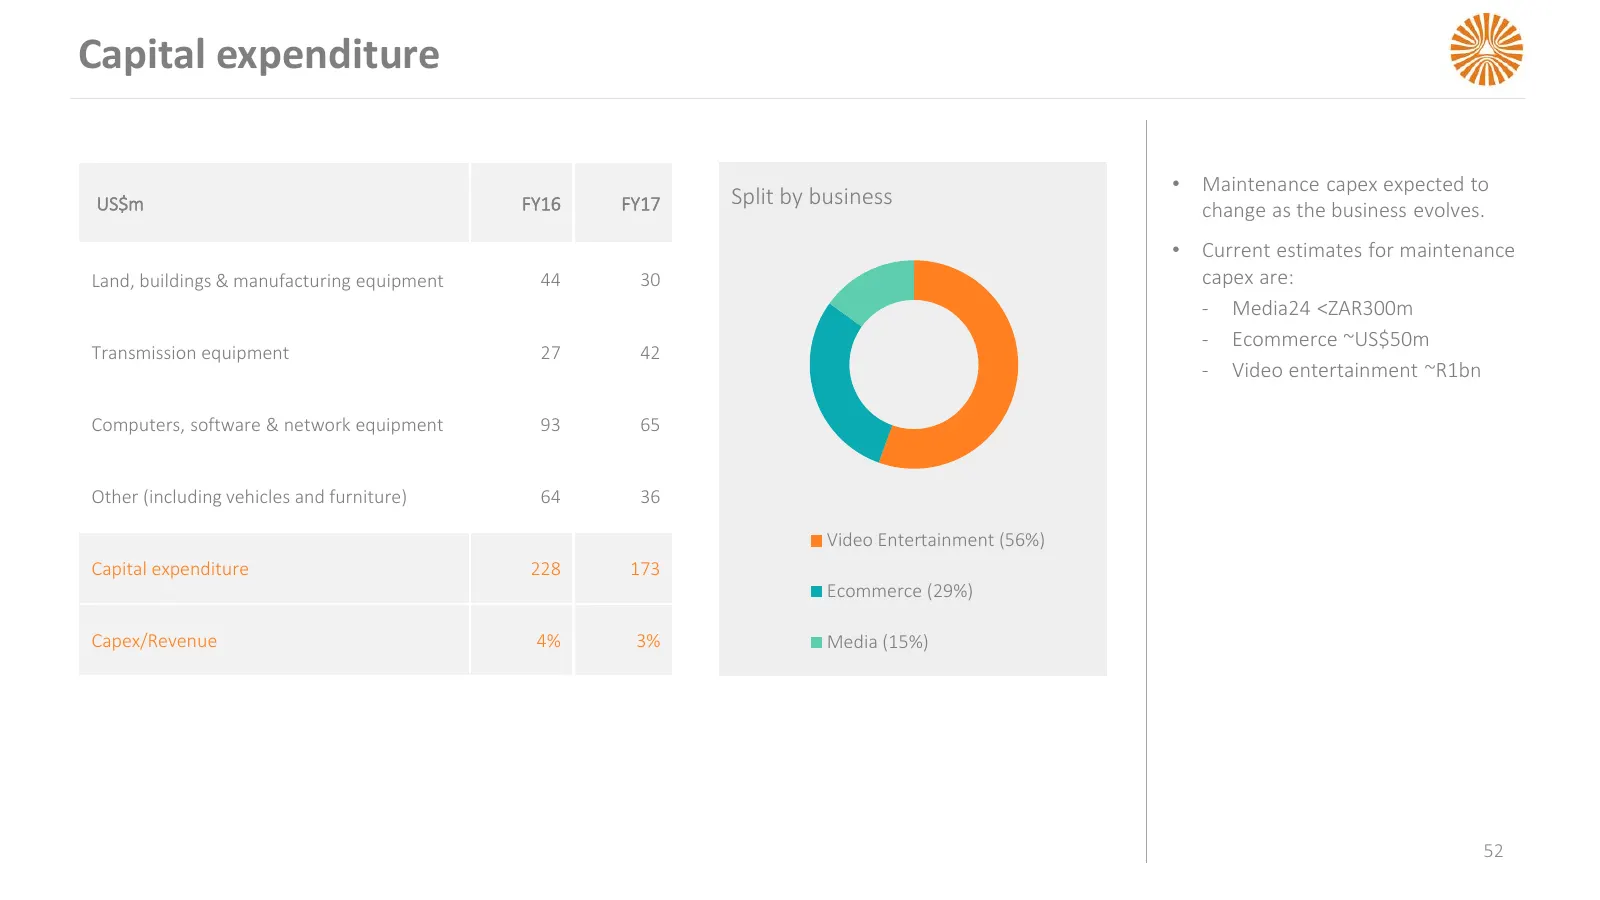
Slide 52: Capital expenditure
Capital expenditure • Maintenance capex expected to US$m FY16 FY17 Split by business change as the business evolves. • Current estimates for maintenance Land, buildings & manufacturing equipment 44 30 capex are: ‐ Media24 <ZAR300m ‐ Ecommerce ~US$50m Transmission equipment 27 42 ‐ Video entertainmen
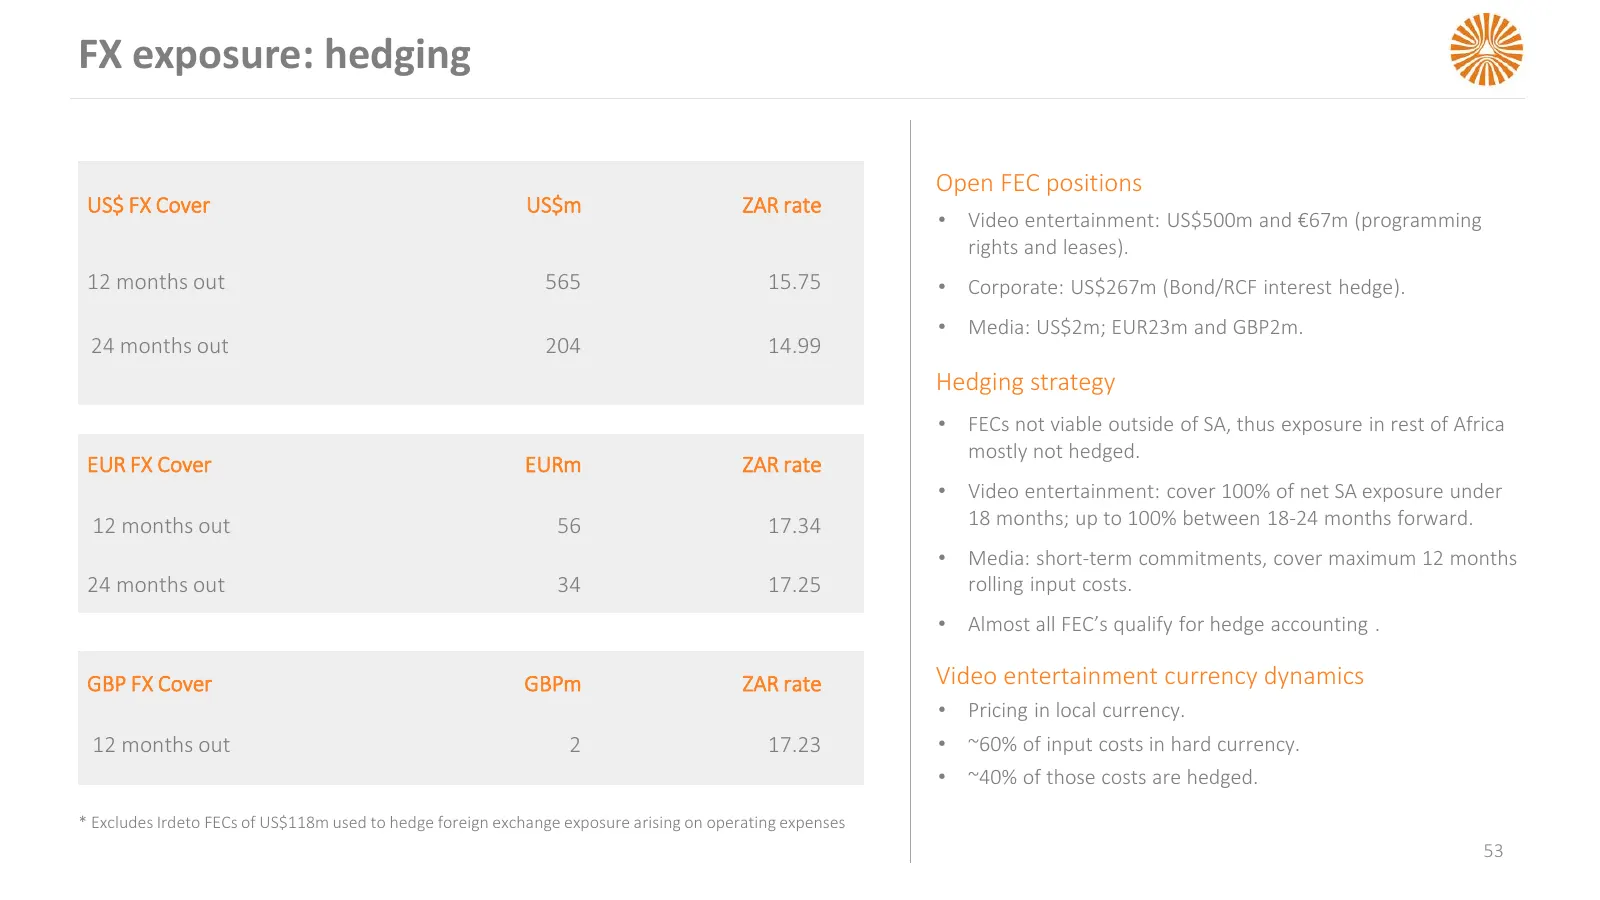
Slide 53: FX exposure: hedging
FX exposure: hedging Open FEC positions US$ FX Cover US$m ZAR rate • Video entertainment: US$500m and €67m (programming rights and leases). 12 months out 565 15.75 • Corporate: US$267m (Bond/RCF interest hedge). • Media: US$2m; EUR23m and GBP2m. 24 months out 204 14.99 Hedging strategy • FECs not vi

Slide 54: Appendix
APPENDIX
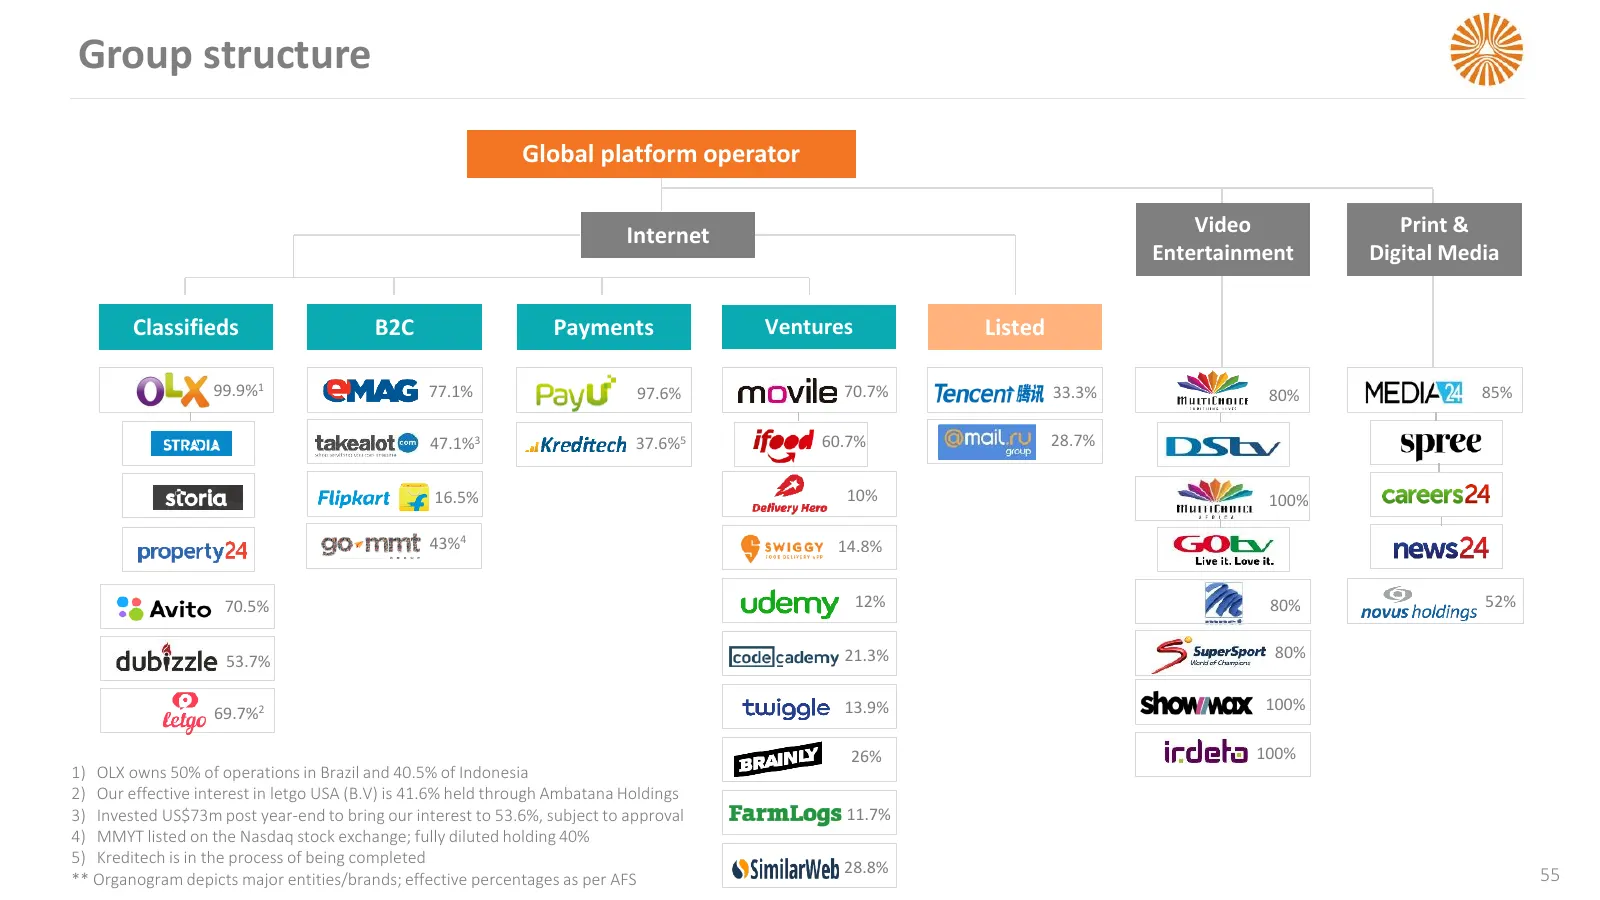
Slide 55: Group structure
Group structure Global platform operator Internet Video Print & Entertainment Digital Media Classifieds B2C Payments Ventures Listed 99.9%1 77.1% 97.6% 70.7% 33.3% 80% 85% 47.1%3 37.6%5 60.7% 28.7% 16.5% 10% 100% 43%4 14.8% 70.5% 12% 80% 52% 53.7% 21.3% 80% 69.7%2 13.9% 100% 26% 100% 1) OLX owns 50%
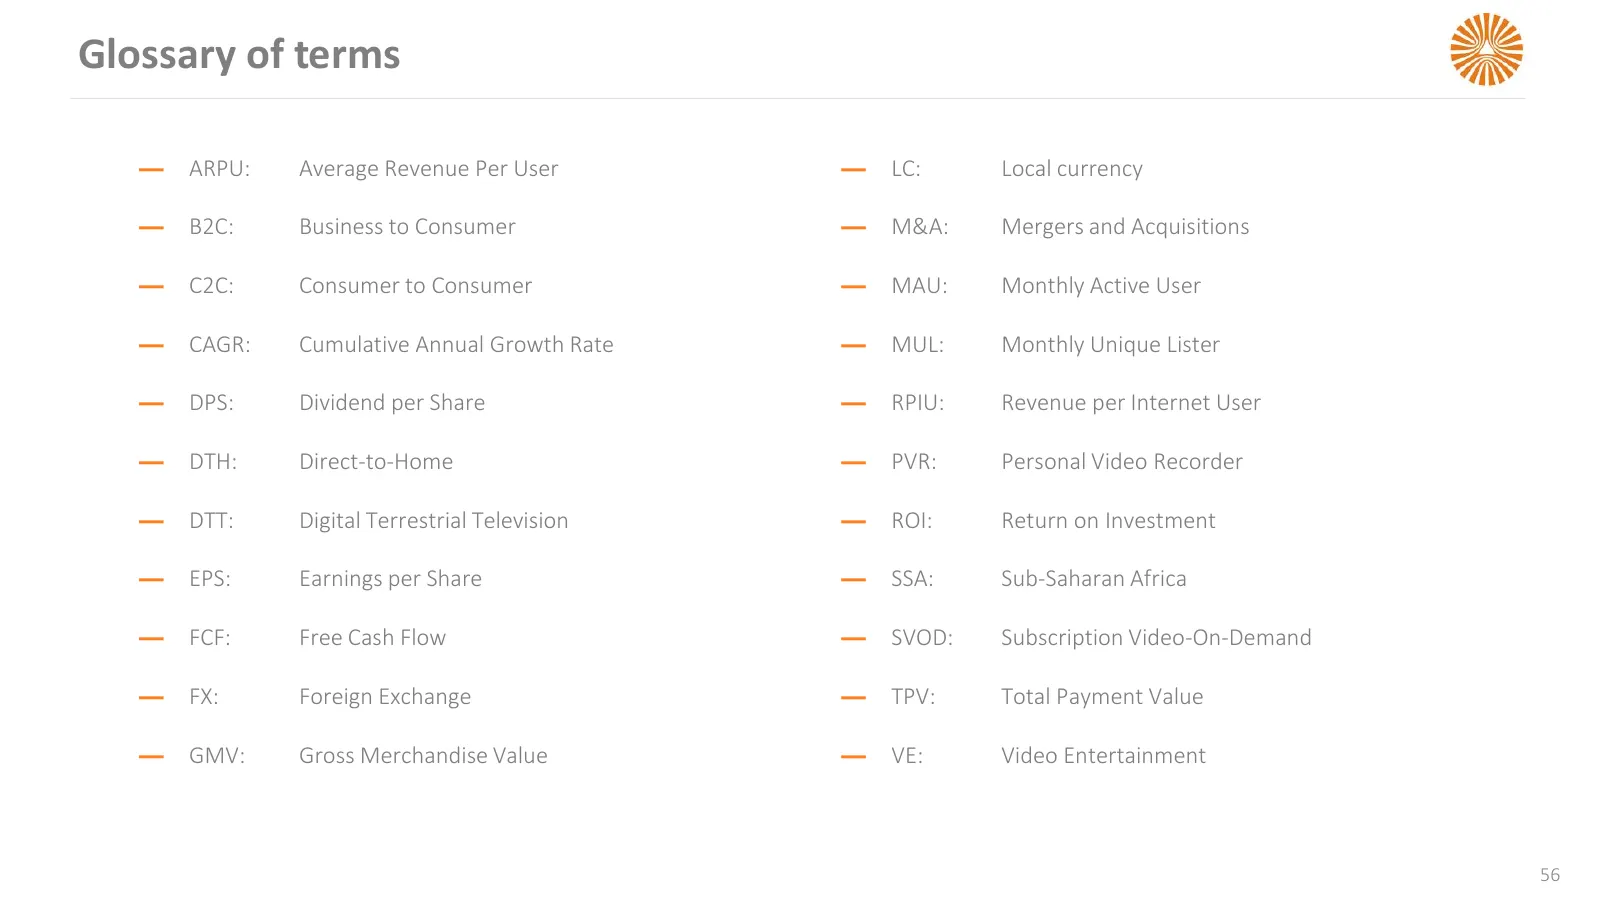
Slide 56: Glossary of terms
Glossary of terms — ARPU: Average Revenue Per User — LC: Local currency — B2C: Business to Consumer — M&A: Mergers and Acquisitions — C2C: Consumer to Consumer — MAU: Monthly Active User — CAGR: Cumulative Annual Growth Rate — MUL: Monthly Unique Lister — DPS: Dividend per Share — RPIU: Revenue per

Slide 57: Thank you
THANK YOU Meloy Horn +27 11 289 3320 +27 82 7727 123 InvestorRelations@naspers.com www.naspers.com
Source: Internet Archive copy of naspers.com
More decks from Naspers Limited Class N
 FY2026 Earnings Presentation60 slides · Jun 29, 2026
 FY2026 Earnings Presentation17 slides · Mar 31, 2026
 H1 2026 Earnings Presentation64 slides · Nov 24, 2025
 H1 FY26 Earnings Presentation17 slides · November 2025
 FY2025 Earnings Presentation51 slides · June 2025
 FY2025 Earnings Presentation17 slides · 2025