Archstone Smith Trust — Salomon Smith Barney Conference 2003
15 slides from Archstone Smith Trust's conference presentation, Mar 17, 2003

Slide 1: Archstone-Smith Salomon Smith Barney Conference
Archstone-Smith Salomon Smith Barney Conference Naples, Florida March 2003 1
Slide 2: Archstone-Smith Profile
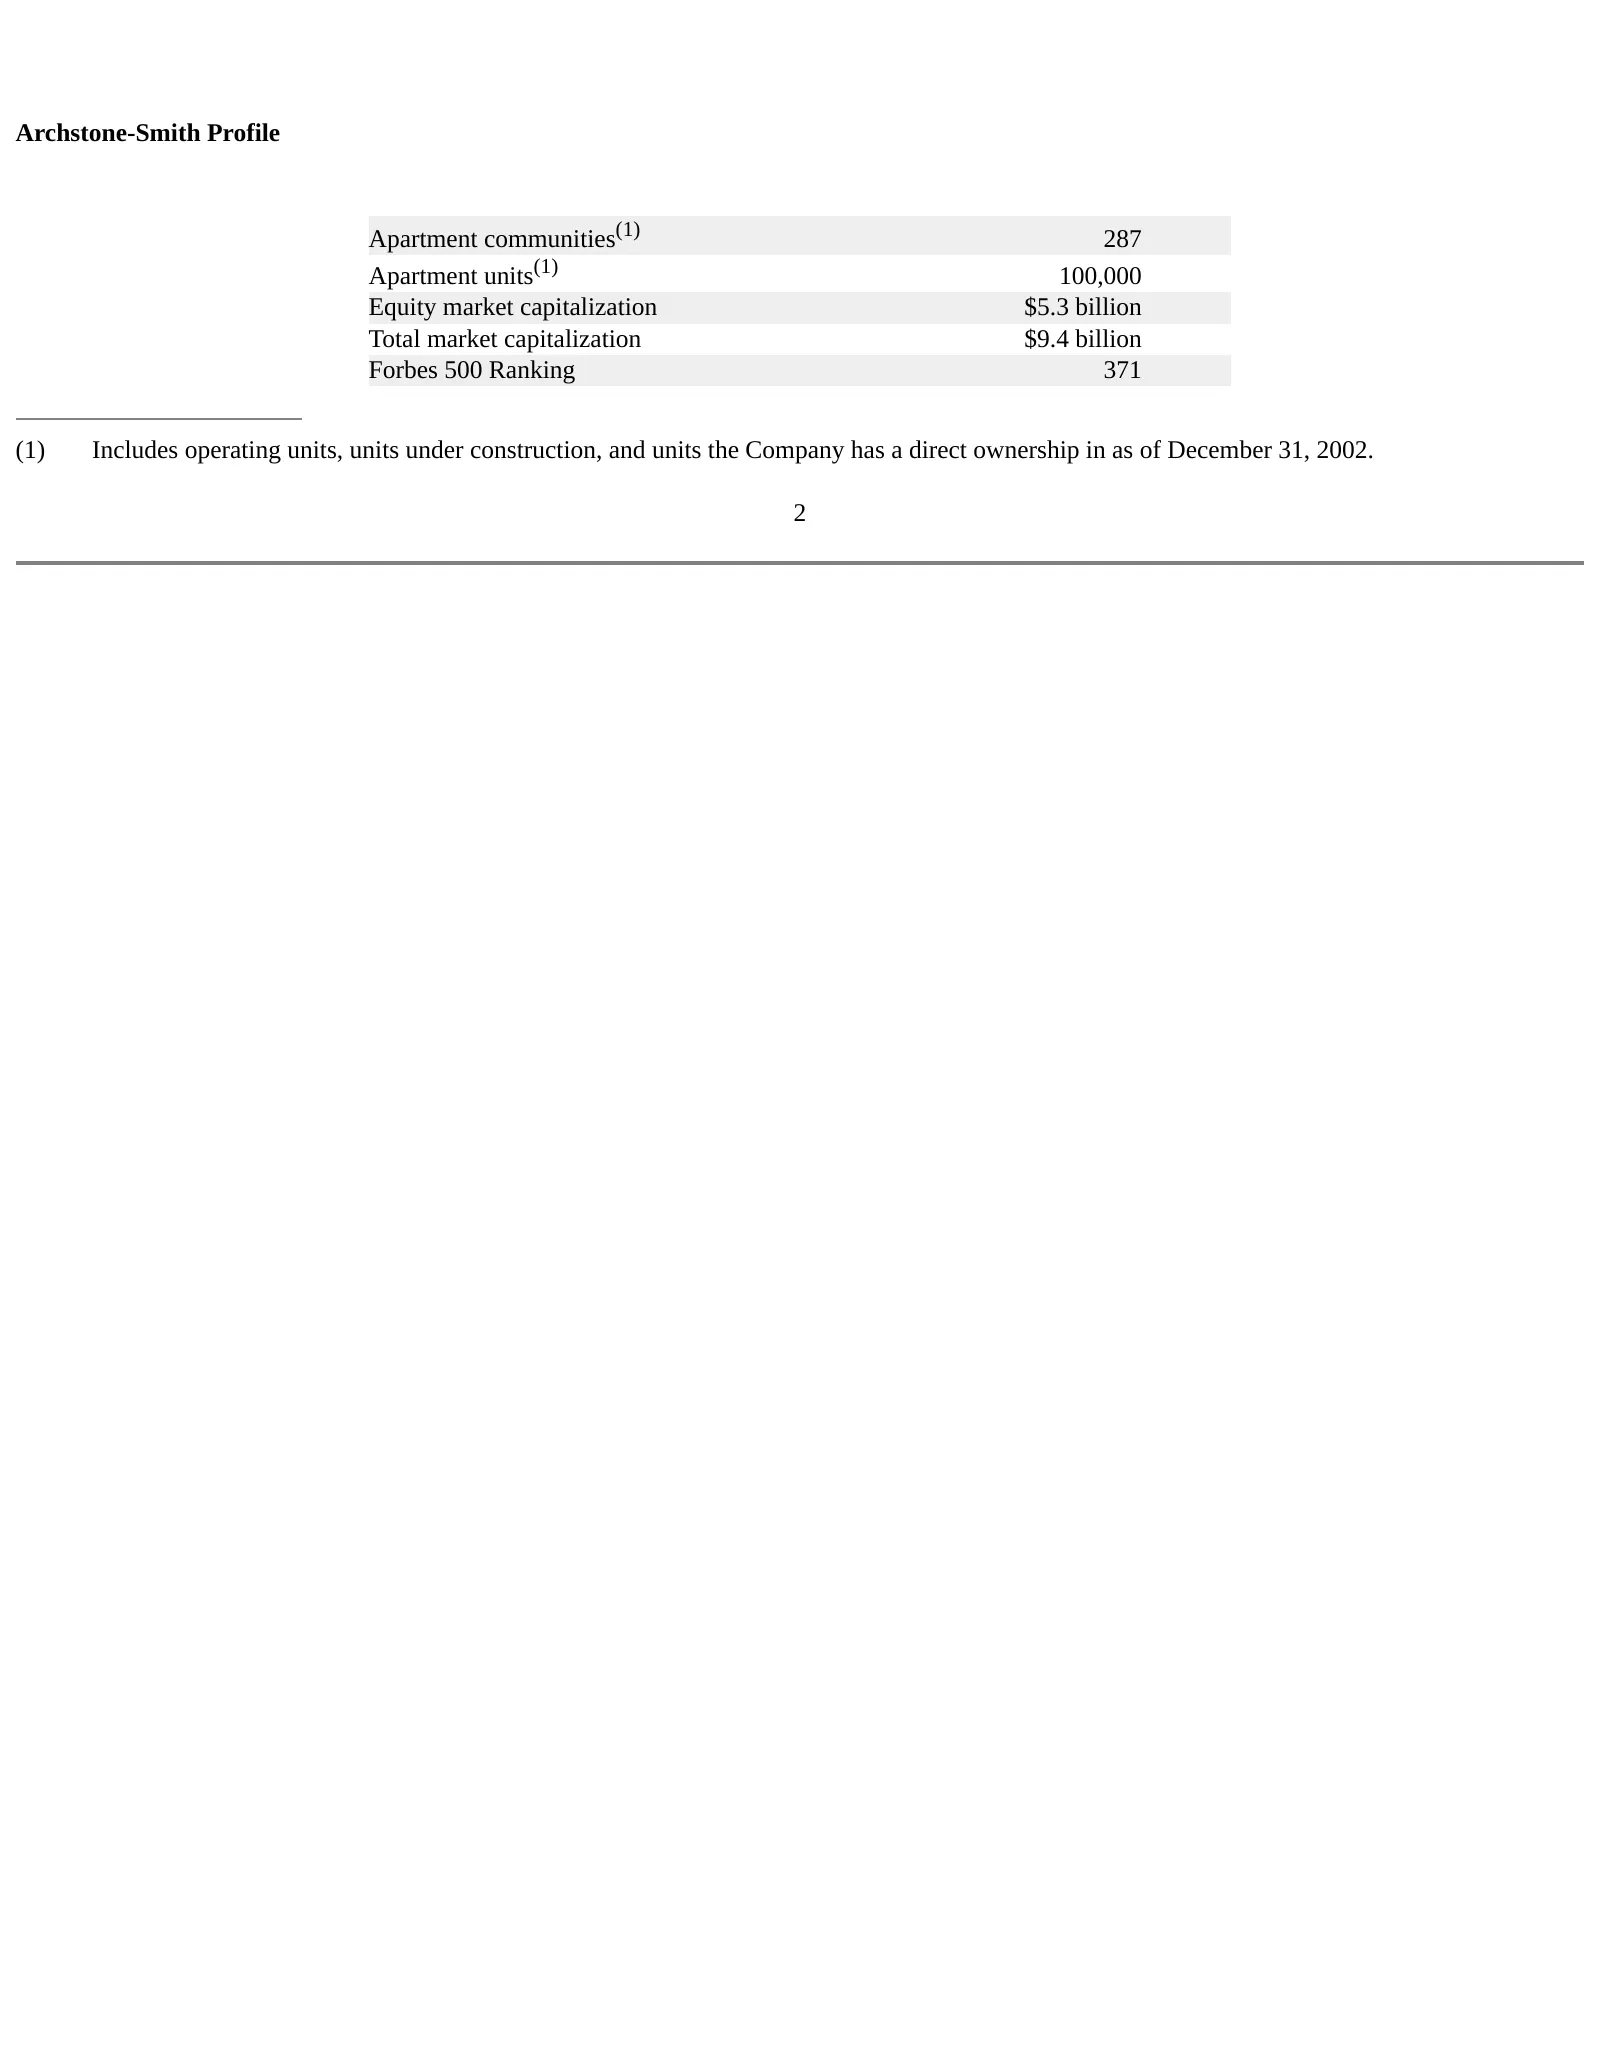
Archstone-Smith Profile Apartment communities(1) 287 Apartment units(1) 100,000 Equity market capitalization $5.3 billion Total market capitalization $9.4 billion Forbes 500 Ranking 371 (1) Includes operating units, units under construction, and units the Company has a direct ownership in as of Dece

Slide 3: Apartments as investments
Apartments as investments Real estate fundamentals provide stability and growth • High margin business • Stable cash flows • Current income • Stock valuation backed by real assets 3
Slide 4: Very favorable demographic trends
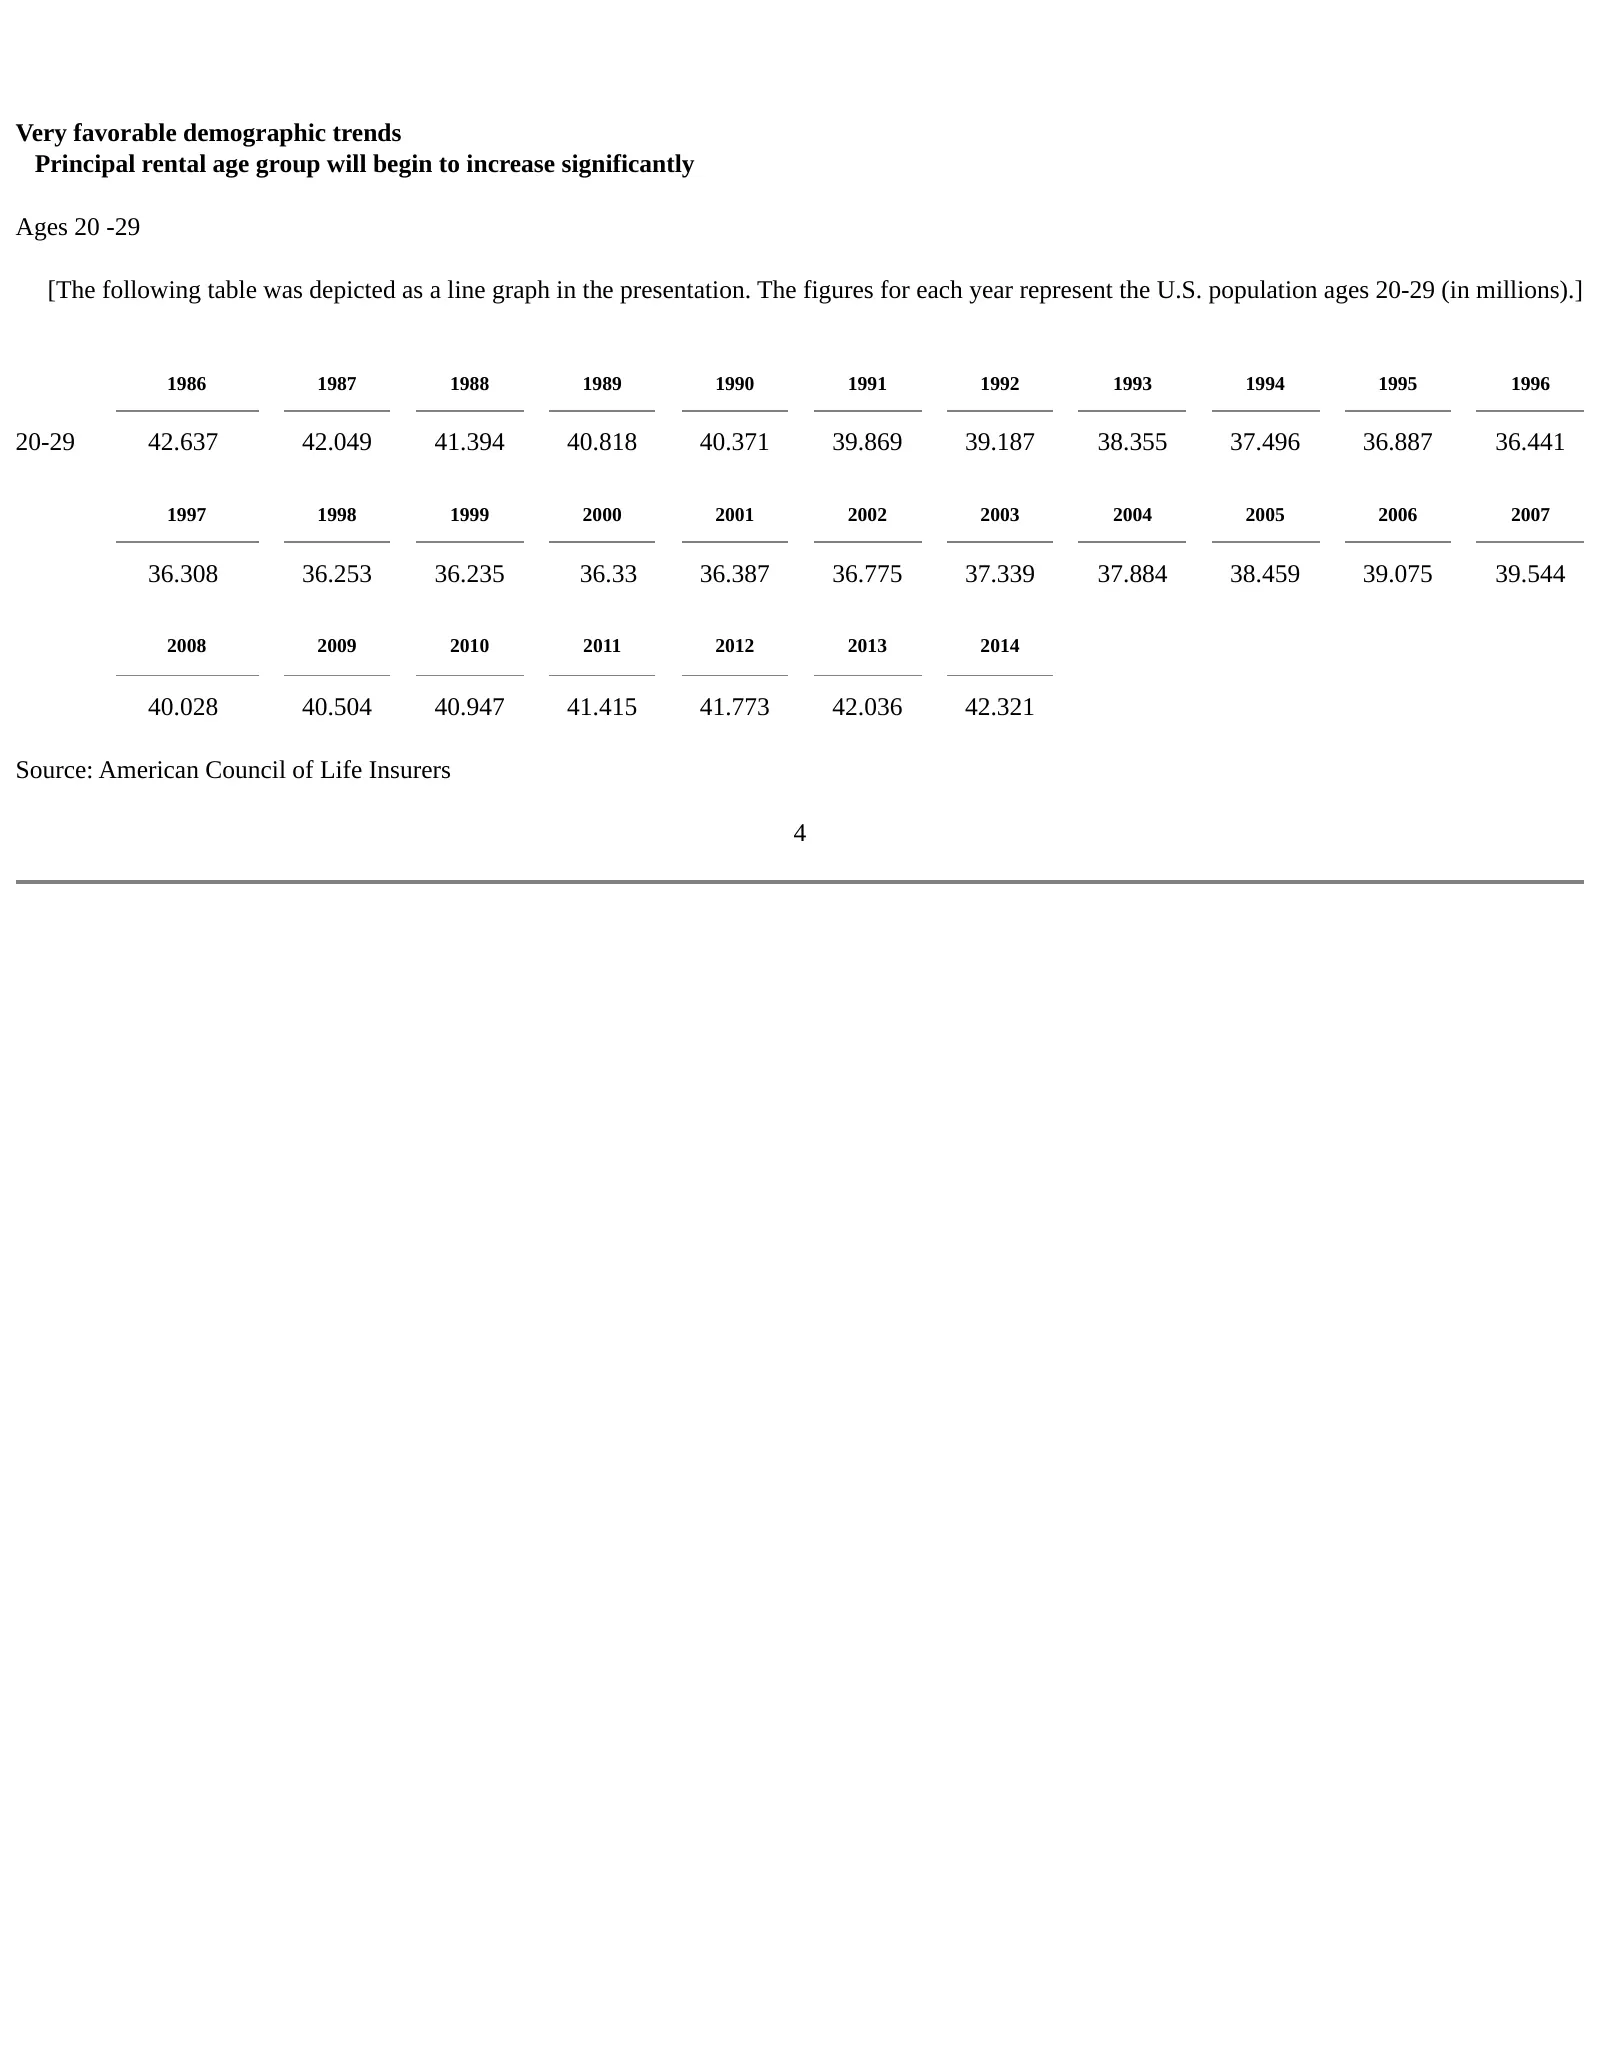
Very favorable demographic trends Principal rental age group will begin to increase significantly Ages 20 -29 [The following table was depicted as a line graph in the presentation. The figures for each year represent the U.S. population ages 20-29 (in millions).] 1986 1987 1988 1989 1990 1991 1992 1

Slide 5: Our investment strategy
Archstone-Smith Our investment strategy • Invest in protected markets – Limited land availability – Expensive single family homes – Diverse economic base 5
Slide 6: 83% in Core Protected Markets
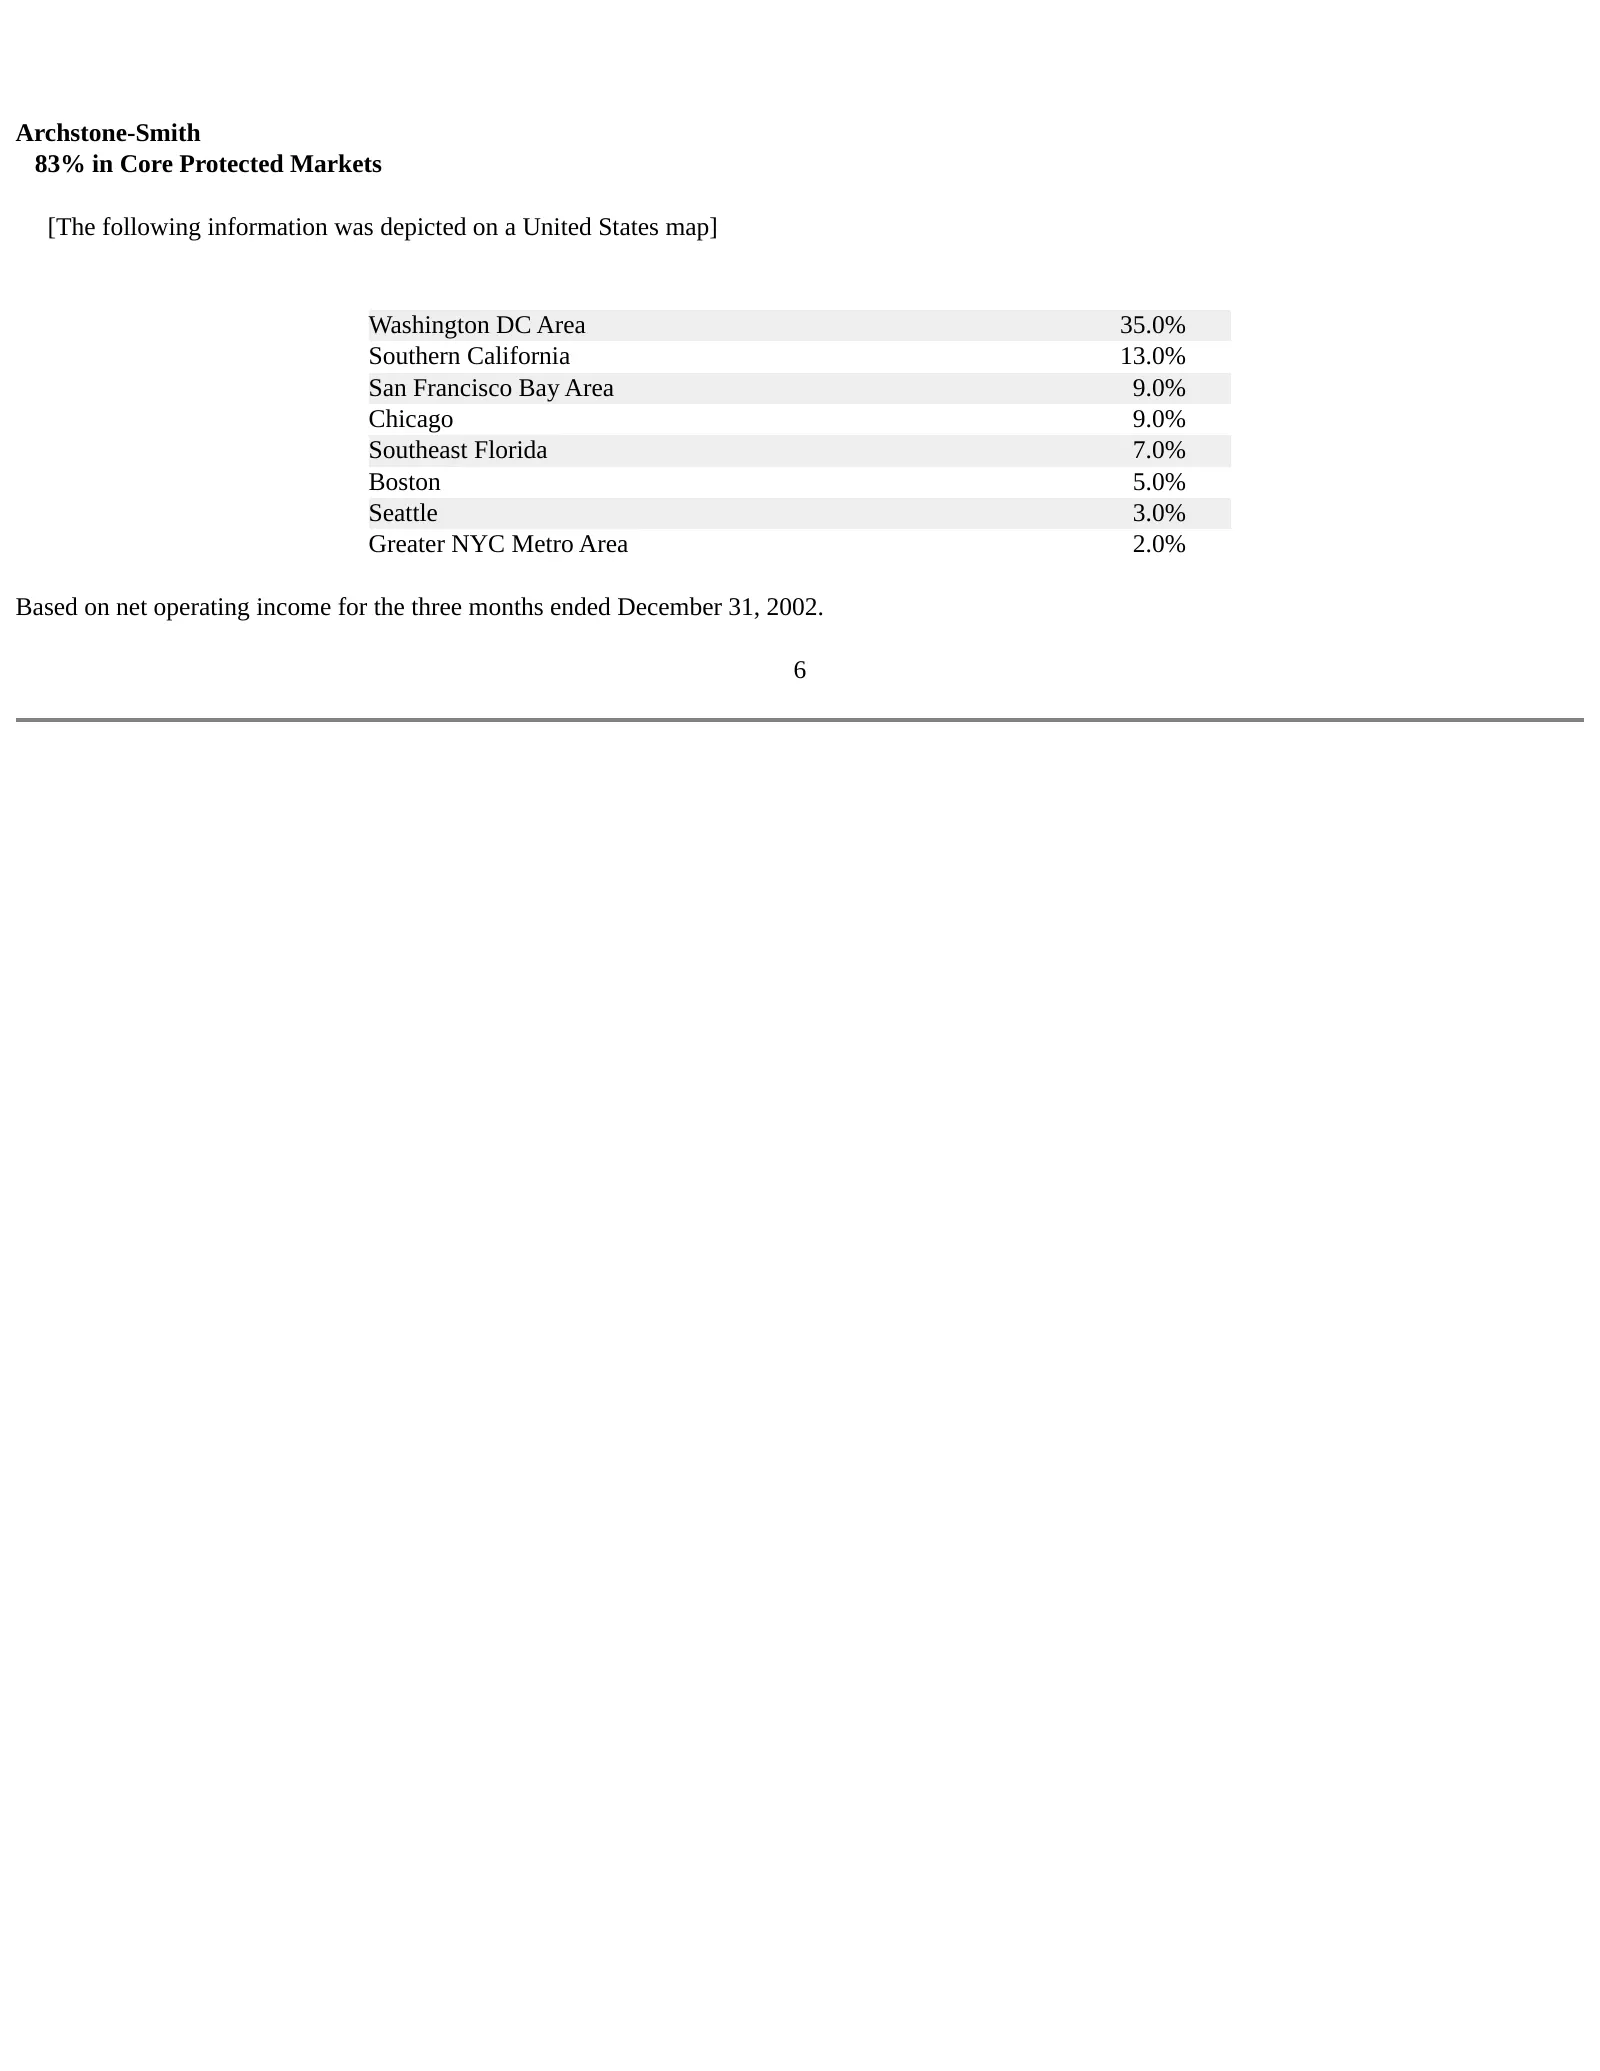
Archstone-Smith 83% in Core Protected Markets [The following information was depicted on a United States map] Washington DC Area 35.0% Southern California 13.0% San Francisco Bay Area 9.0% Chicago 9.0% Southeast Florida 7.0% Boston 5.0% Seattle 3.0% Greater NYC Metro Area 2.0% Based on net operating
Slide 7: Protected vs. Non-Protected Markets
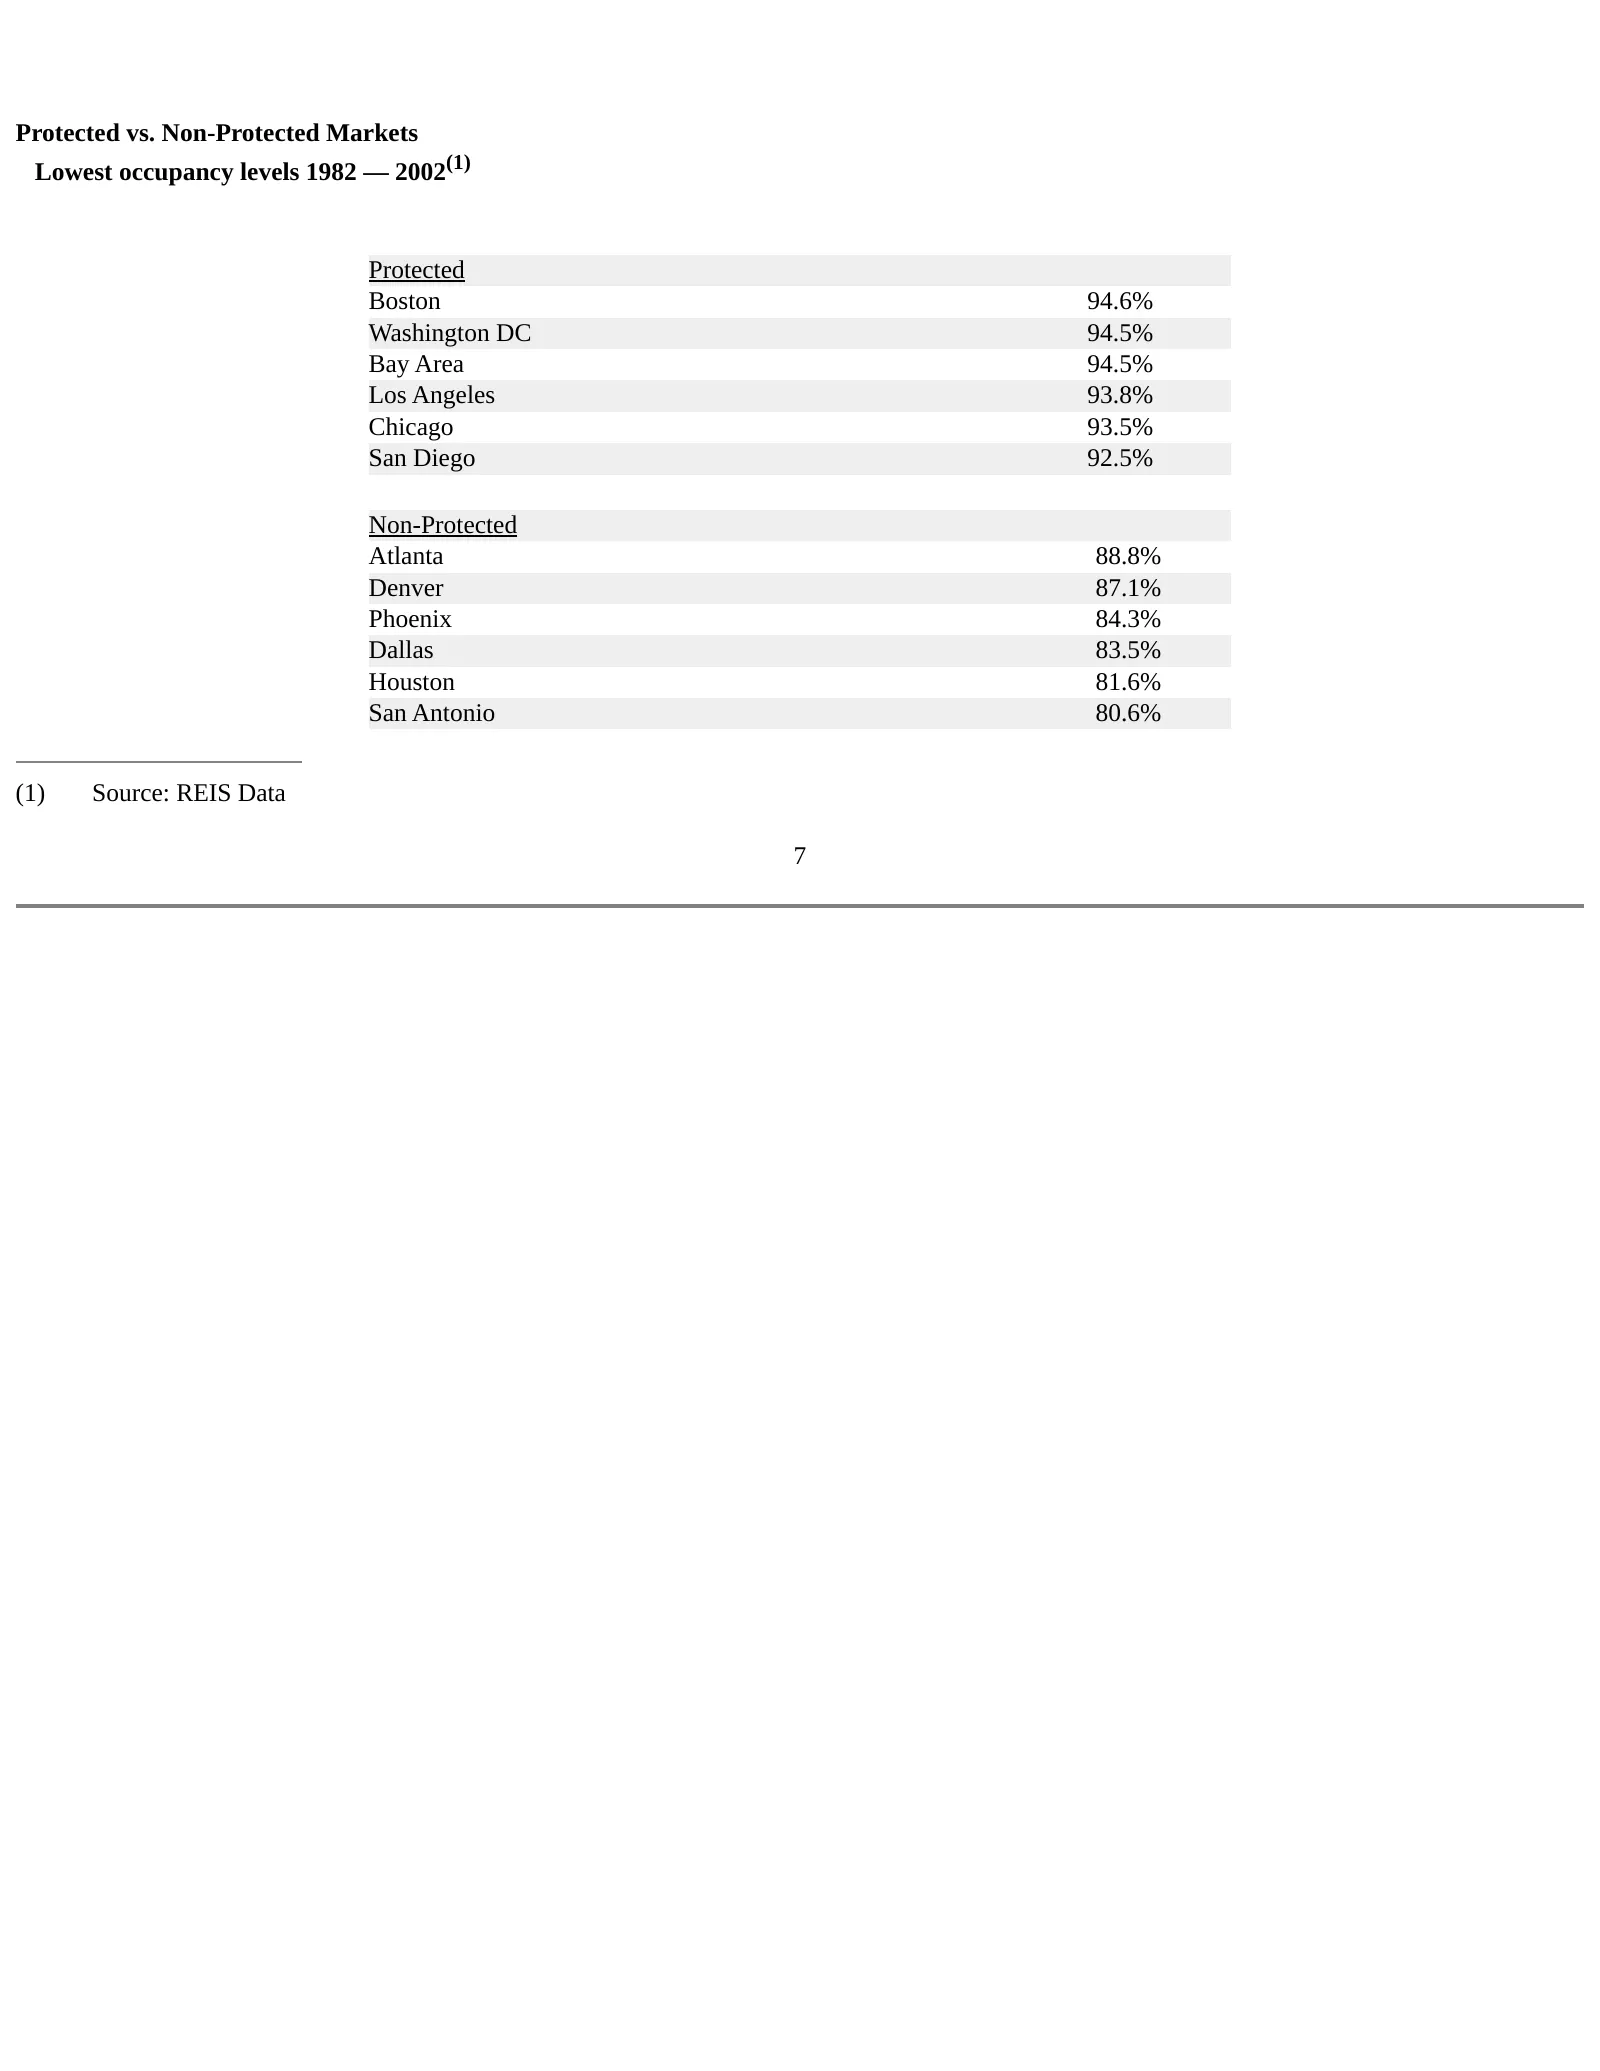
Protected vs. Non-Protected Markets Lowest occupancy levels 1982 — 2002(1) Protected Boston 94.6% Washington DC 94.5% Bay Area 94.5% Los Angeles 93.8% Chicago 93.5% San Diego 92.5% Non-Protected Atlanta 88.8% Denver 87.1% Phoenix 84.3% Dallas 83.5% Houston 81.6% San Antonio 80.6% (1) Source: REIS Da

Slide 8: Washington D.C.
Washington D.C. Local economy fueled by consistency of the federal government • 35% of our property portfolio This slide shows a map with all of our garden and high-rise communities in the greater Washington DC metropolitan area and an aerial map illustrating the location of the high-rise properties
Slide 9: Manhattan
Manhattan An opportunity to expand the high-rise division • 101 West End Avenue • 506 units • $209 million purchase price – $83 million of equity (all tax deferred exchange proceeds) – $126 million of tax exempt bonds • Year built: 2000 • Date acquired: May 2002 • First public apartment REIT to own
Slide 10: Intense focus on innovation operations
Intense focus on innovation operations Revenue Management • Pricing model forecasts demand for our product • Offers real time amenity-tiered pricing structure and customized leases • Allows our leasing consultants to focus on sales and service • Rolled out in 100% of our garden and majority of our h
Slide 11: Operations update
Operations update Year-to-date same store revenues through February 2003 • 1.3% decline from first two months of 2002 • First two months of Q1 2003 essentially flat sequentially compared with first two months of Q4 2002 • Approximately 1¢ impact on Q1 2003 expenses from record winter storms 11
Slide 12: Implement best practices from leaders in Corporate America
Implement best practices from leaders in Corporate America Focus on serving customers • Technological advances – Internet based credit scoring model – Direct debit rent payments – Online leasing and service requests – New property operating system (MRI) • Marketing advances – Seal of service guarant
Slide 13: Strong balance sheet and financial flexibility
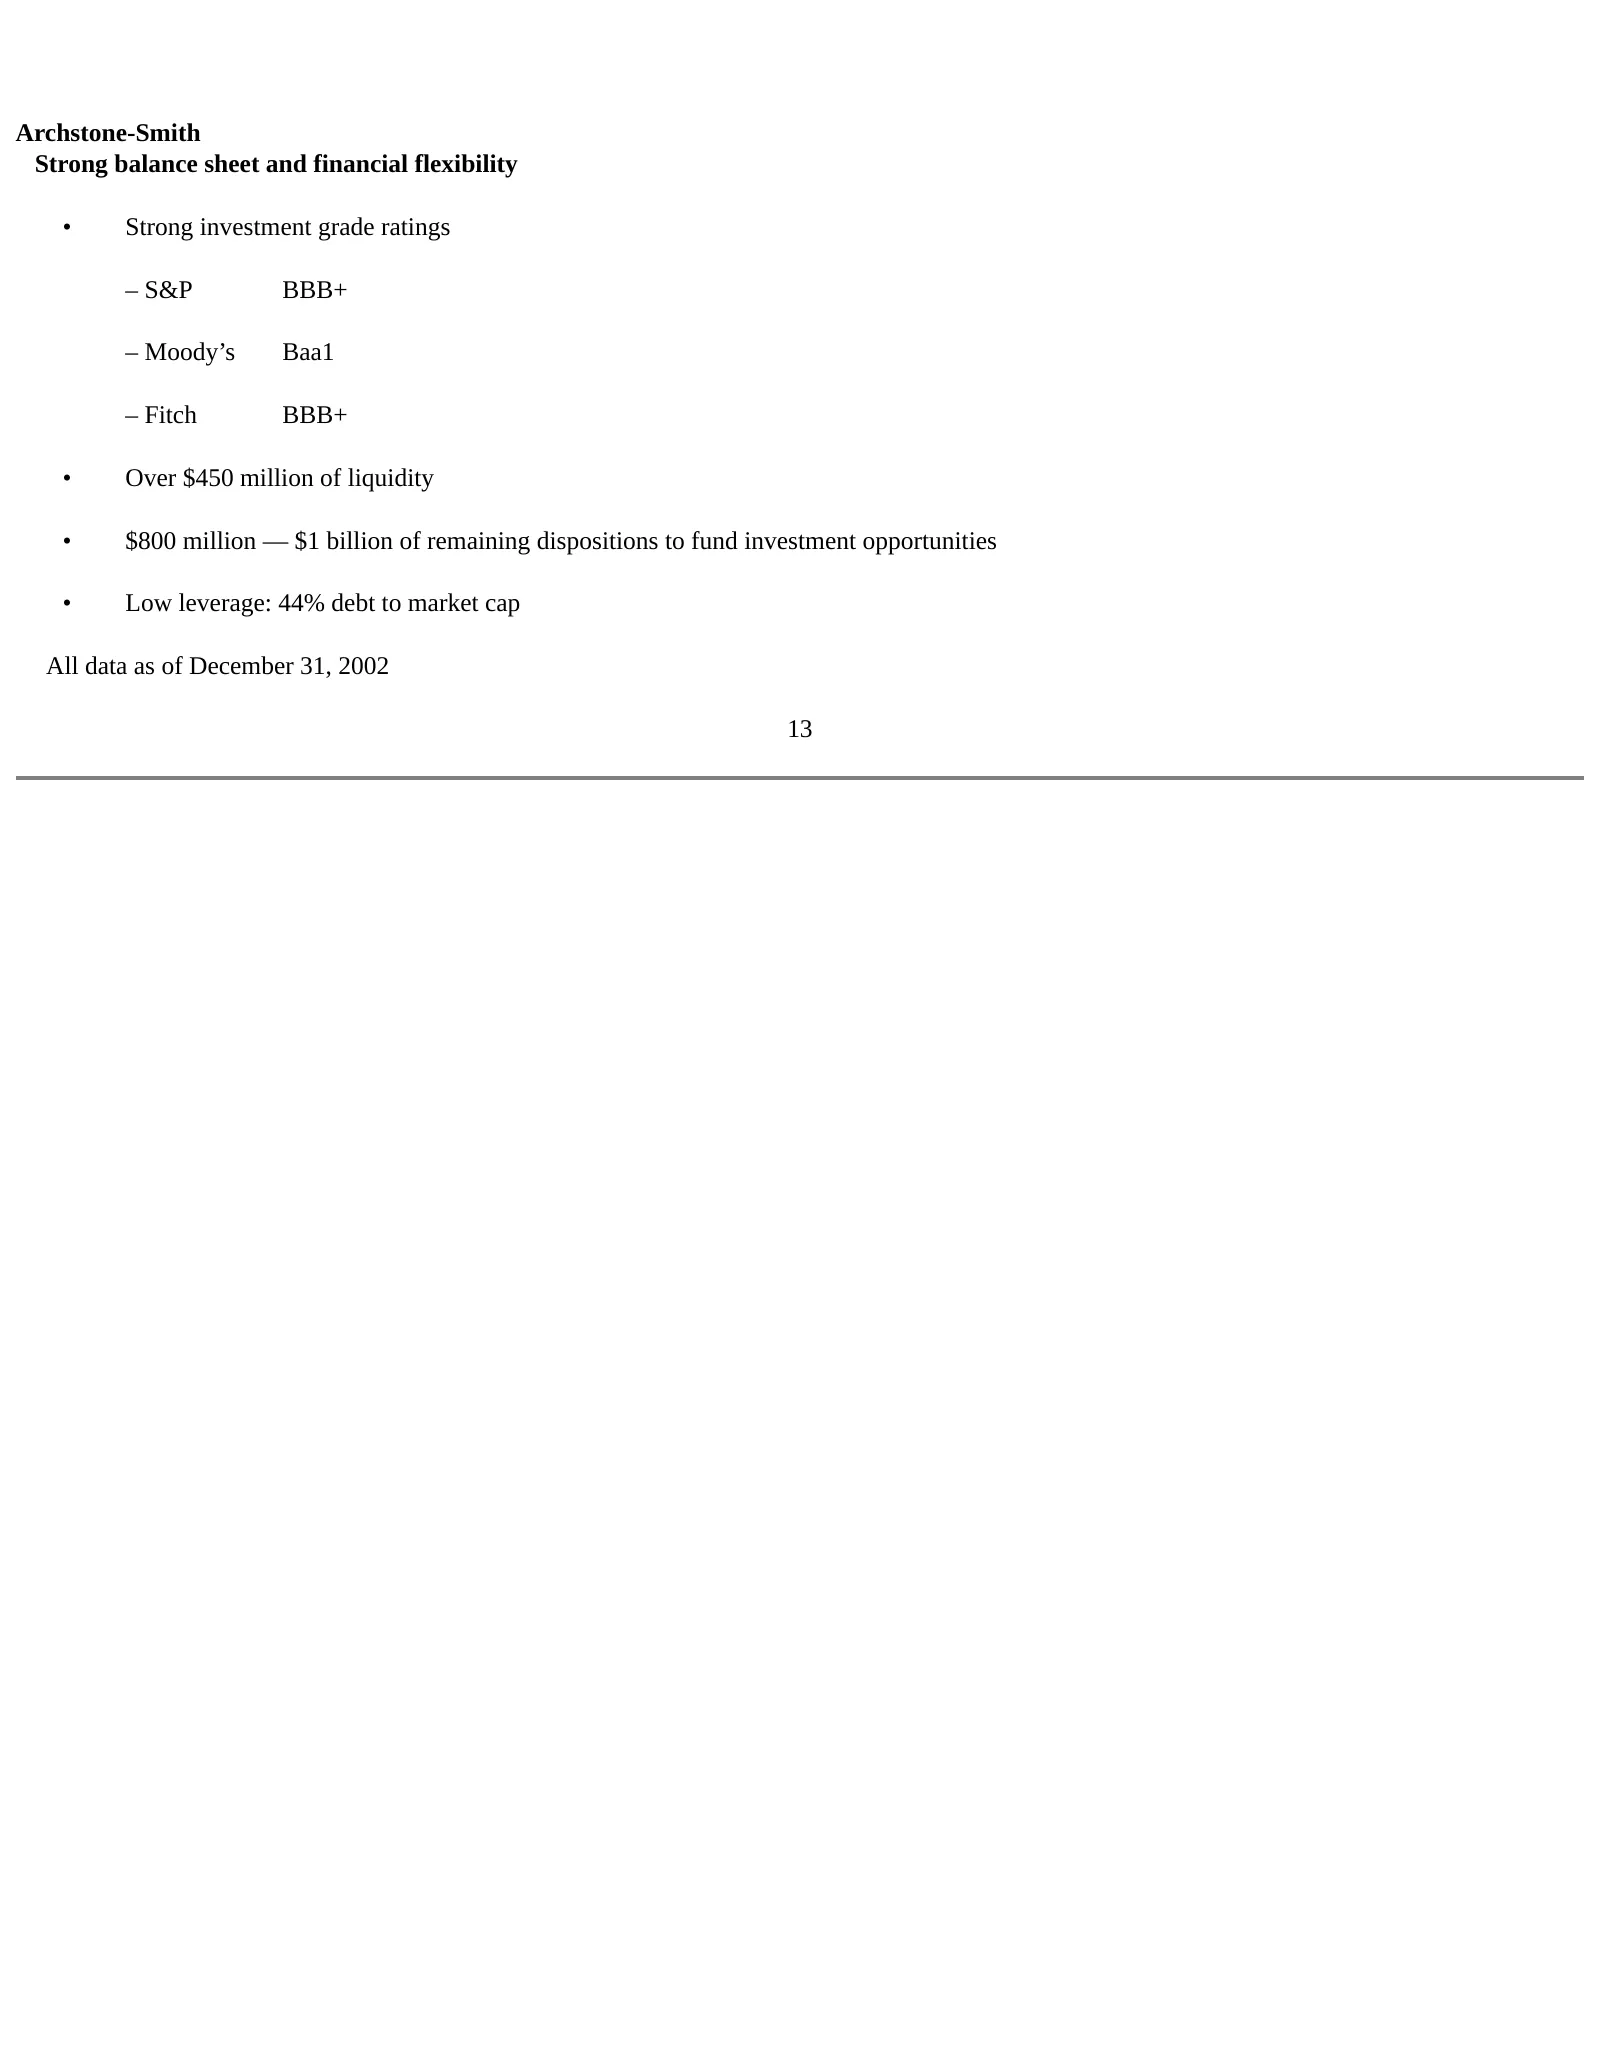
Archstone-Smith Strong balance sheet and financial flexibility • Strong investment grade ratings – S&P BBB+ – Moody’s Baa1 – Fitch BBB+ • Over $450 million of liquidity • $800 million — $1 billion of remaining dispositions to fund investment opportunities • Low leverage: 44% debt to market cap All d
Slide 14: Stable and growing dividend
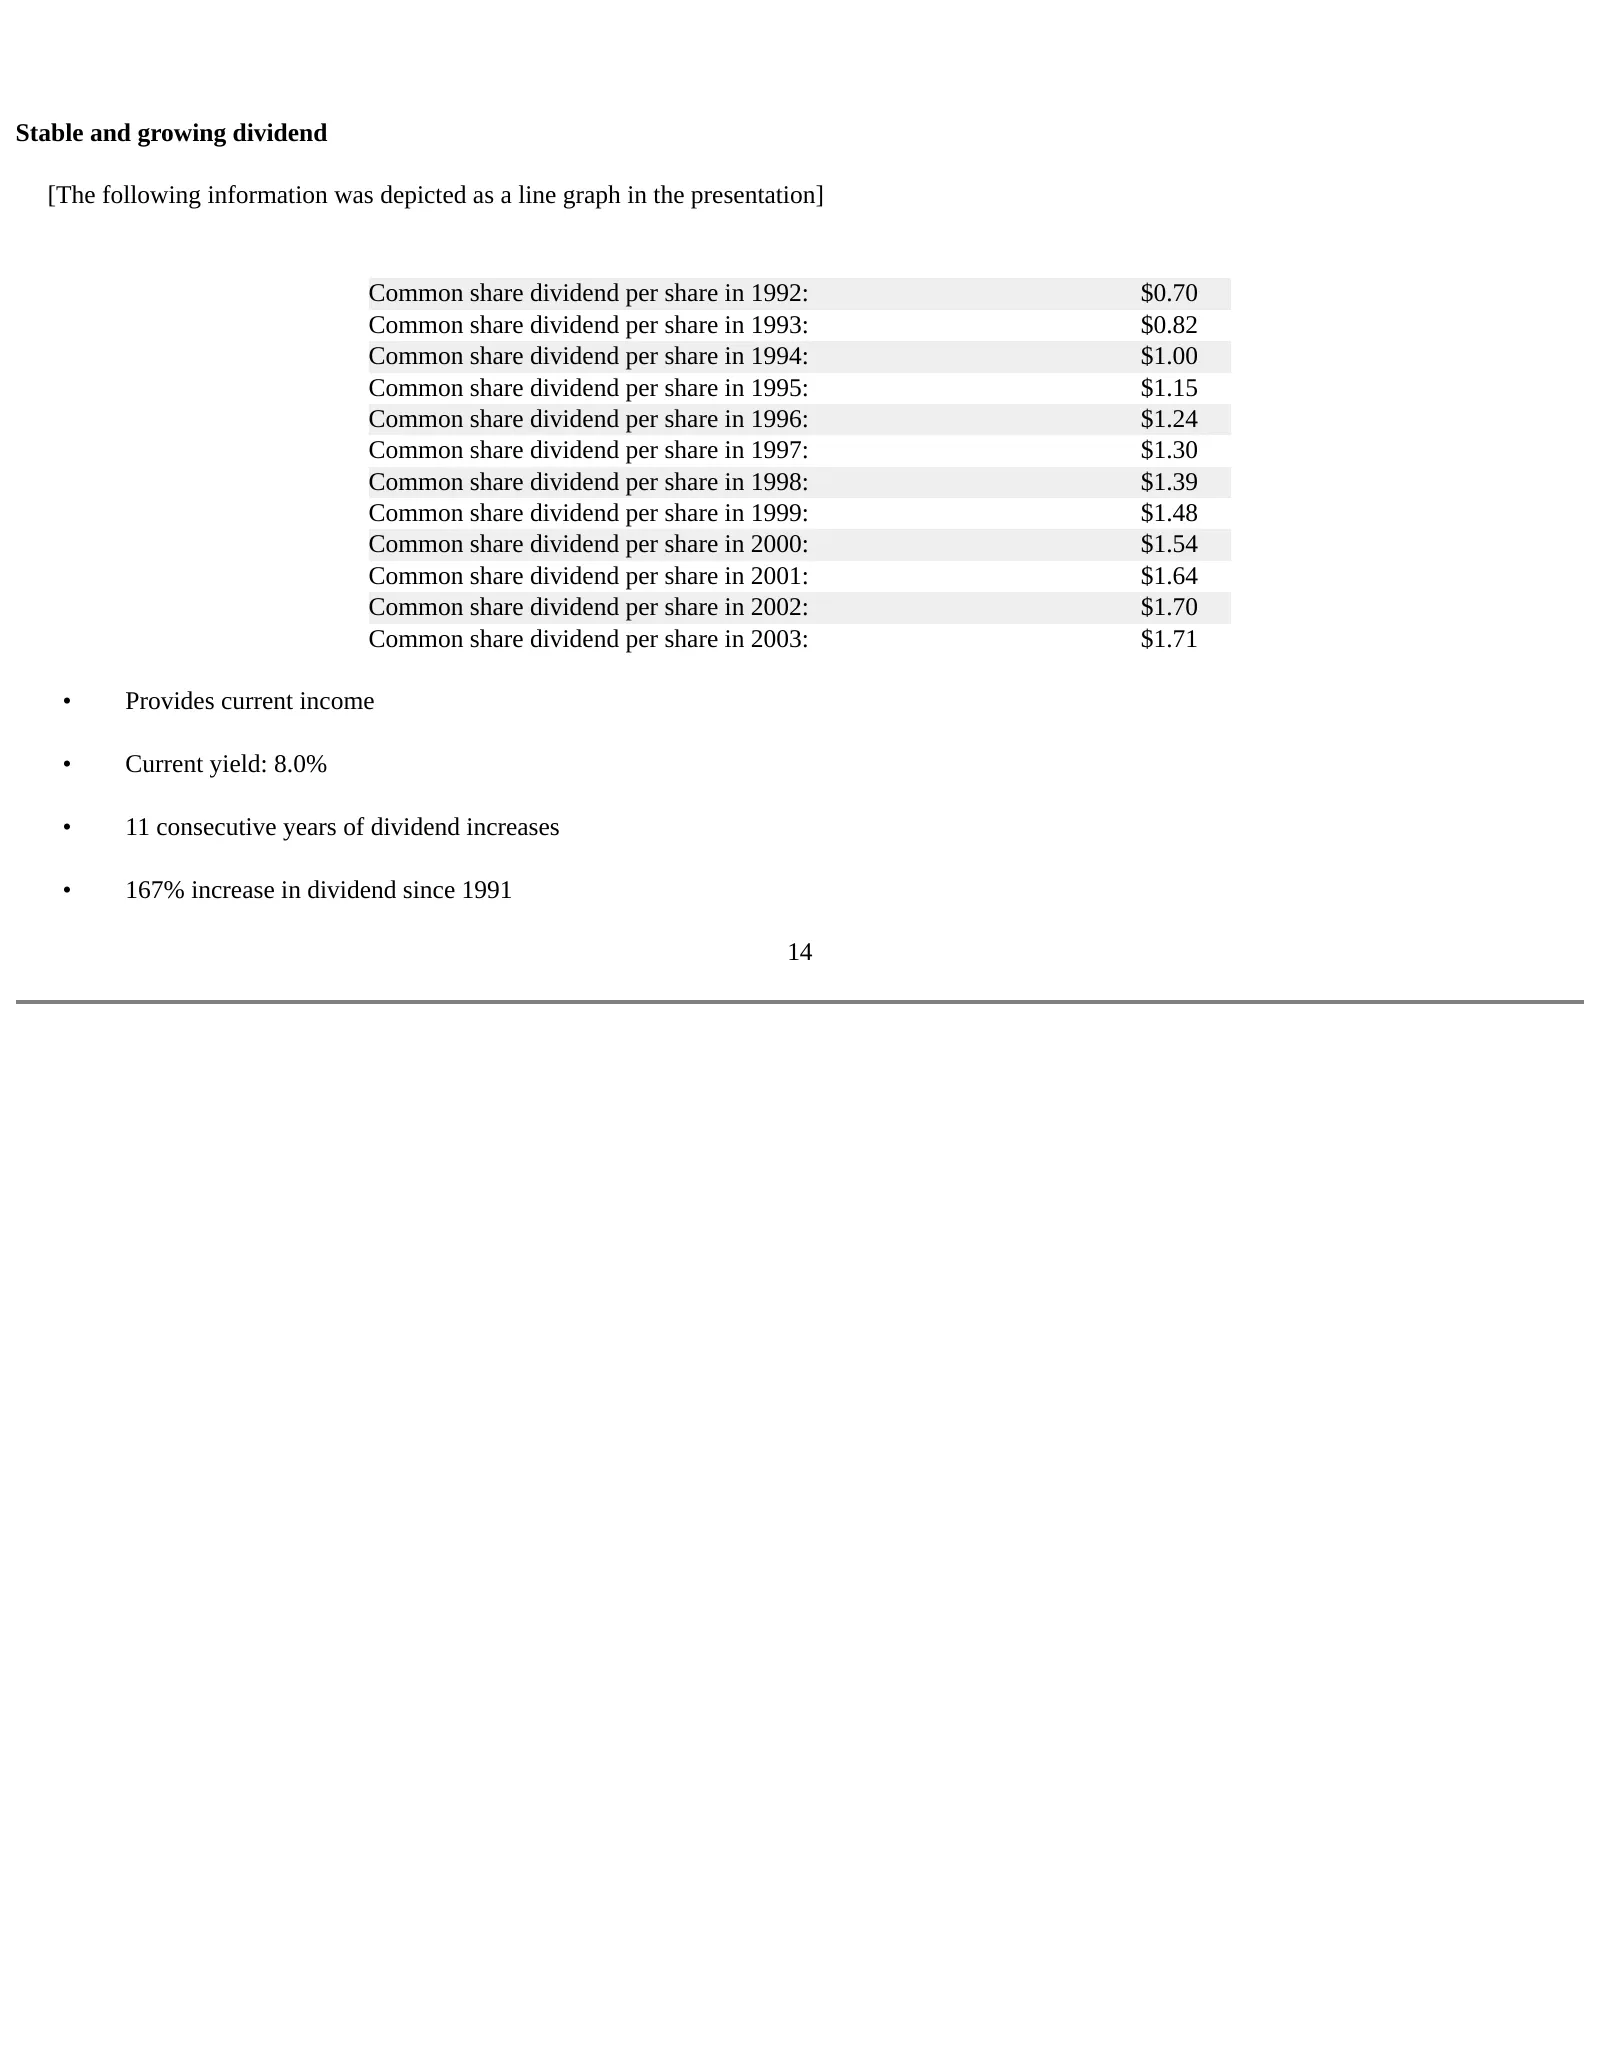
Stable and growing dividend [The following information was depicted as a line graph in the presentation] Common share dividend per share in 1992: $0.70 Common share dividend per share in 1993: $0.82 Common share dividend per share in 1994: $1.00 Common share dividend per share in 1995: $1.15 Common
Slide 15: Growth and stability enhance long term returns
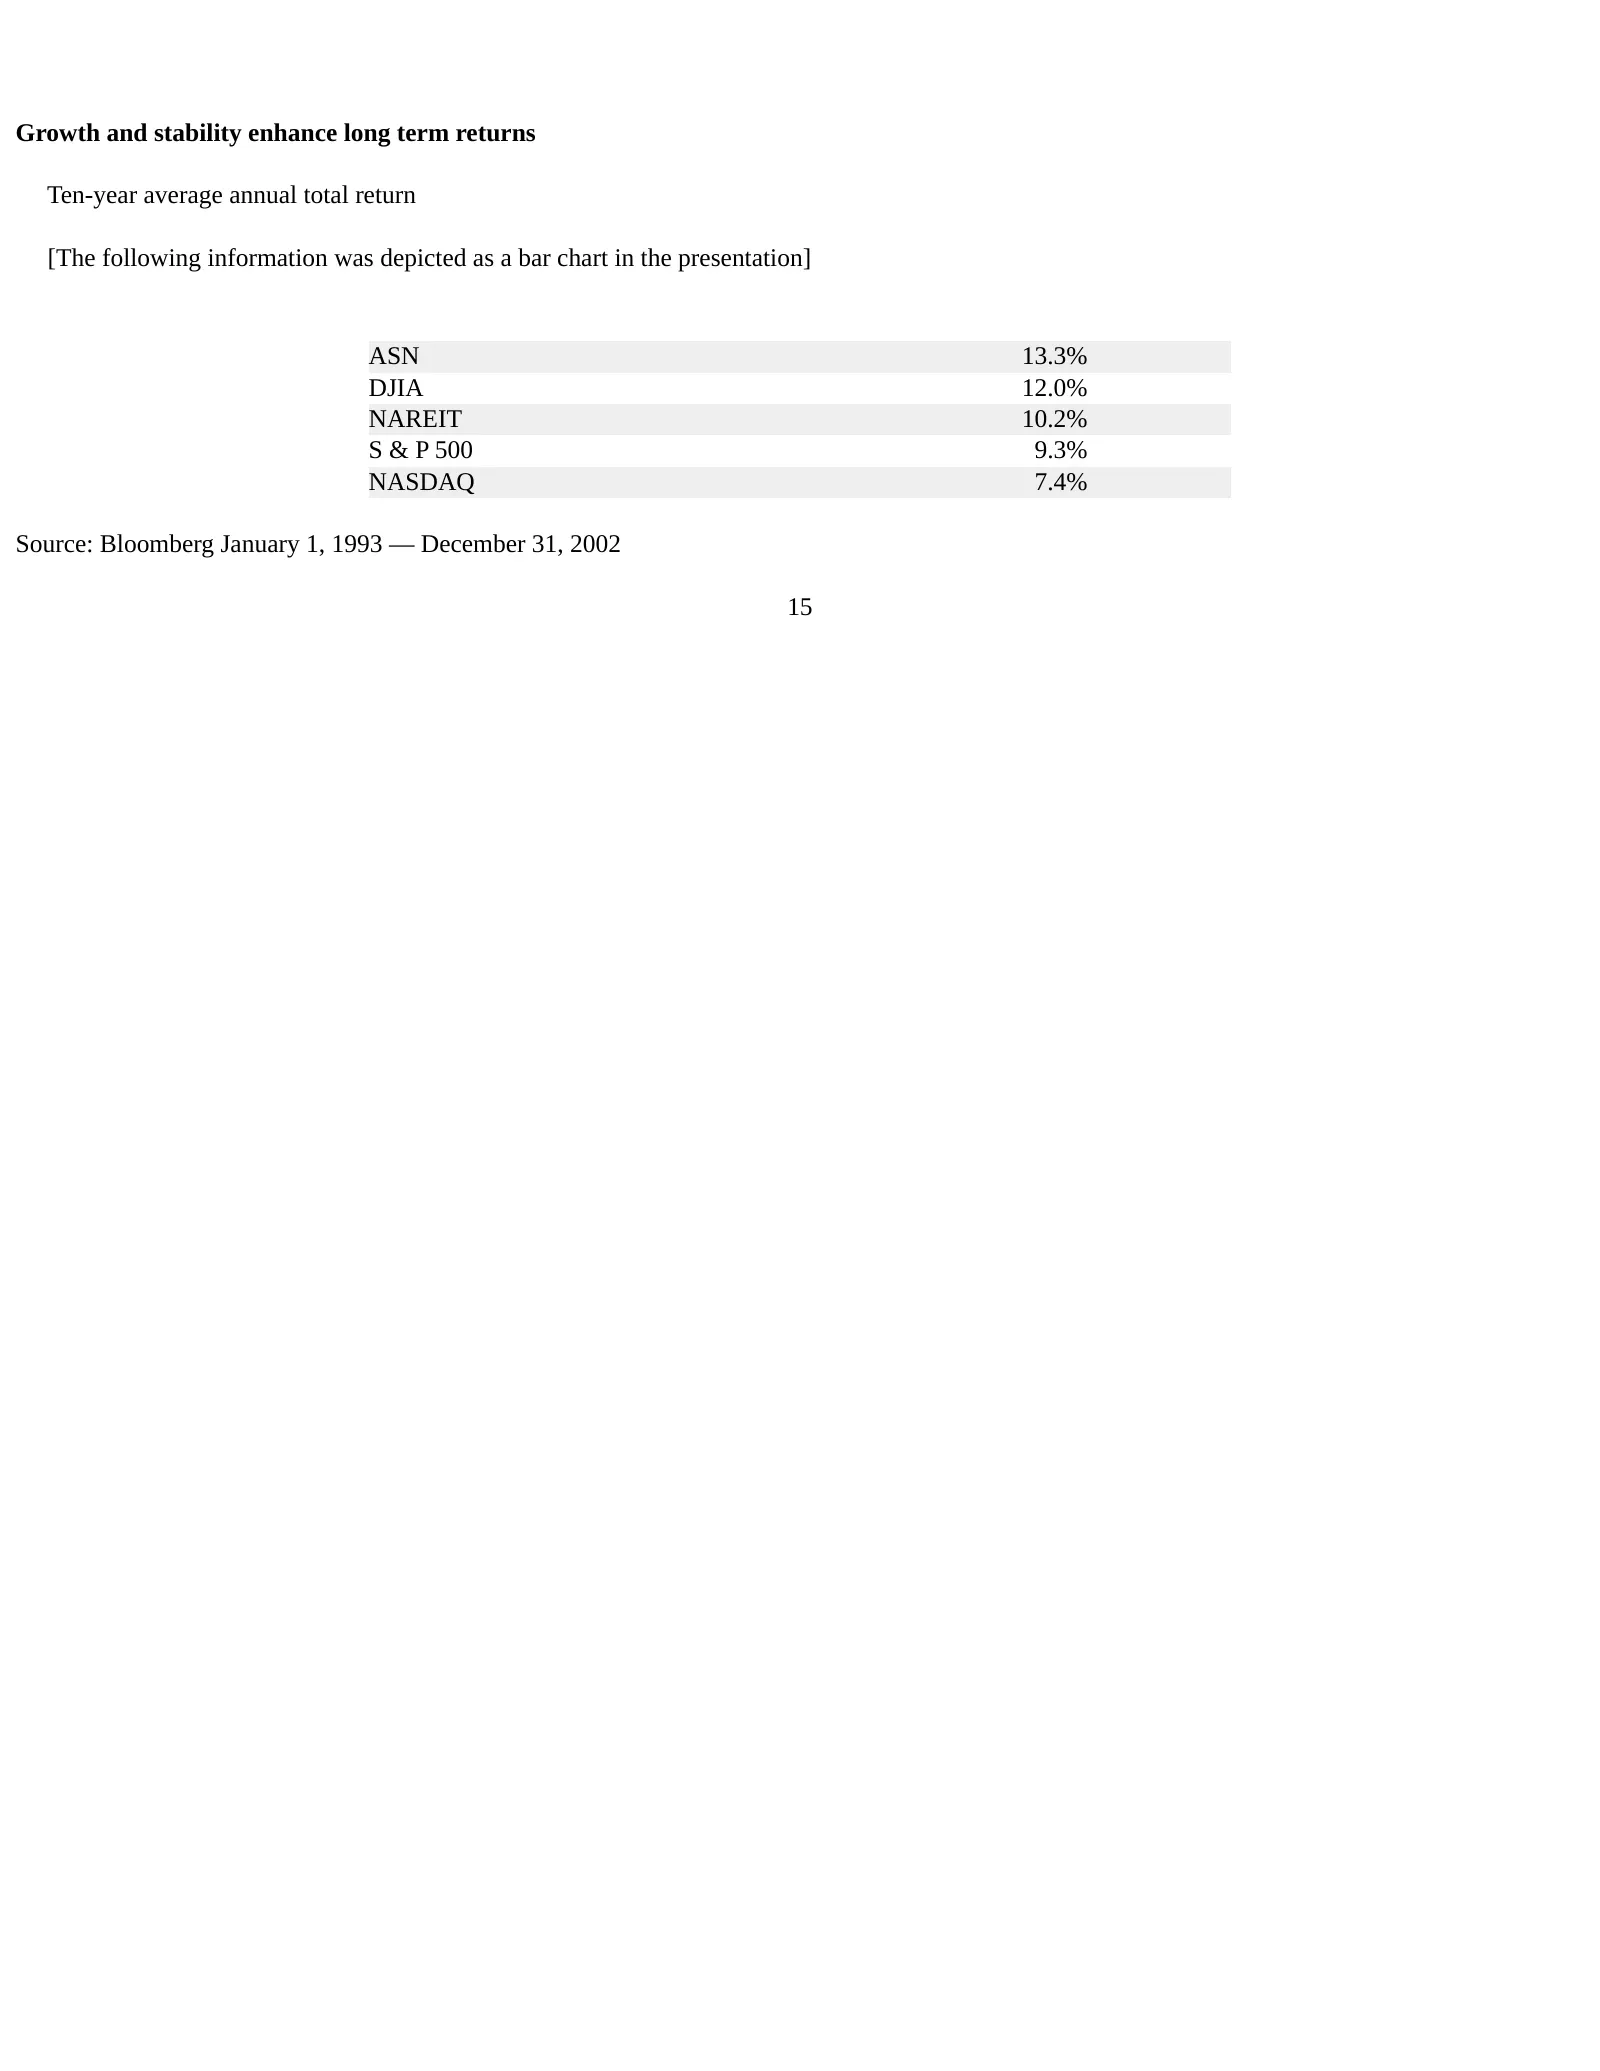
Growth and stability enhance long term returns Ten-year average annual total return [The following information was depicted as a bar chart in the presentation] ASN 13.3% DJIA 12.0% NAREIT 10.2% S & P 500 9.3% NASDAQ 7.4% Source: Bloomberg January 1, 1993 — December 31, 2002 15
Source: SEC EDGAR · 8-K filed Mar 17, 2003
More decks from Archstone Smith Trust
 Citigroup 2007 Global Property CEO Conference26 slides · Mar 5, 2007
 NAREIT Annual Convention 200625 slides · Nov 7, 2006
 NAREIT Institutional Investor Forum June 200626 slides · Jun 5, 2006
 Corporate Update (June 2006)14 slides · Jun 5, 2006
 Corporate Update (April 2006)17 slides · Apr 11, 2006
 Citigroup REIT CEO Conference March 200620 slides · Mar 7, 2006