CyberAgent Incorporated · TSE:4751
CyberAgent — Q2 FY2011 Earnings Presentation
39 slides from CyberAgent's earnings presentation, May 2011
Slide 1: Table of Contents
0 Table of Contents 1 Overview of Consolidated Financial Results 2 Consolidated Business Forecast 3 Major Business 4 Ameba Business 5 Summary 1
Slide 2: Overview of Consolidated Financial Results for 2Q
1 Overview of Consolidated Financial Results Overview of Consolidated Financial Results for 2Q (January - March. 2011) 2
Slide 3: Second Quarter Highlights (Jan. 2011-Mar. 2011)
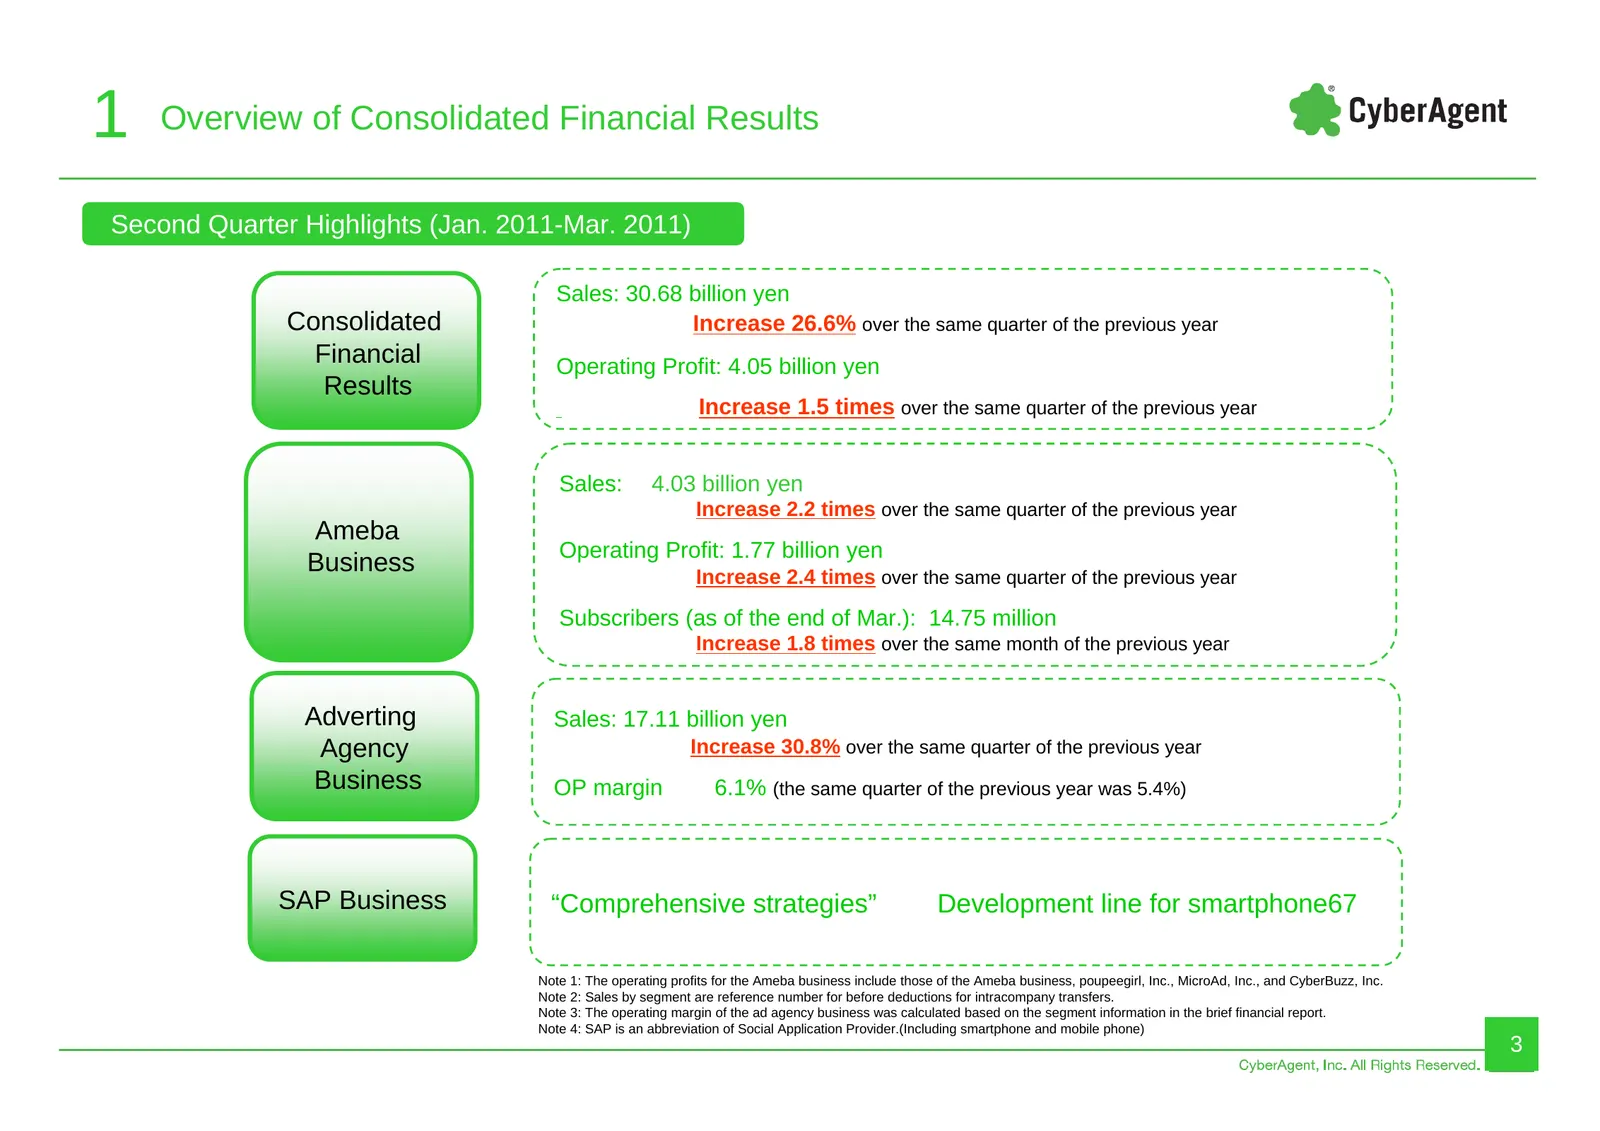
1 Overview of Consolidated Financial Results Second Quarter Highlights (Jan. 2011-Mar. 2011) Sales: 30.68 billion yen Consolidated Increase 26.6% over the same quarter of the previous year Financial Operating Profit: 4.05 billion yen Results Increase 1.5 times over the same quarter of the previous y
Slide 4: Quarterly Consolidated Sales
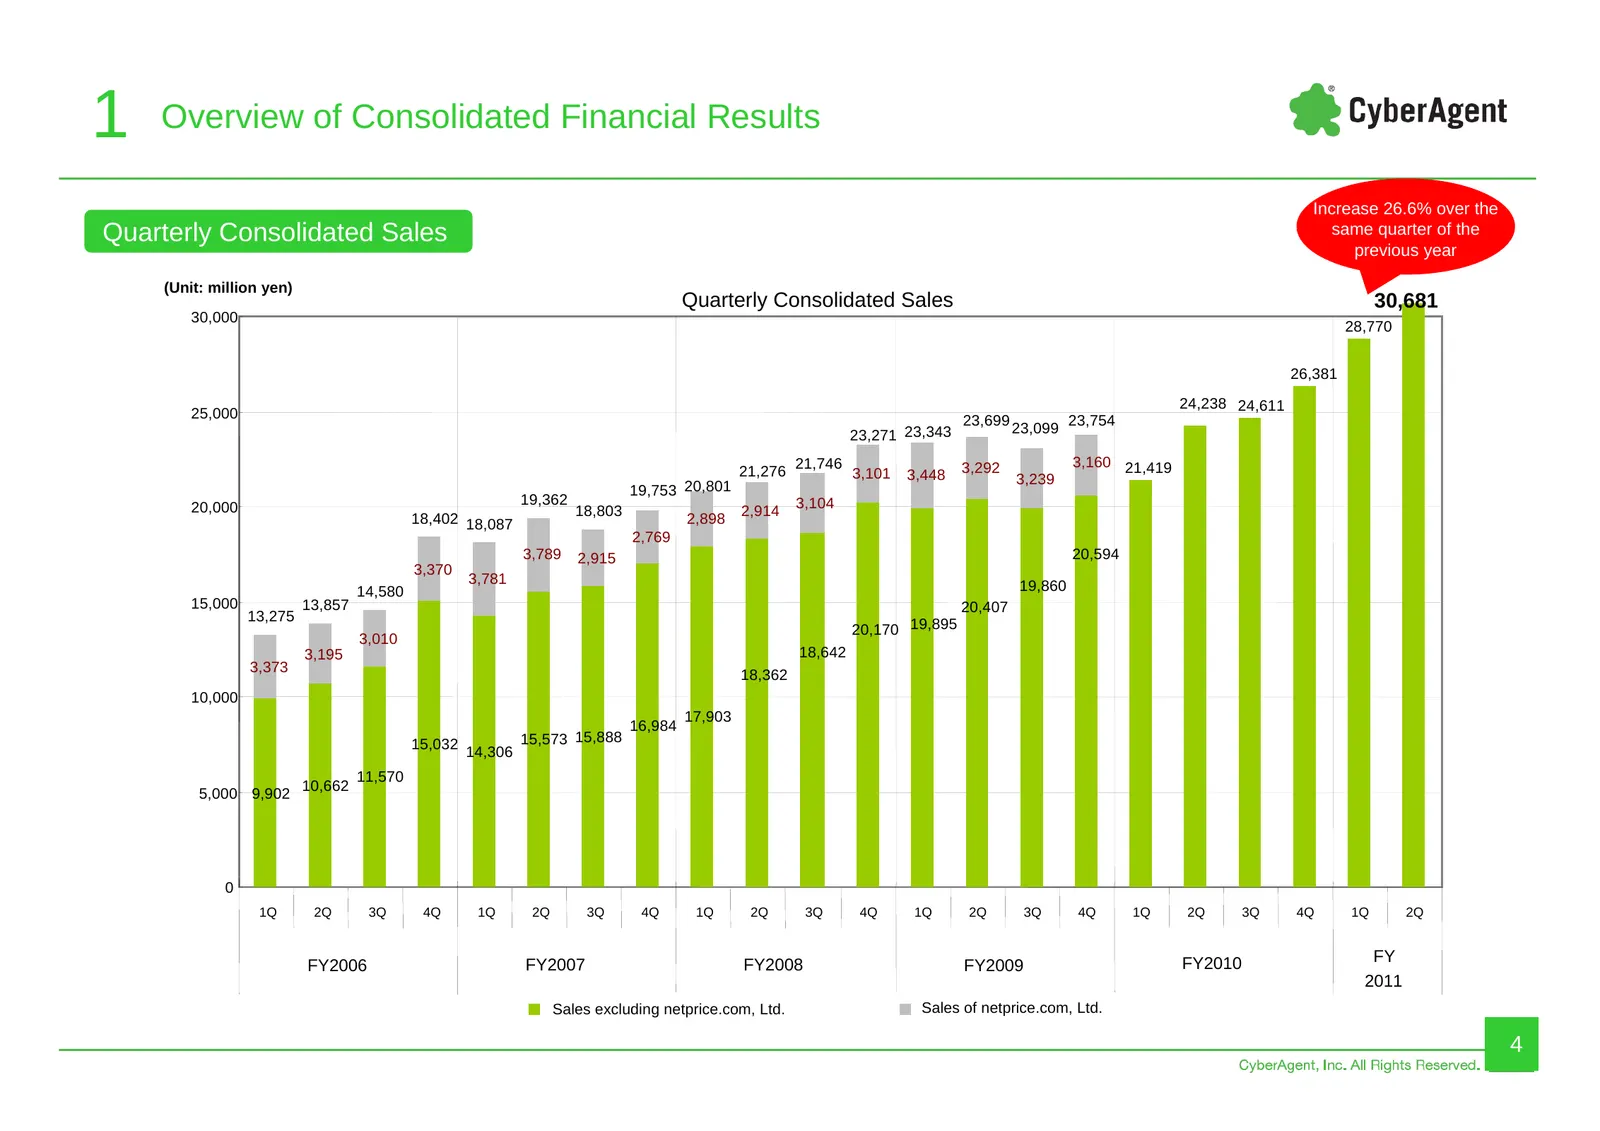
1 Overview of Consolidated Financial Results Increase 26.6% over the Quarterly Consolidated Sales same quarter of the previous year (Unit: million yen) Quarterly Consolidated Sales 30,681 30,000 28,770 26,381 24,238 24,611 25,000 23,699 23,099 23,754 23,271 23,343 21,746 3,292 3,160 21,419 21,276 3,
Slide 5: Quarterly Operating Profit by Business Segments
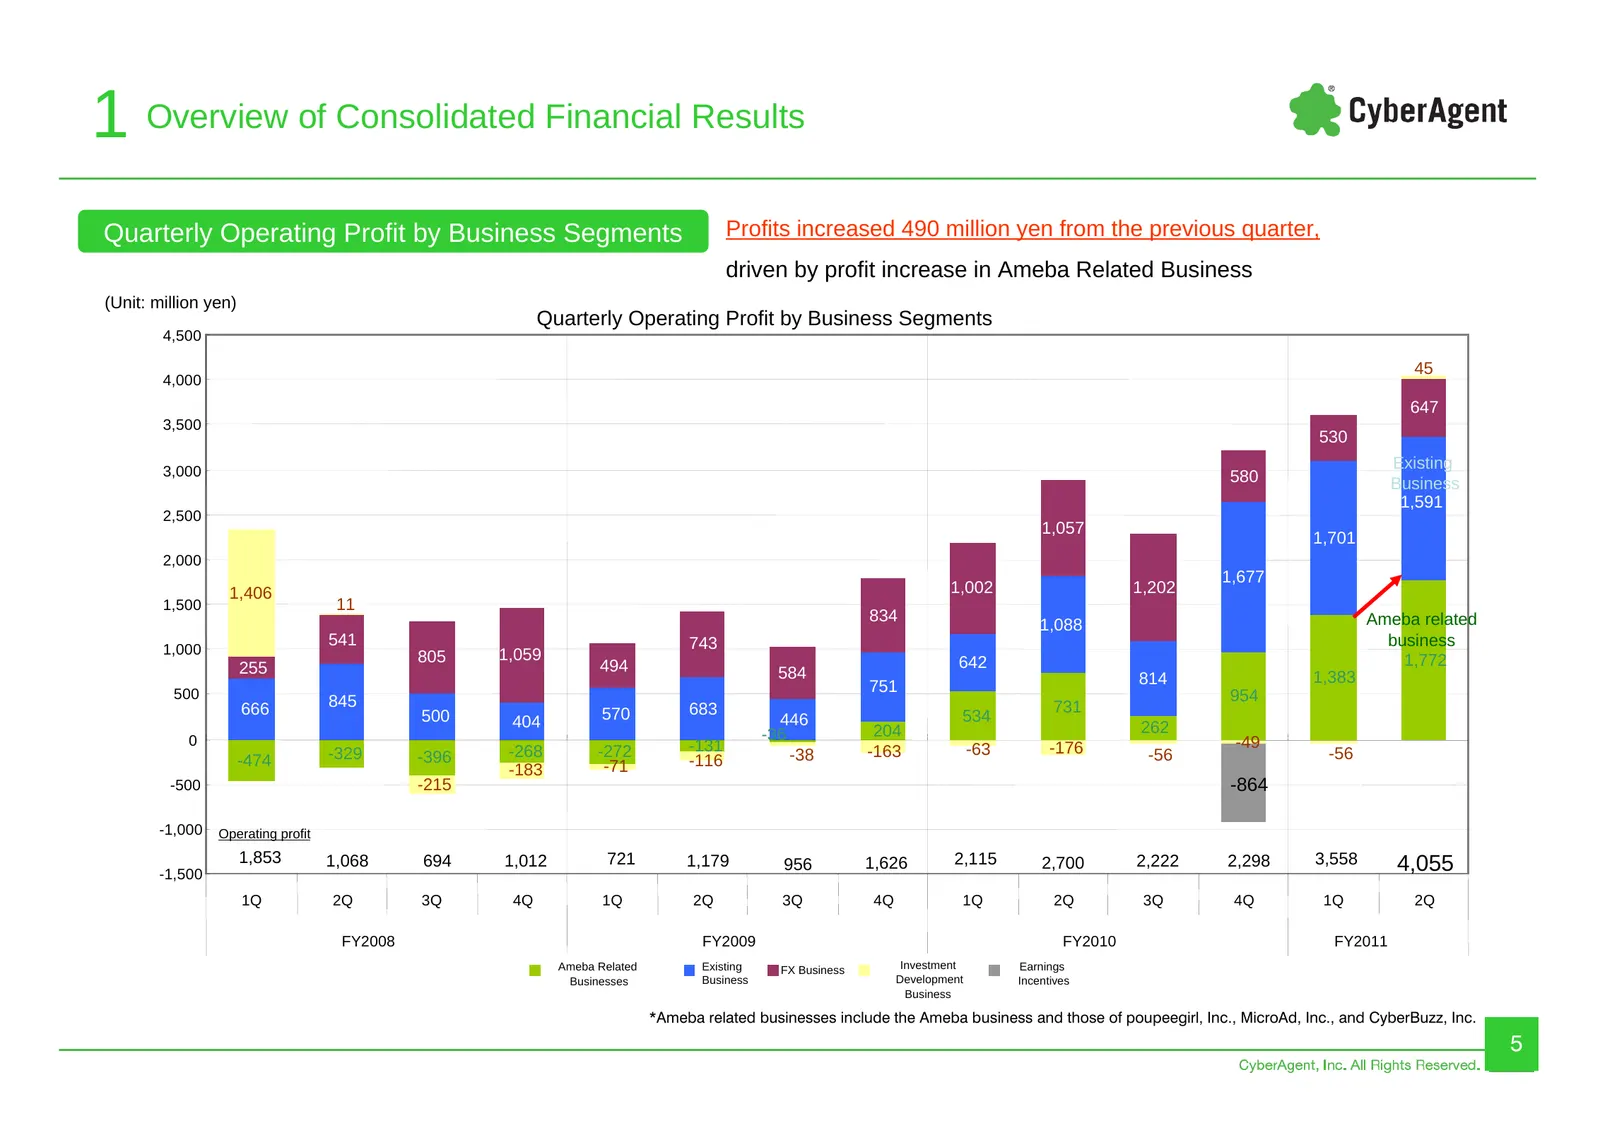
1 Overview of Consolidated Financial Results Quarterly Operating Profit by Business Segments Profits increased 490 million yen from the previous quarter, driven by profit increase in Ameba Related Business (Unit: million yen) Quarterly Operating Profit by Business Segments 4,500 45 4,000 647 3,500 5
Slide 6: PL: Record-high operating profit margin 13.2%
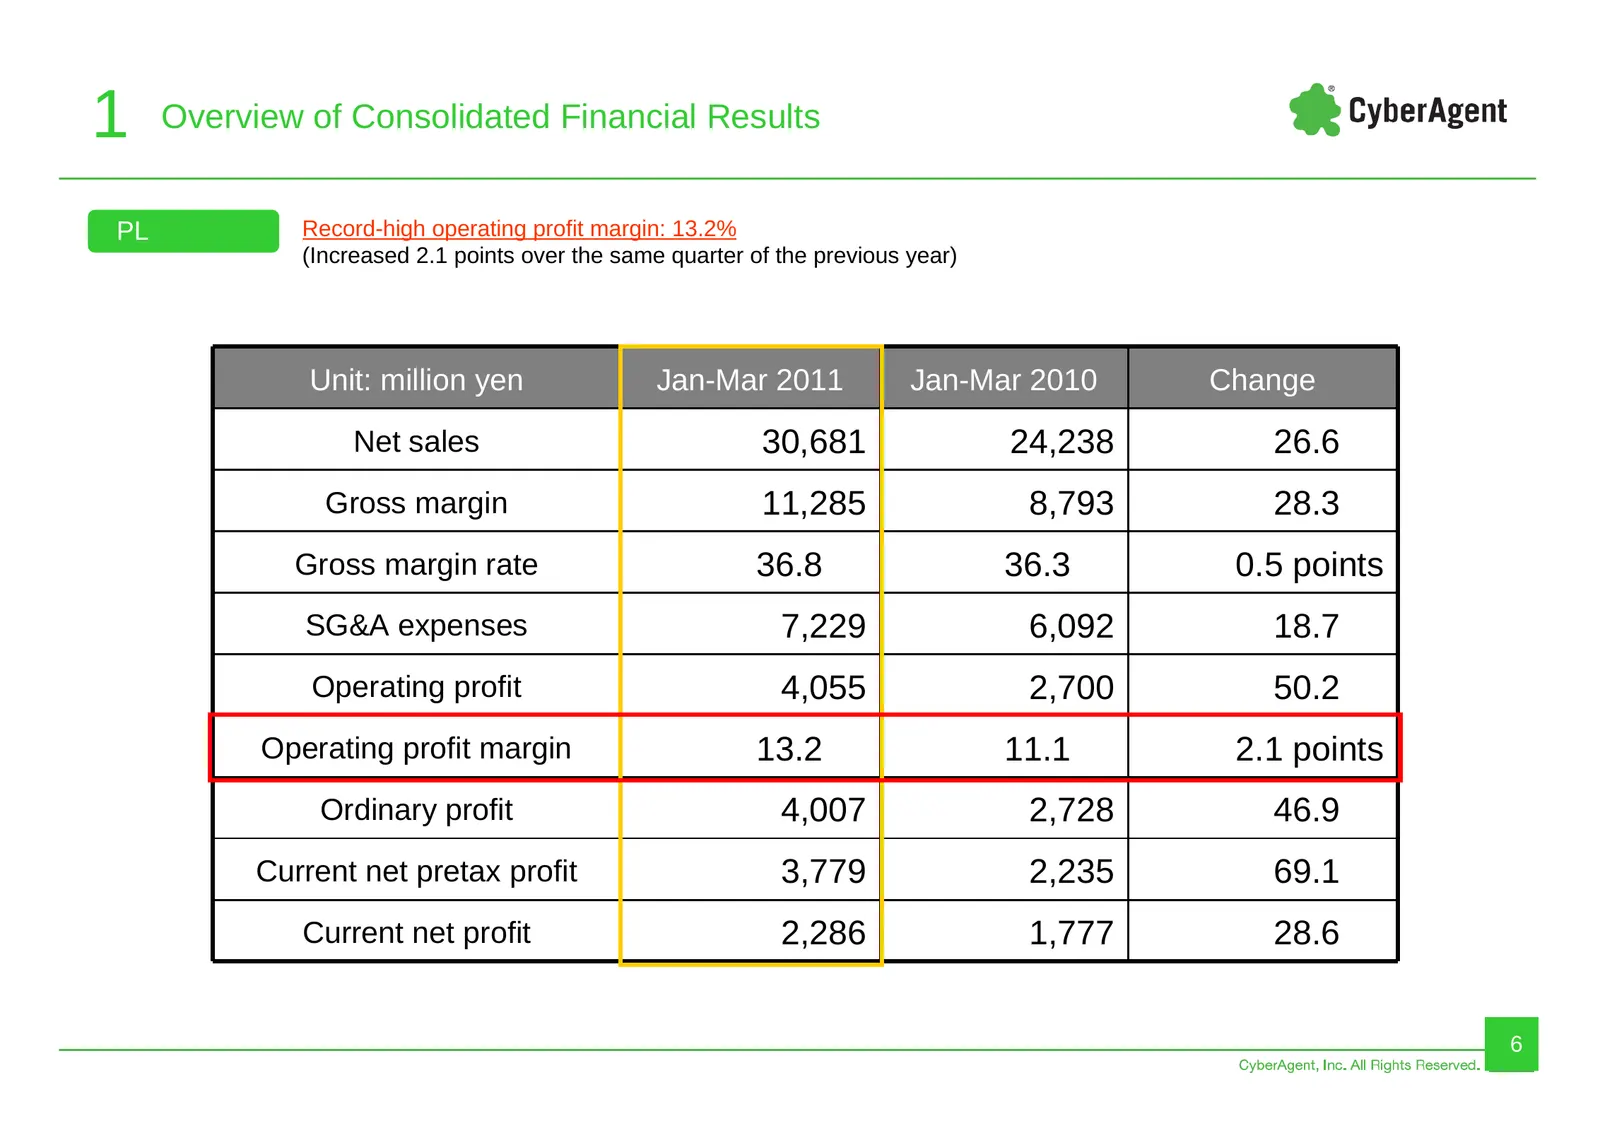
1 Overview of Consolidated Financial Results PL Record-high operating profit margin: 13.2% (Increased 2.1 points over the same quarter of the previous year) Unit: million yen Jan-Mar 2011 Jan-Mar 2010 Change Net sales 30,681 24,238 26.6 Gross margin 11,285 8,793 28.3 Gross margin rate 36.8 36.3 0.5
Slide 7: Quarterly SG&A Expenses
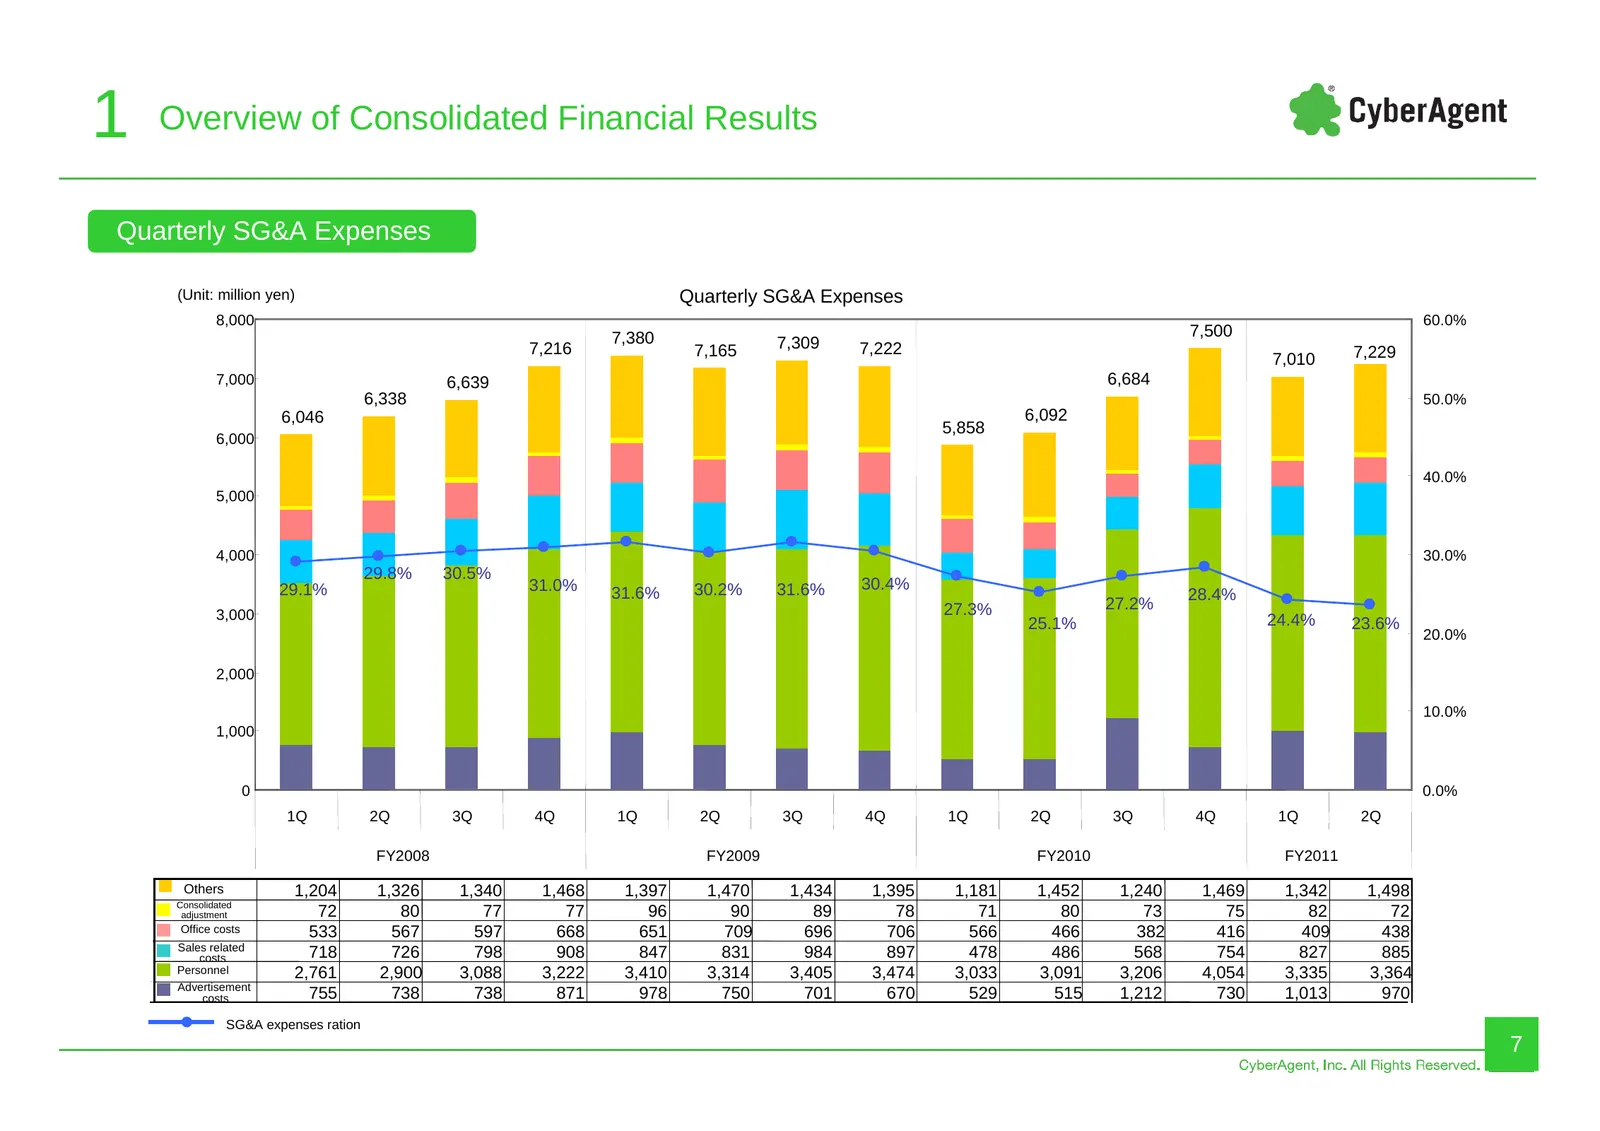
1 Overview of Consolidated Financial Results Quarterly SG&A Expenses (Unit: million yen) Quarterly SG&A Expenses 8,000 60.0% 7,380 7,500 7,216 7,165 7,309 7,222 7,010 7,229 7,000 6,639 6,684 6,338 50.0% 6,046 6,092 5,858 6,000 40.0% 5,000 4,000 30.0% 29.8% 30.5% 29.1% 31.0% 30.2% 31.6% 30.4% 31.6% 2
Slide 8: Quarterly Number of Employees in Consolidated Companies
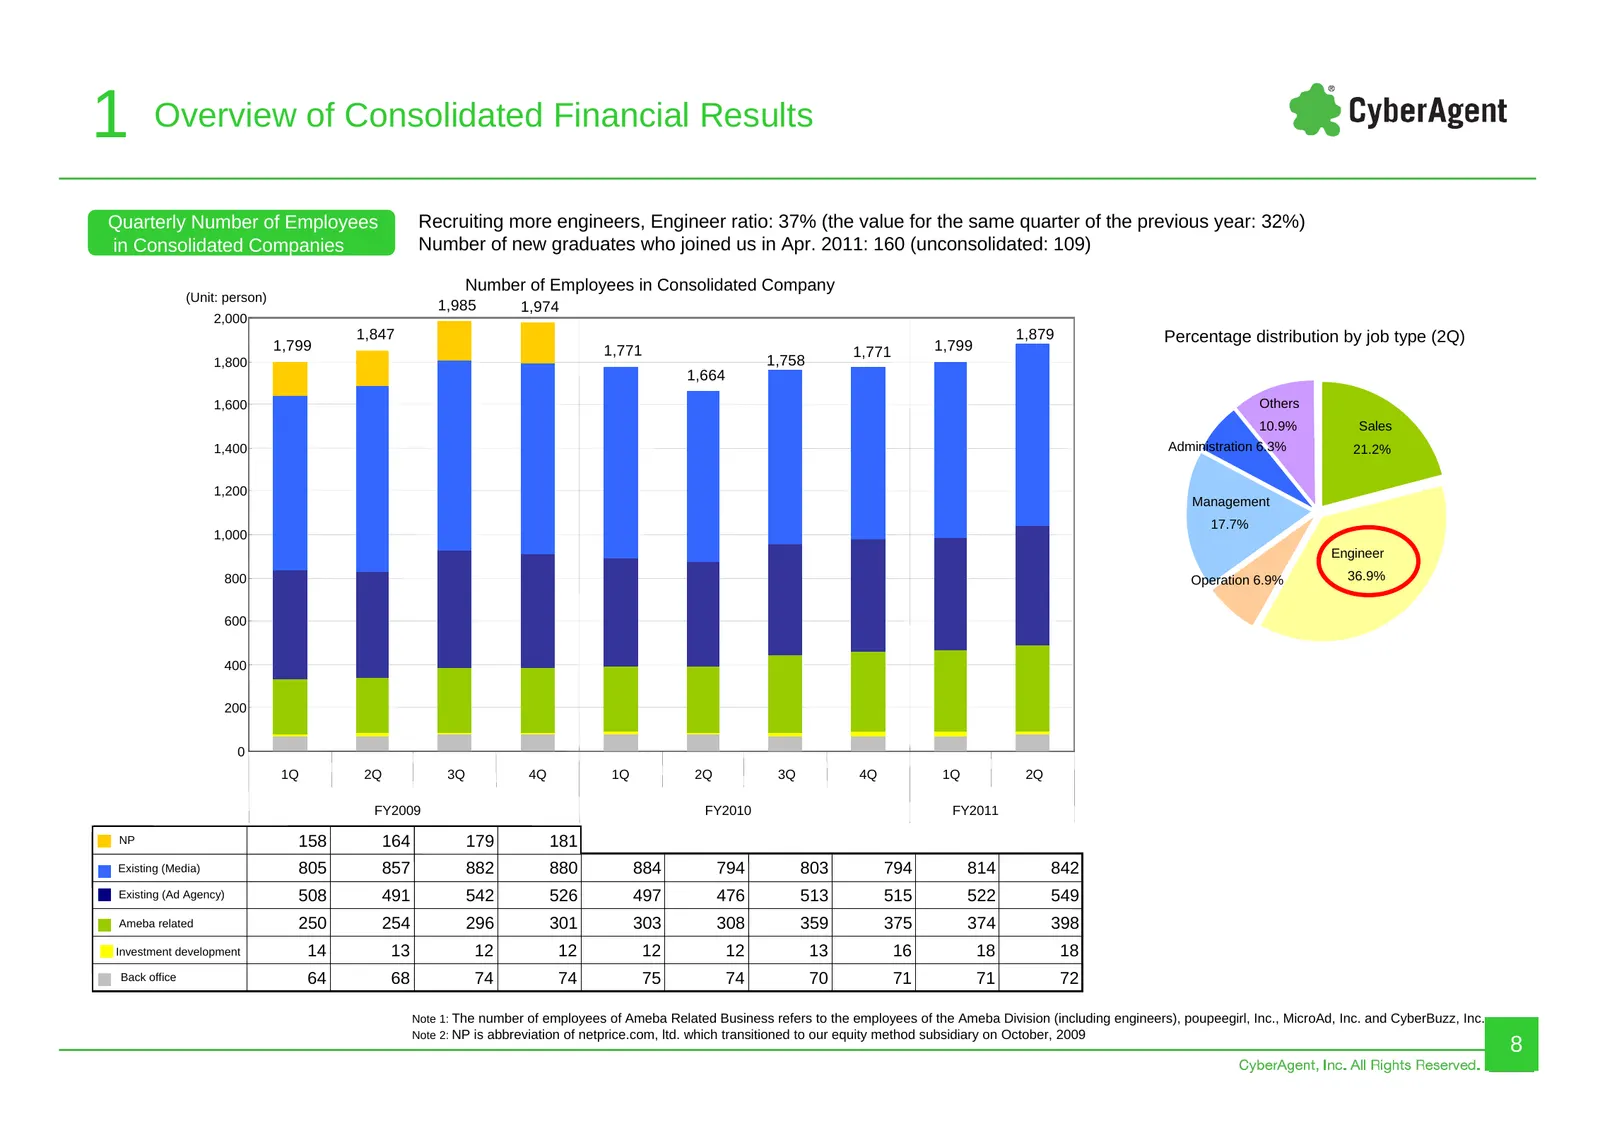
1 Overview of Consolidated Financial Results Quarterly Number of Employees Recruiting more engineers, Engineer ratio: 37% (the value for the same quarter of the previous year: 32%) in Consolidated Companies Number of new graduates who joined us in Apr. 2011: 160 (unconsolidated: 109) Number of Emplo
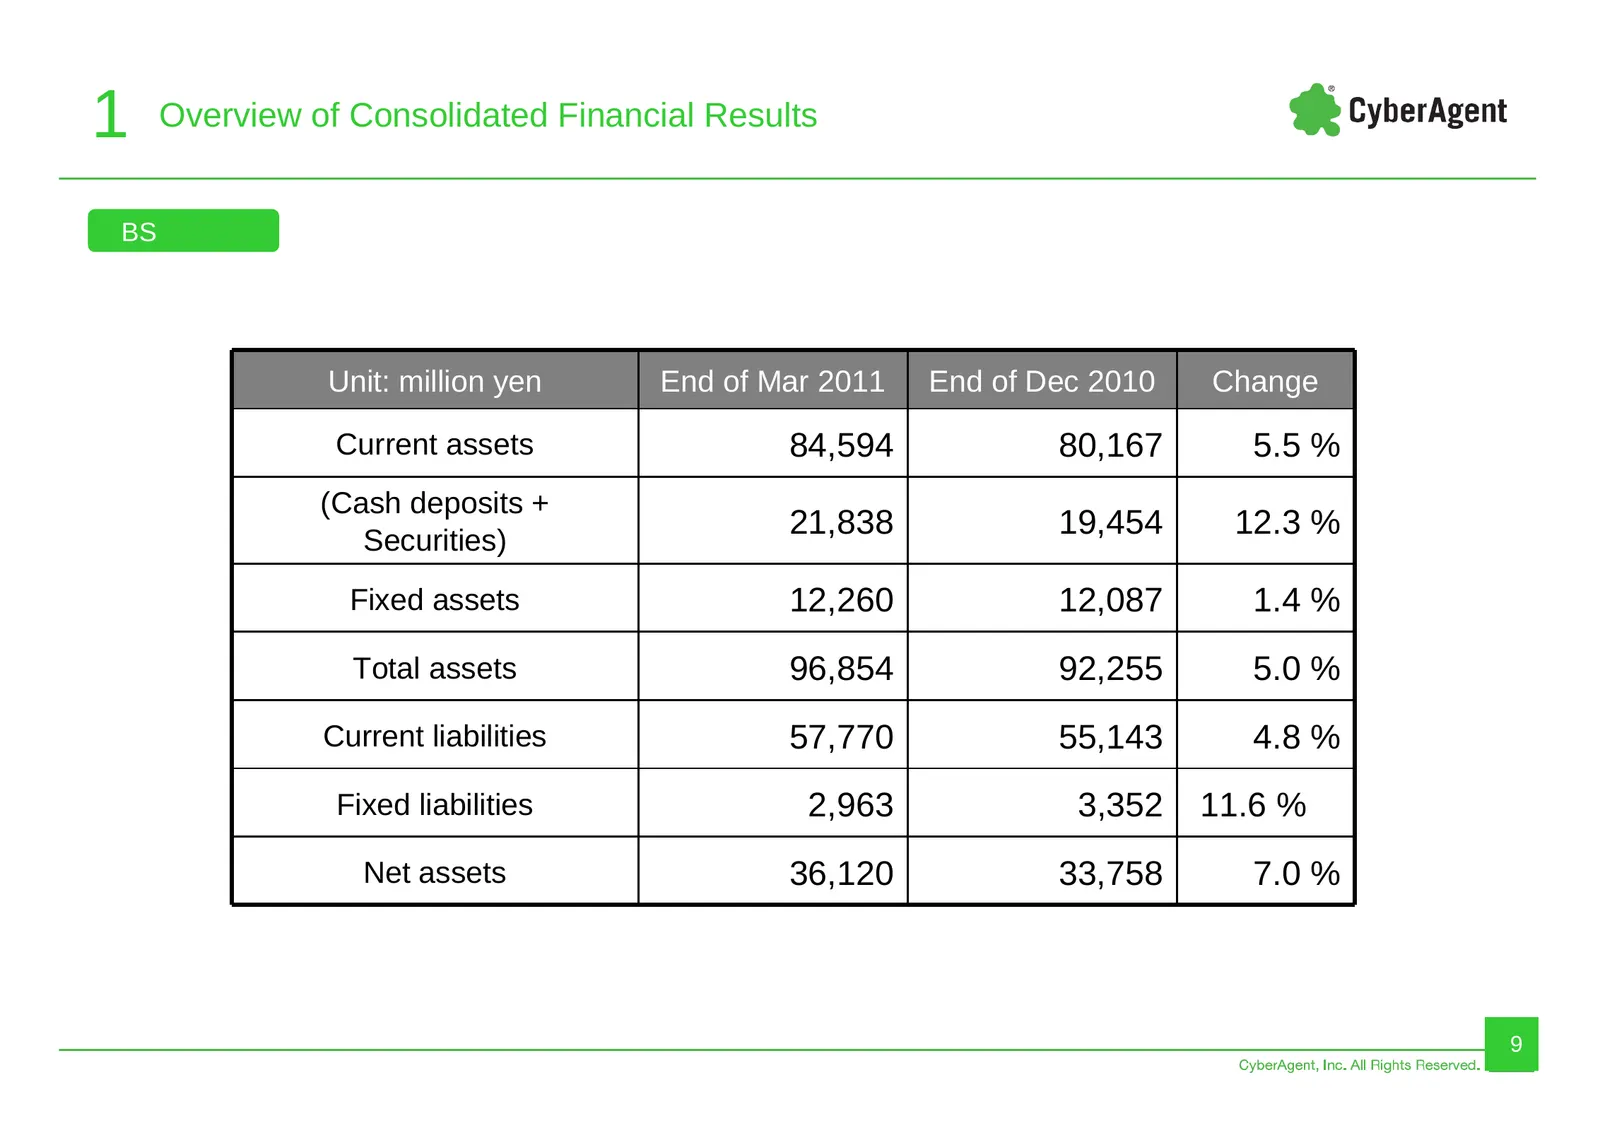
Slide 9: BS
1 Overview of Consolidated Financial Results BS Unit: million yen End of Mar 2011 End of Dec 2010 Change Current assets 84,594 80,167 5.5 % (Cash deposits + Securities) 21,838 19,454 12.3 % Fixed assets 12,260 12,087 1.4 % Total assets 96,854 92,255 5.0 % Current liabilities 57,770 55,143 4.8 % Fixe
Slide 10: Consolidated Business Forecast for the Year Ending September 2011
2 Consolidated Business Forecast Consolidated Business Forecast for the Year Ending September 2011 10
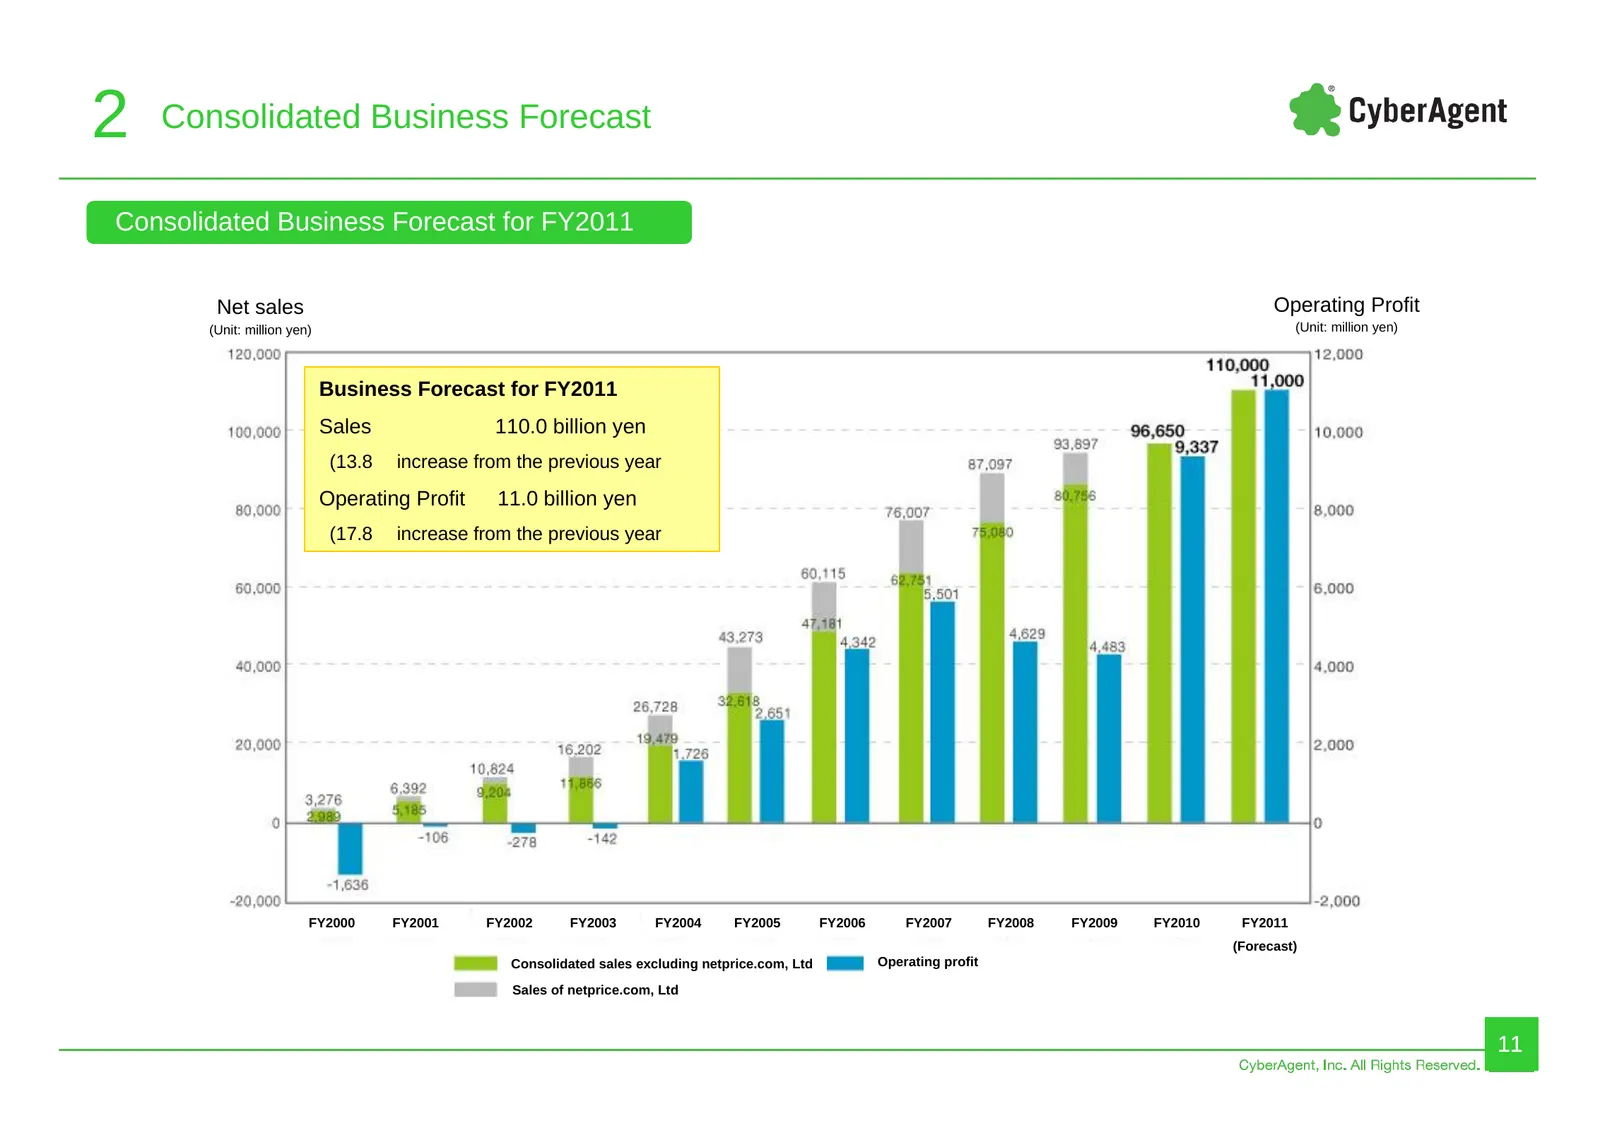
Slide 11: Consolidated Business Forecast for FY2011
2 Consolidated Business Forecast Consolidated Business Forecast for FY2011 Consolidated Business Forecast for FY2011 Net sales Operating Profit (Unit: million yen) (Unit: million yen) Business Forecast for FY2011 Sales 110.0 billion yen (13.8 increase from the previous year Operating Profit 11.0 bil
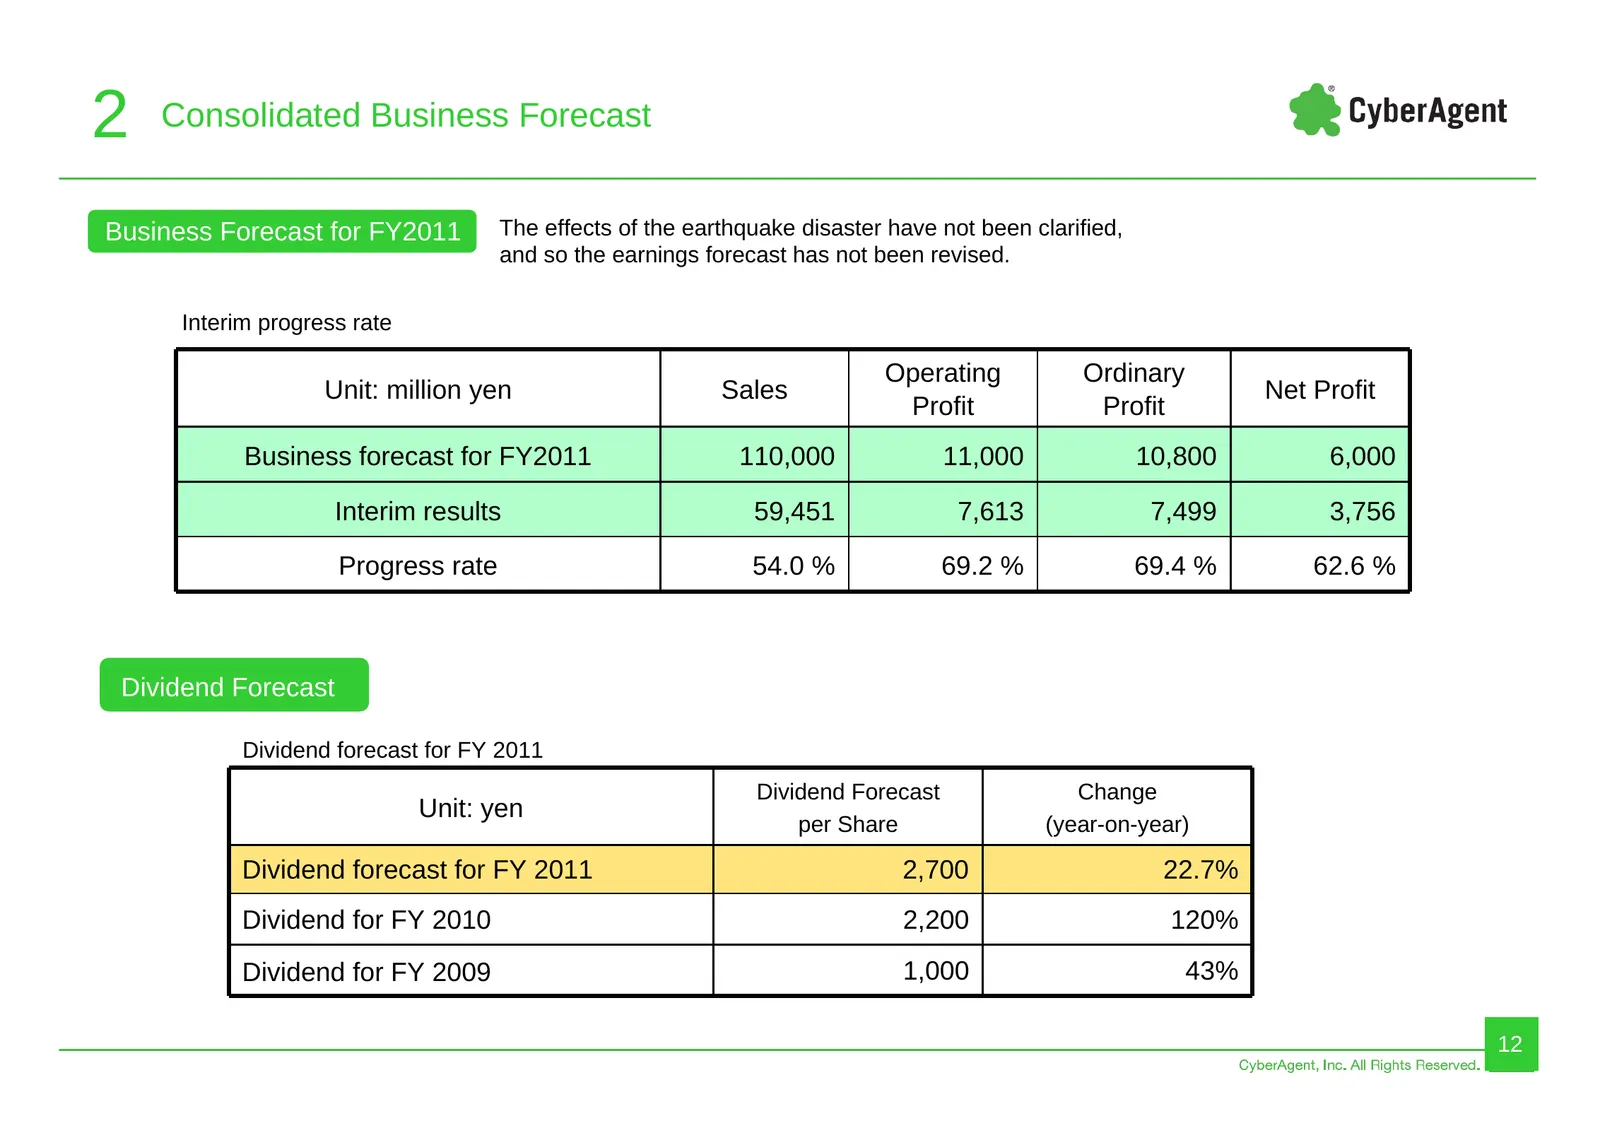
Slide 12: Business Forecast for FY2011 and Dividend Forecast
2 Consolidated Business Forecast Business Forecast for FY2011 The effects of the earthquake disaster have not been clarified, and so the earnings forecast has not been revised. Interim progress rate Operating Ordinary Unit: million yen Sales Net Profit Profit Profit Business forecast for FY2011 110,
Slide 13: Reference: Interim period (Oct. to Mar.) PL
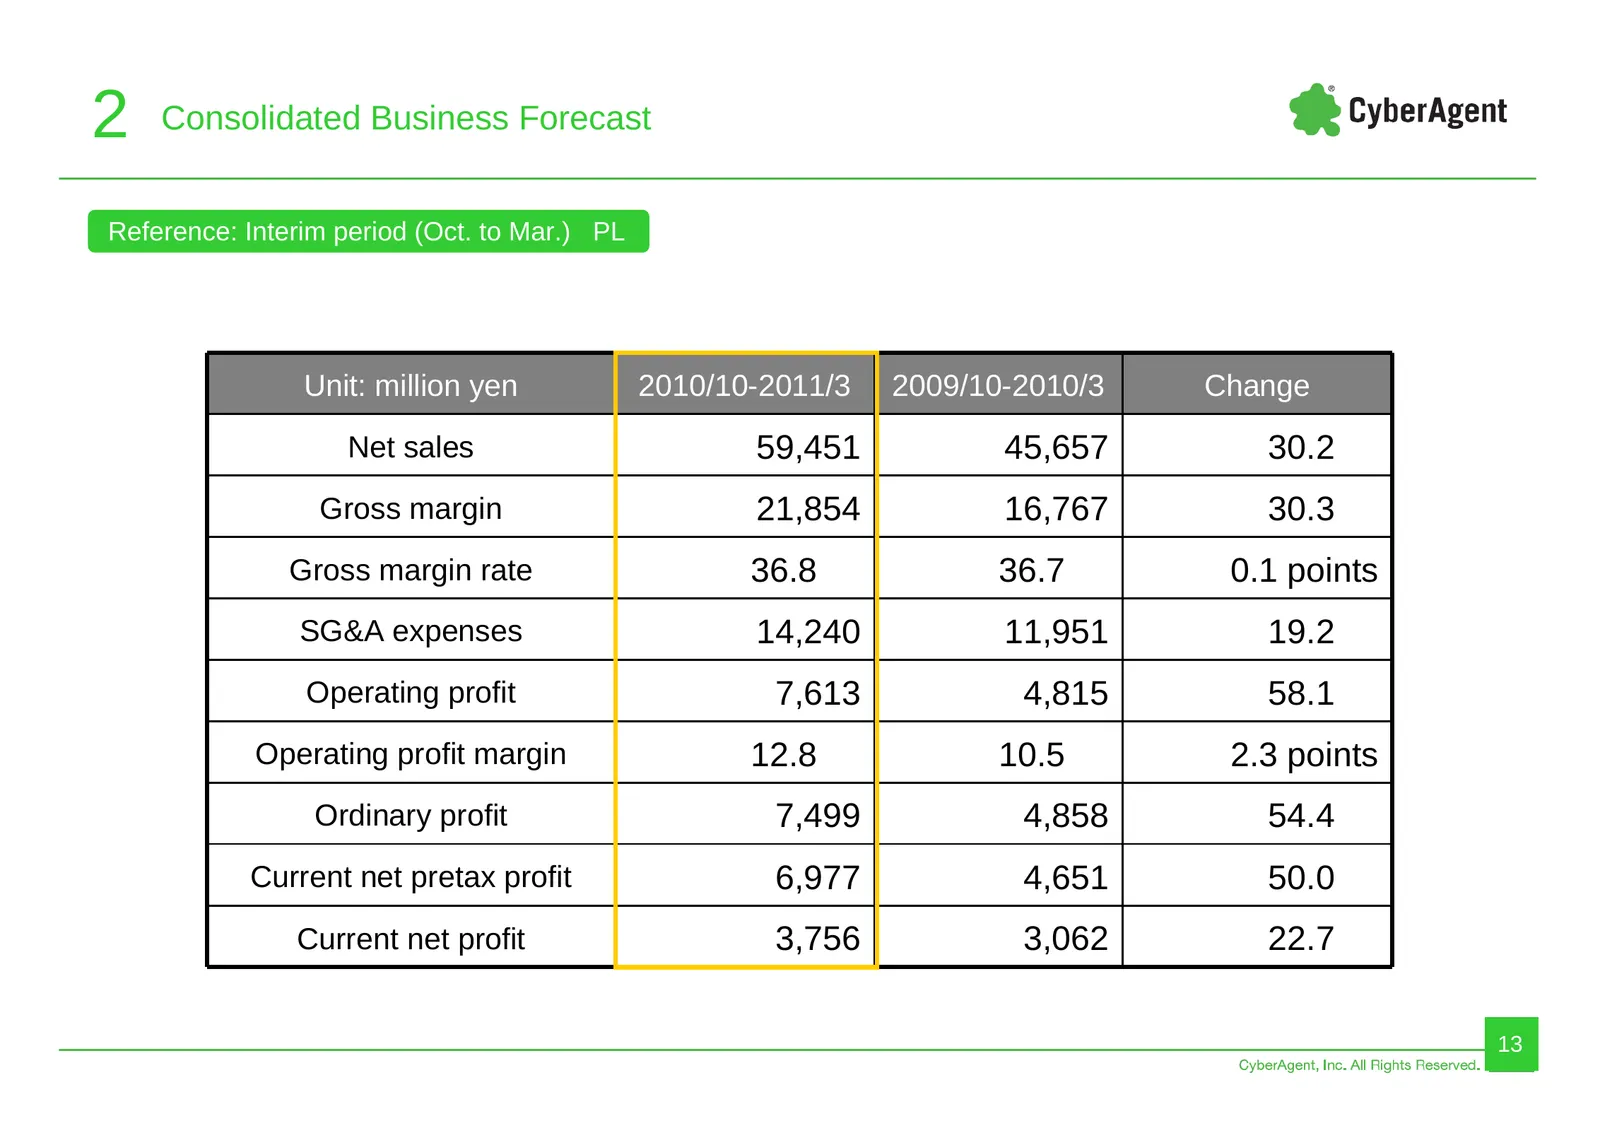
2 Consolidated Business Forecast Reference: Interim period (Oct. to Mar.) PL Unit: million yen 2010/10-2011/3 2009/10-2010/3 Change Net sales 59,451 45,657 30.2 Gross margin 21,854 16,767 30.3 Gross margin rate 36.8 36.7 0.1 points SG&A expenses 14,240 11,951 19.2 Operating profit 7,613 4,815 58.1 O
Slide 14: Trend in consolidated operating profit
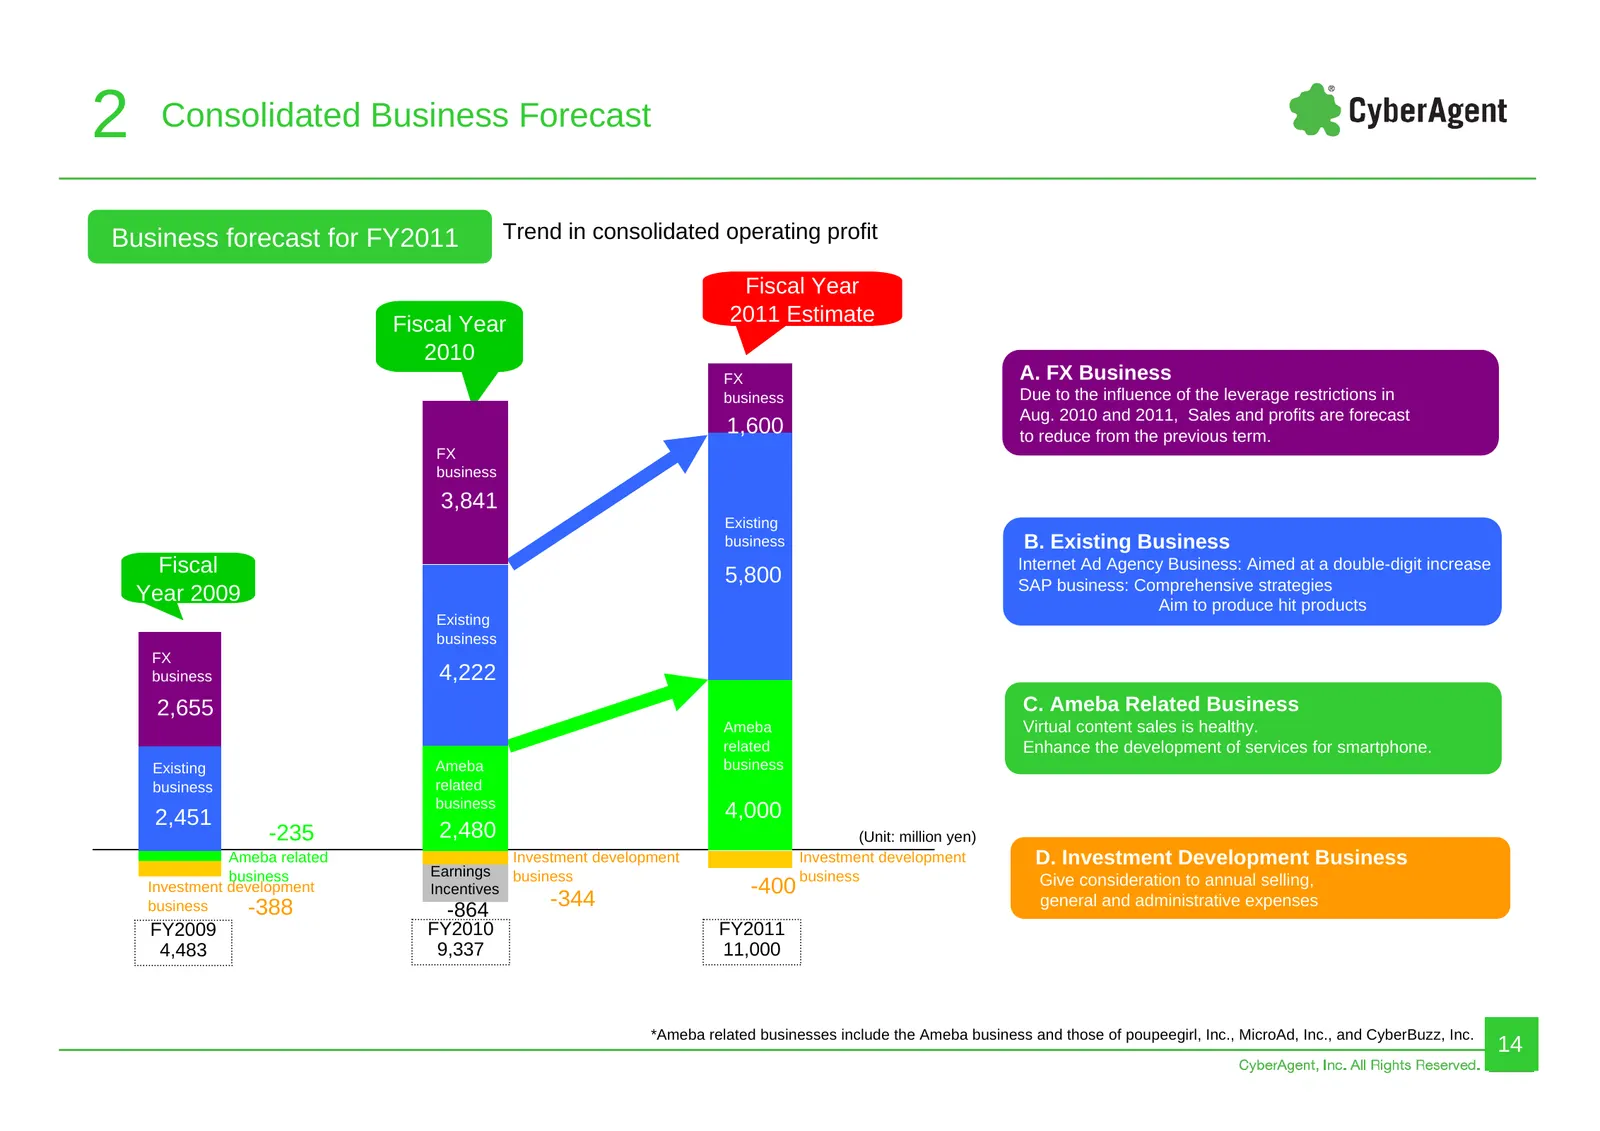
2 Consolidated Business Forecast Business forecast for FY2011 Trend in consolidated operating profit Fiscal Year Fiscal Year 2011 Estimate 2010 FX A. FX Business business Due to the influence of the leverage restrictions in Aug. 2010 and 2011, Sales and profits are forecast 1,600 to reduce from the
Slide 15: Major Business
3 Major Business Major Business 15
Slide 16: Major Business (Internet Advertising Agency Business)
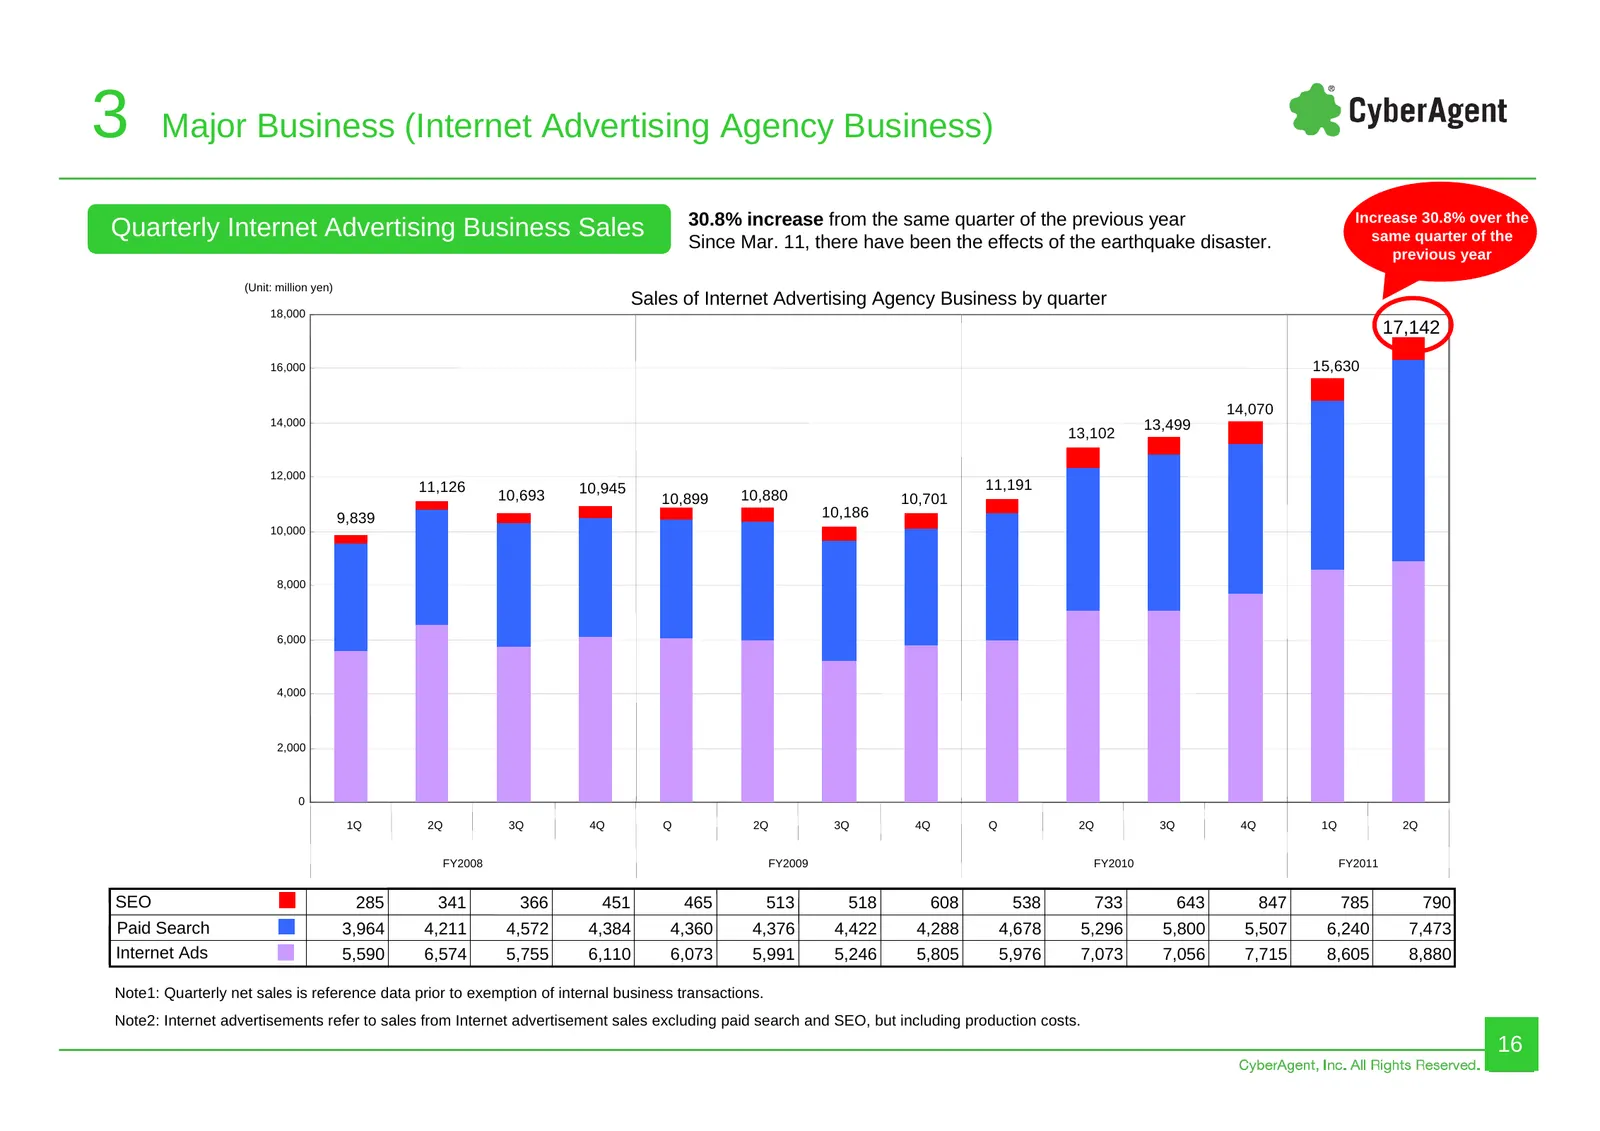
3 Major Business (Internet Advertising Agency Business) 30.8% increase from the same quarter of the previous year Increase 30.8% over the Quarterly Internet Advertising Business Sales Since Mar. 11, there have been the effects of the earthquake disaster. same quarter of the previous year (Unit: mill
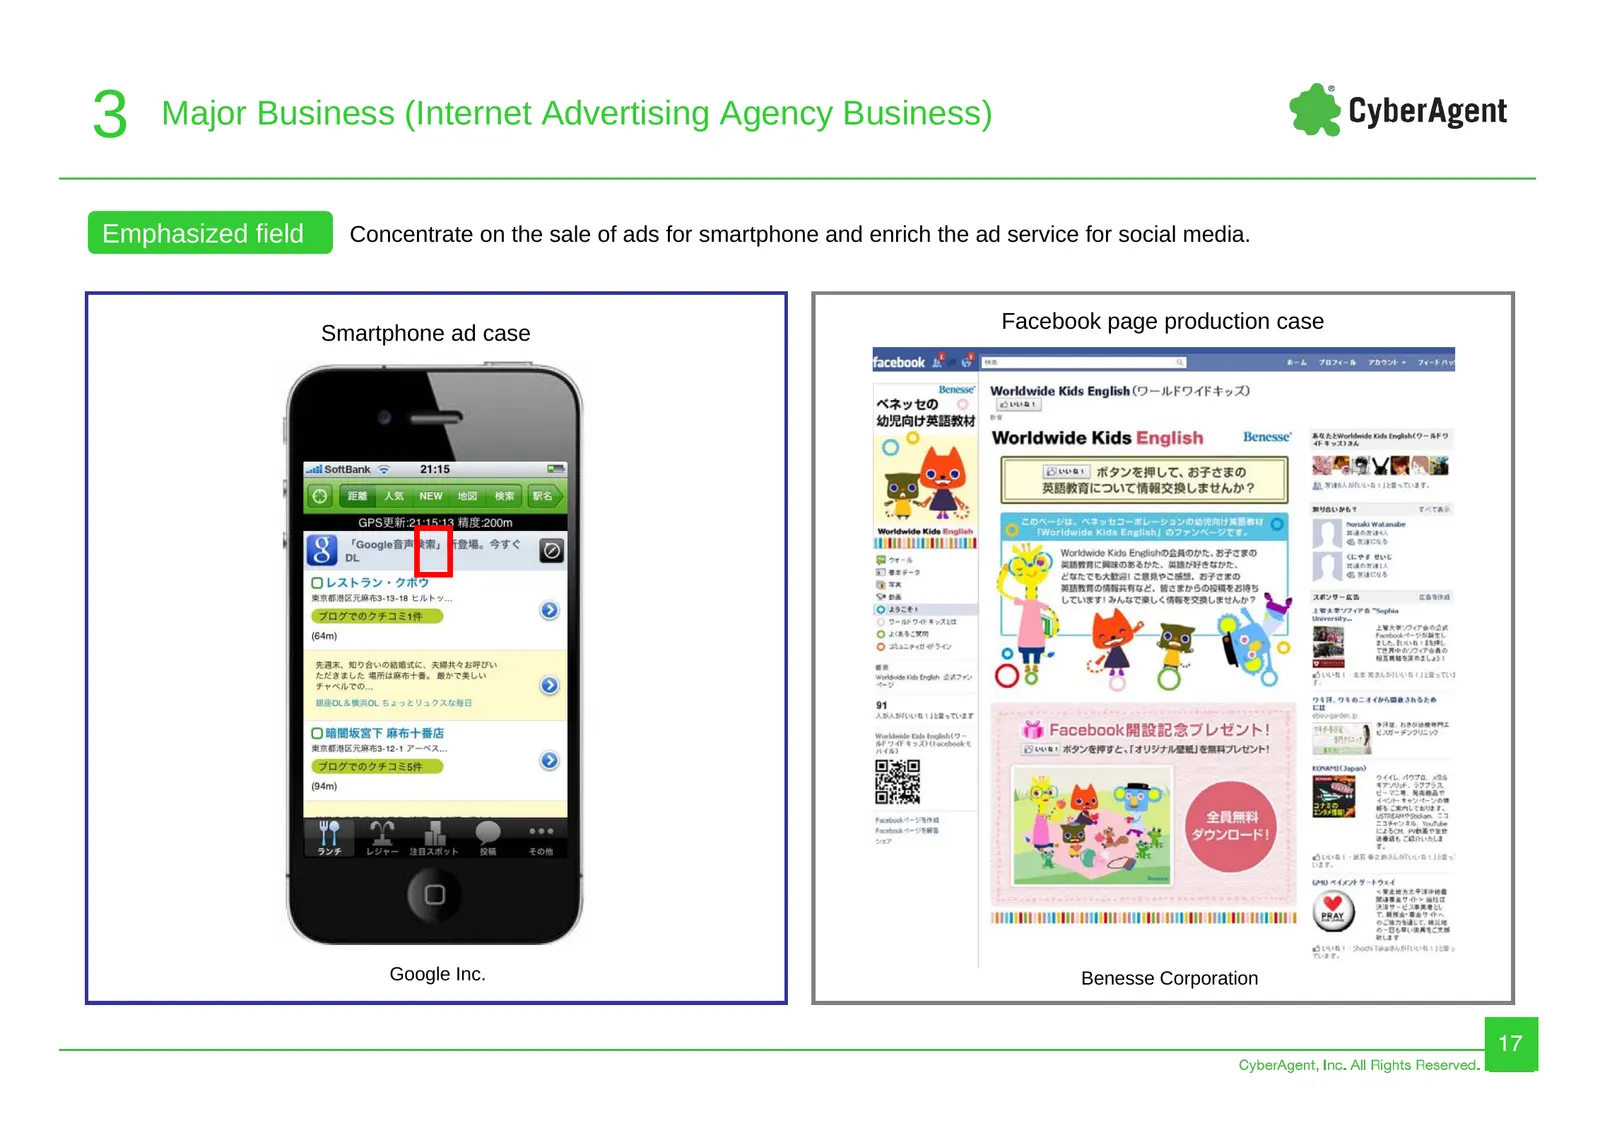
Slide 17: Internet Advertising Agency: Emphasized field
3 Major Business (Internet Advertising Agency Business) Emphasized field Concentrate on the sale of ads for smartphone and enrich the ad service for social media. Facebook page production case Smartphone ad case Google Inc. Benesse Corporation 17
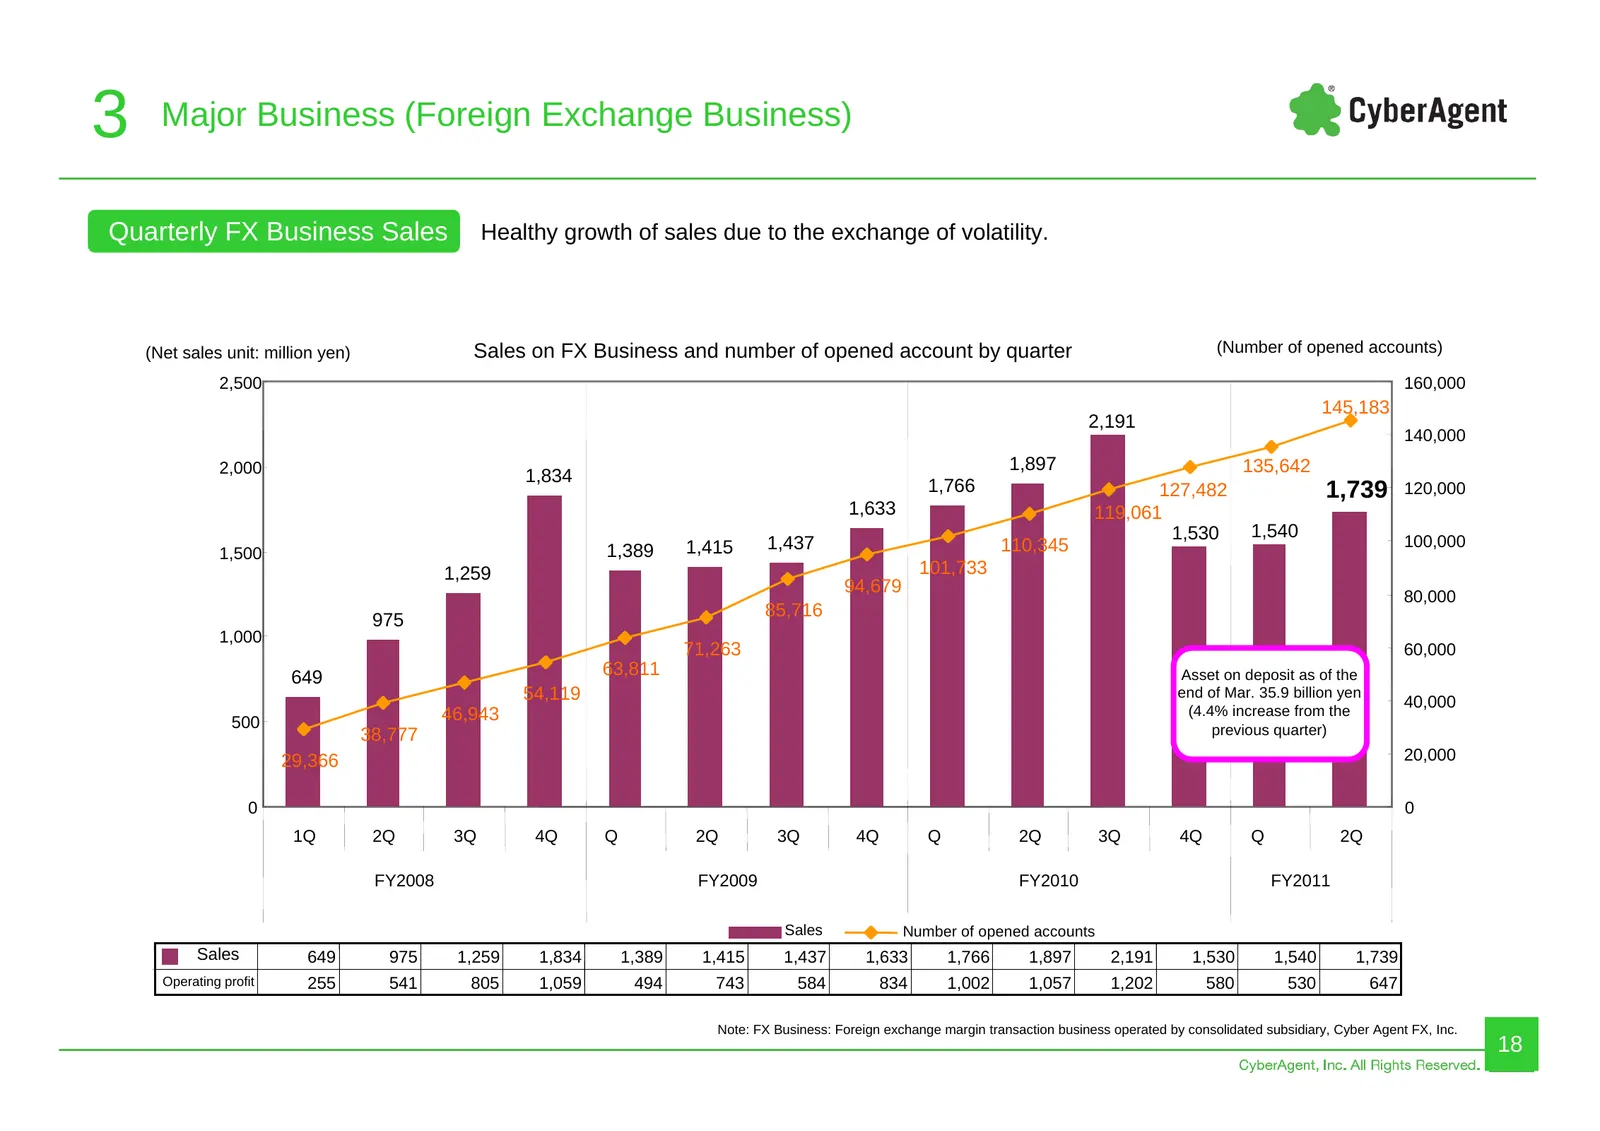
Slide 18: Major Business (Foreign Exchange Business)
3 Major Business (Foreign Exchange Business) Quarterly FX Business Sales Healthy growth of sales due to the exchange of volatility. (Net sales unit: million yen) Sales on FX Business and number of opened account by quarter (Number of opened accounts) 2,500 160,000 145,183 2,191 140,000 2,000 1,897 1
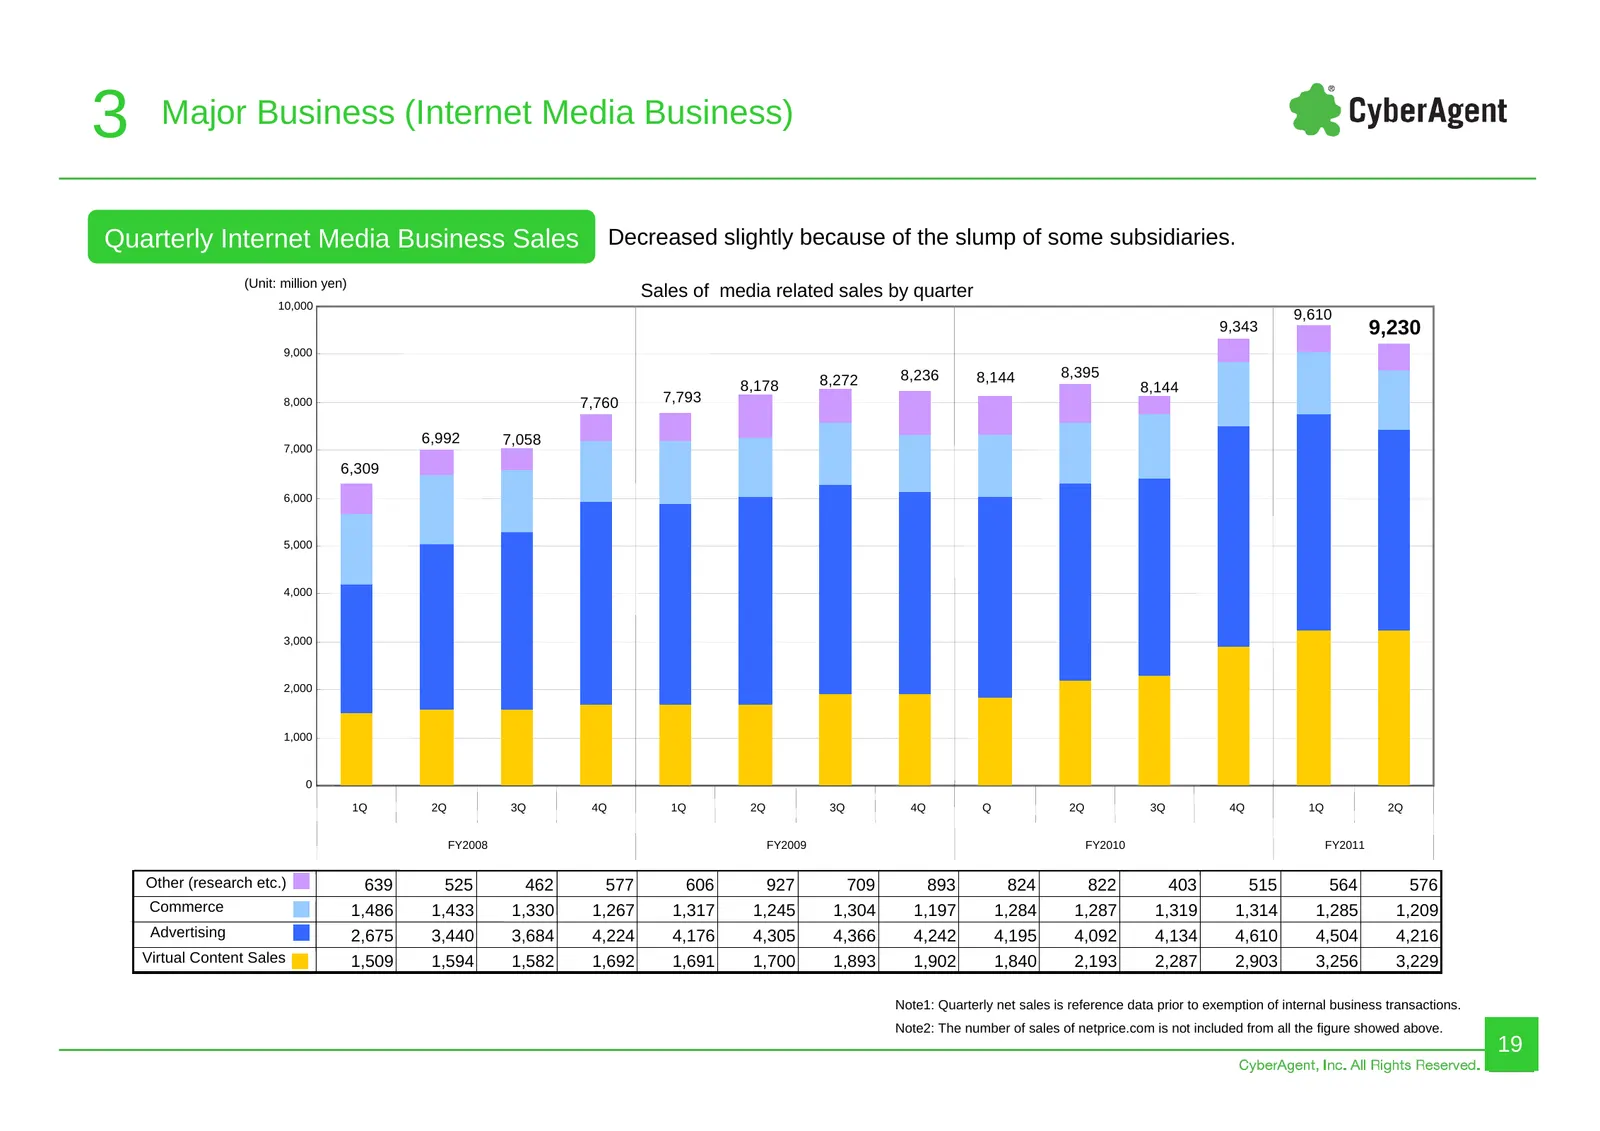
Slide 19: Major Business (Internet Media Business)
3 Major Business (Internet Media Business) Quarterly Internet Media Business Sales Decreased slightly because of the slump of some subsidiaries. (Unit: million yen) Sales of media related sales by quarter 10,000 9,610 9,343 9,230 9,000 8,236 8,144 8,395 8,178 8,272 8,144 8,000 7,760 7,793 6,992 7,05
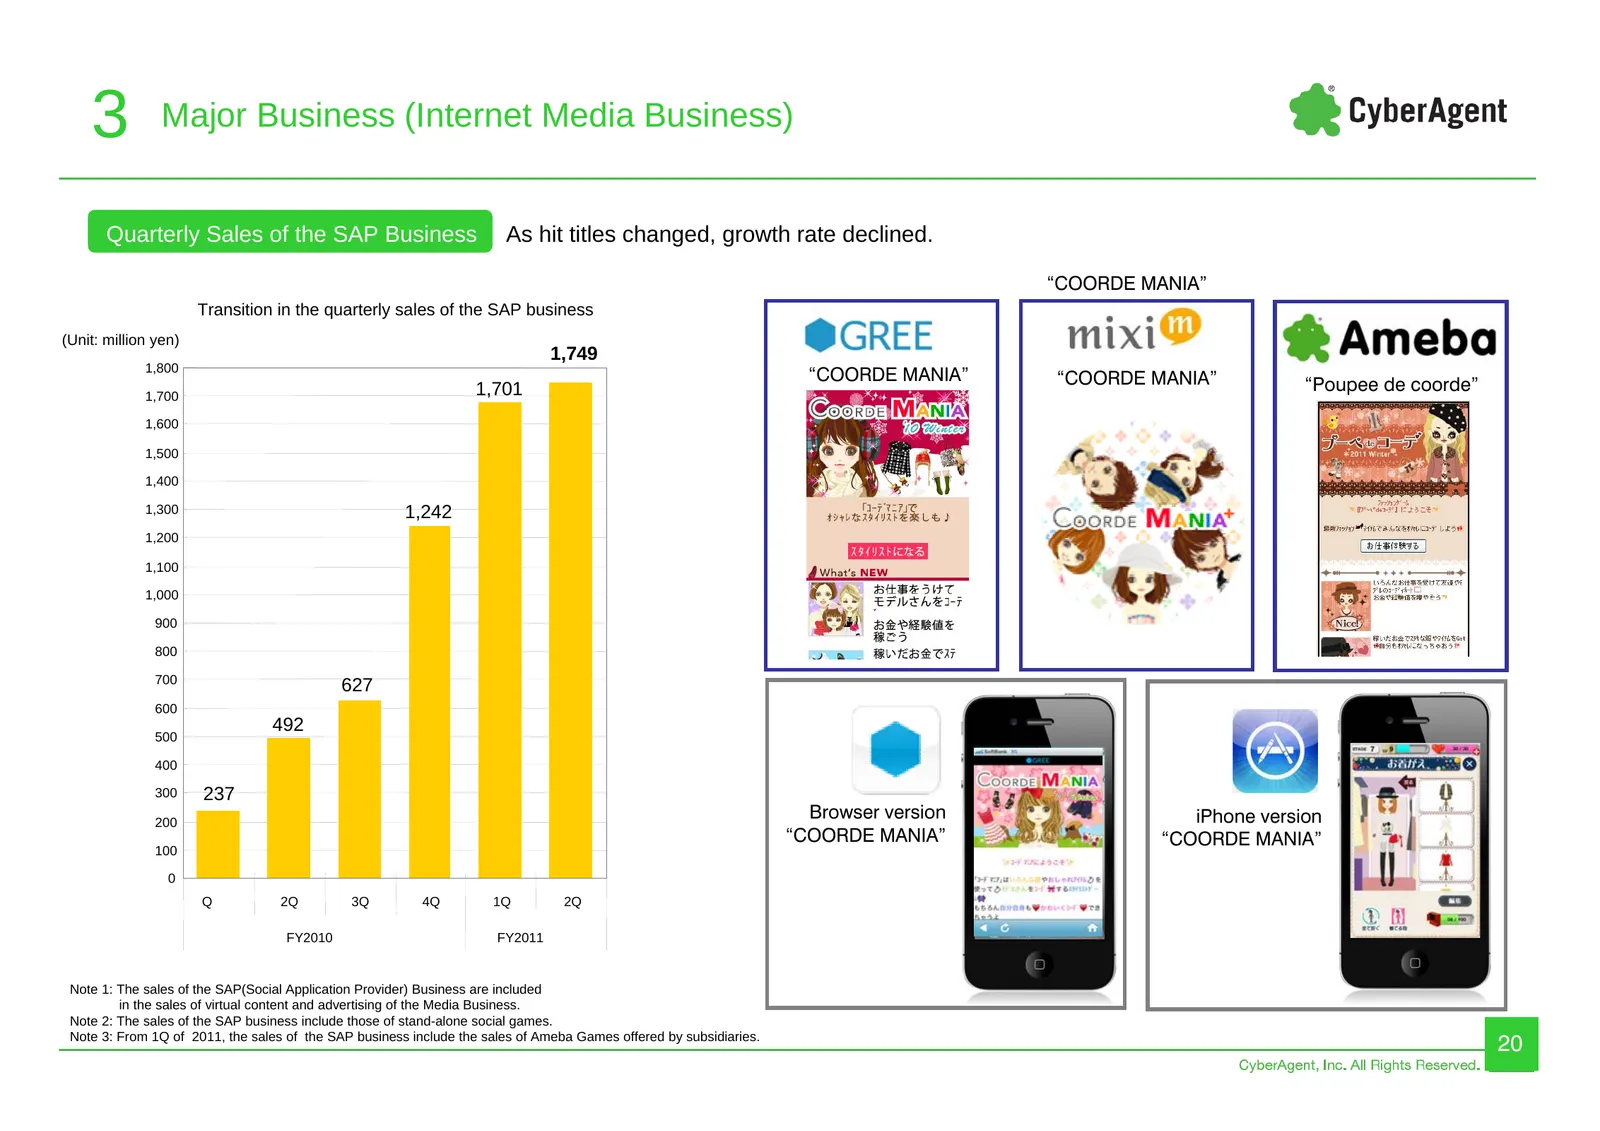
Slide 20: Quarterly Sales of the SAP Business
3 Major Business (Internet Media Business) Quarterly Sales of the SAP Business As hit titles changed, growth rate declined. “COORDE MANIA” Transition in the quarterly sales of the SAP business (Unit: million yen) 1,749 1,800 “COORDE MANIA” “COORDE MANIA” 1,701 “Poupee de coorde” 1,700 1,600 1,500 1,
Slide 21: SAP Business: social games and applications
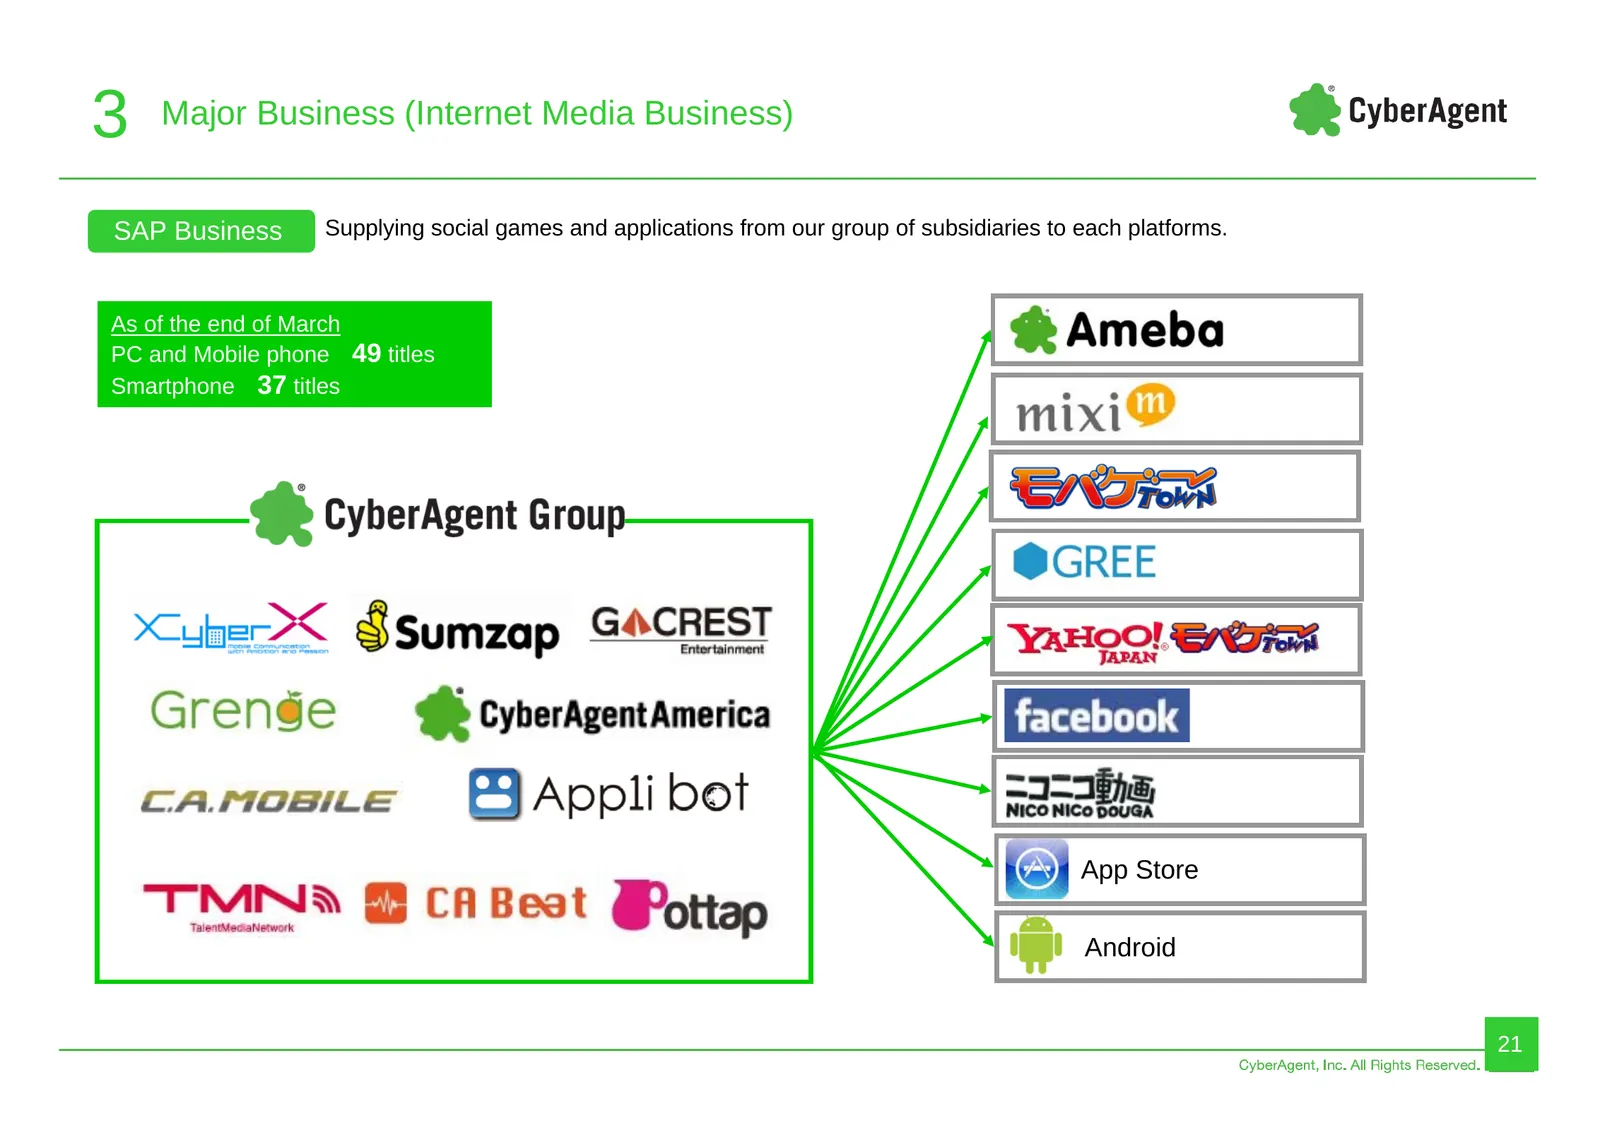
3 Major Business (Internet Media Business) SAP Business Supplying social games and applications from our group of subsidiaries to each platforms. As of the end of March PC and Mobile phone 49 titles Smartphone 37 titles App Store Android 21
Slide 22: SAP Business: smartphone applications
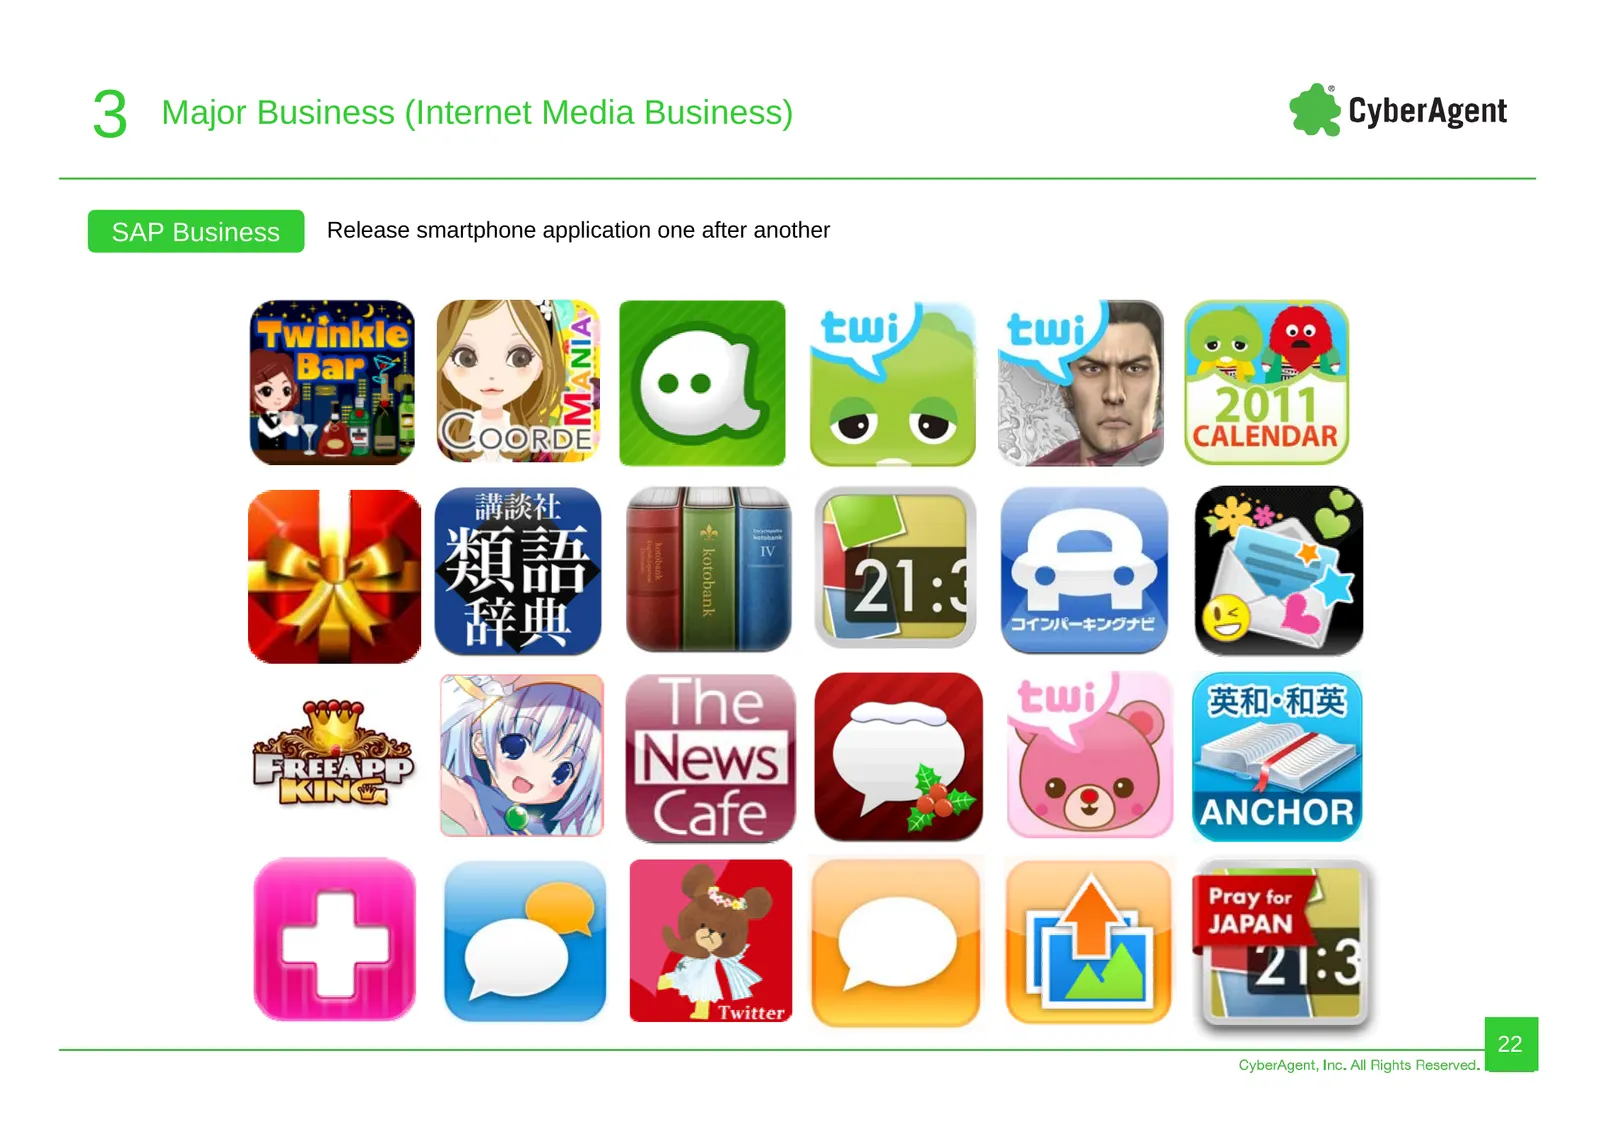
3 Major Business (Internet Media Business) SAP Business Release smartphone application one after another 22
Slide 23: Ameba Business
4 Ameba Business Ameba Business 23
Slide 24: Ameba Monthly Page Views
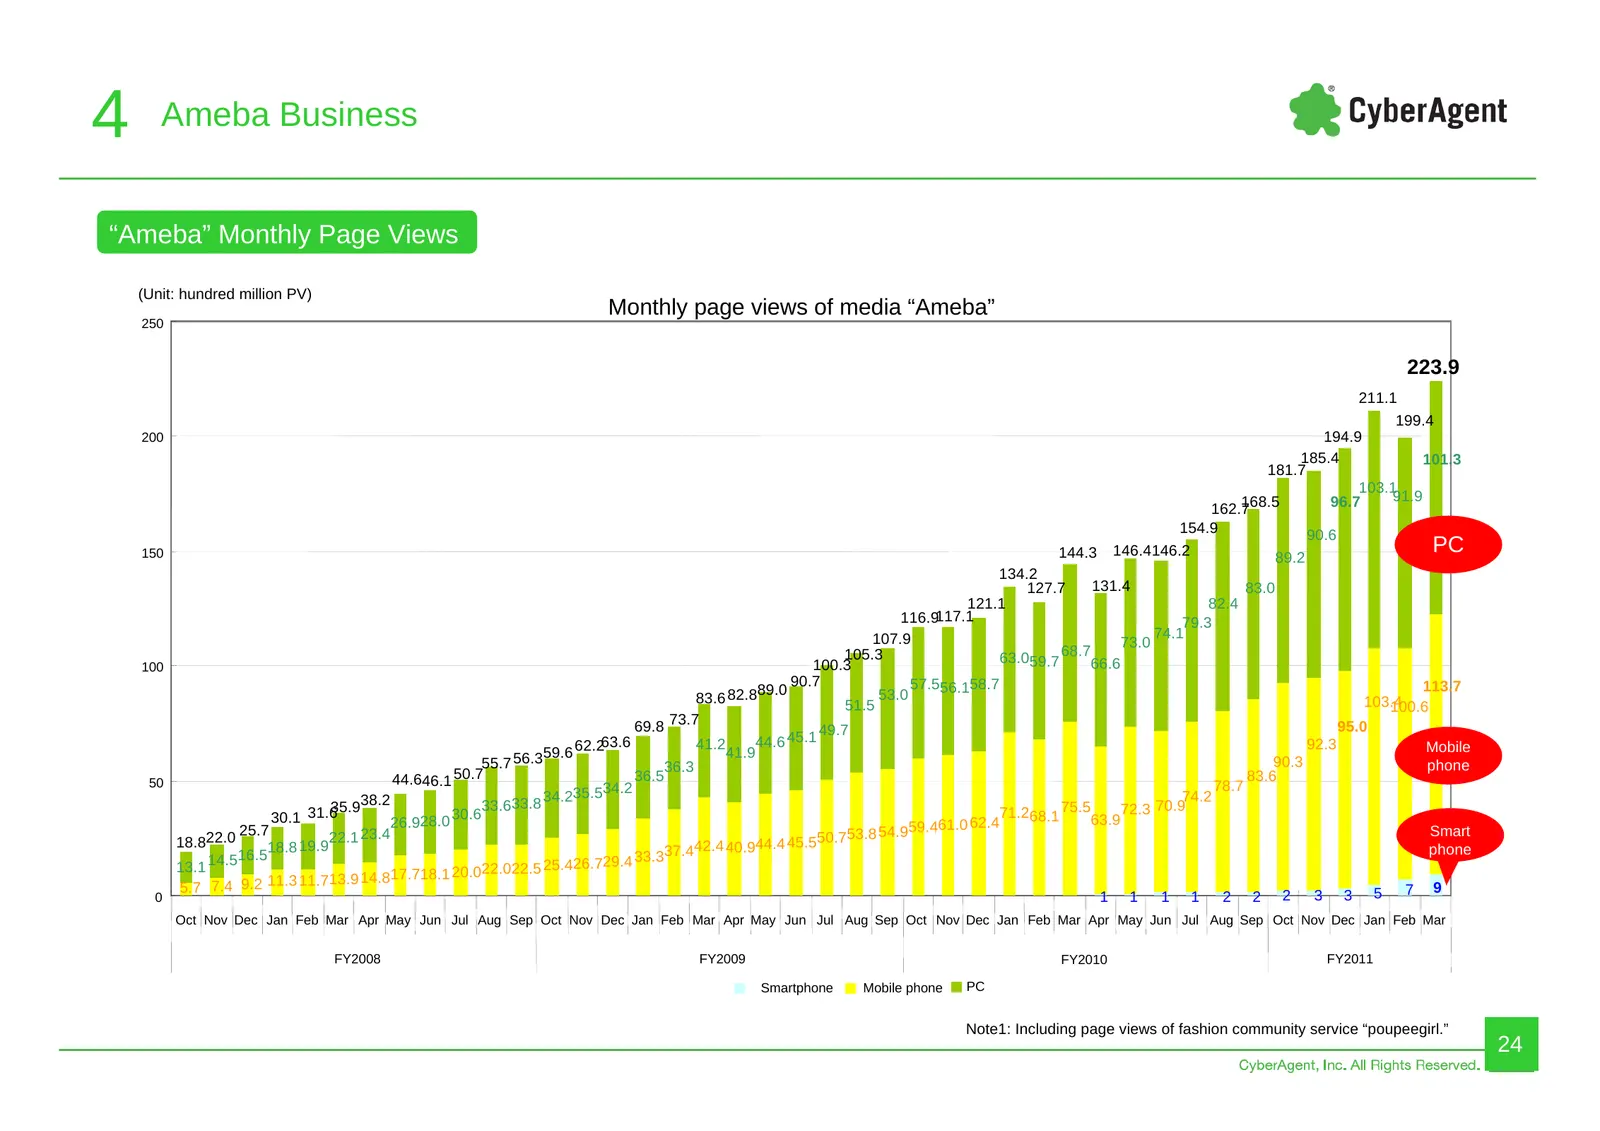
4 Ameba Business “Ameba” Monthly Page Views (Unit: hundred million PV) Monthly page views of media “Ameba” 250 223.9 211.1 199.4 200 194.9 185.4 101.3 181.7 103.1 168.5 96.7 91.9 162.7 154.9 90.6 150 144.3 146.4146.2 89.2 PC 134.2 127.7 131.4 83.0 121.1 82.4 116.9117.1 79.3 107.9 74.1 73.0 100.3 105
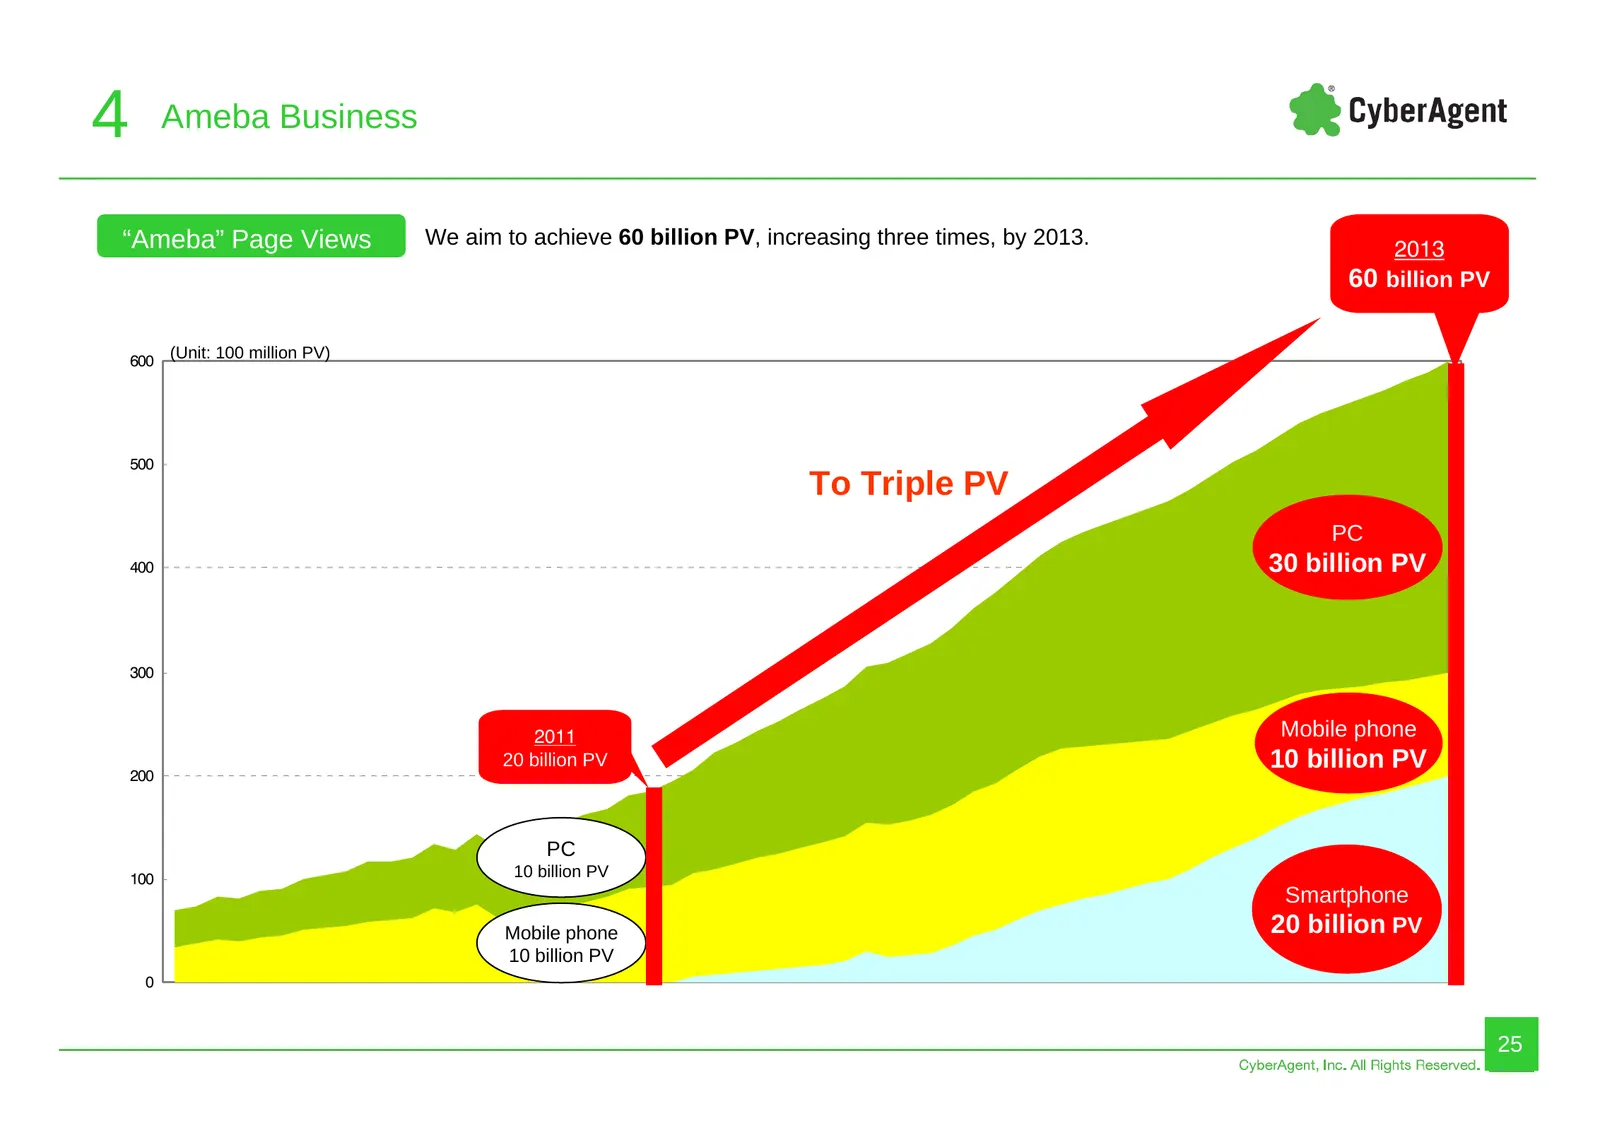
Slide 25: Ameba Page Views: 60 billion PV by 2013
4 Ameba Business “Ameba” Page Views We aim to achieve 60 billion PV, increasing three times, by 2013. 2013 60 billion PV 600 (Unit: 100 million PV) 500 To Triple PV PC 400 30 billion PV 300 2011 Mobile phone 20 billion PV 10 billion PV 200 PC 100 10 billion PV Smartphone Mobile phone 20 billion PV 1
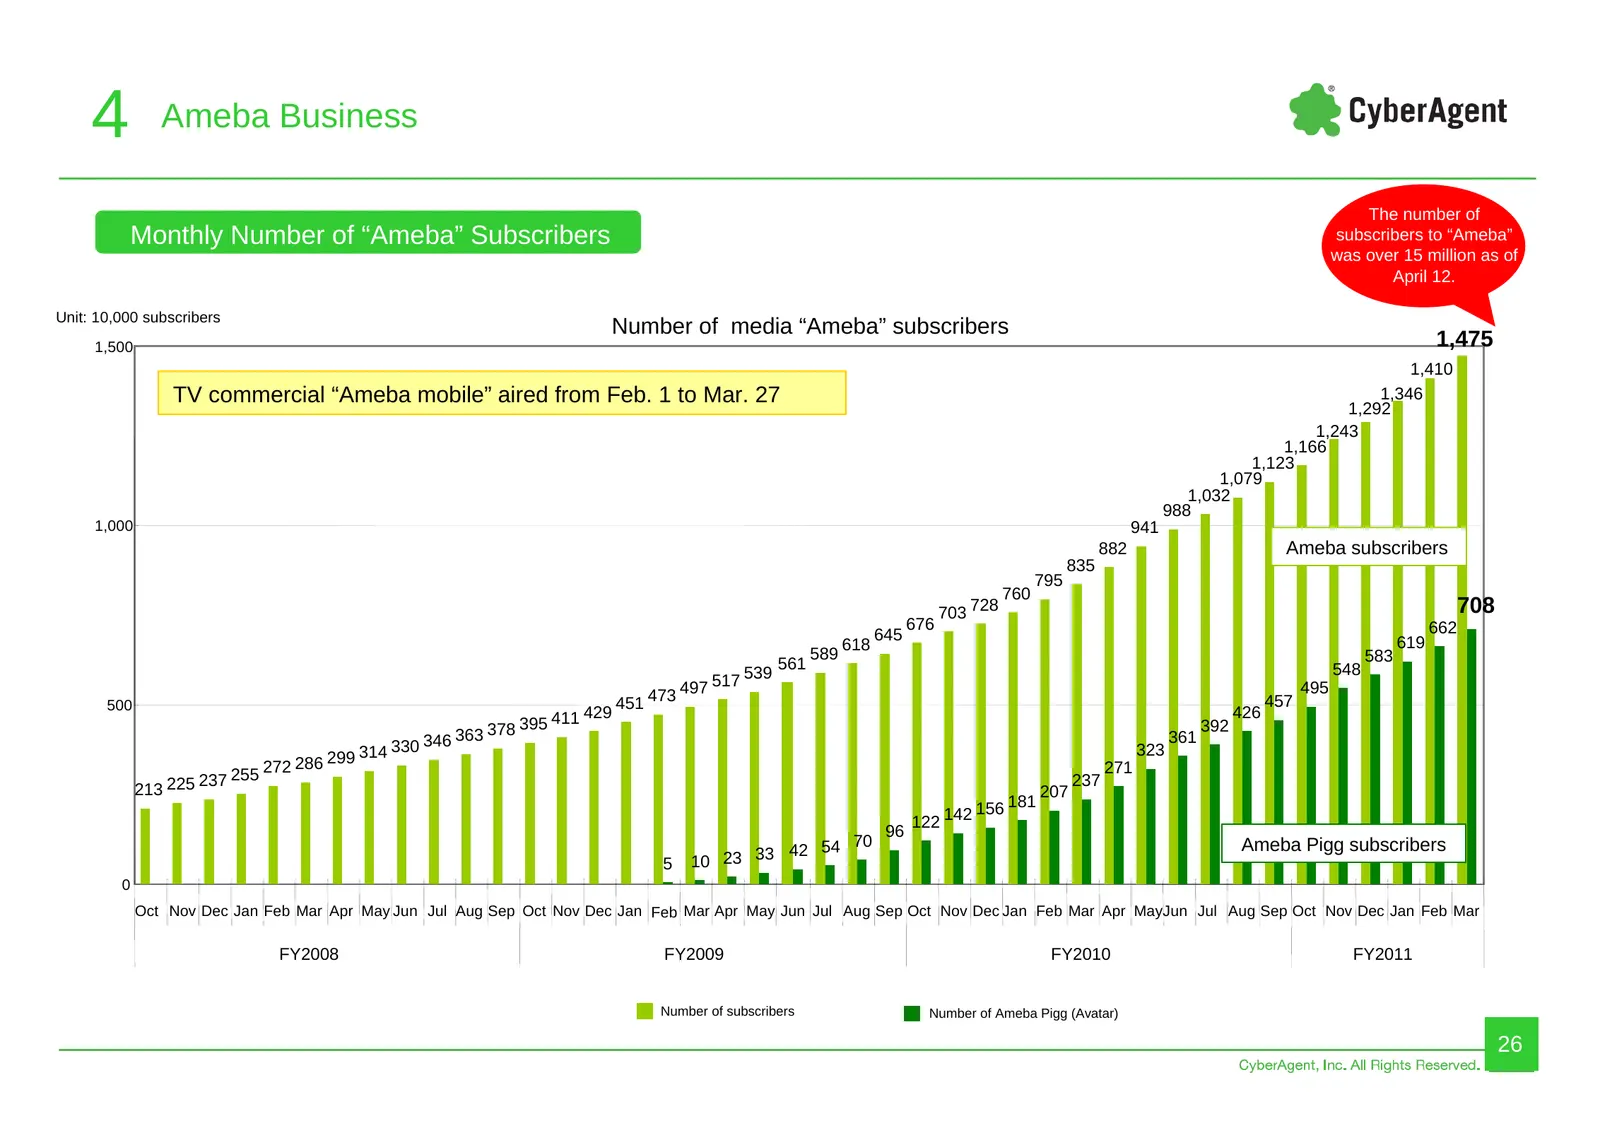
Slide 26: Monthly Number of Ameba Subscribers
4 Ameba Business The number of Monthly Number of “Ameba” Subscribers subscribers to “Ameba” was over 15 million as of April 12. Unit: 10,000 subscribers Number of media “Ameba” subscribers 1,500 1,475 1,410 TV commercial “Ameba mobile” aired from Feb. 1 to Mar. 27 1,346 1,292 1,243 1,166 1,123 1,079
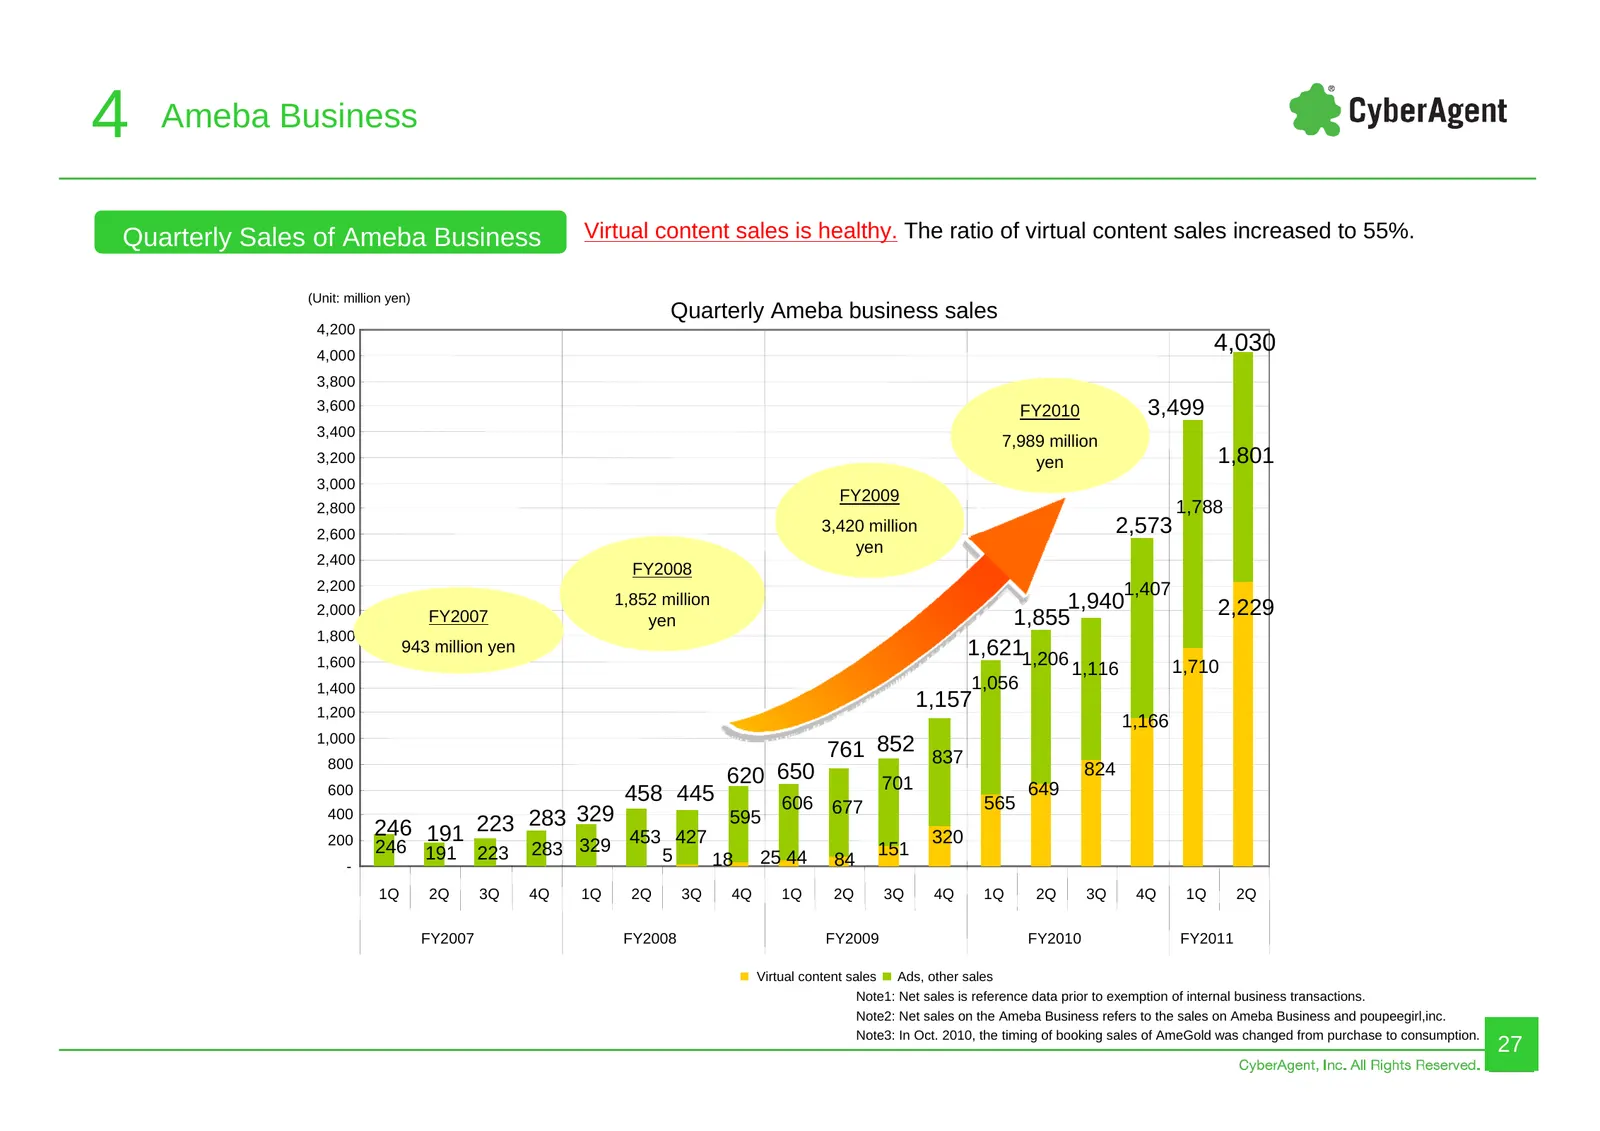
Slide 27: Quarterly Sales of Ameba Business
4 Ameba Business Quarterly Sales of Ameba Business Virtual content sales is healthy. The ratio of virtual content sales increased to 55%. (Unit: million yen) Quarterly Ameba business sales 4,200 4,000 4,030 3,800 3,600 FY2010 3,499 3,400 7,989 million 3,200 yen 1,801 3,000 FY2009 2,800 1,788 2,600 3
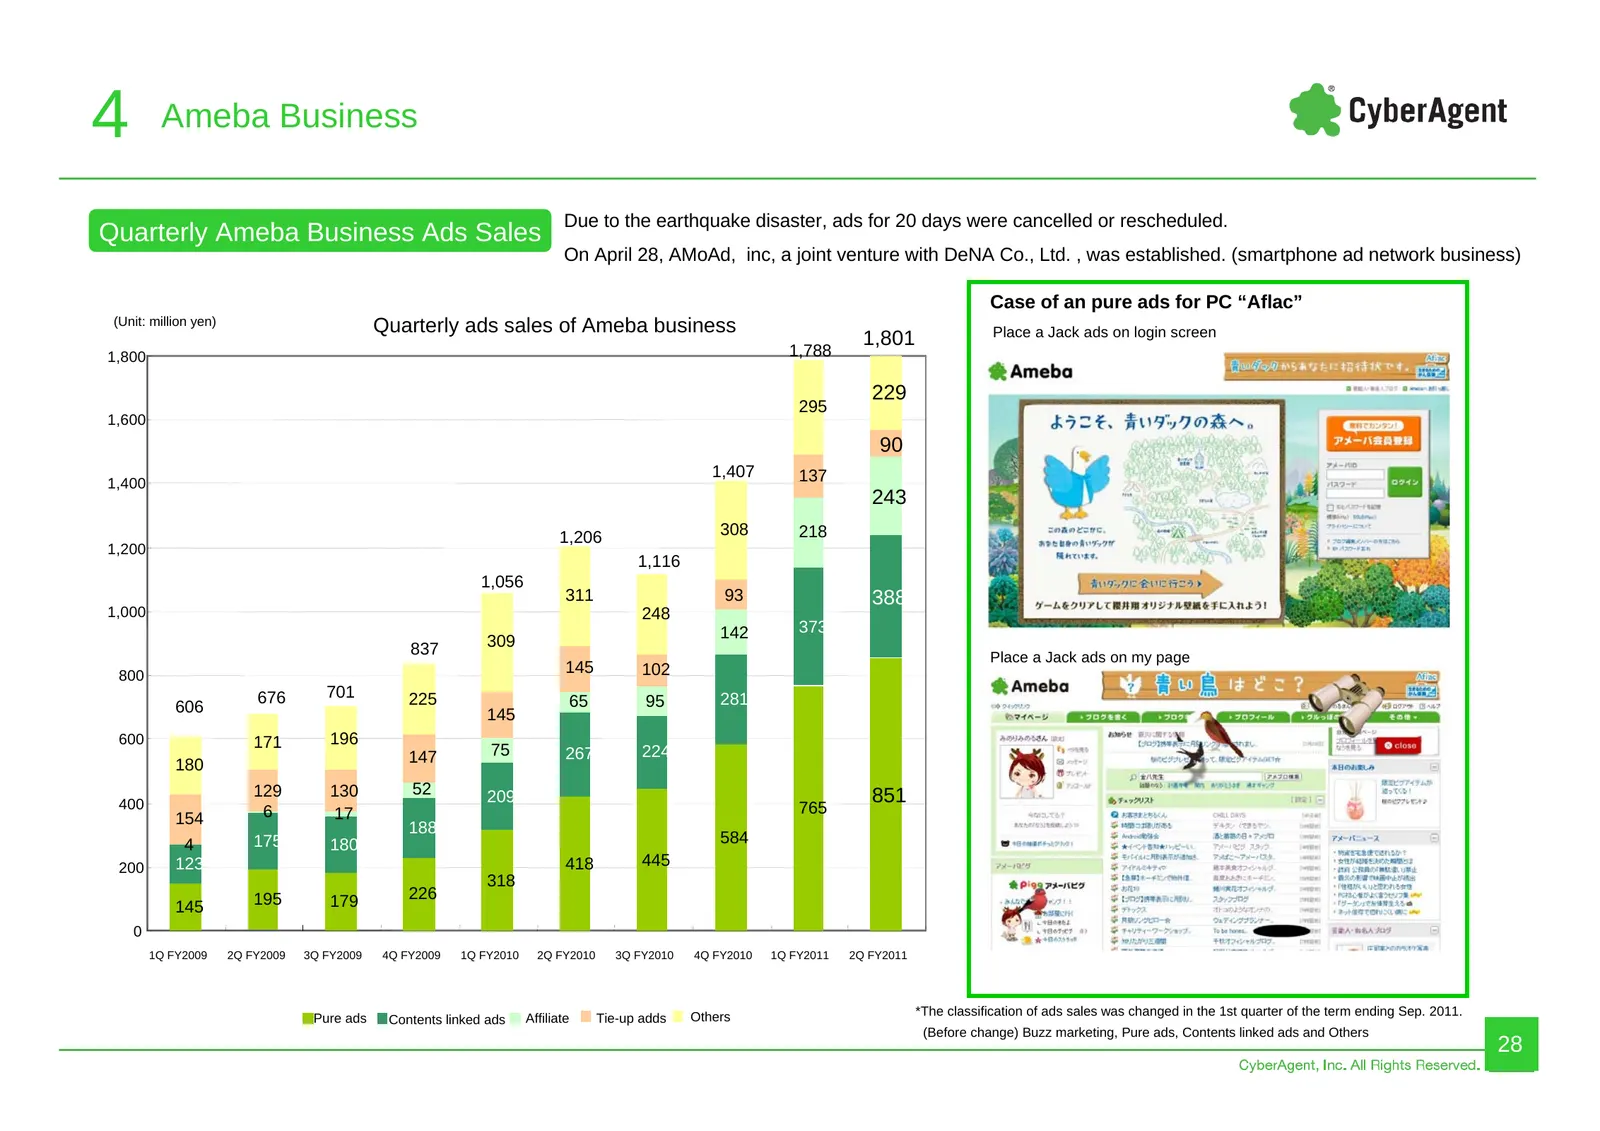
Slide 28: Quarterly Ameba Business Ads Sales
4 Ameba Business Due to the earthquake disaster, ads for 20 days were cancelled or rescheduled. Quarterly Ameba Business Ads Sales On April 28, AMoAd, inc, a joint venture with DeNA Co., Ltd. , was established. (smartphone ad network business) Case of an pure ads for PC “Aflac” (Unit: million yen) Q
Slide 29: Quarterly Virtual Content Sales of Ameba Business
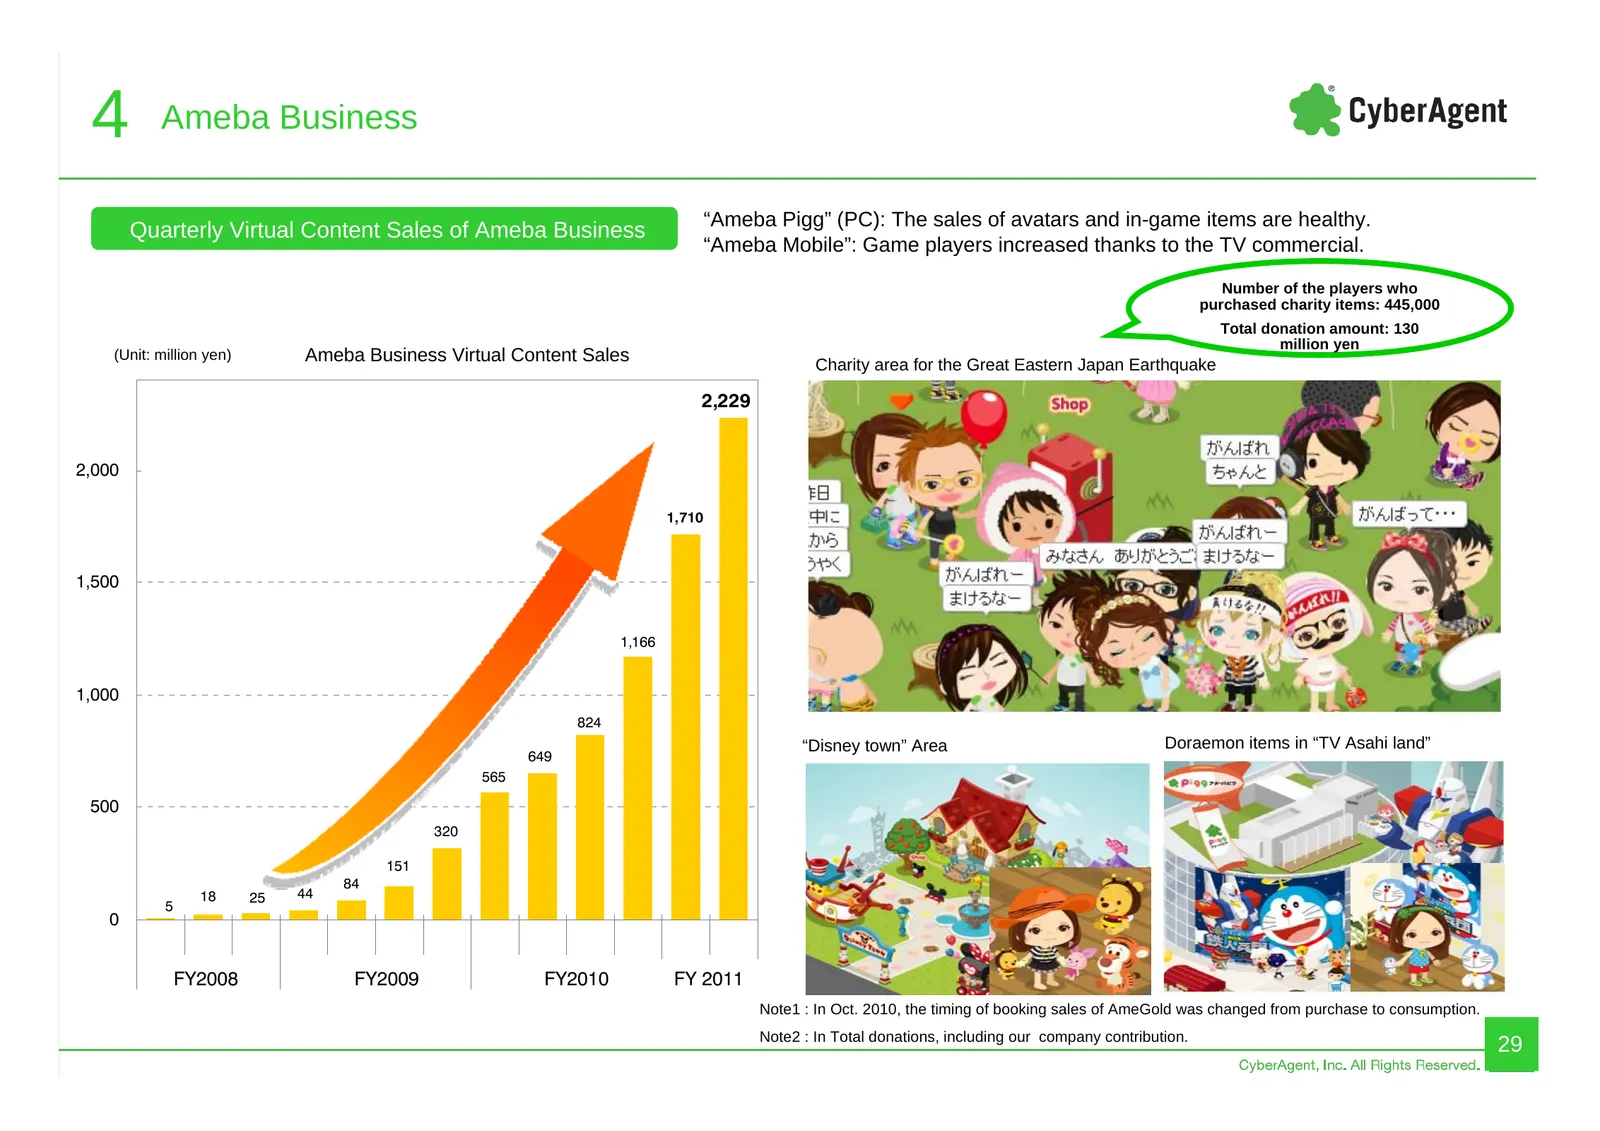
4 Ameba Business “Ameba Pigg” (PC): The sales of avatars and in-game items are healthy. Quarterly Virtual Content Sales of Ameba Business “Ameba Mobile”: Game players increased thanks to the TV commercial. Number of the players who purchased charity items: 445,000 Total donation amount: 130 million
Slide 30: Usage ARPPU Trends (Monthly)
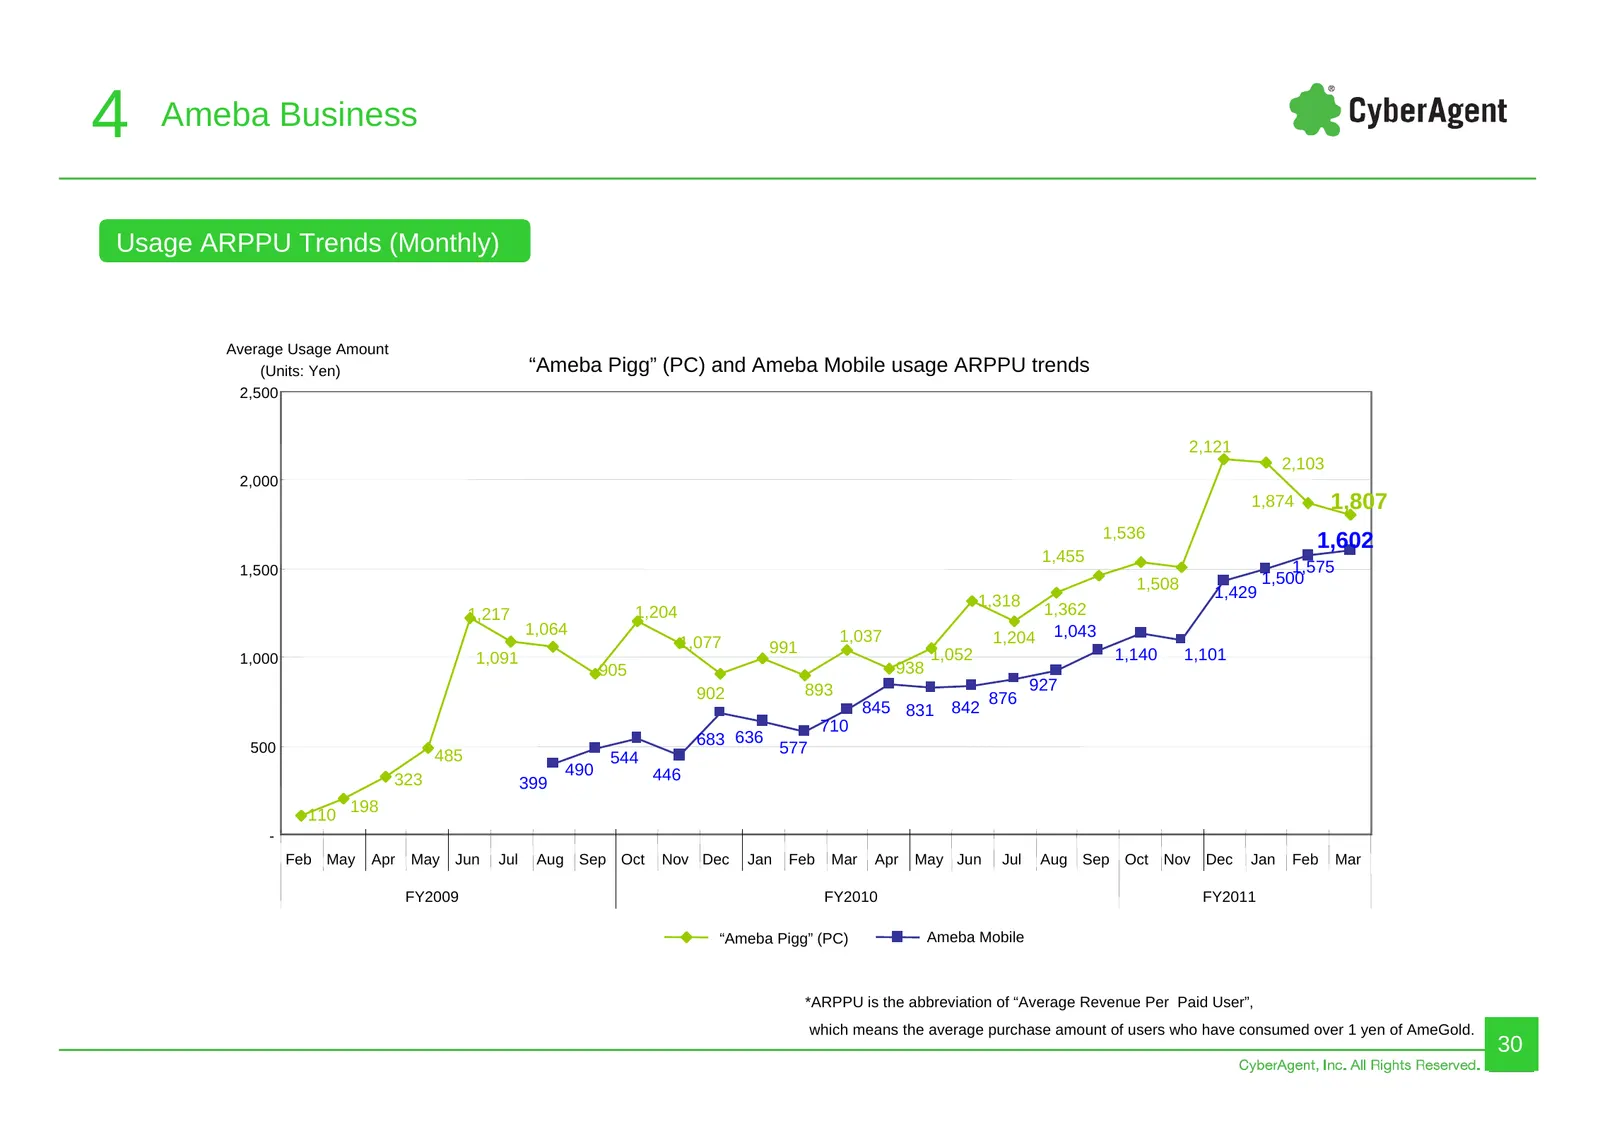
4 Ameba Business Usage ARPPU Trends (Monthly) Average Usage Amount ARPPU (Units: Yen) “Ameba Pigg” (PC) and Ameba Mobile usage ARPPU trends 2,500 2,121 2,103 2,000 1,874 1,807 1,536 1,602 1,455 1,500 1,575 1,508 1,500 1,318 1,429 1,217 1,204 1,362 1,064 1,037 1,204 1,043 1,077 991 1,000 1,091 1,052
Slide 31: Ameba Pigg (PC)
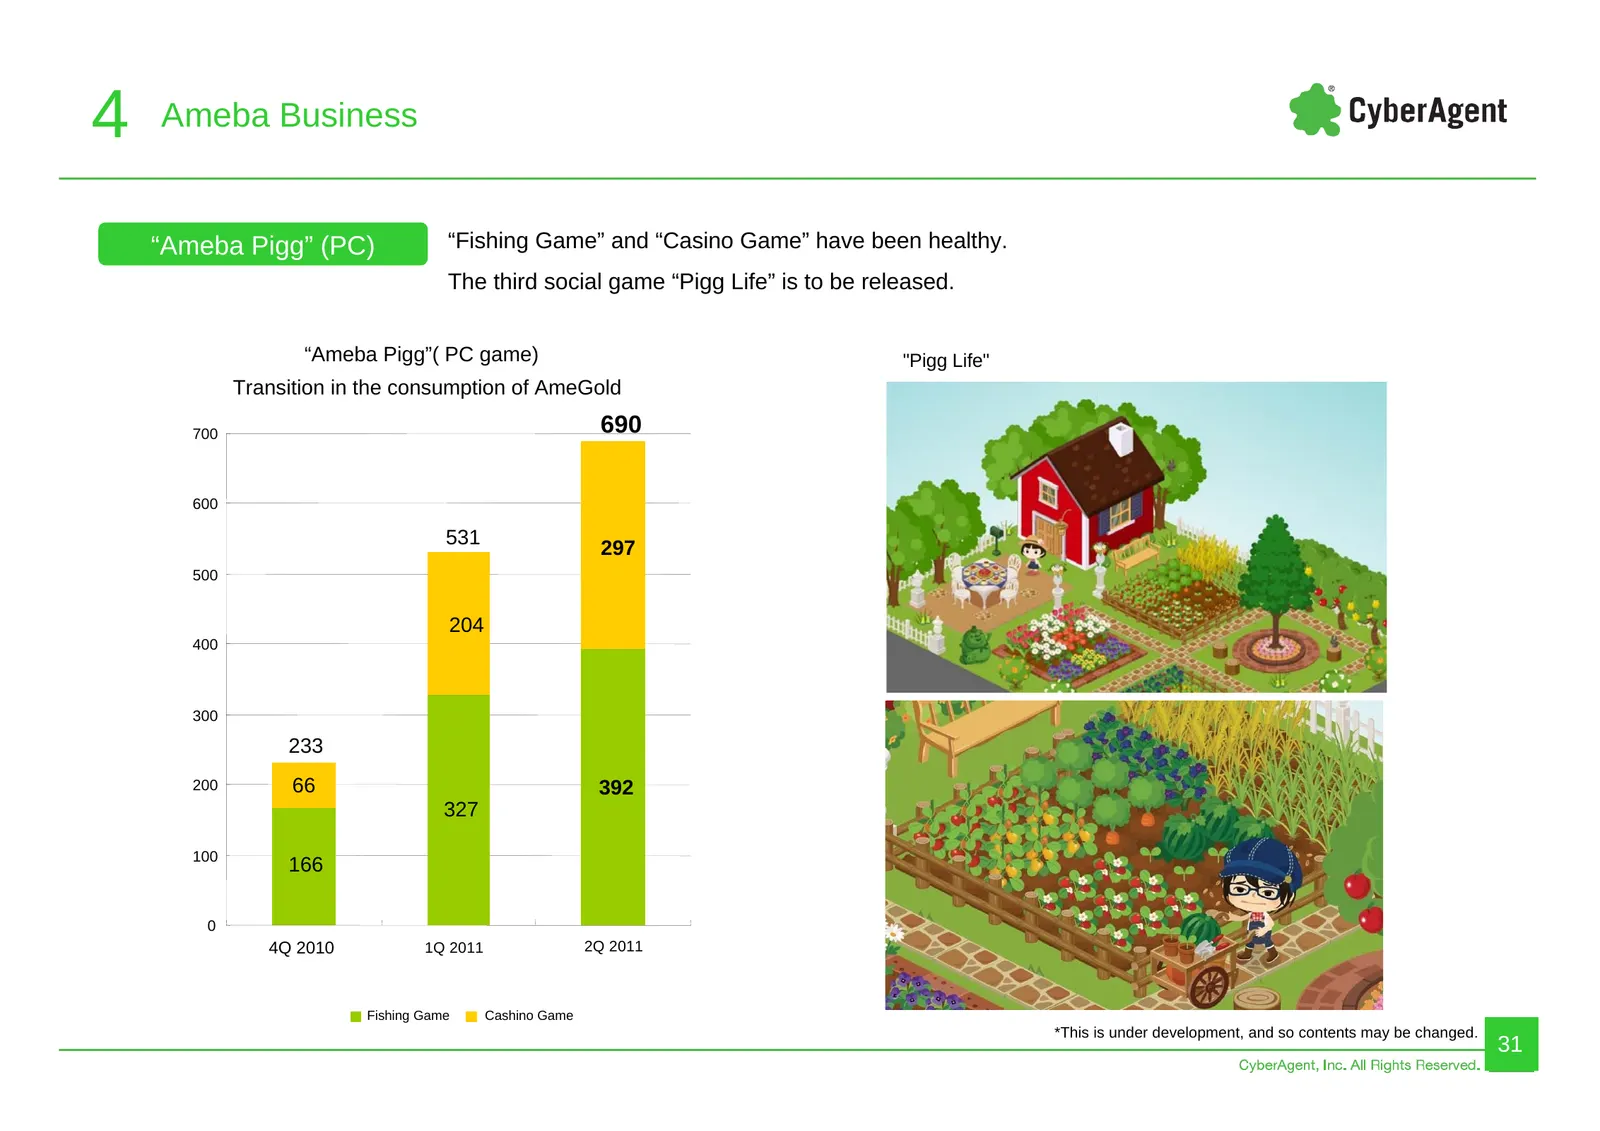
4 Ameba Business “Ameba Pigg” (PC) “Fishing Game” and “Casino Game” have been healthy. The third social game “Pigg Life” is to be released. “Ameba Pigg”( PC game) "Pigg Life" Transition in the consumption of AmeGold 700 690 600 531 297 500 204 400 300 233 200 66 392 327 100 166 0 4Q 2010 1Q 2011 2Q
Slide 32: Ameba Mobile
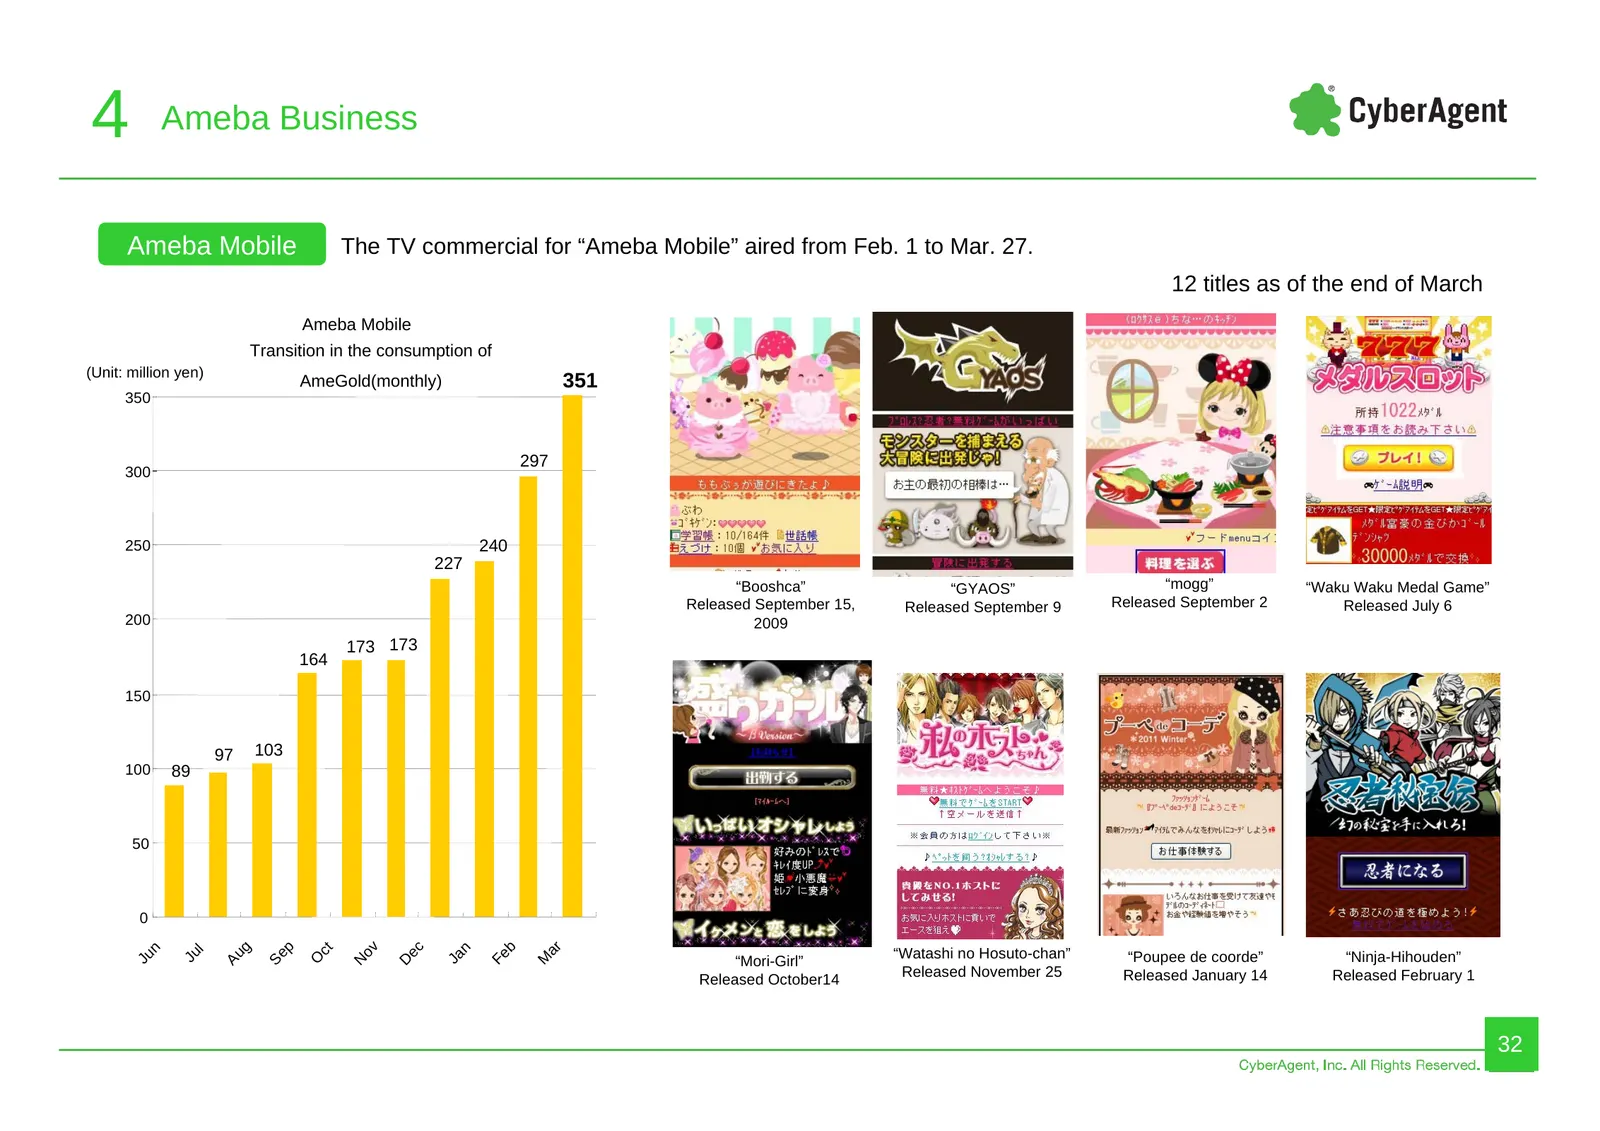
4 Ameba Business Ameba Mobile The TV commercial for “Ameba Mobile” aired from Feb. 1 to Mar. 27. 12 titles as of the end of March Ameba Mobile Transition in the consumption of (Unit: million yen) AmeGold(monthly) 351 350 297 300 250 240 227 “Booshca” “GYAOS” “mogg” “Waku Waku Medal Game” Released Se
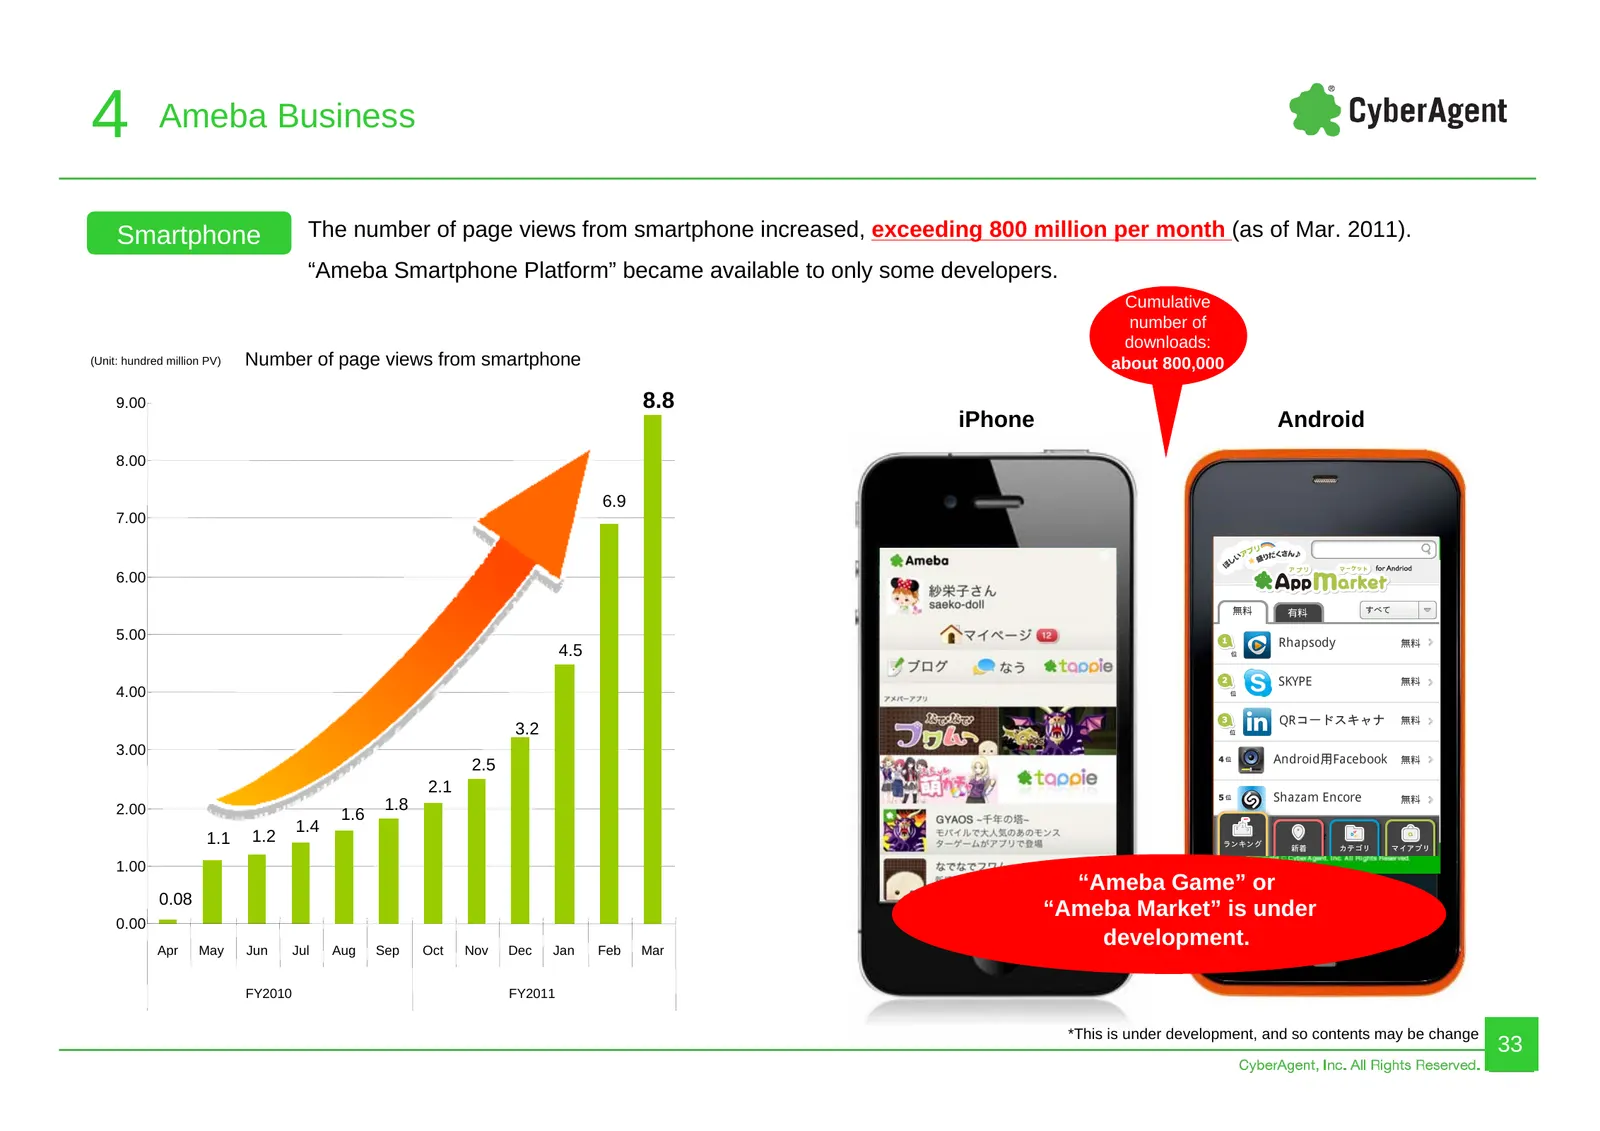
Slide 33: Smartphone page views
4 Ameba Business Smartphone The number of page views from smartphone increased, exceeding 800 million per month (as of Mar. 2011). “Ameba Smartphone Platform” became available to only some developers. Cumulative number of downloads: (Unit: hundred million PV) Number of page views from smartphone abo
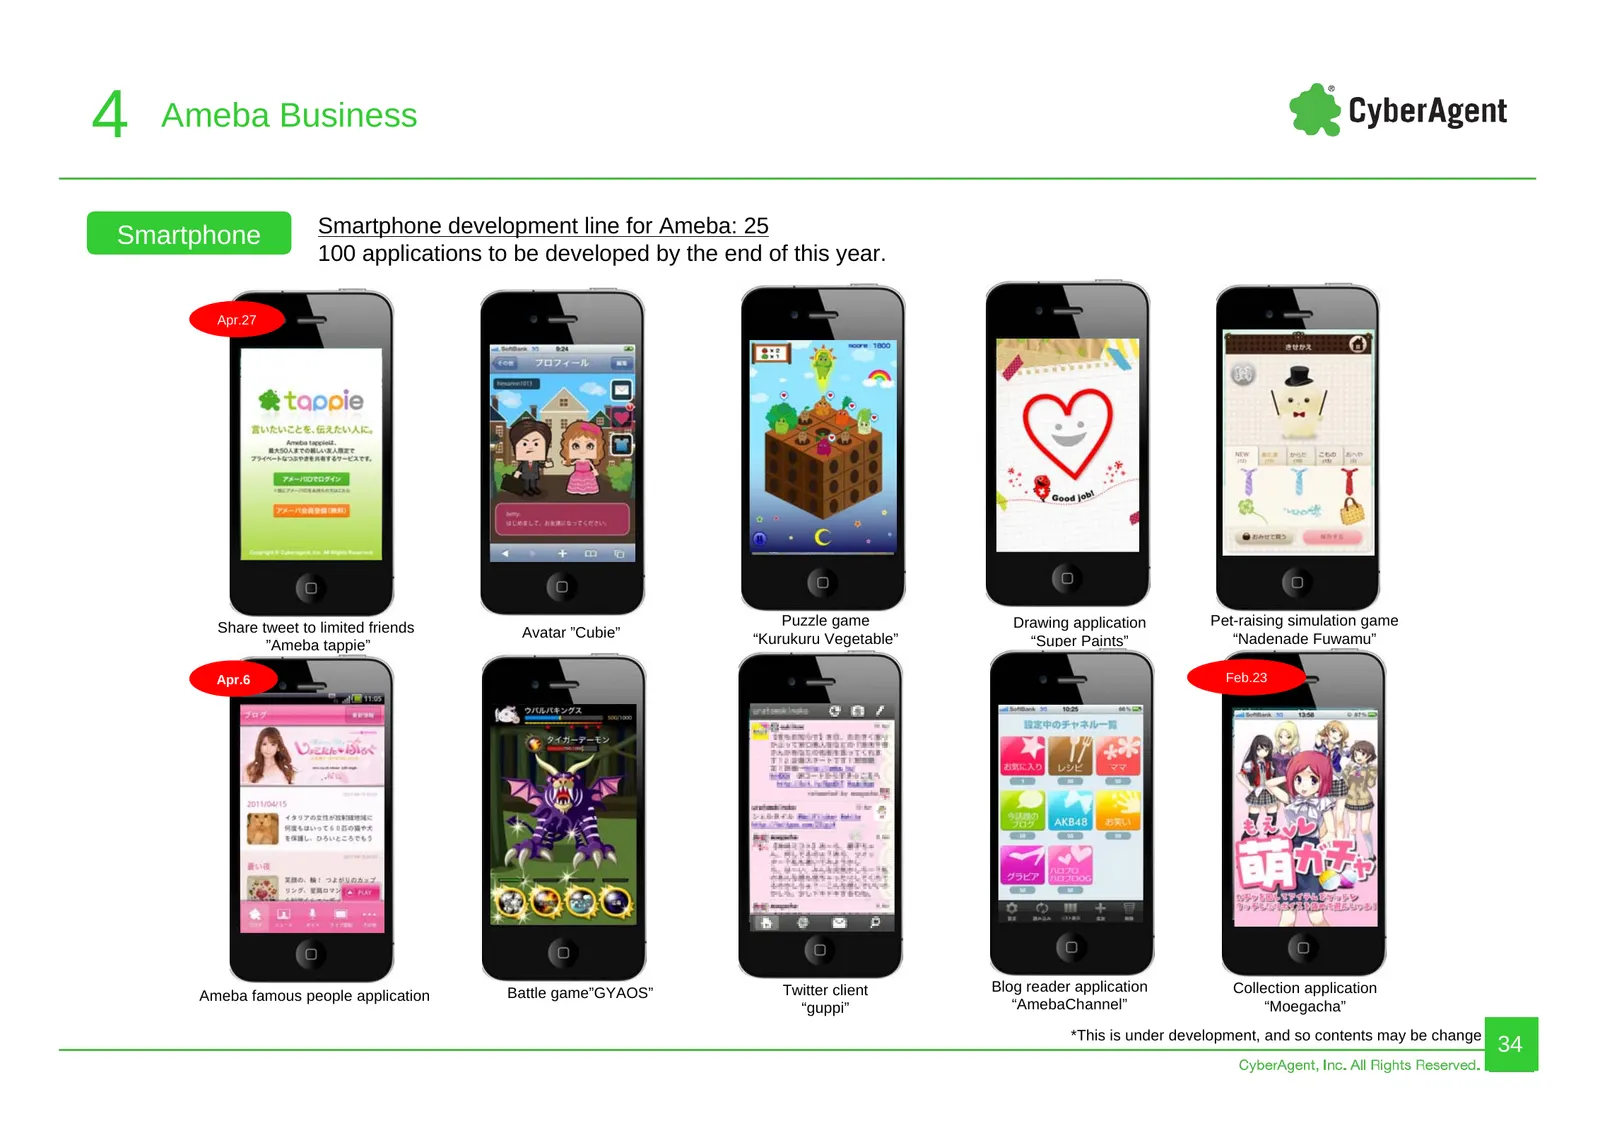
Slide 34: Smartphone development line for Ameba
4 Ameba Business Smartphone Smartphone development line for Ameba: 25 100 applications to be developed by the end of this year. Apr.27 Share tweet to limited friends Puzzle game Drawing application Pet-raising simulation game Avatar ”Cubie” “Kurukuru Vegetable” “Nadenade Fuwamu” ”Ameba tappie” “Supe
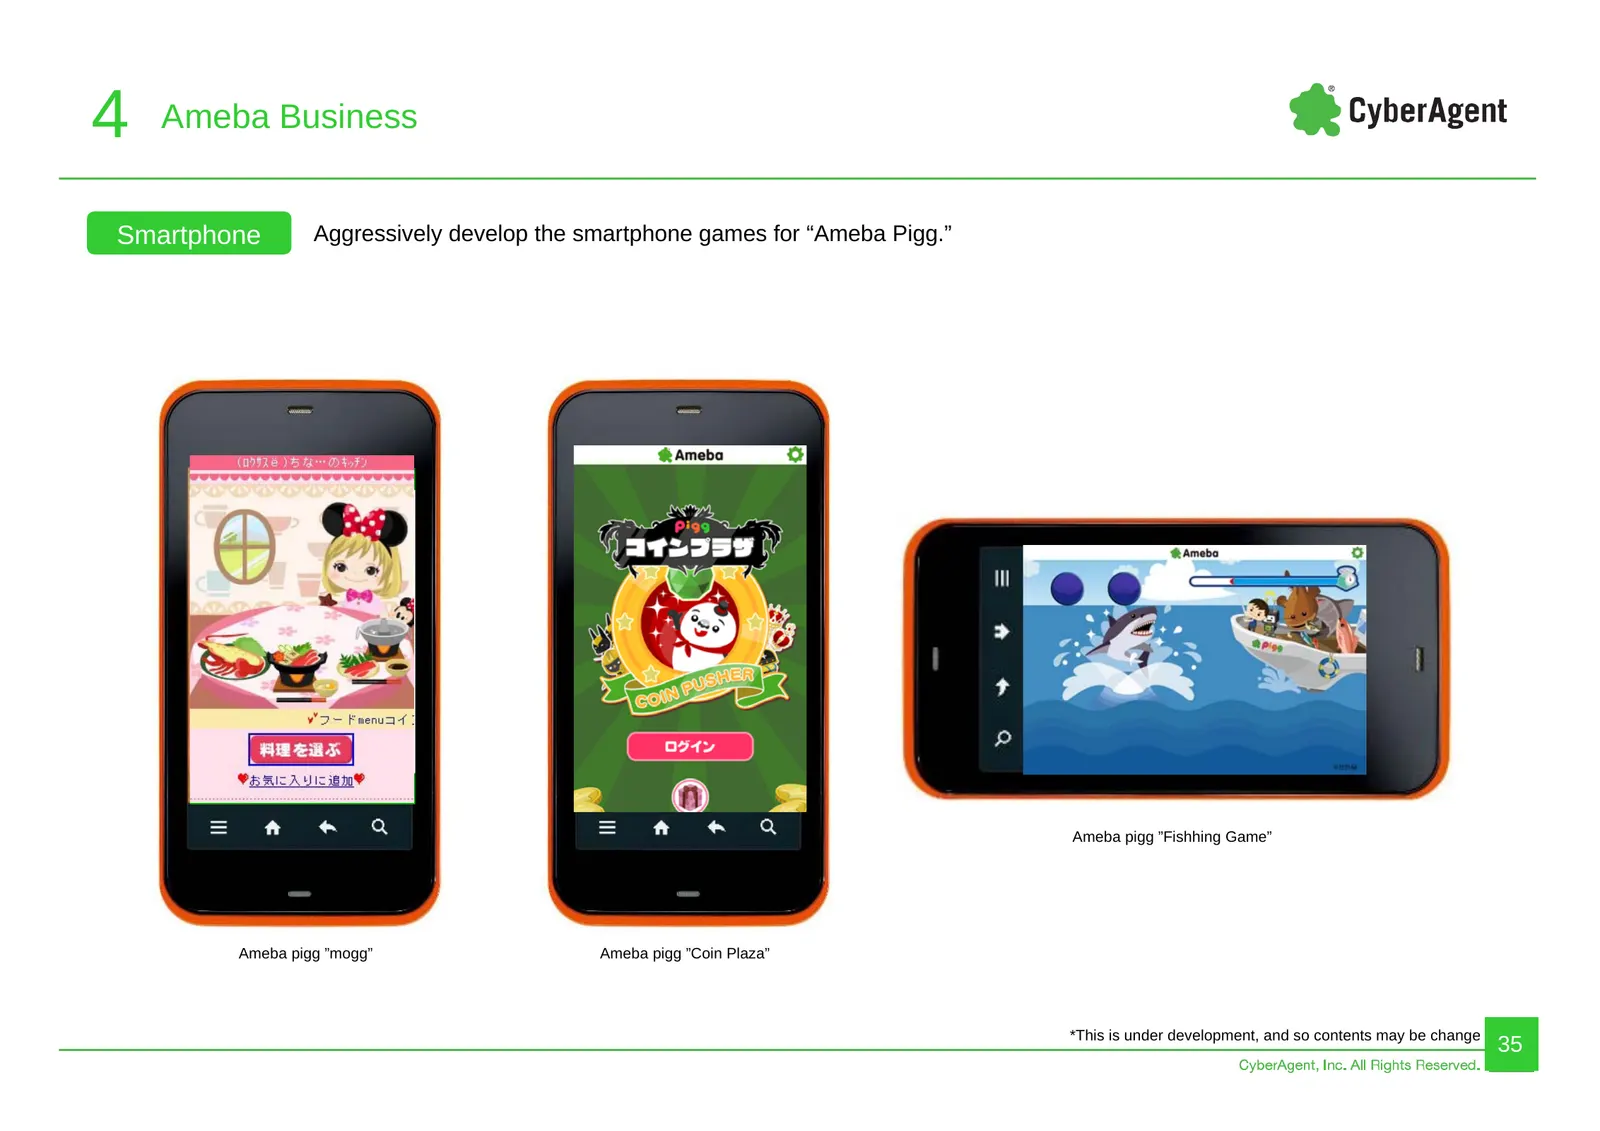
Slide 35: Smartphone games for Ameba Pigg
4 Ameba Business Smartphone Aggressively develop the smartphone games for “Ameba Pigg.” mogg Ameba pigg ”Fishhing Game” Ameba pigg ”mogg” Ameba pigg ”Coin Plaza” *This is under development, and so contents may be change 35
Slide 36: Summary
5 Summary & CyberAgent Summary 36 CyberAgent, Inc. All Rights Reserved. 36
Slide 37: Summary
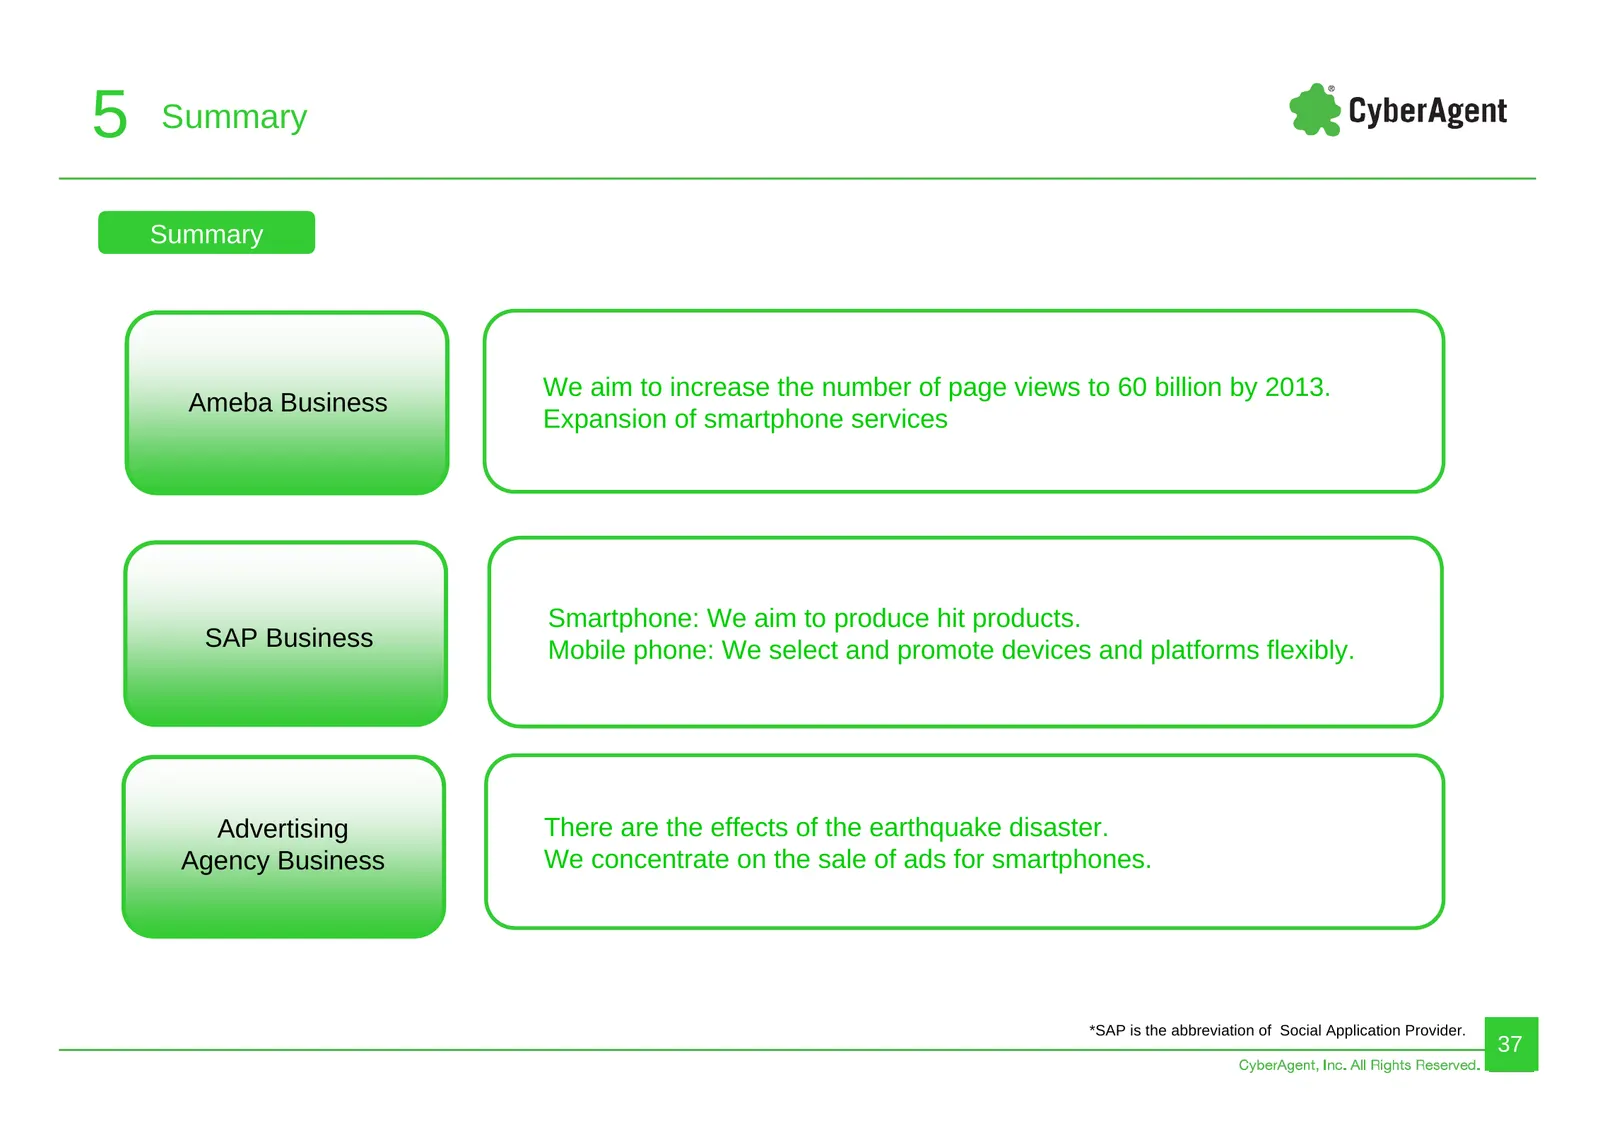
5 Summary Summary We aim to increase the number of page views to 60 billion by 2013. Ameba Business Expansion of smartphone services Smartphone: We aim to produce hit products. SAP Business Mobile phone: We select and promote devices and platforms flexibly. Advertising There are the effects of the e
Slide 38: Summary: Business Forecast for FY2011
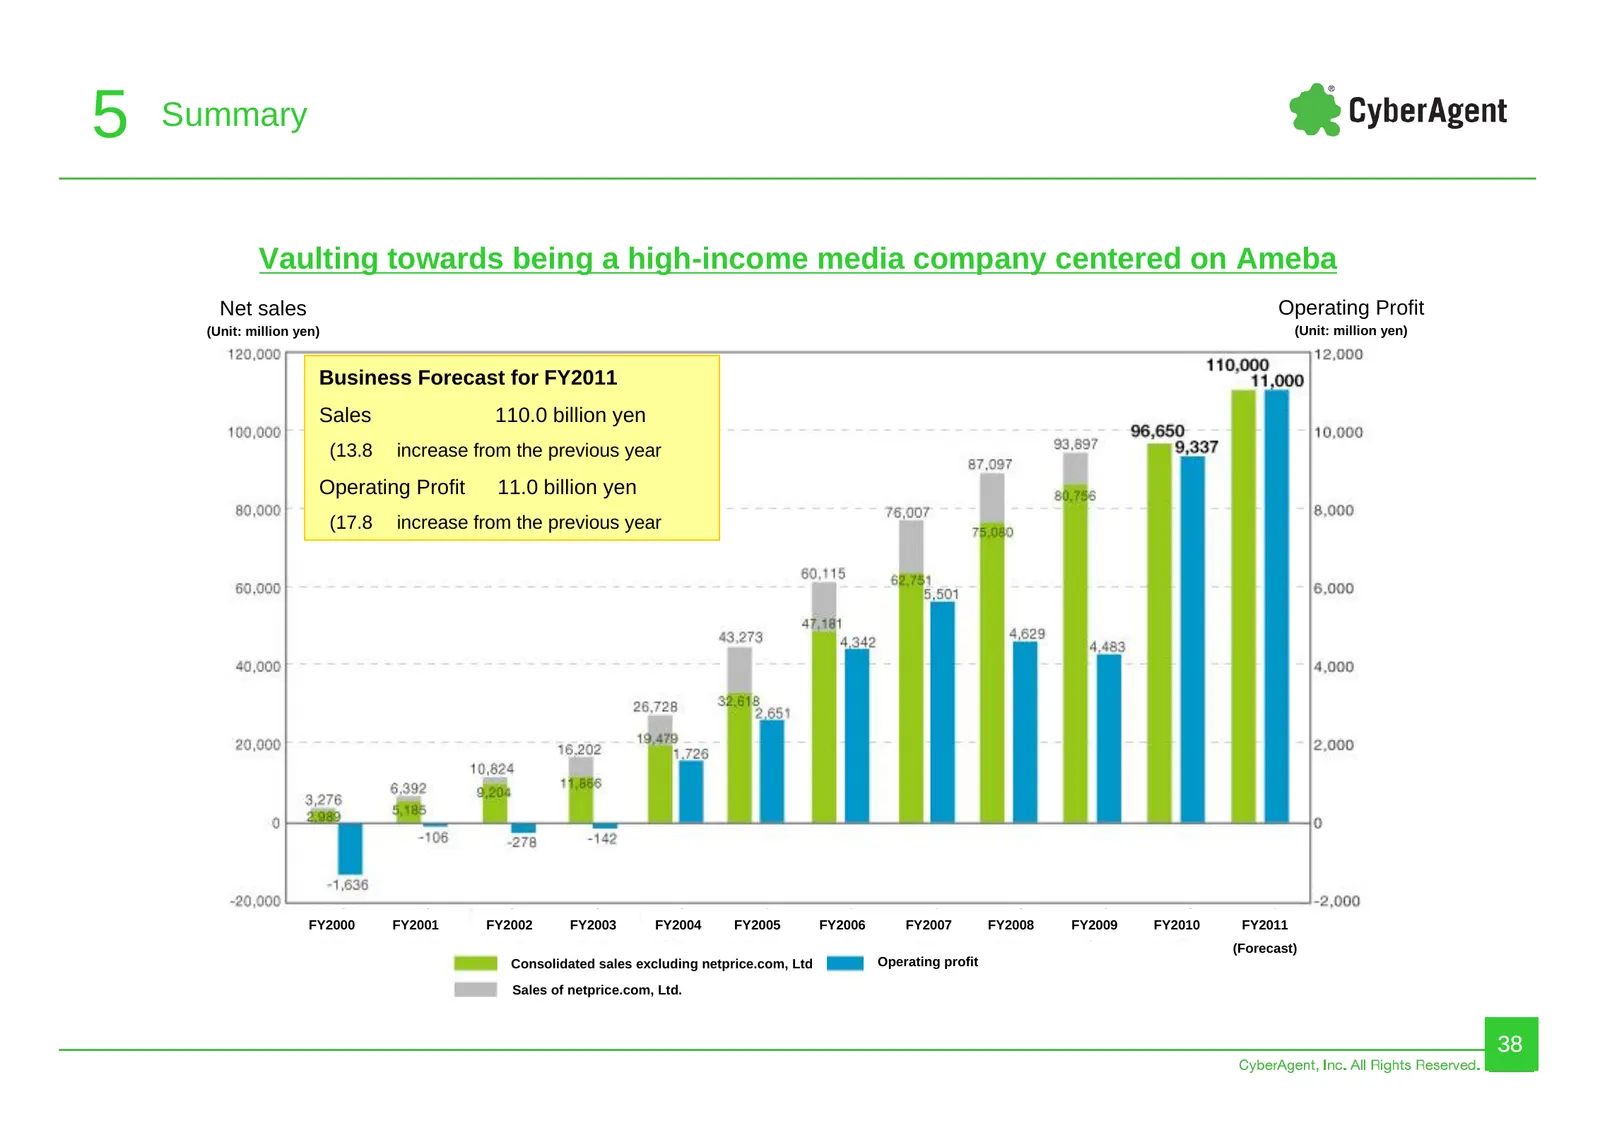
5 Summary Vaulting towards being a high-income media company centered on Ameba Net sales Operating Profit (Unit: million yen) (Unit: million yen) Business Forecast for FY2011 Sales 110.0 billion yen (13.8 increase from the previous year Operating Profit 11.0 billion yen (17.8 increase from the previ
Slide 39: We create the company that symbolizes the 21st century
5 Summary We create the company that symbolizes the 21st century. 39
Source: Internet Archive copy of ir.cyberagent.co.jp
More decks from CyberAgent Incorporated
 FY2026 Earnings Presentation59 slides · Nov 16, 2026
 FY2026 Earnings Presentation60 slides · Nov 12, 2026
 FY2026 Earnings Presentation58 slides · Nov 11, 2026
 Investor Presentation (August 2026)79 slides · Aug 7, 2026
 Q3 2026 Earnings Presentation40 slides · Aug 7, 2026
 Q2 2026 Earnings Presentation39 slides · May 13, 2026