Sumitomo Corporation · TSE:8053
Sumitomo — FY2022 Earnings Presentation
53 slides from Sumitomo's earnings presentation, May 9, 2023
Slide 1: Annual Results for FY2022
Annual Results for FY2022 May 9, 2023 Sumitomo Corporation Cautionary Statement Concerning Forward-looking Statements This report includes forward-looking statements relating to our future plans, forecasts, objectives, expectations and intentions. The forward-looking statements reflect management's
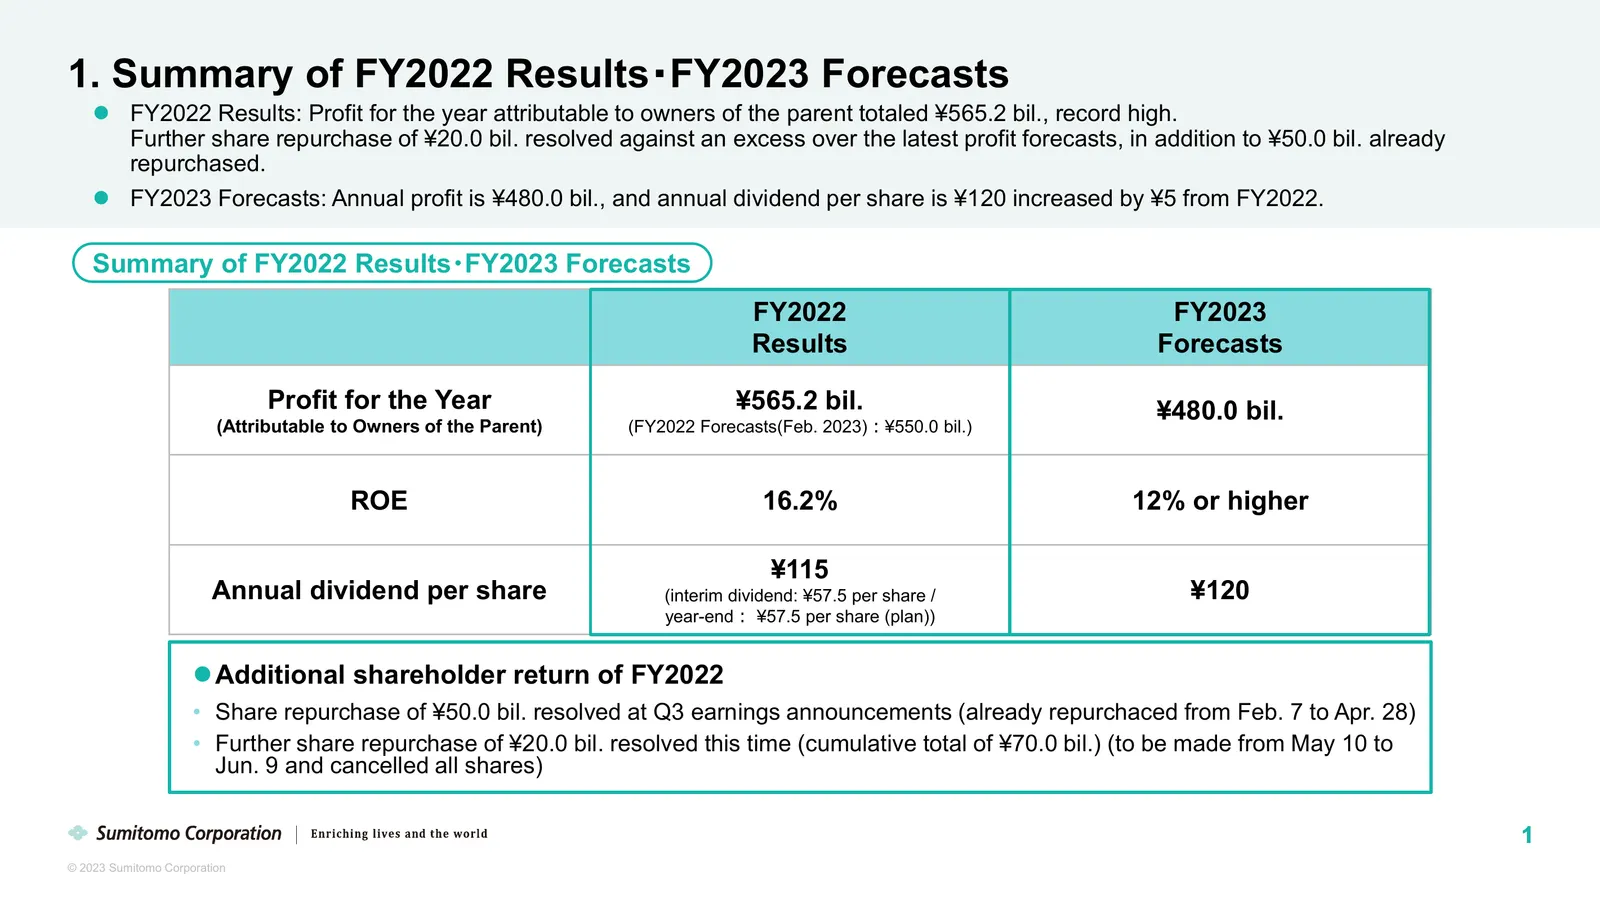
Slide 2: Summary of FY2022 Results・FY2023 Forecasts
1. Summary of FY2022 Results・FY2023 Forecasts FY2022 Results: Profit for the year attributable to owners of the parent totaled ¥565.2 bil., record high. Further share repurchase of ¥20.0 bil. resolved against an excess over the latest profit forecasts, in addition to ¥50.0 bil. already repurchased
Slide 3: Progress of Medium-Term Management Plan SHIFT 2023
Progress of Medium-Term Management Plan SHIFT 2023 2 © 2023 Sumitomo Corporation
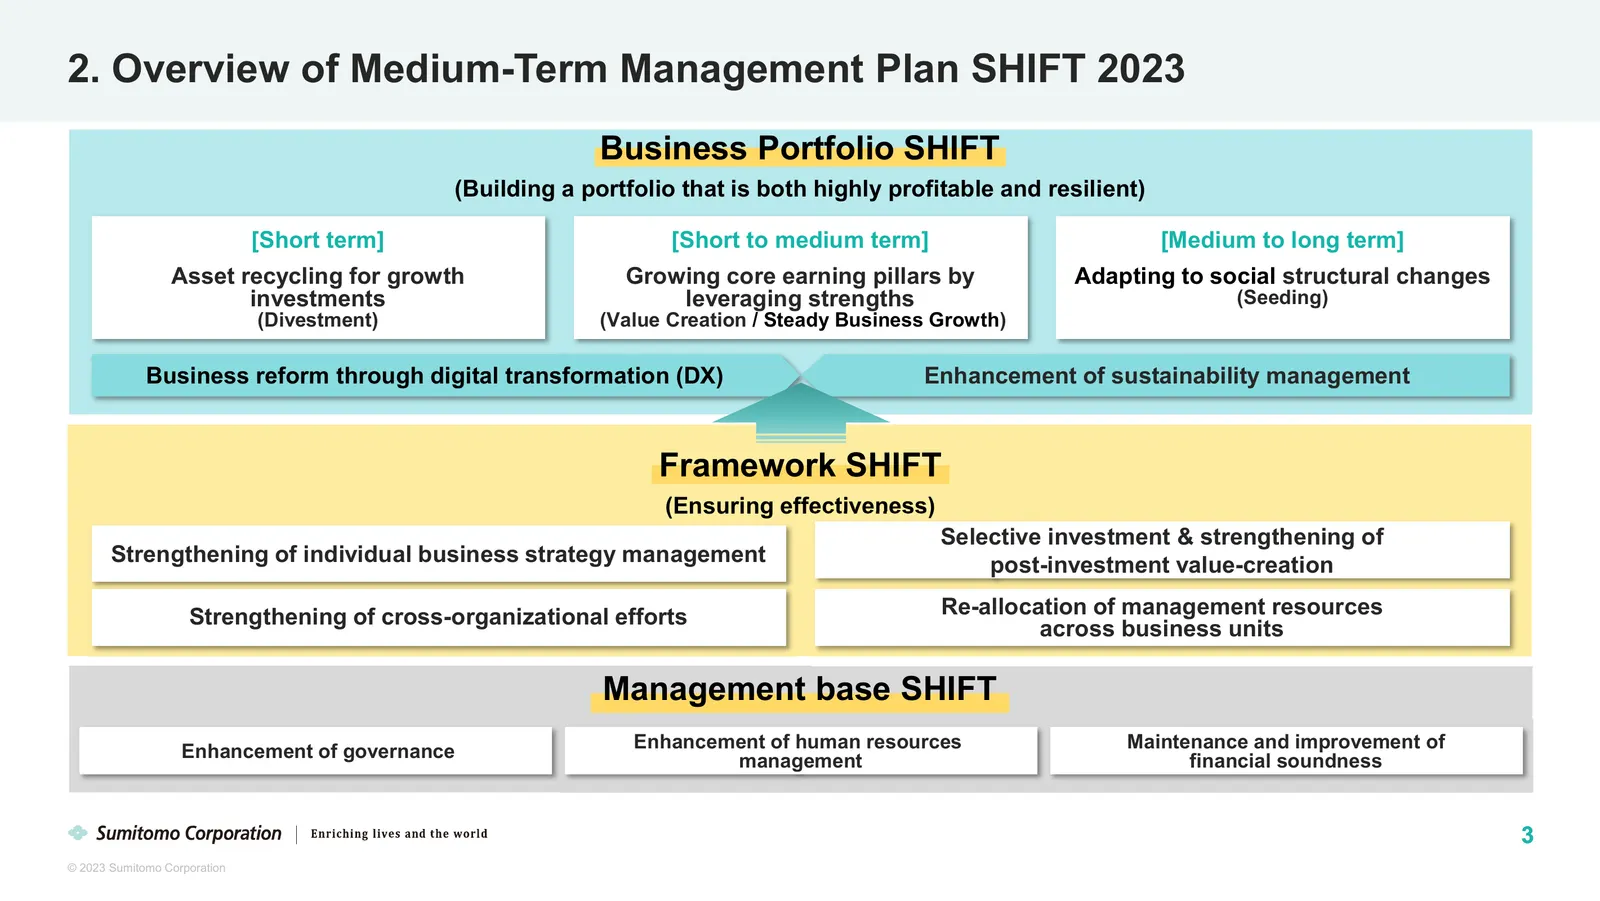
Slide 4: Overview of Medium-Term Management Plan SHIFT 2023
2. Overview of Medium-Term Management Plan SHIFT 2023 Business Portfolio SHIFT (Building a portfolio that is both highly profitable and resilient) [Short term] [Short to medium term] [Medium to long term] Asset recycling for growth Growing core earning pillars by Adapting to social structural change
Slide 5: Business Portfolio SHIFT
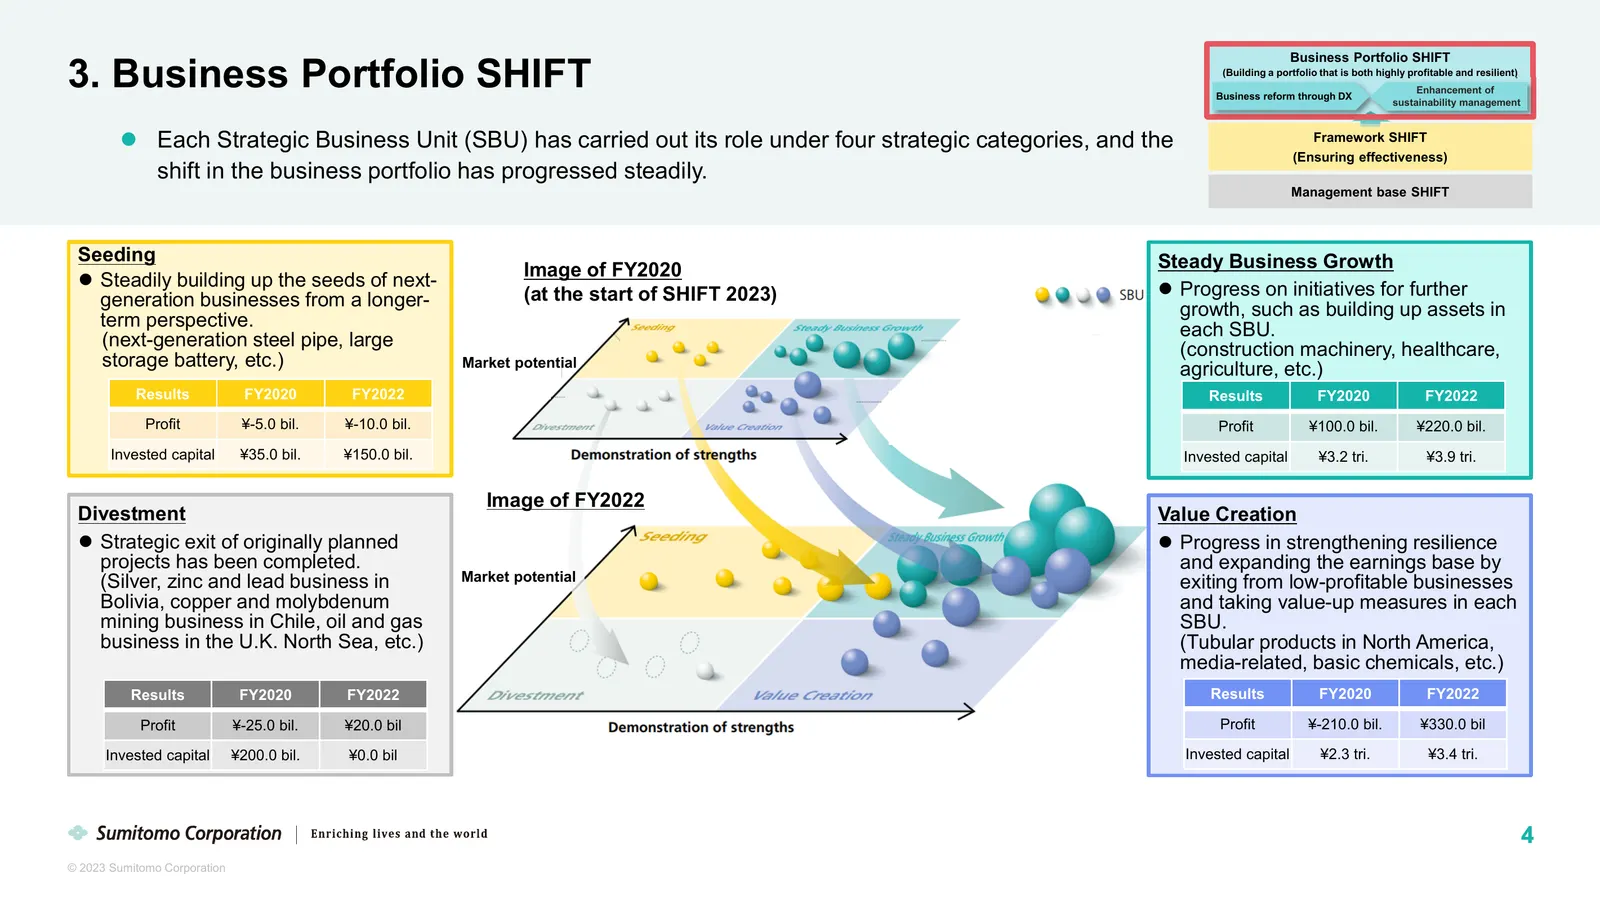
Business Portfolio SHIFT 3. Business Portfolio SHIFT (Building a portfolio that is both highly profitable and resilient) Business reform through DX Enhancement of sustainability management Each Strategic Business Unit (SBU) has carried out its role under four strategic categories, and the Framewor
Slide 6: SHIFT in Framework and Management base, etc.
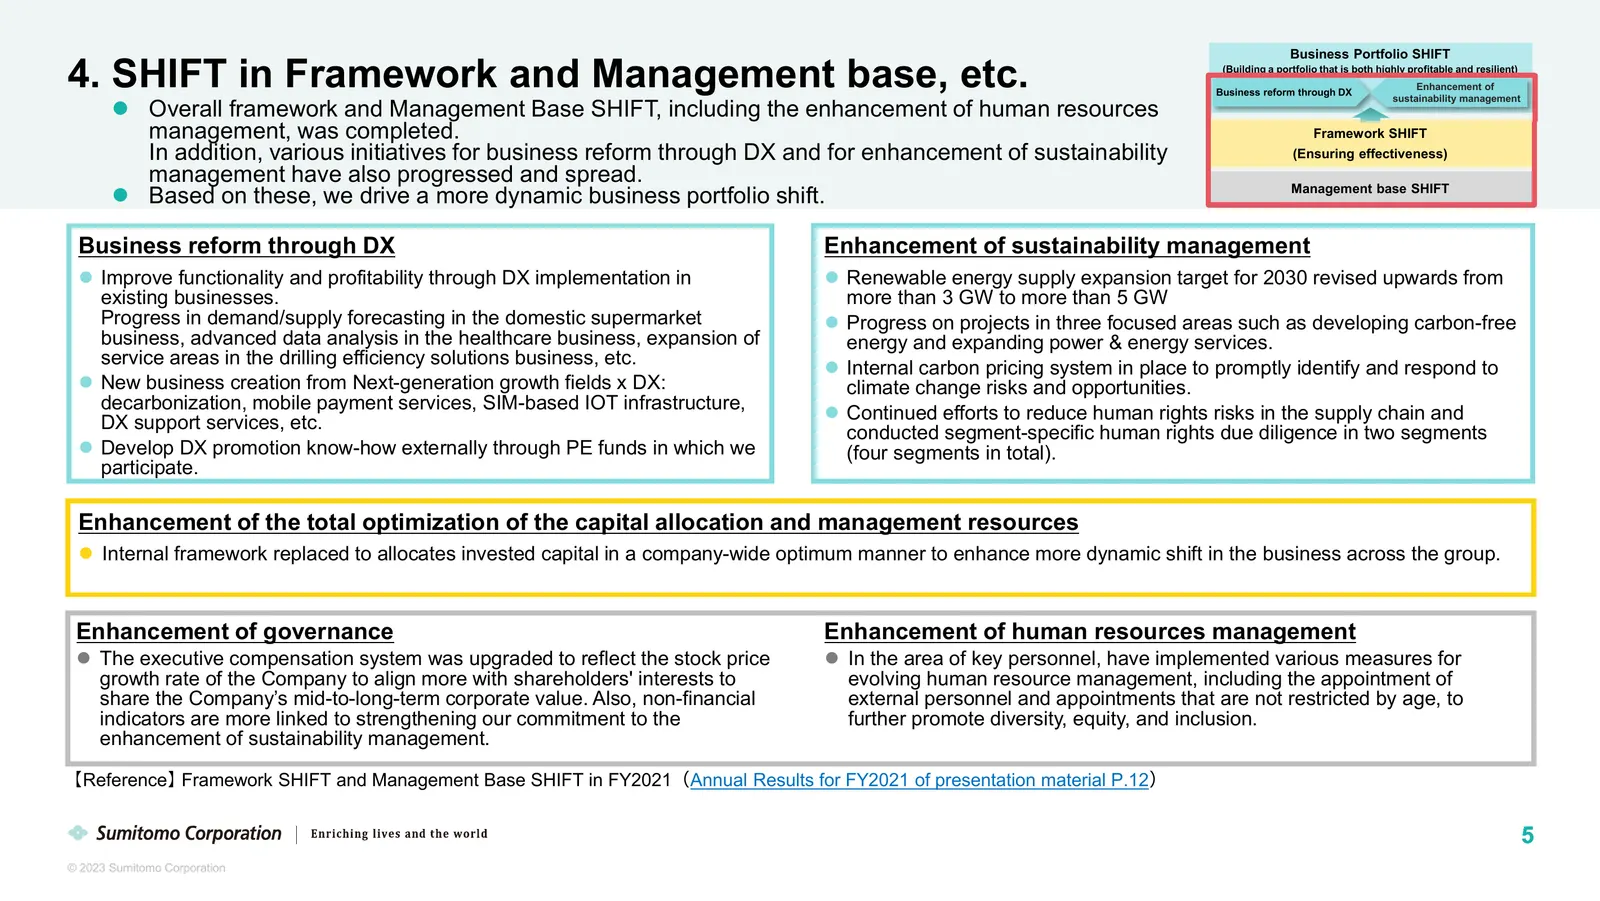
Business Portfolio SHIFT 4. SHIFT in Framework and Management base, etc. (Building a portfolio that is both highly profitable and resilient) Business reform through DX Enhancement of sustainability management Overall framework and Management Base SHIFT, including the enhancement of human resources
Slide 7: Towards the completion of SHIFT 2023
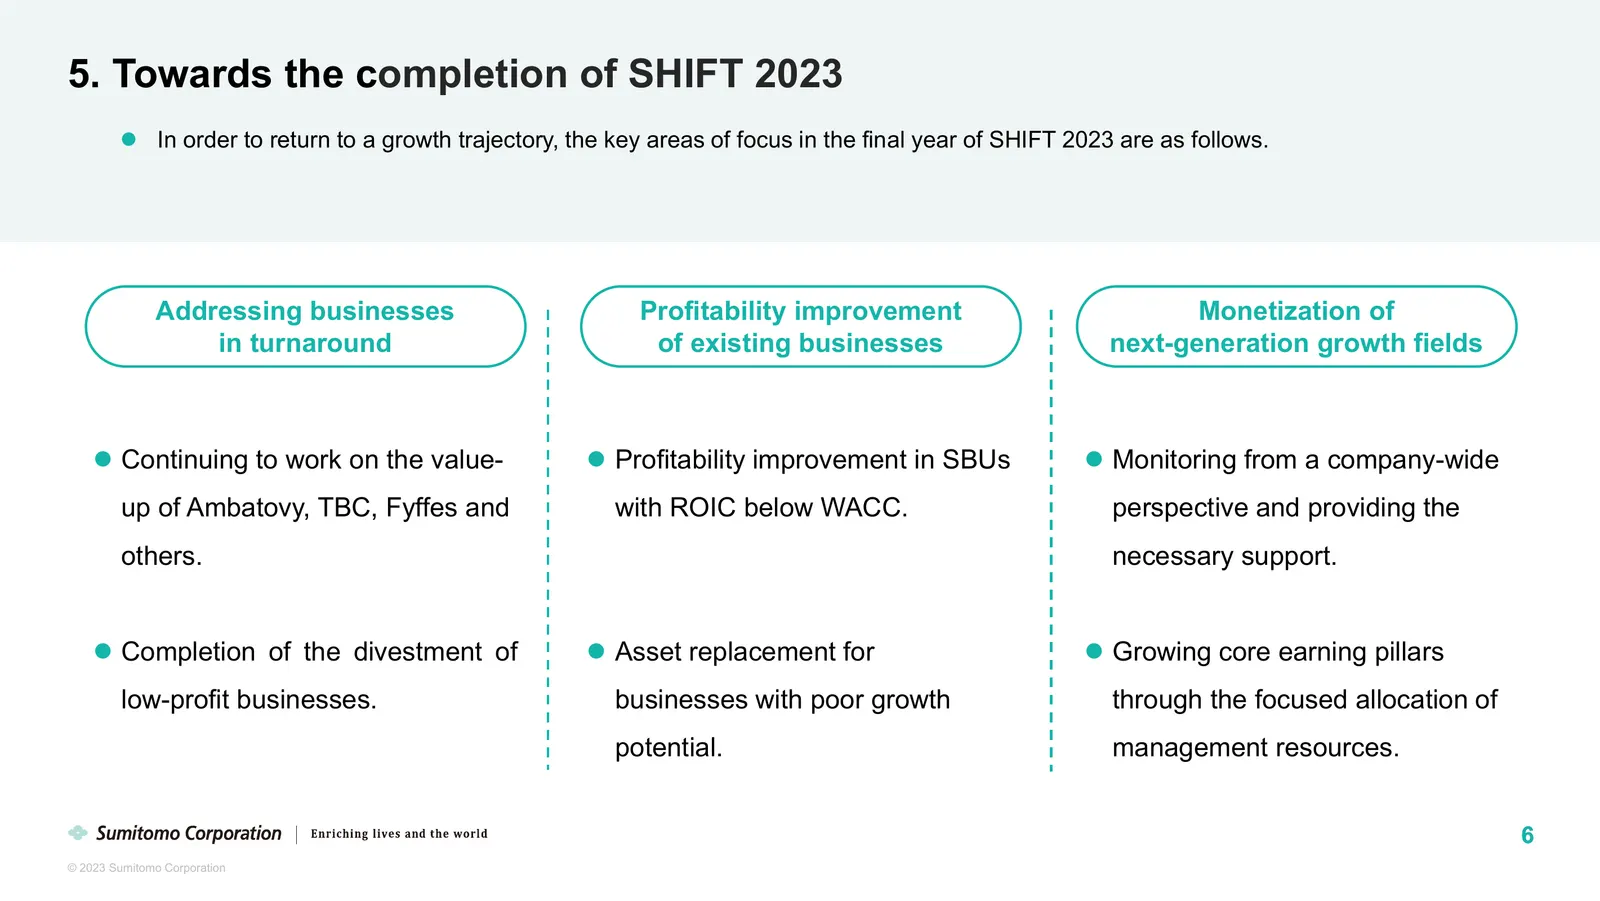
5. Towards the completion of SHIFT 2023 In order to return to a growth trajectory, the key areas of focus in the final year of SHIFT 2023 are as follows. Addressing businesses Profitability improvement Monetization of in turnaround of existing businesses next-generation growth fields Continuing
Slide 8: Our growth beyond SHIFT 2023
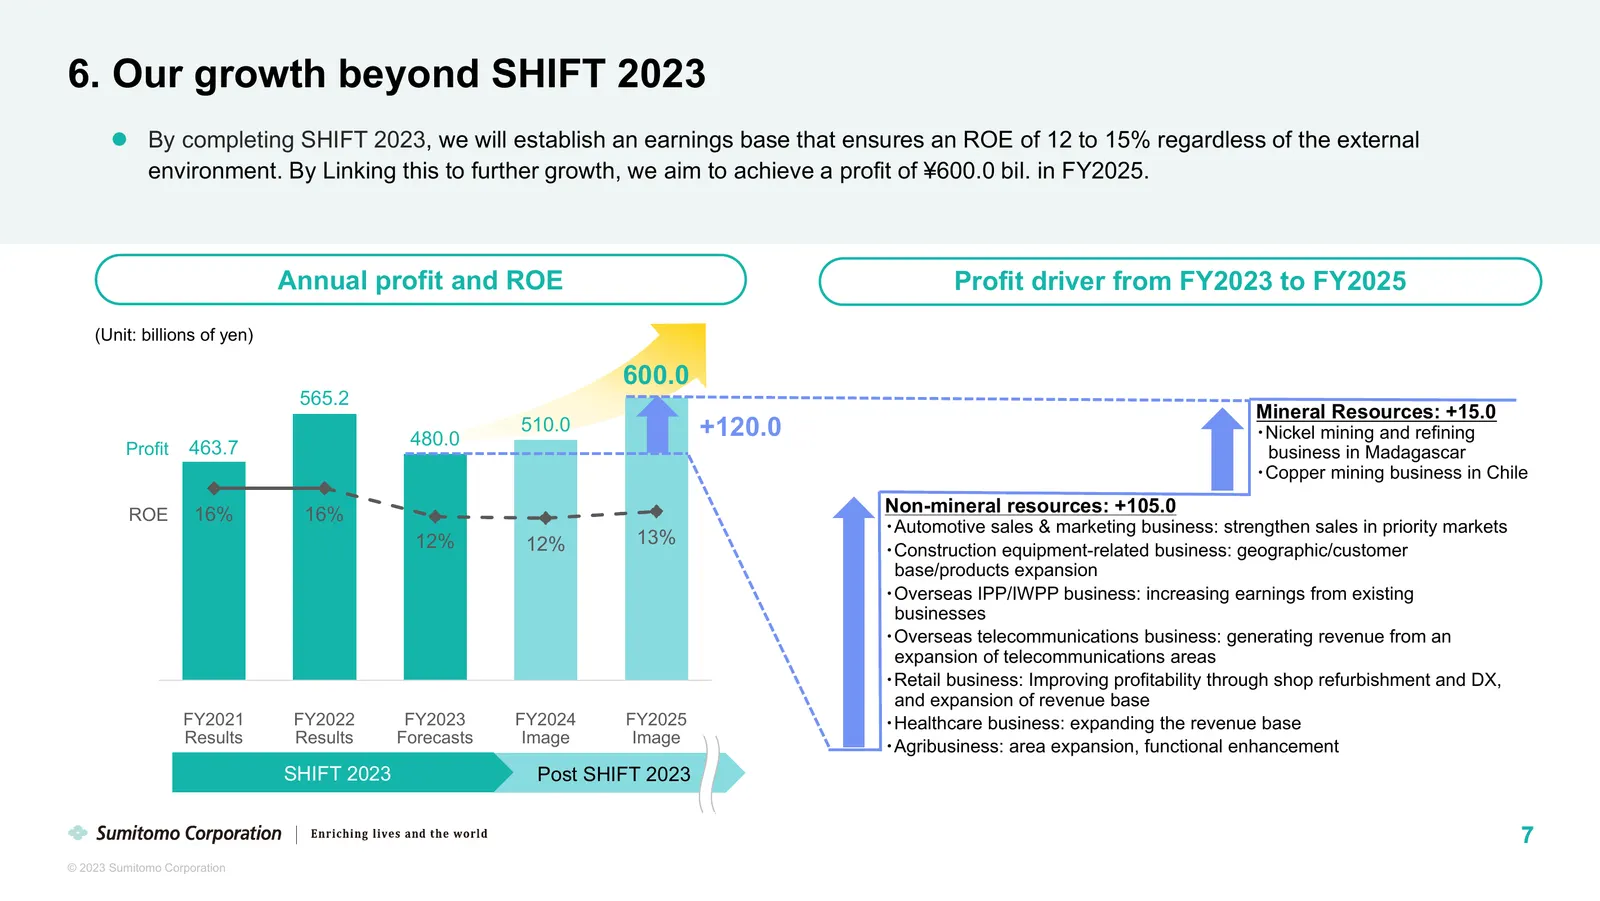
6. Our growth beyond SHIFT 2023 By completing SHIFT 2023, we will establish an earnings base that ensures an ROE of 12 to 15% regardless of the external environment. By Linking this to further growth, we aim to achieve a profit of ¥600.0 bil. in FY2025. Annual profit and ROE Profit driver from FY2
Slide 9: Initiatives to improve corporate value over the medium and long term
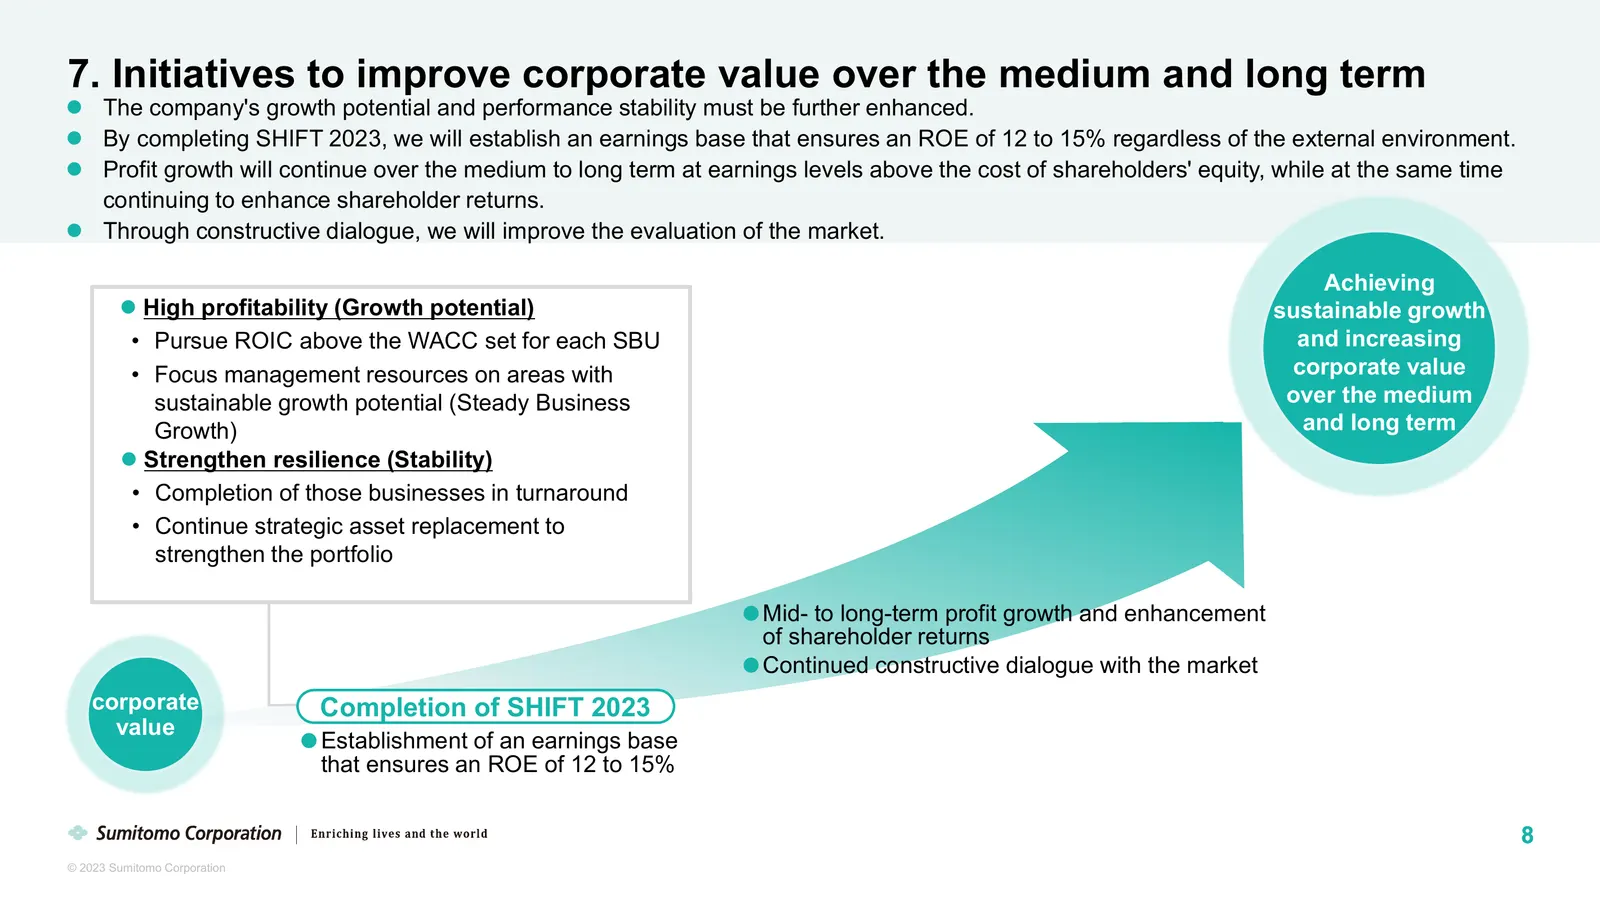
7. Initiatives to improve corporate value over the medium and long term The company's growth potential and performance stability must be further enhanced. By completing SHIFT 2023, we will establish an earnings base that ensures an ROE of 12 to 15% regardless of the external environment. Profi
Slide 10: Shareholder Return
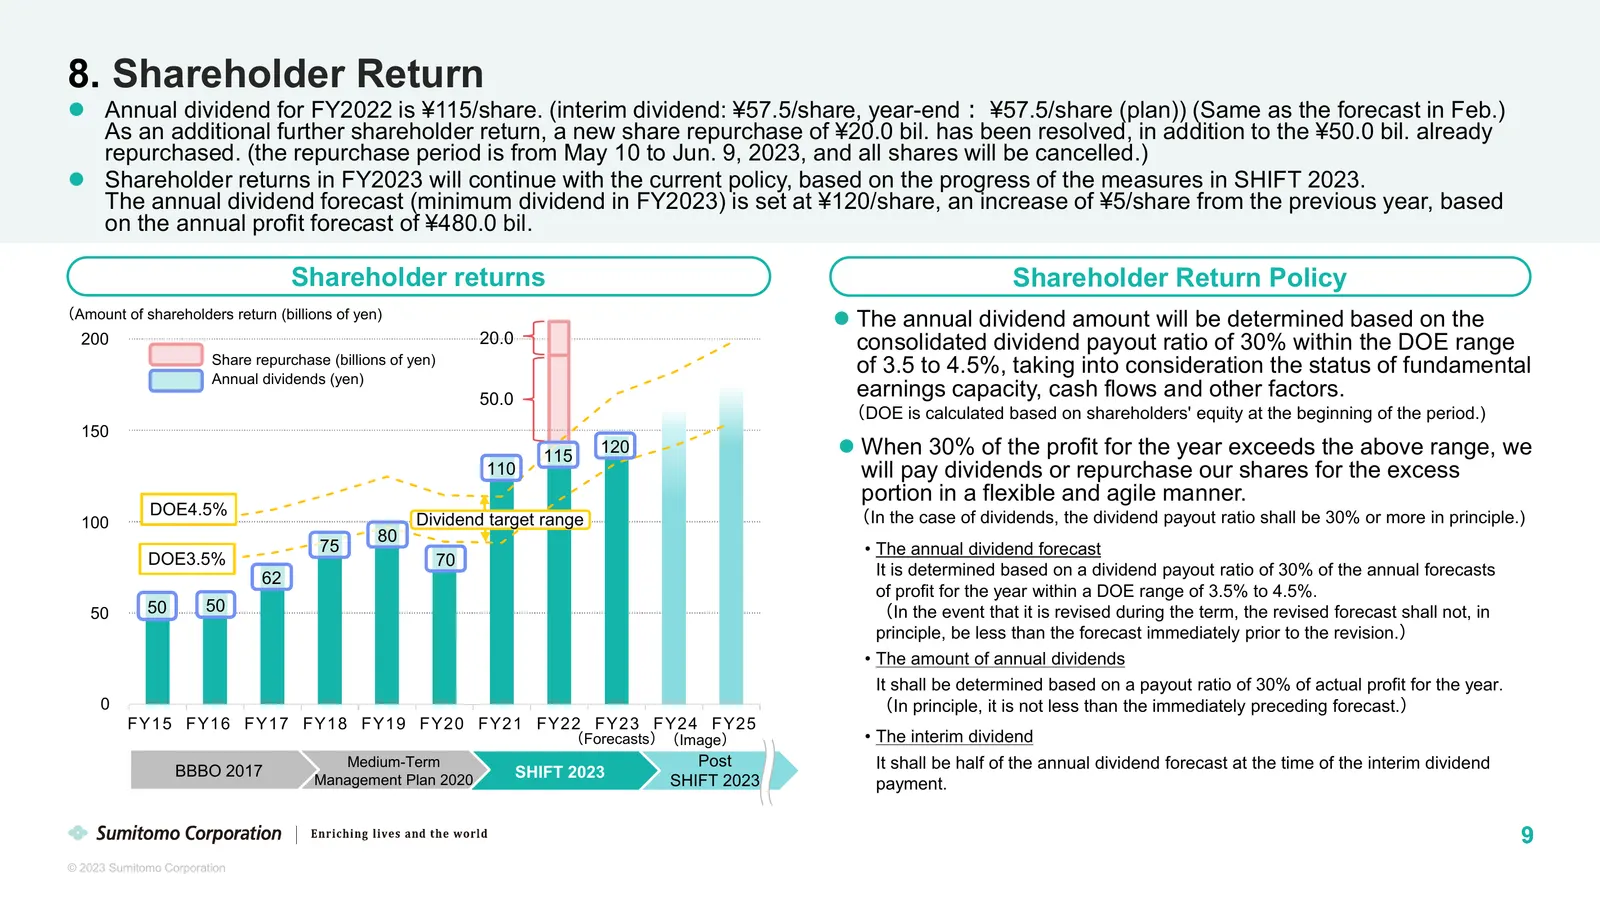
8. Shareholder Return Annual dividend for FY2022 is ¥115/share. (interim dividend: ¥57.5/share, year-end︓ ¥57.5/share (plan)) (Same as the forecast in Feb.) As an additional further shareholder return, a new share repurchase of ¥20.0 bil. has been resolved, in addition to the ¥50.0 bil. already re
Slide 11: FY2022 Results・FY2023 Forecasts
FY2022 Results・FY2023 Forecasts 10 © 2023 Sumitomo Corporation
Slide 12: Operating Results (Profit for the Year)
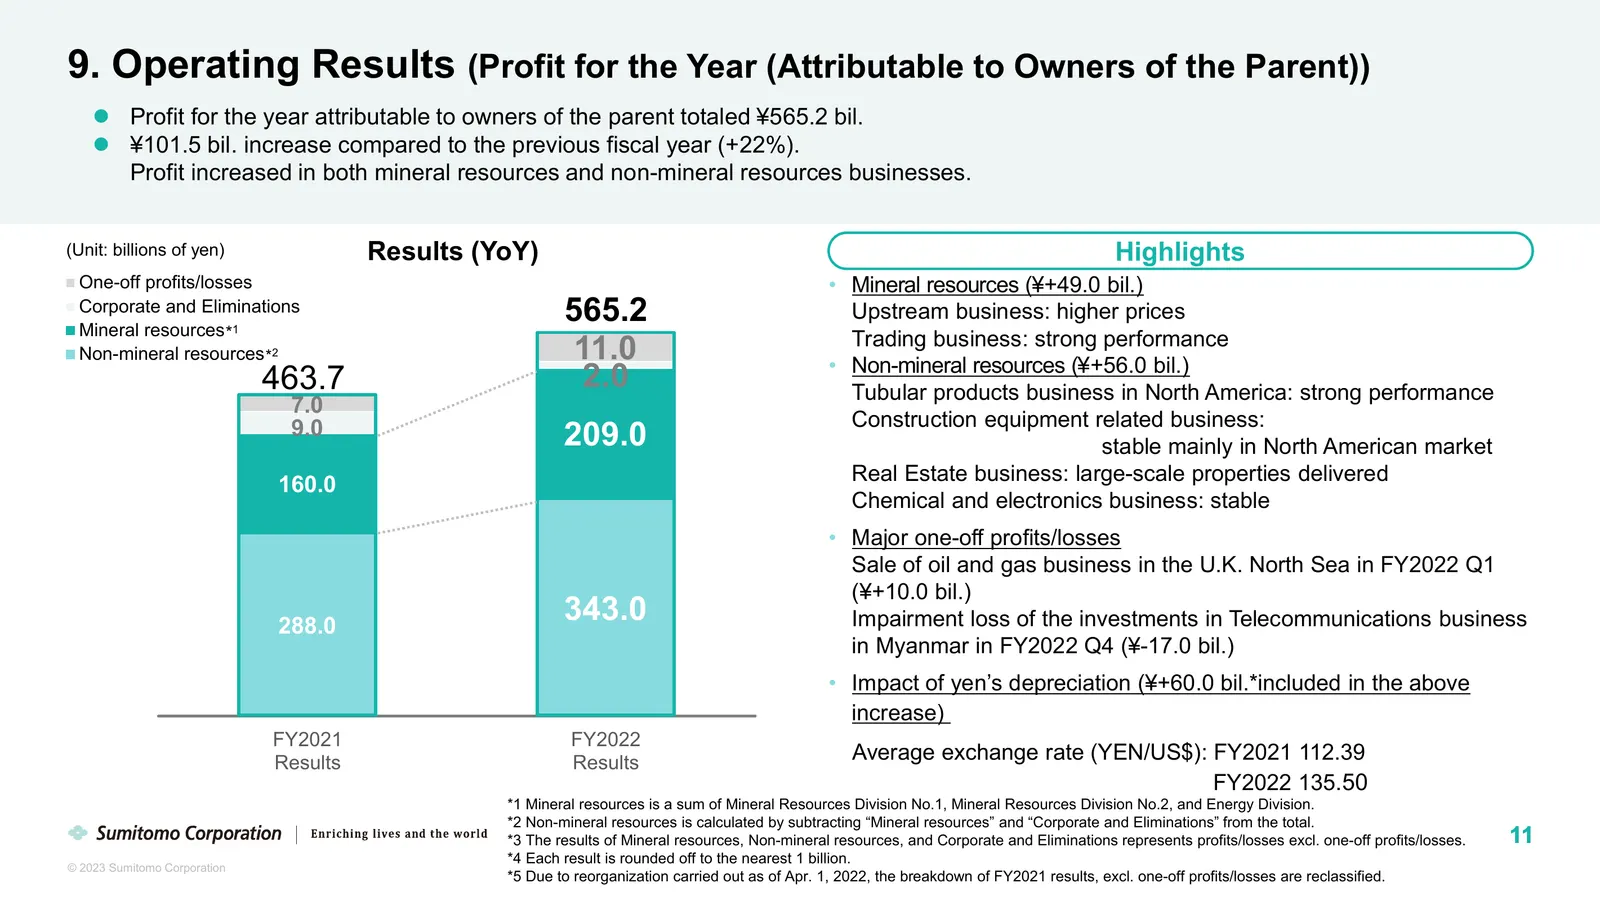
9. Operating Results (Profit for the Year (Attributable to Owners of the Parent)) Profit for the year attributable to owners of the parent totaled ¥565.2 bil. ¥101.5 bil. increase compared to the previous fiscal year (+22%). Profit increased in both mineral resources and non-mineral resources bu
Slide 13: Profit for the Year by Segment
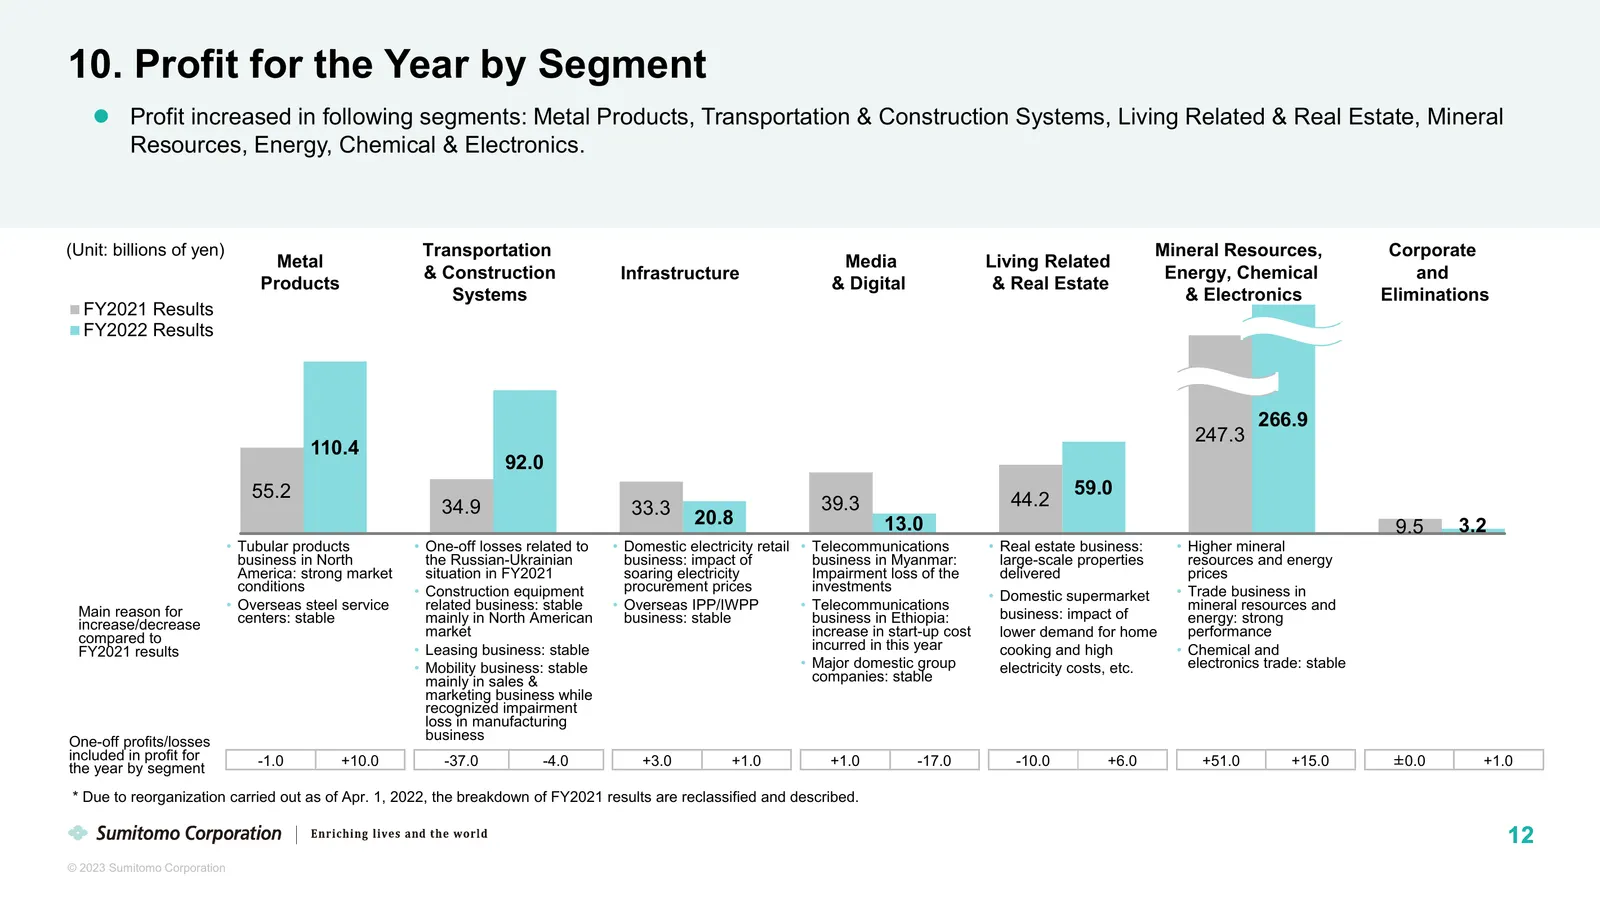
10. Profit for the Year by Segment Profit increased in following segments: Metal Products, Transportation & Construction Systems, Living Related & Real Estate, Mineral Resources, Energy, Chemical & Electronics. (Unit: billions of yen) Transportation Mineral Resources, Corporate Metal Media Living
Slide 14: Quarterly Trend for Profit for the Year (excluding one-off profits/losses)
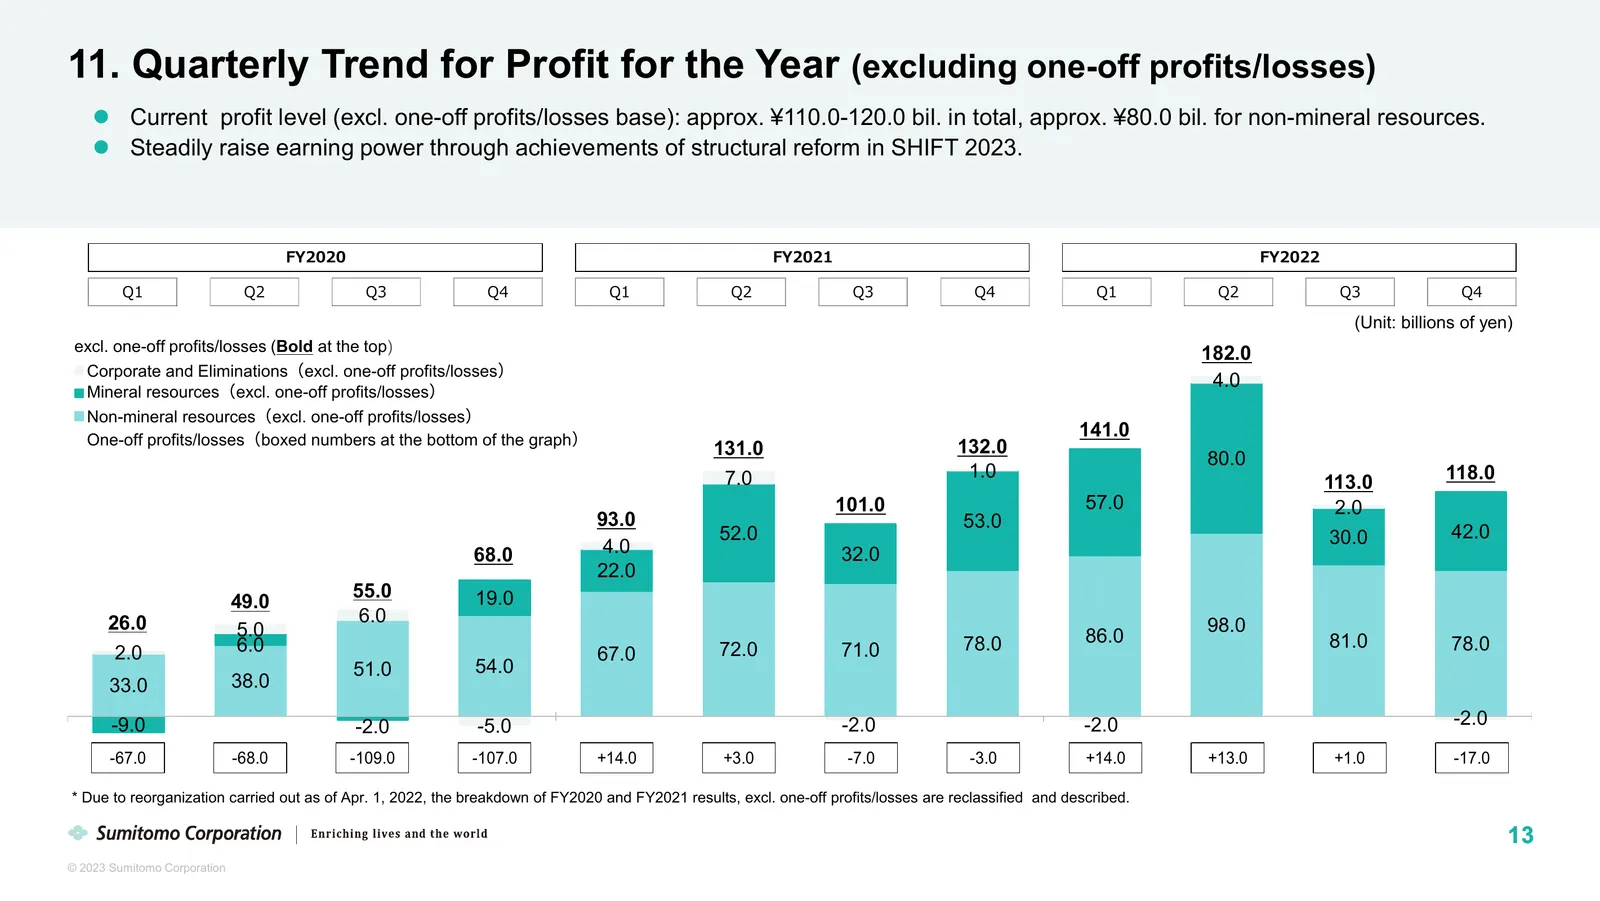
11. Quarterly Trend for Profit for the Year (excluding one-off profits/losses) Current profit level (excl. one-off profits/losses base): approx. ¥110.0-120.0 bil. in total, approx. ¥80.0 bil. for non-mineral resources. Steadily raise earning power through achievements of structural reform in SHI
Slide 15: Operating Results (Cash Flows)
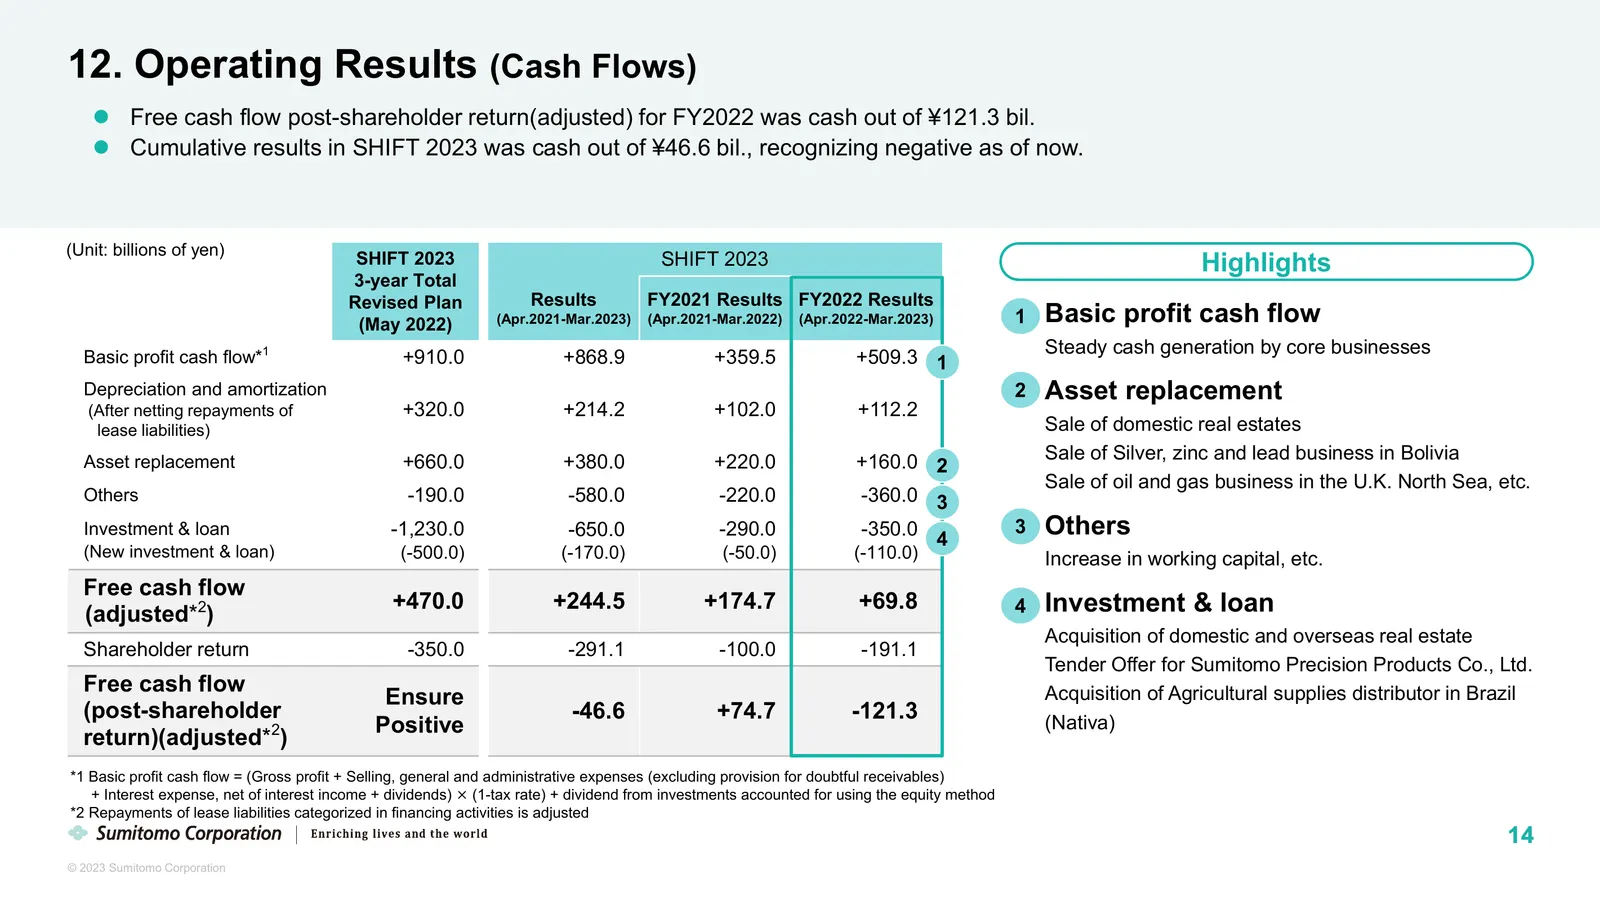
12. Operating Results (Cash Flows) Free cash flow post-shareholder return(adjusted) for FY2022 was cash out of ¥121.3 bil. Cumulative results in SHIFT 2023 was cash out of ¥46.6 bil., recognizing negative as of now. (Unit: billions of yen) SHIFT 2023 SHIFT 2023 Highlights 3-year Total Revised Pl
Slide 16: Operating Results (Financial Position)
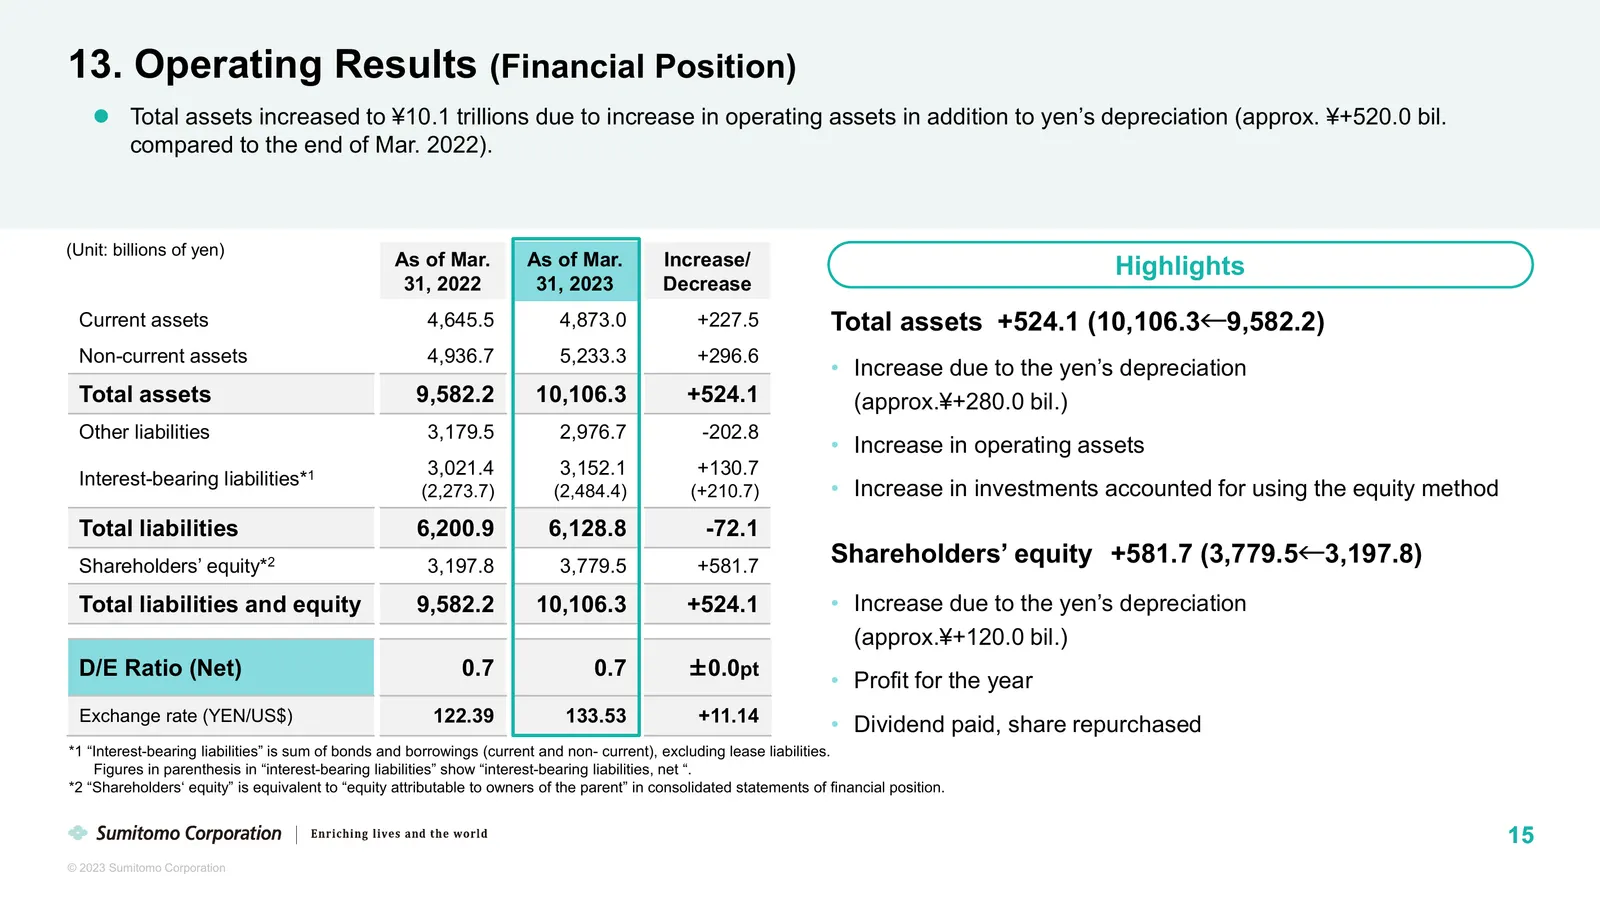
13. Operating Results (Financial Position) Total assets increased to ¥10.1 trillions due to increase in operating assets in addition to yen’s depreciation (approx. ¥+520.0 bil. compared to the end of Mar. 2022). (Unit: billions of yen) As of Mar. As of Mar. Increase/ Highlights 31, 2022 31, 2023 D
Slide 17: Forecasts for FY2023 (Profit for the Year)
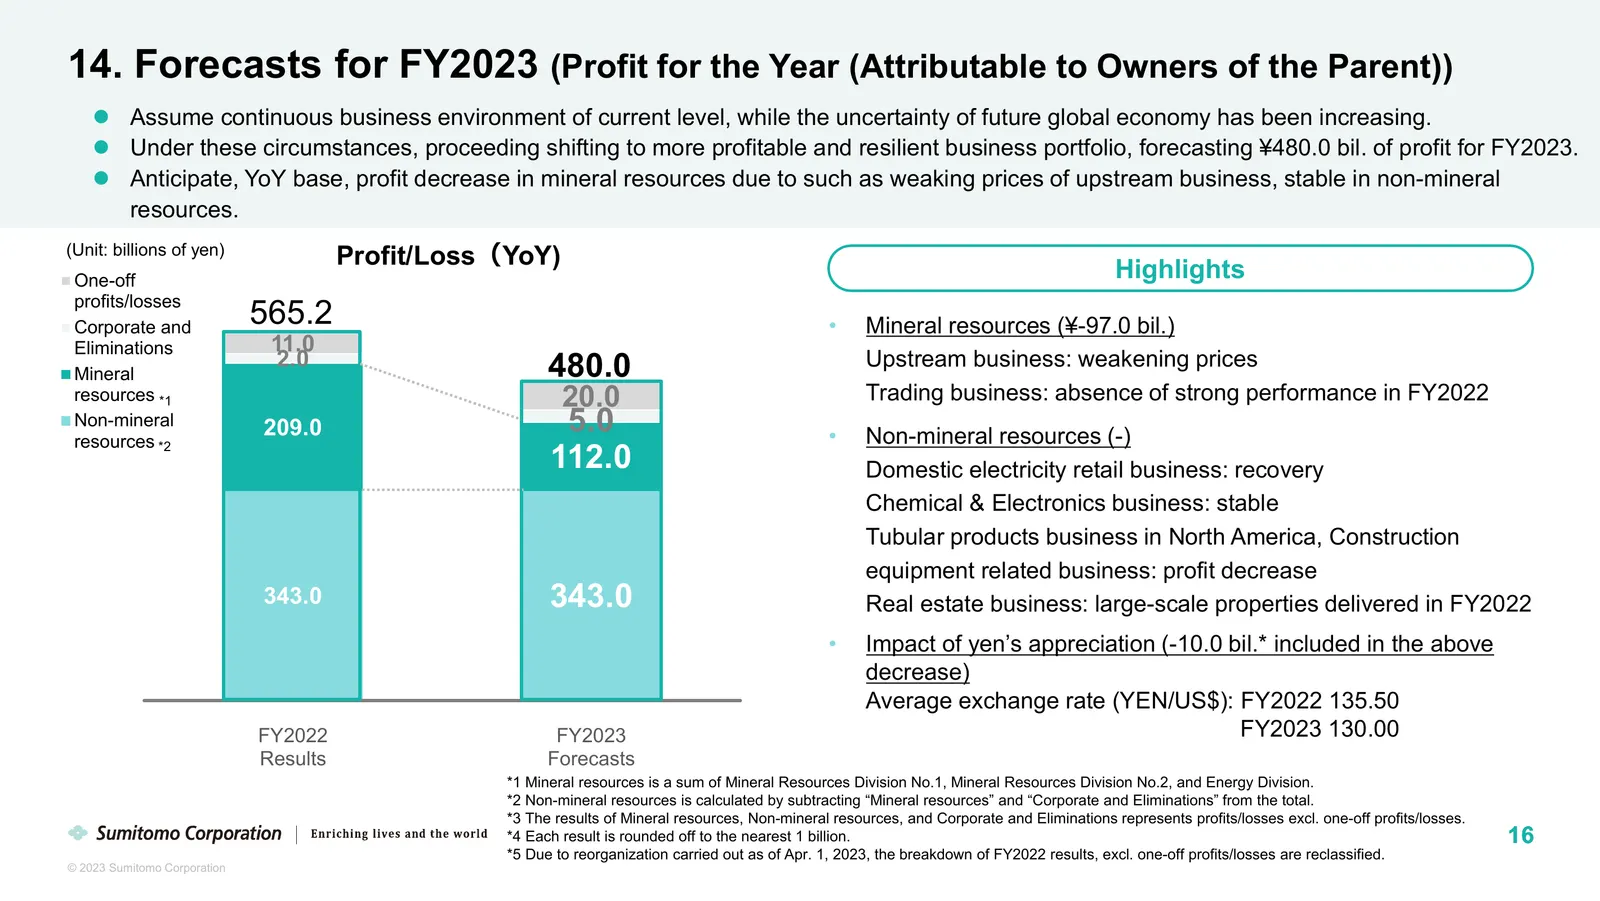
14. Forecasts for FY2023 (Profit for the Year (Attributable to Owners of the Parent)) Assume continuous business environment of current level, while the uncertainty of future global economy has been increasing. Under these circumstances, proceeding shifting to more profitable and resilient busin
Slide 18: Forecasts for FY2023 (Profit for the Year by Segment)
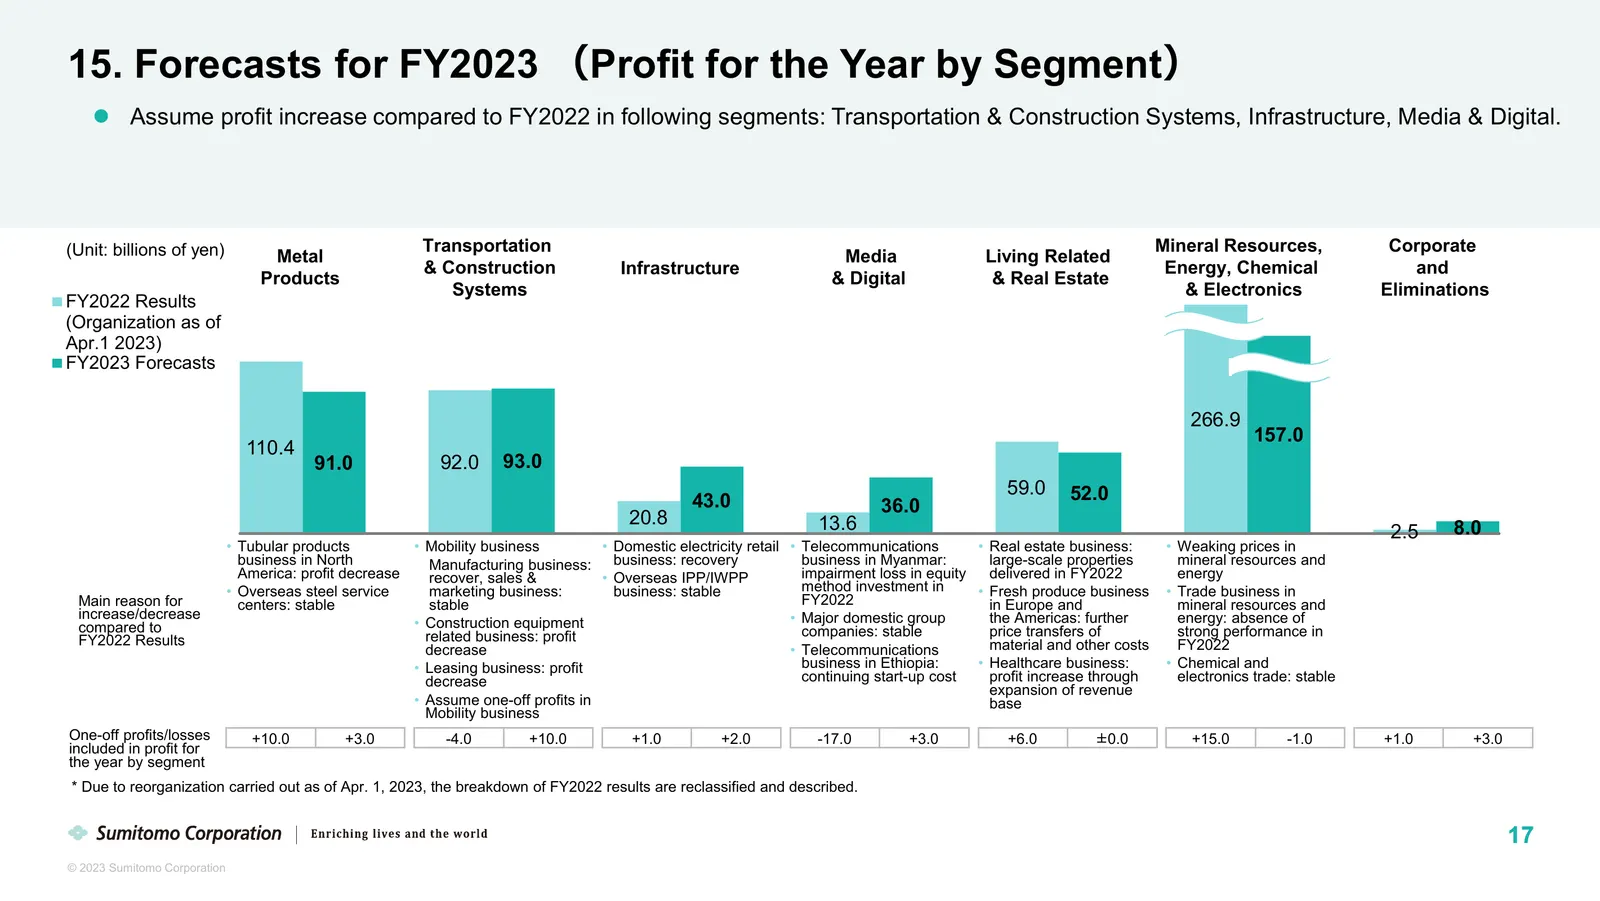
15. Forecasts for FY2023 (Profit for the Year by Segment) Assume profit increase compared to FY2022 in following segments: Transportation & Construction Systems, Infrastructure, Media & Digital. (Unit: billions of yen) Transportation Mineral Resources, Corporate Metal Media Living Related & Constr
Slide 19: SHIFT 2023 Cash Flows Plan
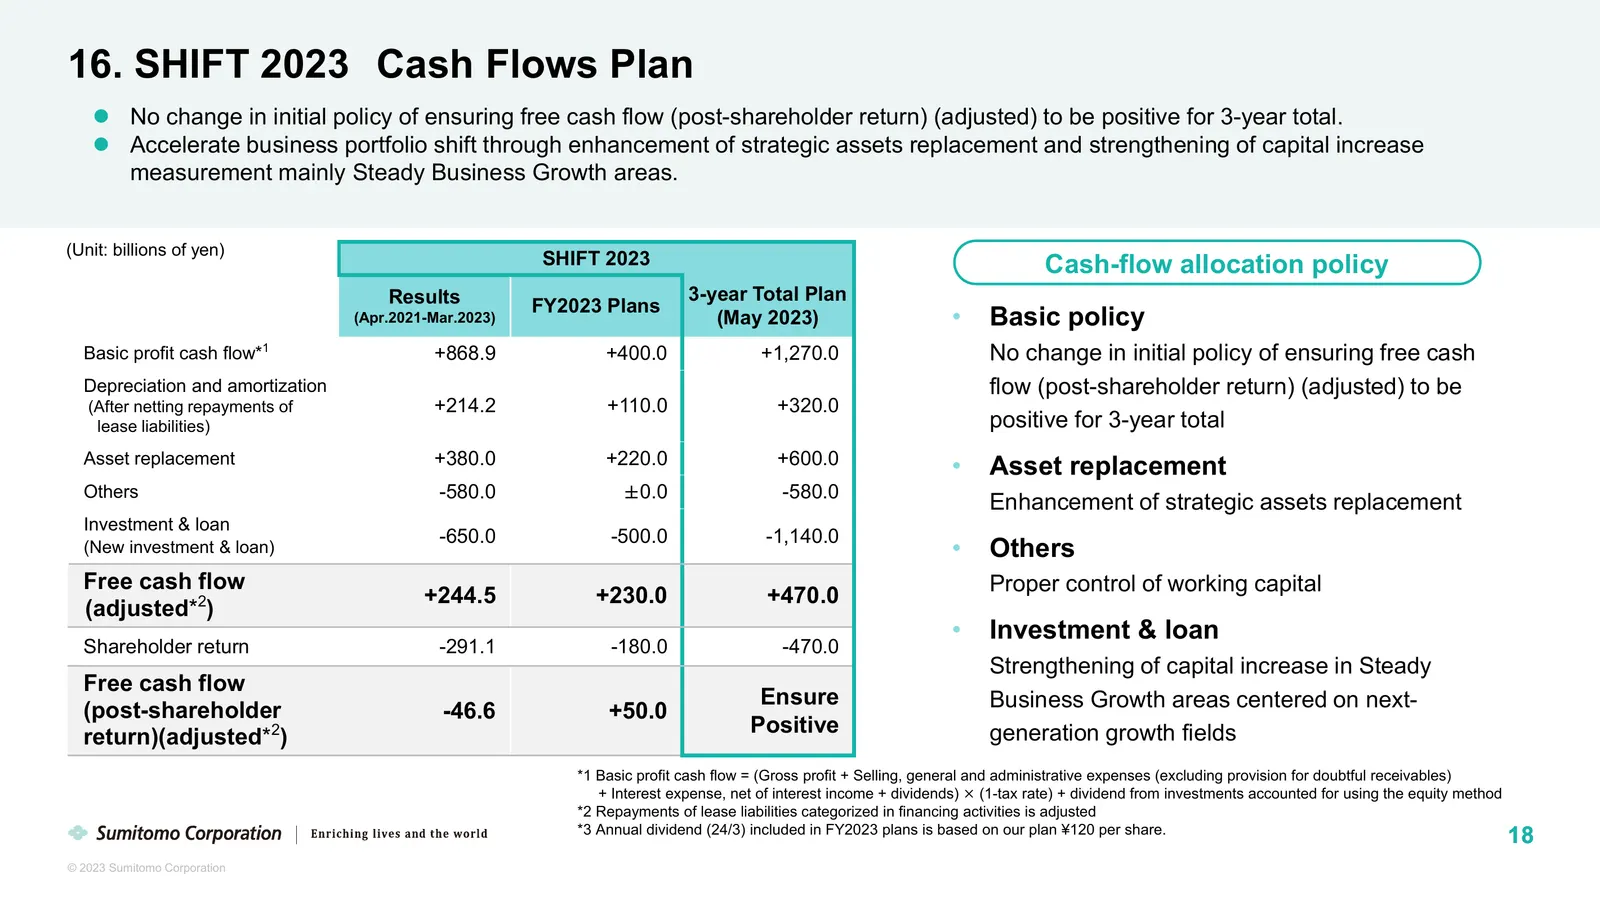
16. SHIFT 2023 Cash Flows Plan No change in initial policy of ensuring free cash flow (post-shareholder return) (adjusted) to be positive for 3-year total. Accelerate business portfolio shift through enhancement of strategic assets replacement and strengthening of capital increase measurement ma
Slide 20: Appendix
Appendix 19 © 2023 Sumitomo Corporation
Slide 21: Contents
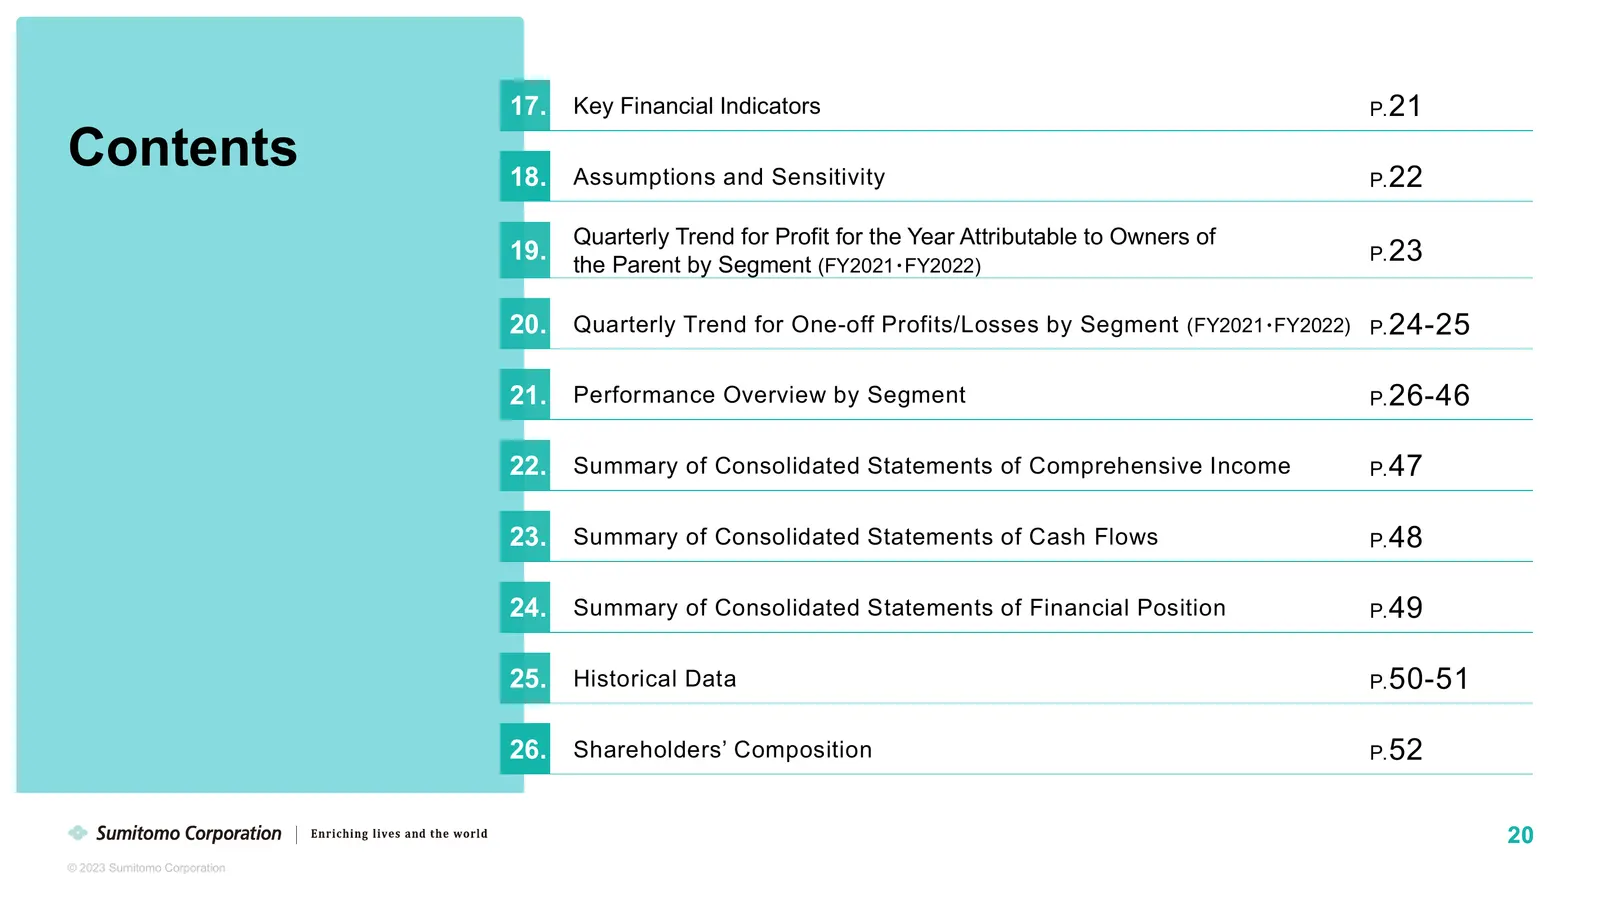
17. Key Financial Indicators P. 21 Contents 18. Assumptions and Sensitivity P. 22 Quarterly Trend for Profit for the Year Attributable to Owners of 19. the Parent by Segment (FY2021・FY2022) P. 23 20. Quarterly Trend for One-off Profits/Losses by Segment (FY2021・FY2022) P. 24-25 21. Performance Overv
Slide 22: Key Financial Indicators
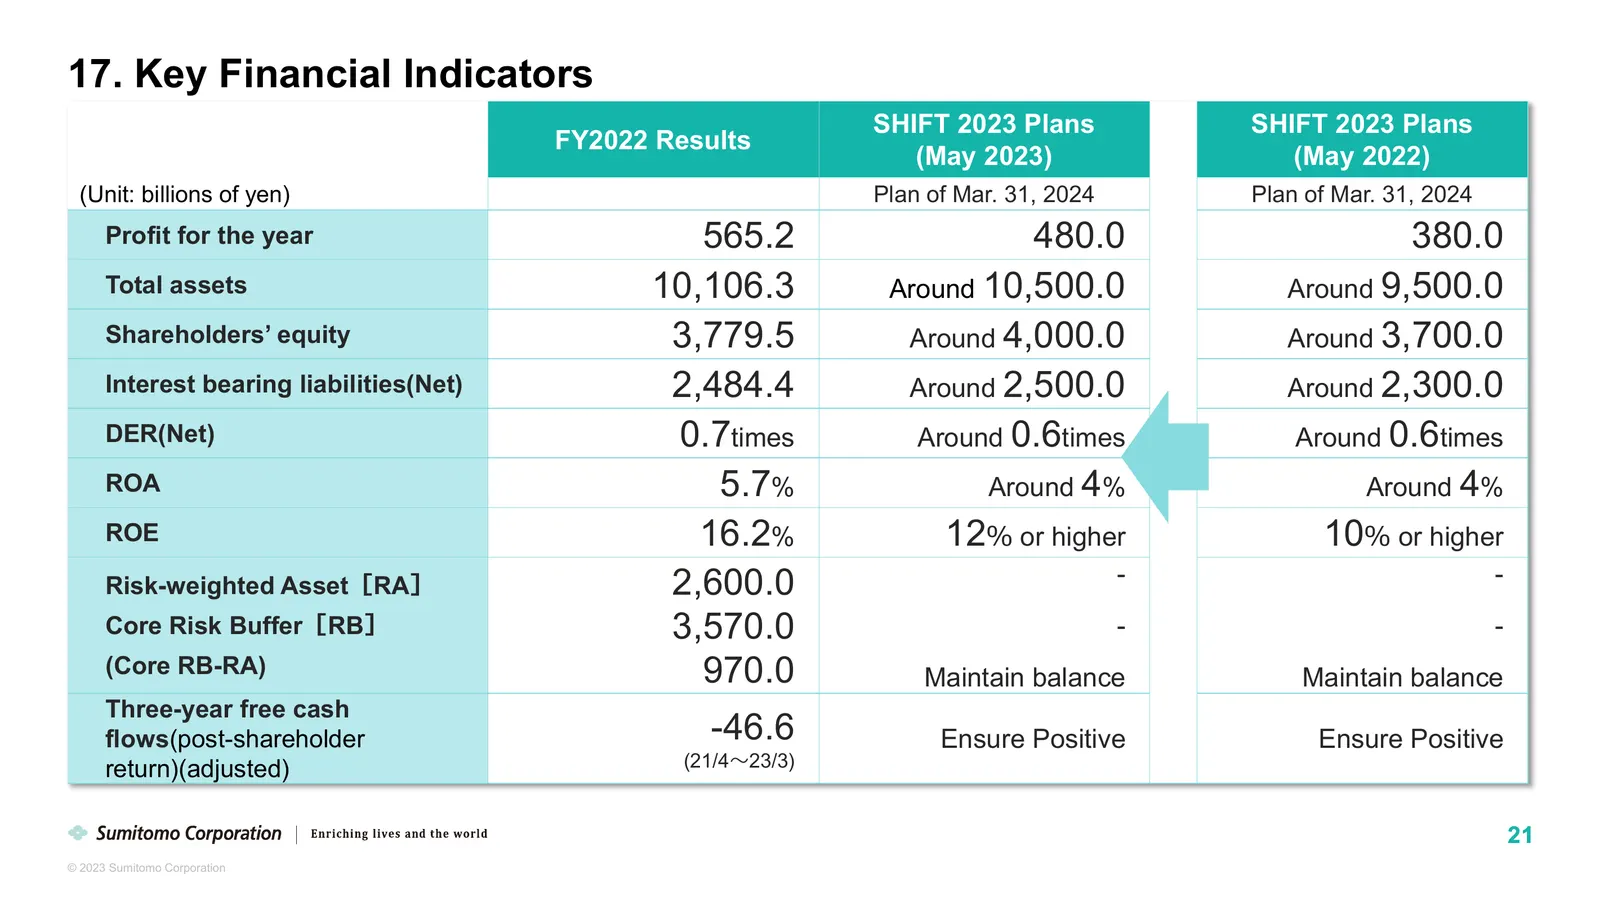
17. Key Financial Indicators SHIFT 2023 Plans SHIFT 2023 Plans FY2022 Results (May 2023) (May 2022) (Unit: billions of yen) Plan of Mar. 31, 2024 Plan of Mar. 31, 2024 Profit for the year 565.2 480.0 380.0 Total assets 10,106.3 Around 10,500.0 Around 9,500.0 Shareholders’ equity 3,779.5 Around 4,000
Slide 23: Assumptions and Sensitivity
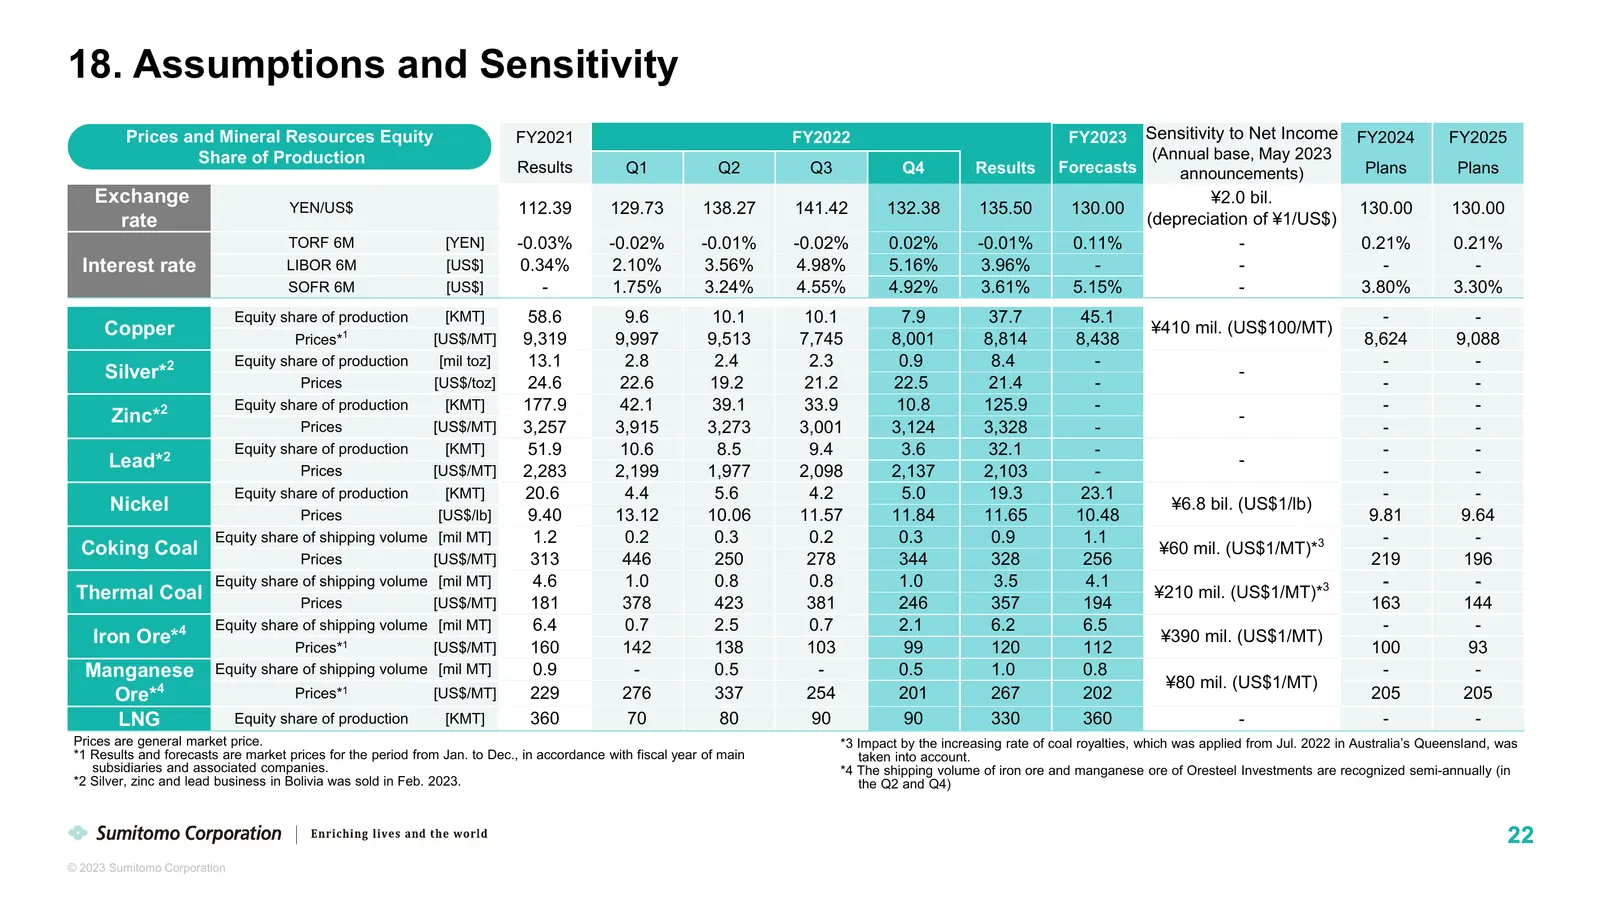
18. Assumptions and Sensitivity Prices and Mineral Resources Equity FY2021 FY2022 FY2023 Sensitivity to Net Income FY2024 FY2025 Share of Production (Annual base, May 2023 Results Q1 Q2 Q3 Q4 Results Forecasts announcements) Plans Plans Exchange ¥2.0 bil. YEN/US$ 112.39 129.73 138.27 141.42 132.38 1
Slide 24: Quarterly Trend for Profit for the Year by Segment
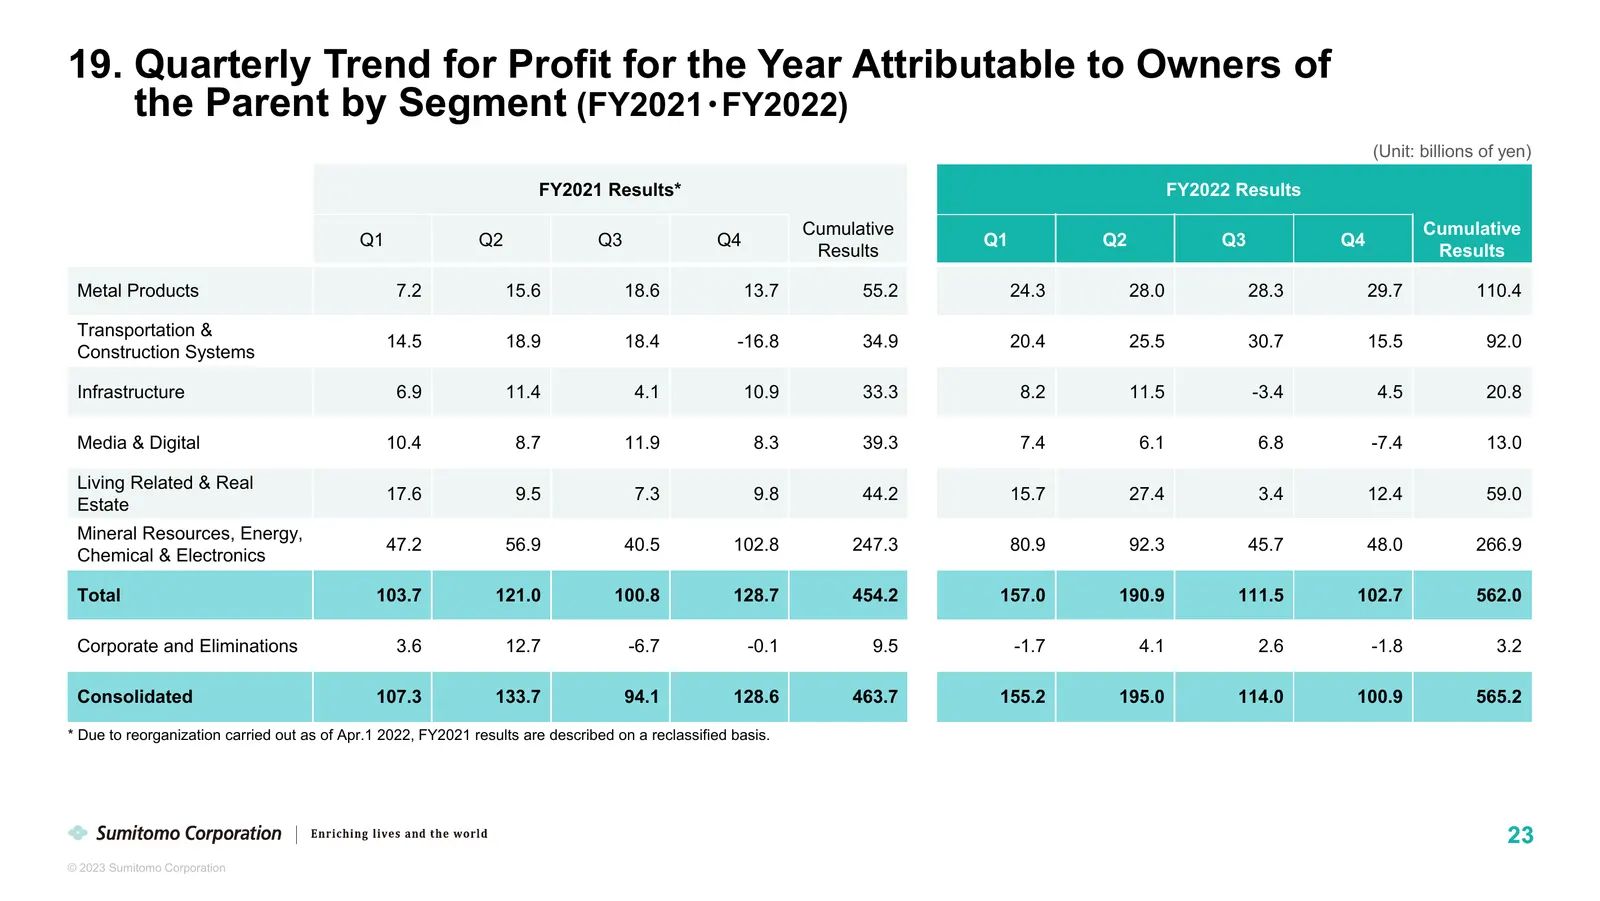
19. Quarterly Trend for Profit for the Year Attributable to Owners of the Parent by Segment (FY2021・FY2022) (Unit: billions of yen) FY2021 Results* FY2022 Results Cumulative Cumulative Q1 Q2 Q3 Q4 Q1 Q2 Q3 Q4 Results Results Metal Products 7.2 15.6 18.6 13.7 55.2 24.3 28.0 28.3 29.7 110.4 Transporta
Slide 25: Quarterly Trend for One-off Profits/Losses by Segment (FY2022)
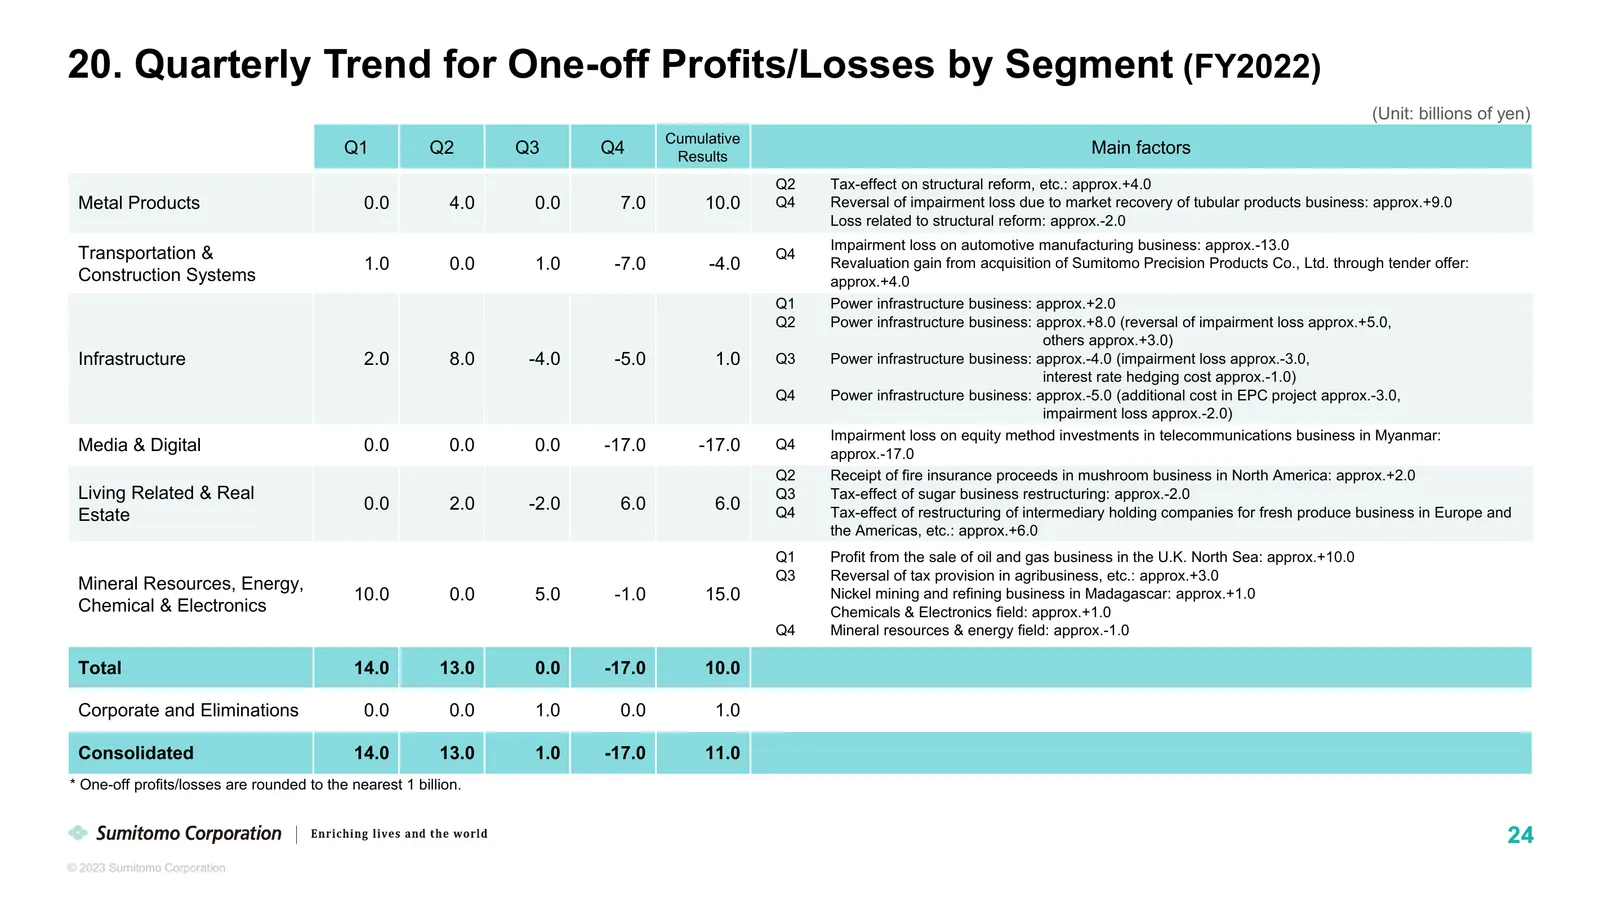
20. Quarterly Trend for One-off Profits/Losses by Segment (FY2022) (Unit: billions of yen) Cumulative Q1 Q2 Q3 Q4 Results Main factors Q2 Tax-effect on structural reform, etc.: approx.+4.0 Metal Products 0.0 4.0 0.0 7.0 10.0 Q4 Reversal of impairment loss due to market recovery of tubular products b
Slide 26: Quarterly Trend for One-off Profits/Losses by Segment (FY2021)
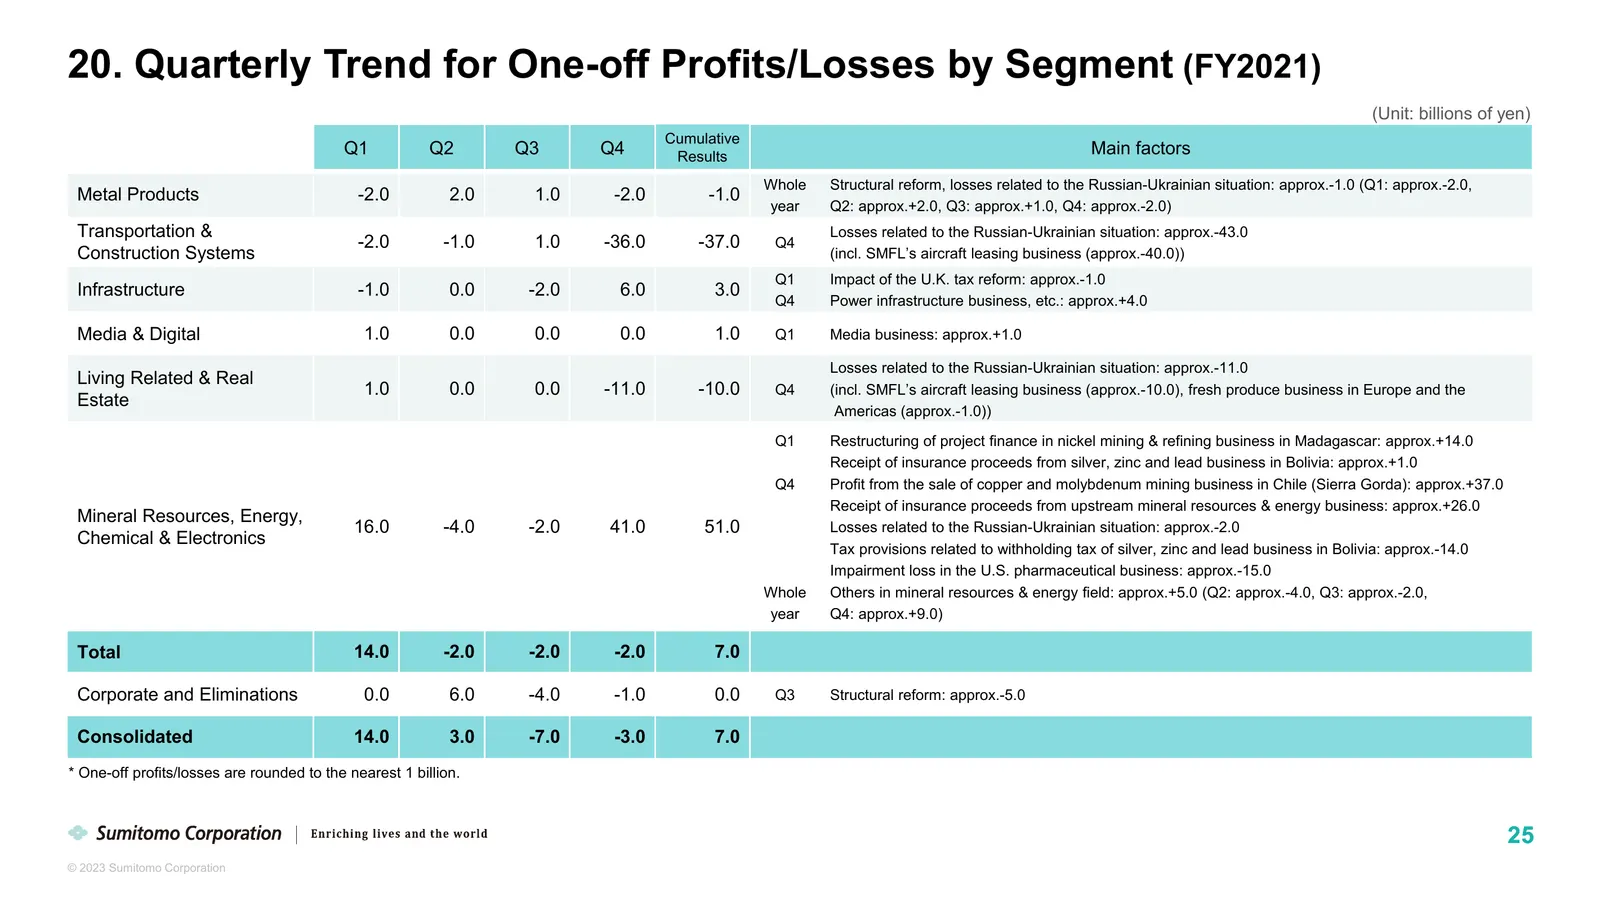
20. Quarterly Trend for One-off Profits/Losses by Segment (FY2021) (Unit: billions of yen) Cumulative Q1 Q2 Q3 Q4 Results Main factors Whole Structural reform, losses related to the Russian-Ukrainian situation: approx.-1.0 (Q1: approx.-2.0, Metal Products -2.0 2.0 1.0 -2.0 -1.0 year Q2: approx.+2.0,
Slide 27: Performance Overview (Metal Products)
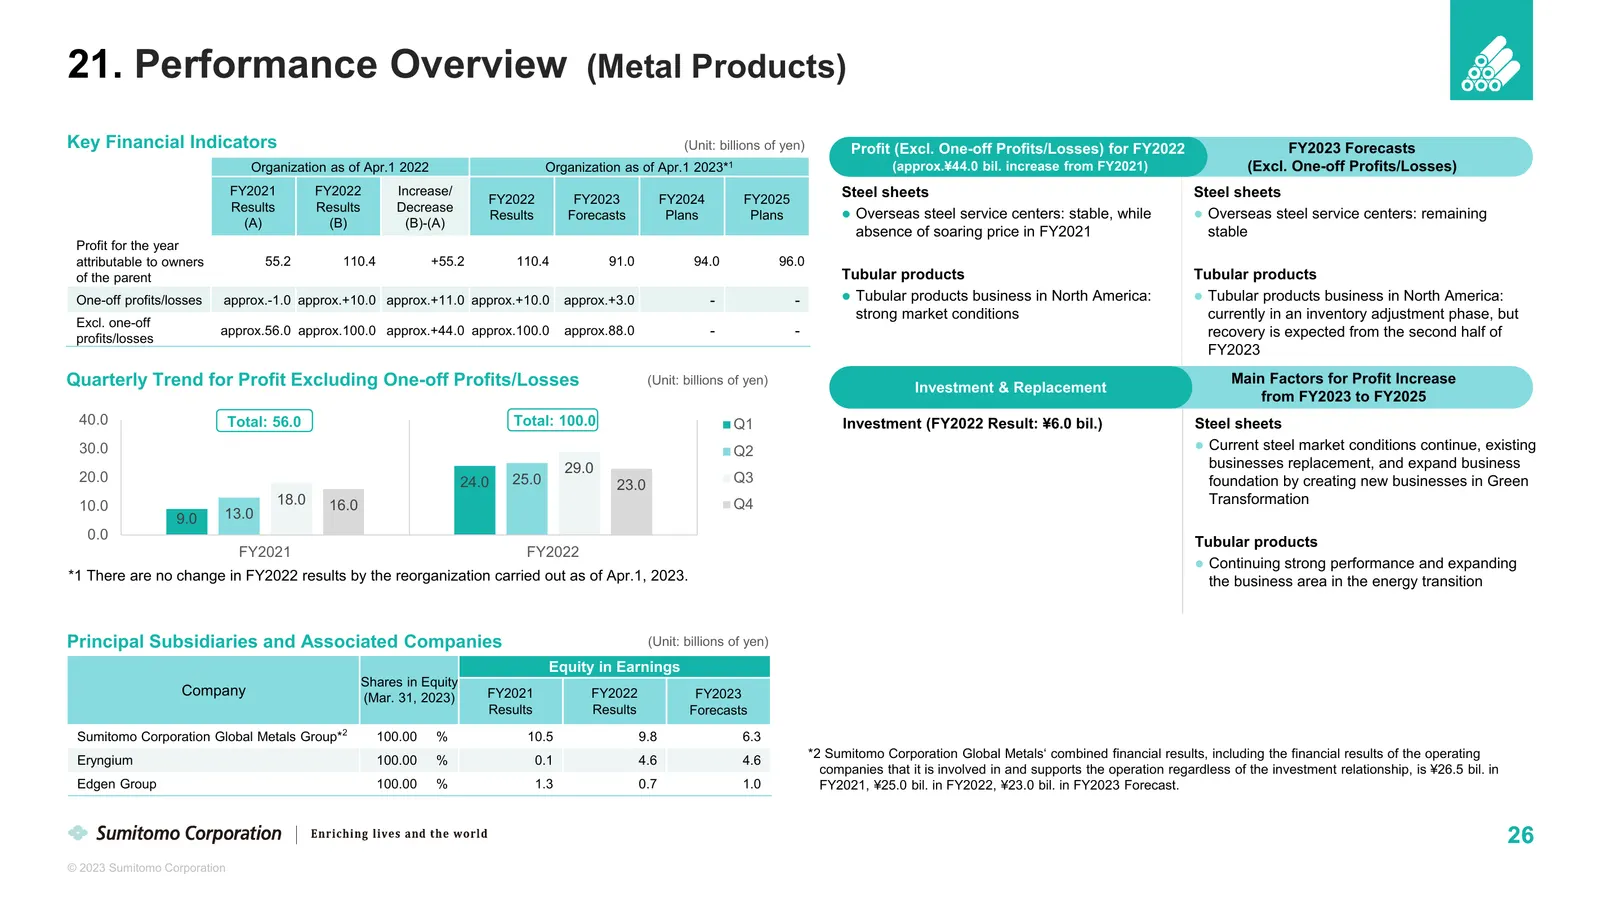
21. Performance Overview (Metal Products) Key Financial Indicators (Unit: billions of yen) Profit (Excl. One-off Profits/Losses) for FY2022 FY2023 Forecasts Organization as of Apr.1 2022 Organization as of Apr.1 2023*1 (approx.¥44.0 bil. increase from FY2021) (Excl. One-off Profits/Losses) FY2021 FY
Slide 28: Hot Rolled Steel Export Prices and Rig Count
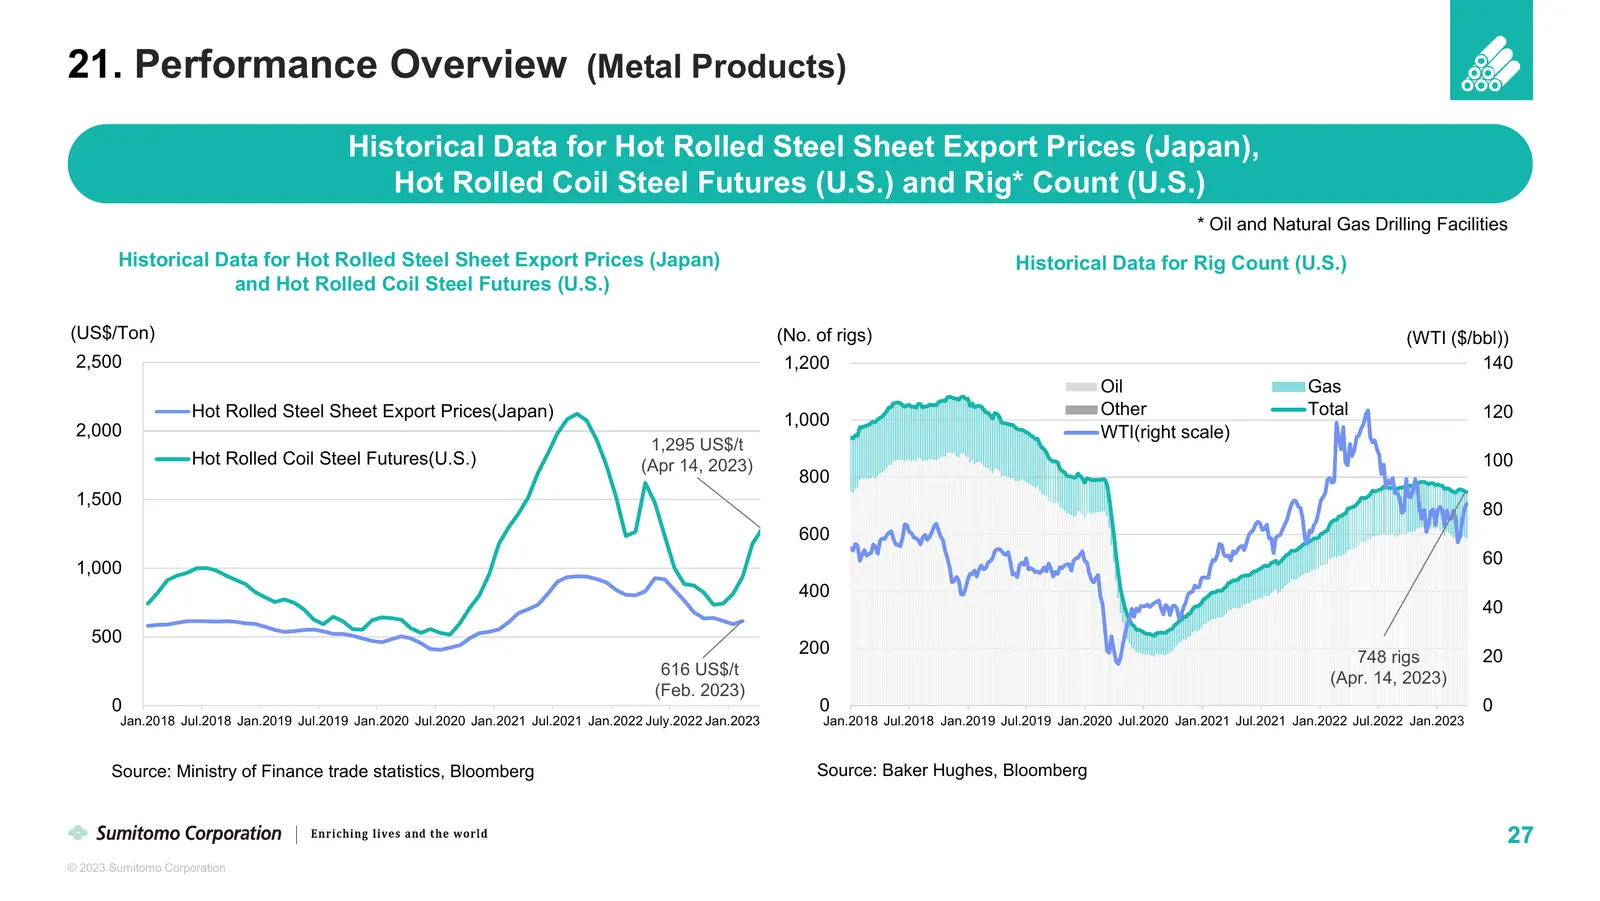
21. Performance Overview (Metal Products) Historical Data for Hot Rolled Steel Sheet Export Prices (Japan), Hot Rolled Coil Steel Futures (U.S.) and Rig* Count (U.S.) * Oil and Natural Gas Drilling Facilities Historical Data for Hot Rolled Steel Sheet Export Prices (Japan) Historical Data for Rig Co
Slide 29: Performance Overview (Transportation & Construction Systems)
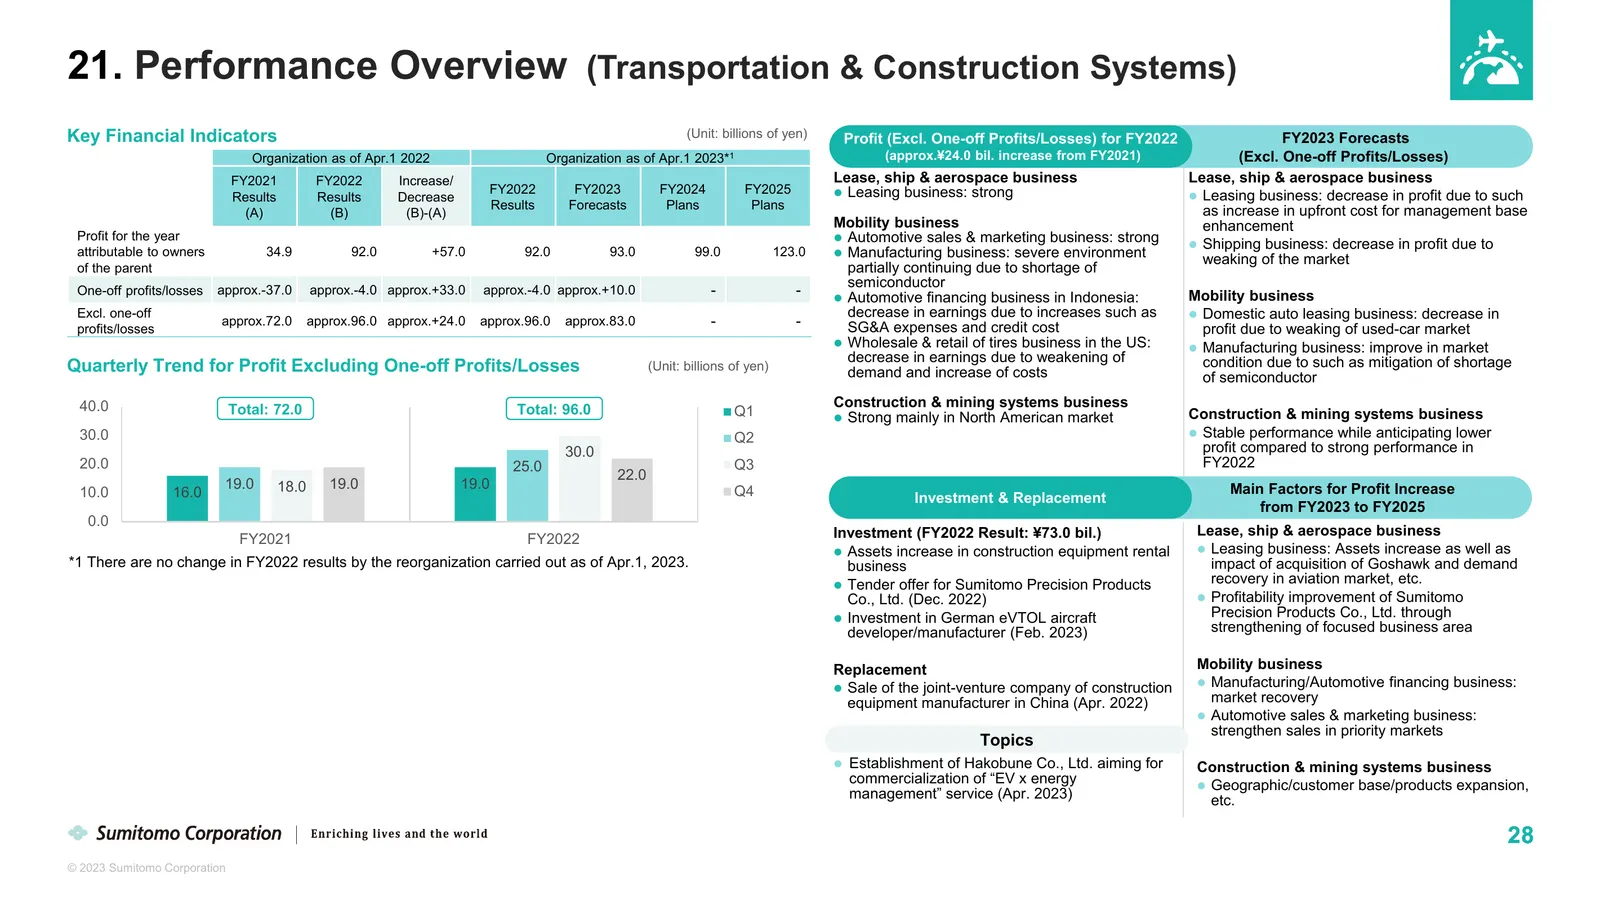
21. Performance Overview (Transportation & Construction Systems) Key Financial Indicators (Unit: billions of yen) Profit (Excl. One-off Profits/Losses) for FY2022 FY2023 Forecasts Organization as of Apr.1 2022 Organization as of Apr.1 2023*1 (approx.¥24.0 bil. increase from FY2021) (Excl. One-off Pr
Slide 30: Principal Subsidiaries and Associated Companies (Transportation & Construction)
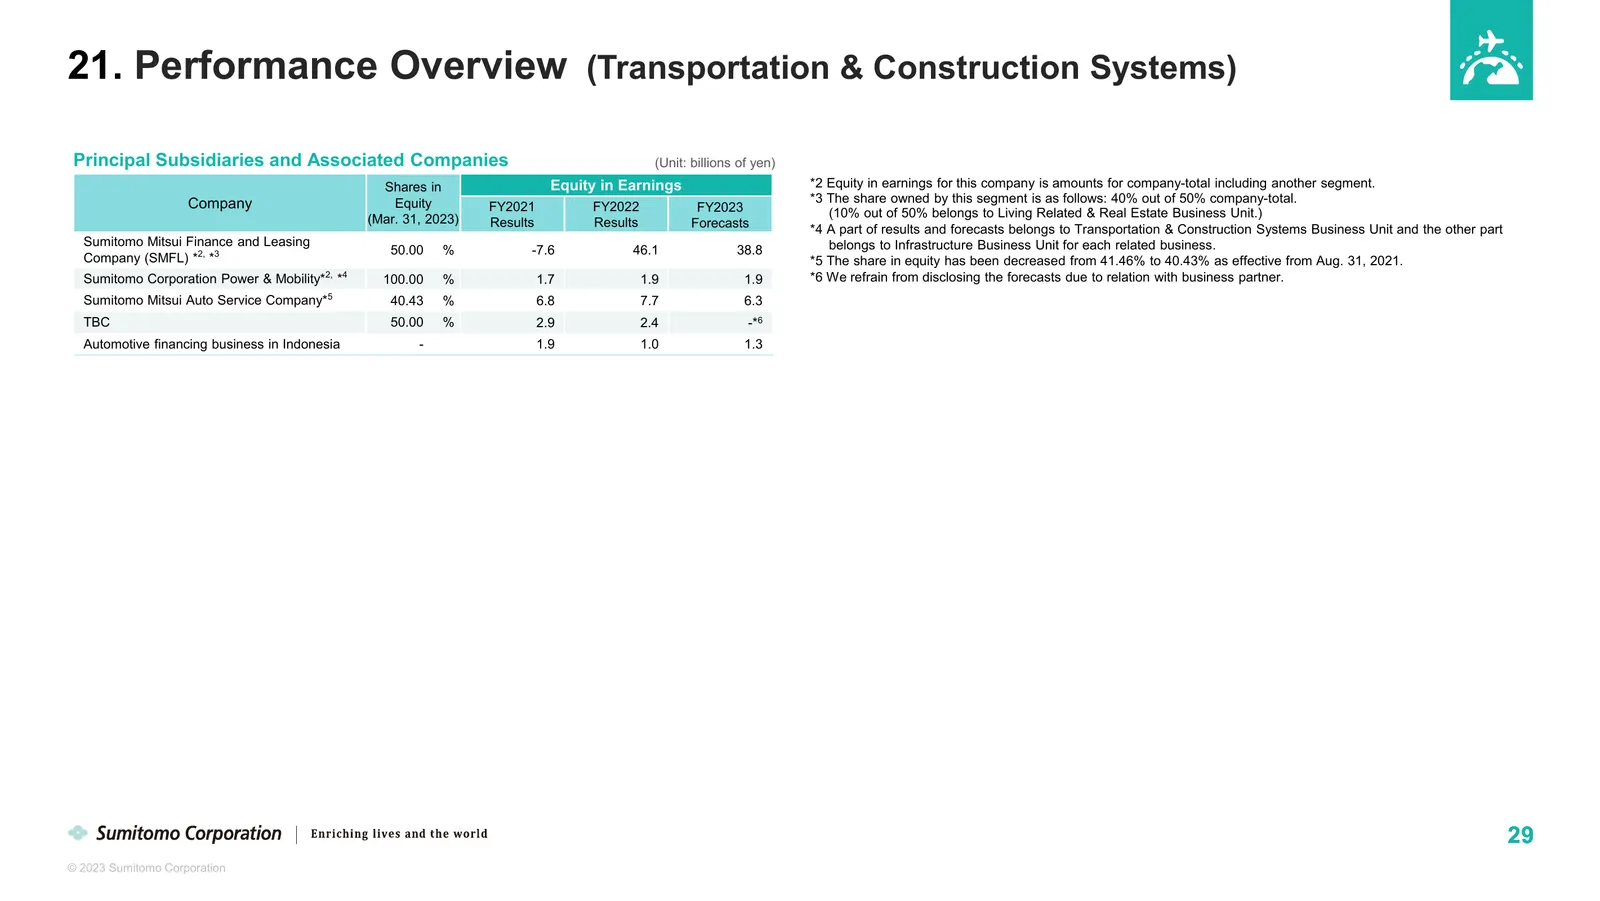
21. Performance Overview (Transportation & Construction Systems) Principal Subsidiaries and Associated Companies (Unit: billions of yen) Shares in Equity in Earnings *2 Equity in earnings for this company is amounts for company-total including another segment. Company Equity *3 The share owned by th
Slide 31: Performance Overview (Transportation & Construction Systems)
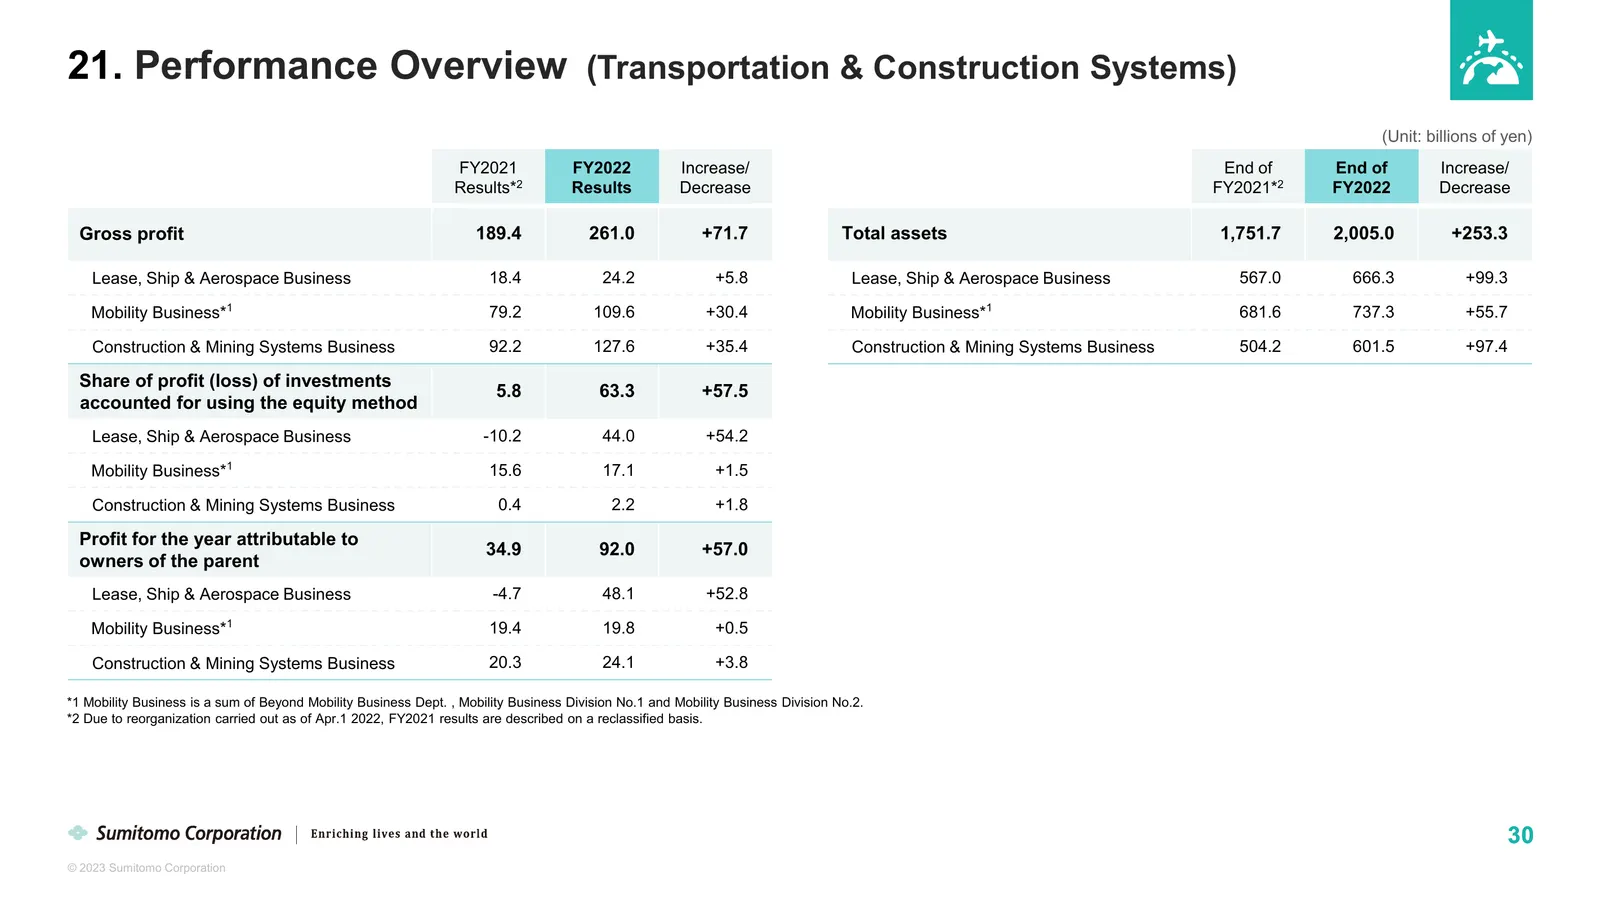
21. Performance Overview (Transportation & Construction Systems) (Unit: billions of yen) FY2021 FY2022 Increase/ End of End of Increase/ Results*2 Results Decrease FY2021*2 FY2022 Decrease Gross profit 189.4 261.0 +71.7 Total assets 1,751.7 2,005.0 +253.3 Lease, Ship & Aerospace Business 18.4 24.2 +
Slide 32: Global Map of Mobility Business
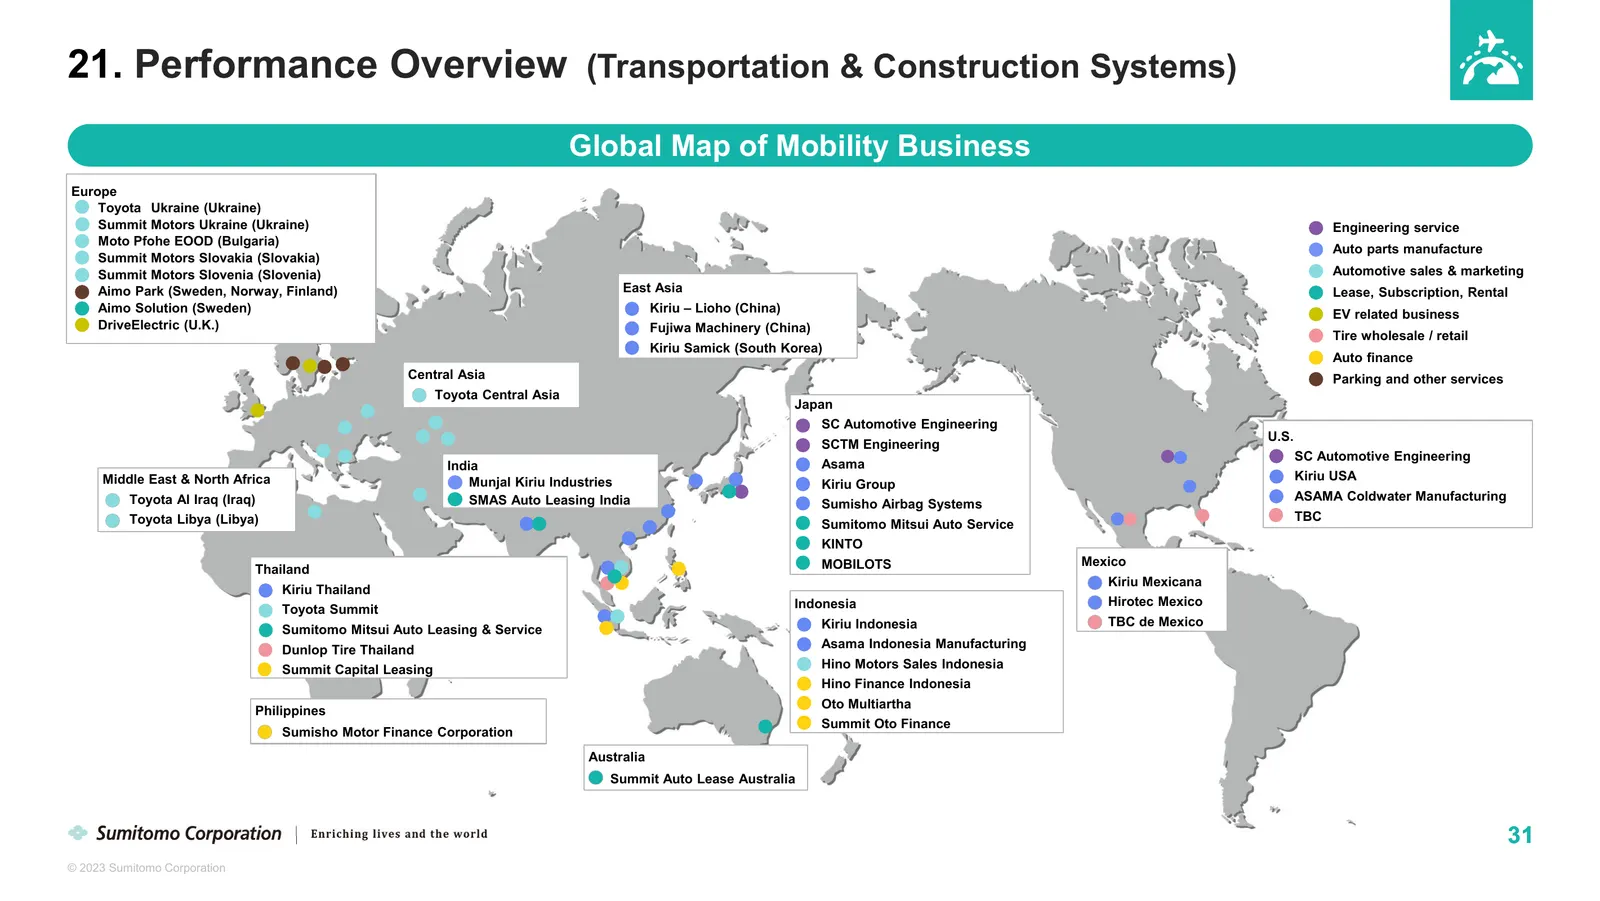
21. Performance Overview (Transportation & Construction Systems) Global Map of Mobility Business Europe Toyota Ukraine (Ukraine) Summit Motors Ukraine (Ukraine) Engineering service Moto Pfohe EOOD (Bulgaria) Auto parts manufacture Summit Motors Slovakia (Slovakia) Summit Motors Slovenia (Slovenia) A
Slide 33: Construction & Mining Systems Business Growth Strategy
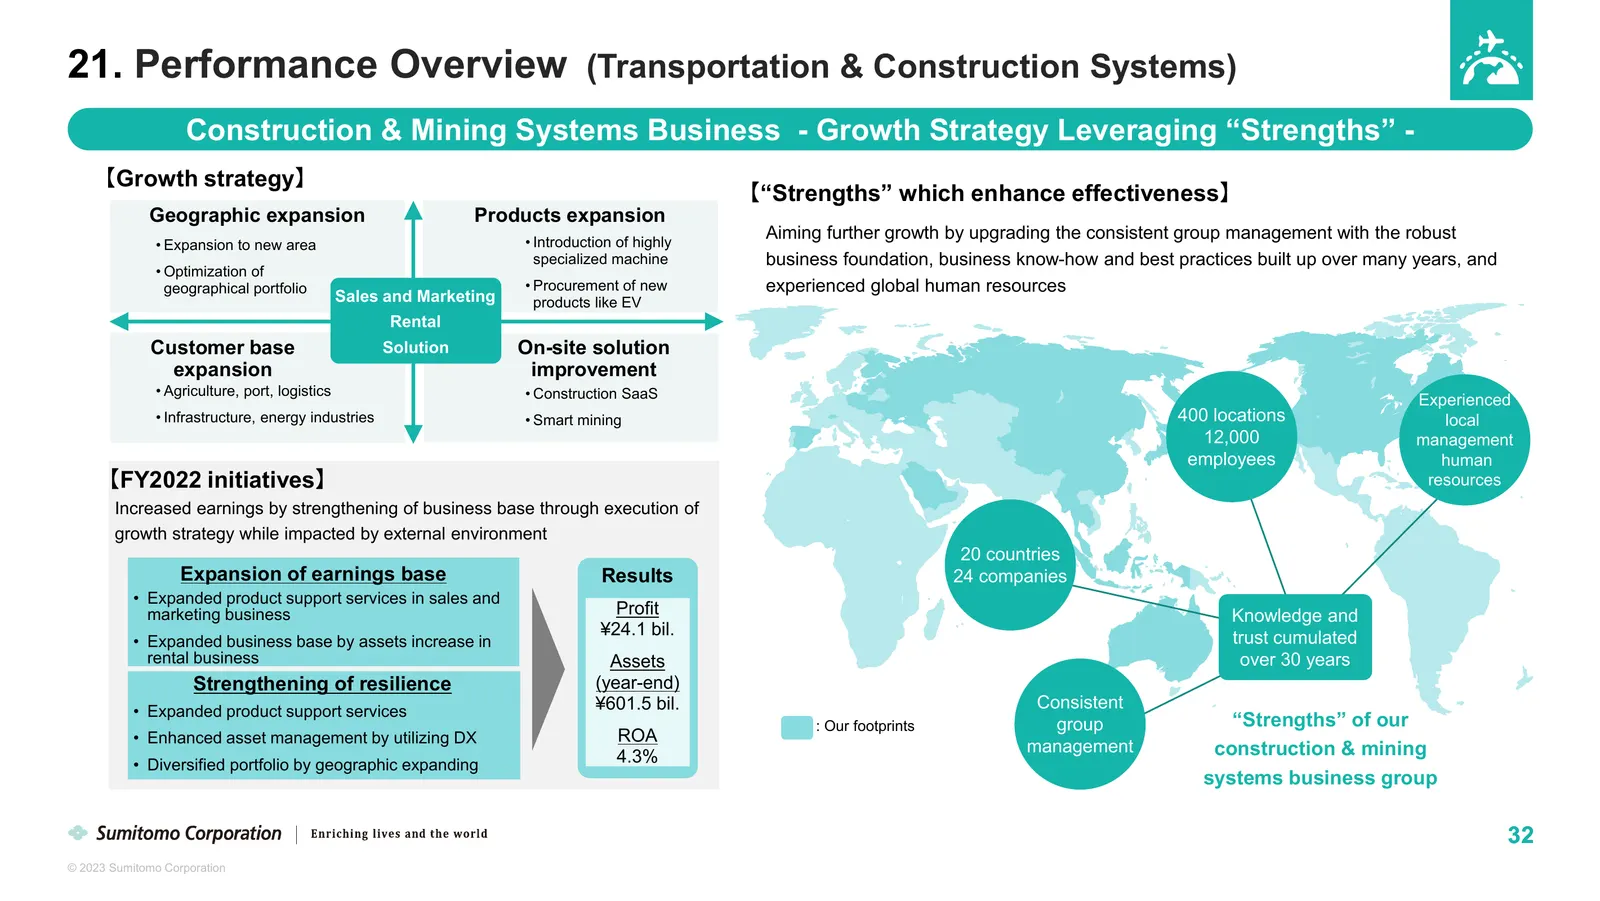
21. Performance Overview (Transportation & Construction Systems) Construction & Mining Systems Business - Growth Strategy Leveraging “Strengths” - 【Growth strategy】 【“Strengths” which enhance effectiveness】 Geographic expansion Products expansion • Introduction of highly Aiming further growth by upg
Slide 34: Performance Overview (Infrastructure)
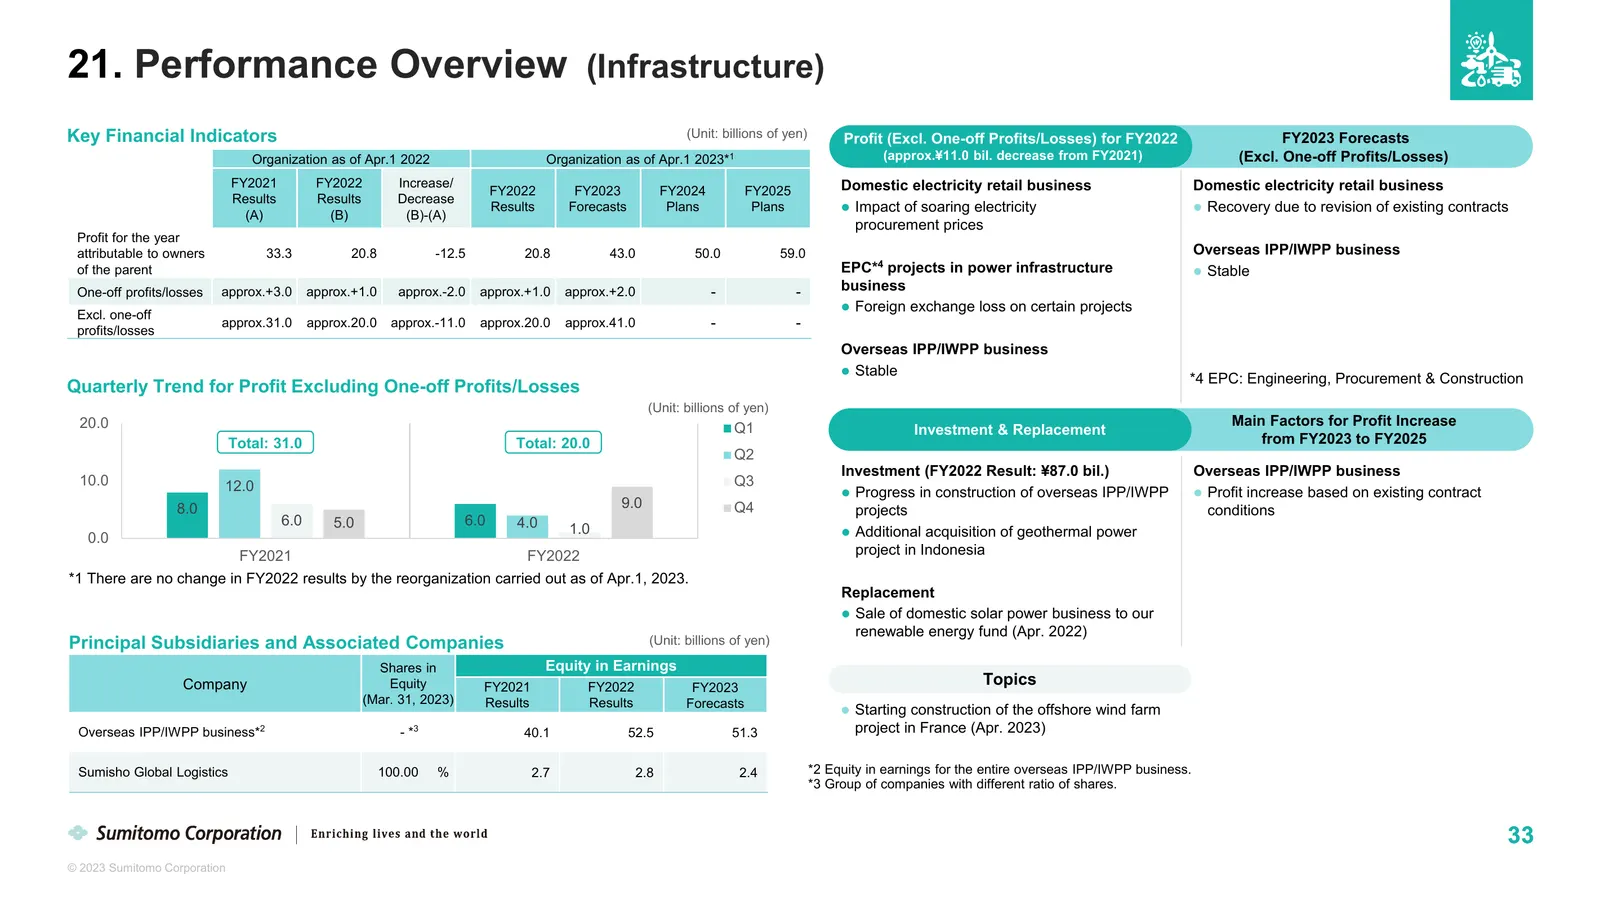
21. Performance Overview (Infrastructure) Key Financial Indicators (Unit: billions of yen) Profit (Excl. One-off Profits/Losses) for FY2022 FY2023 Forecasts Organization as of Apr.1 2022 Organization as of Apr.1 2023*1 (approx.¥11.0 bil. decrease from FY2021) (Excl. One-off Profits/Losses) FY2021 FY
Slide 35: Global Development of the Renewable Energy Business
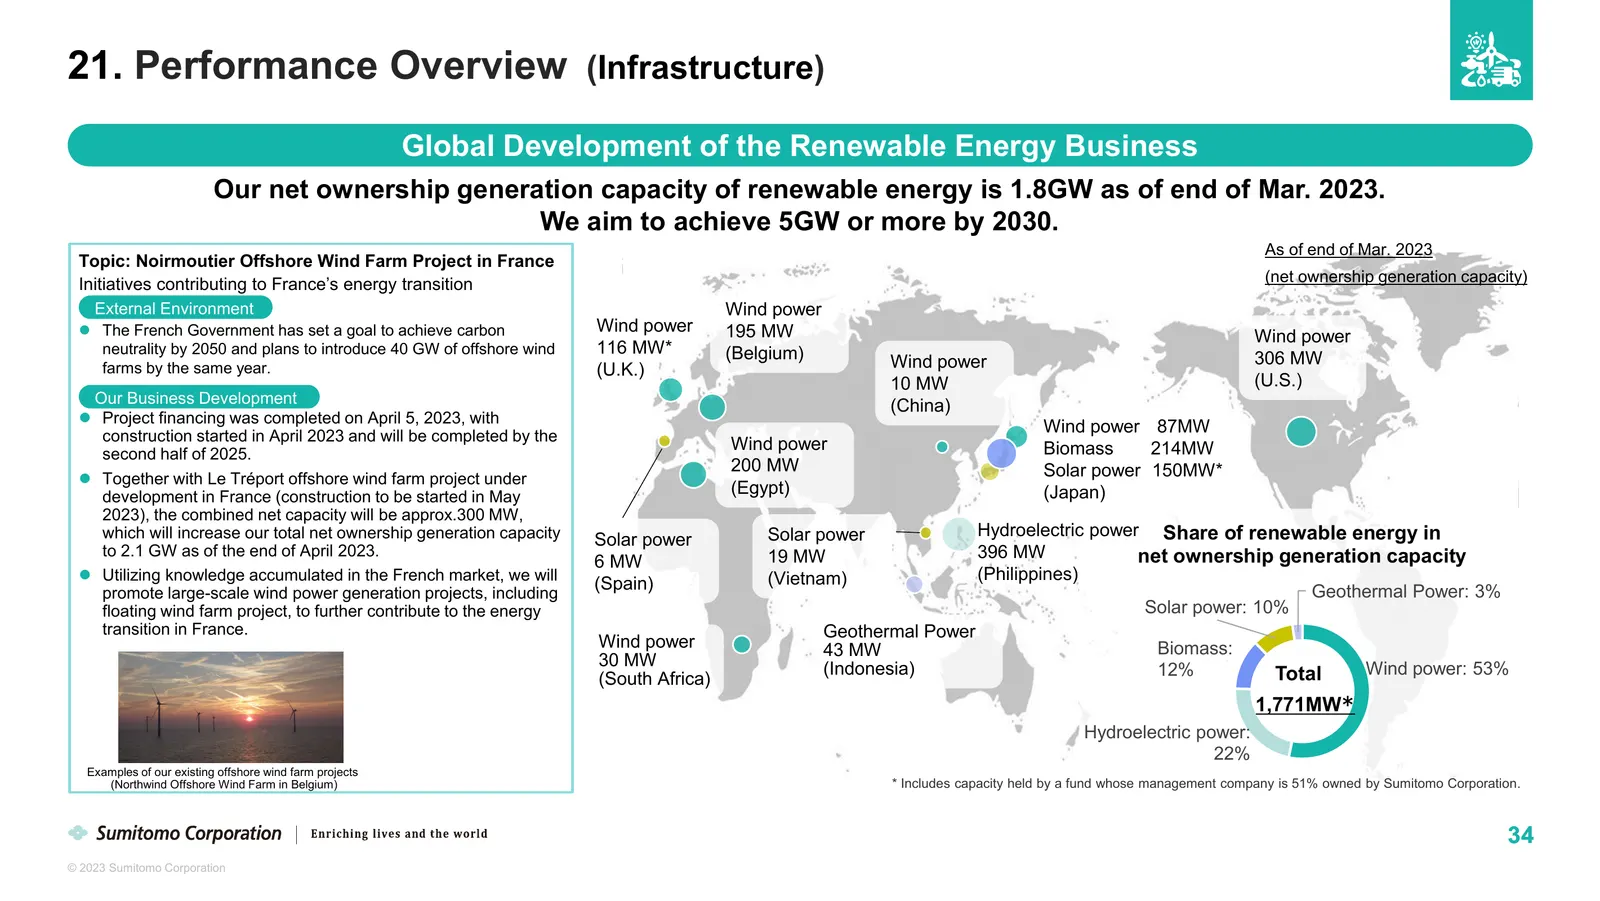
21. Performance Overview (Infrastructure) Global Development of the Renewable Energy Business Our net ownership generation capacity of renewable energy is 1.8GW as of end of Mar. 2023. We aim to achieve 5GW or more by 2030. As of end of Mar. 2023 Topic: Noirmoutier Offshore Wind Farm Project in Fran
Slide 36: Performance Overview (Media & Digital)
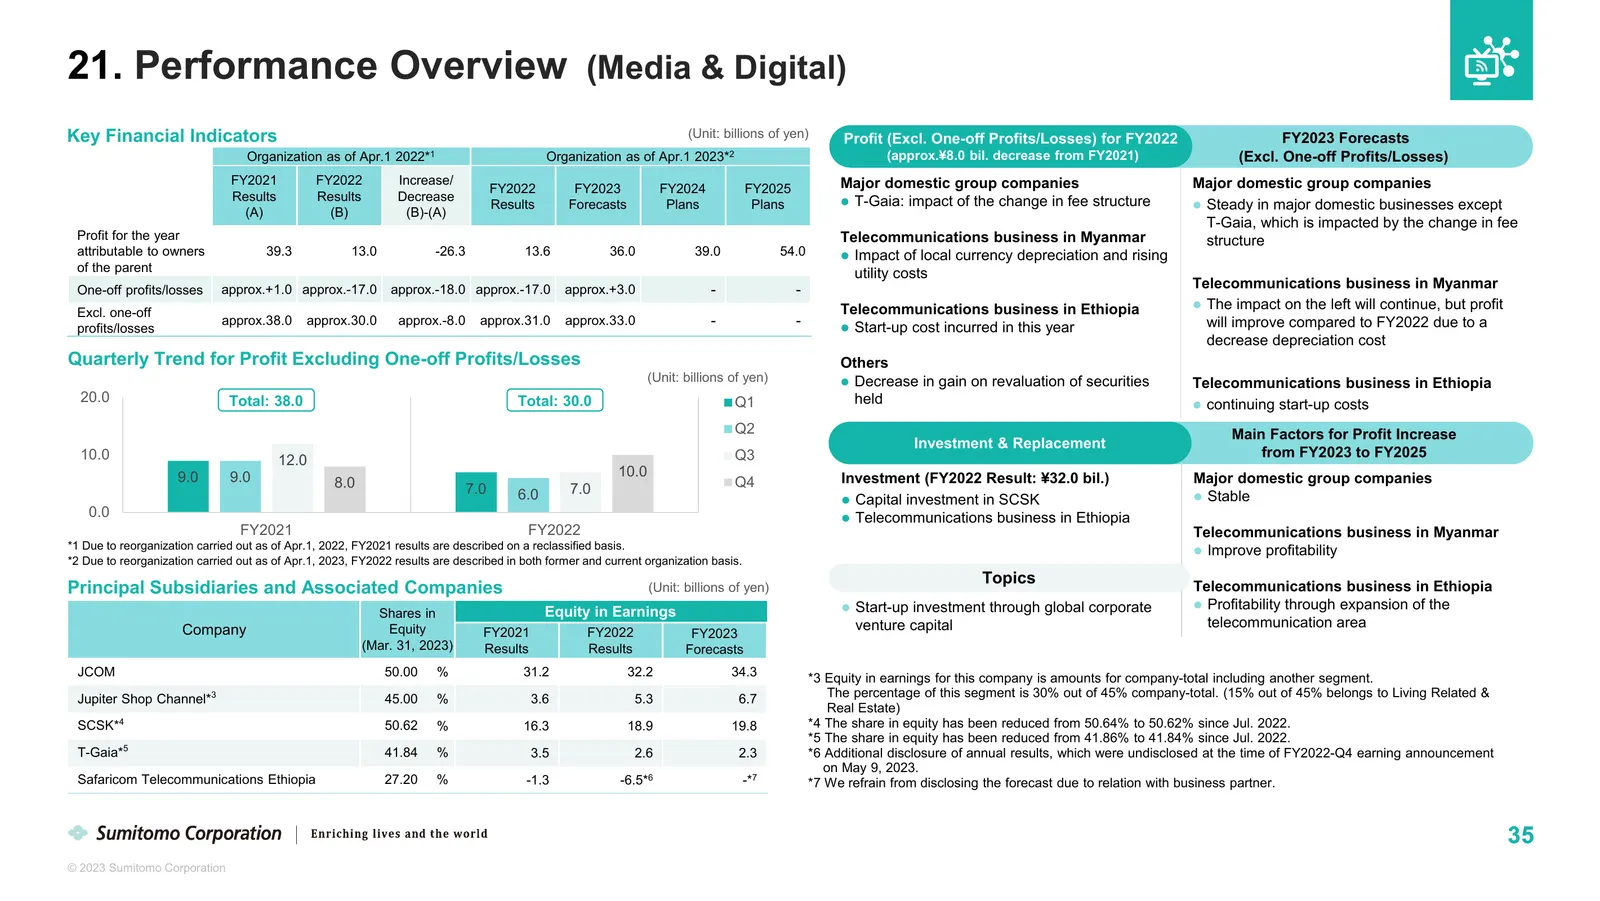
21. Performance Overview (Media & Digital) Key Financial Indicators (Unit: billions of yen) Profit (Excl. One-off Profits/Losses) for FY2022 FY2023 Forecasts Organization as of Apr.1 2022*1 Organization as of Apr.1 2023*2 (approx.¥8.0 bil. decrease from FY2021) (Excl. One-off Profits/Losses) FY2021
Slide 37: Initiatives for Telecommunications Business in Ethiopia
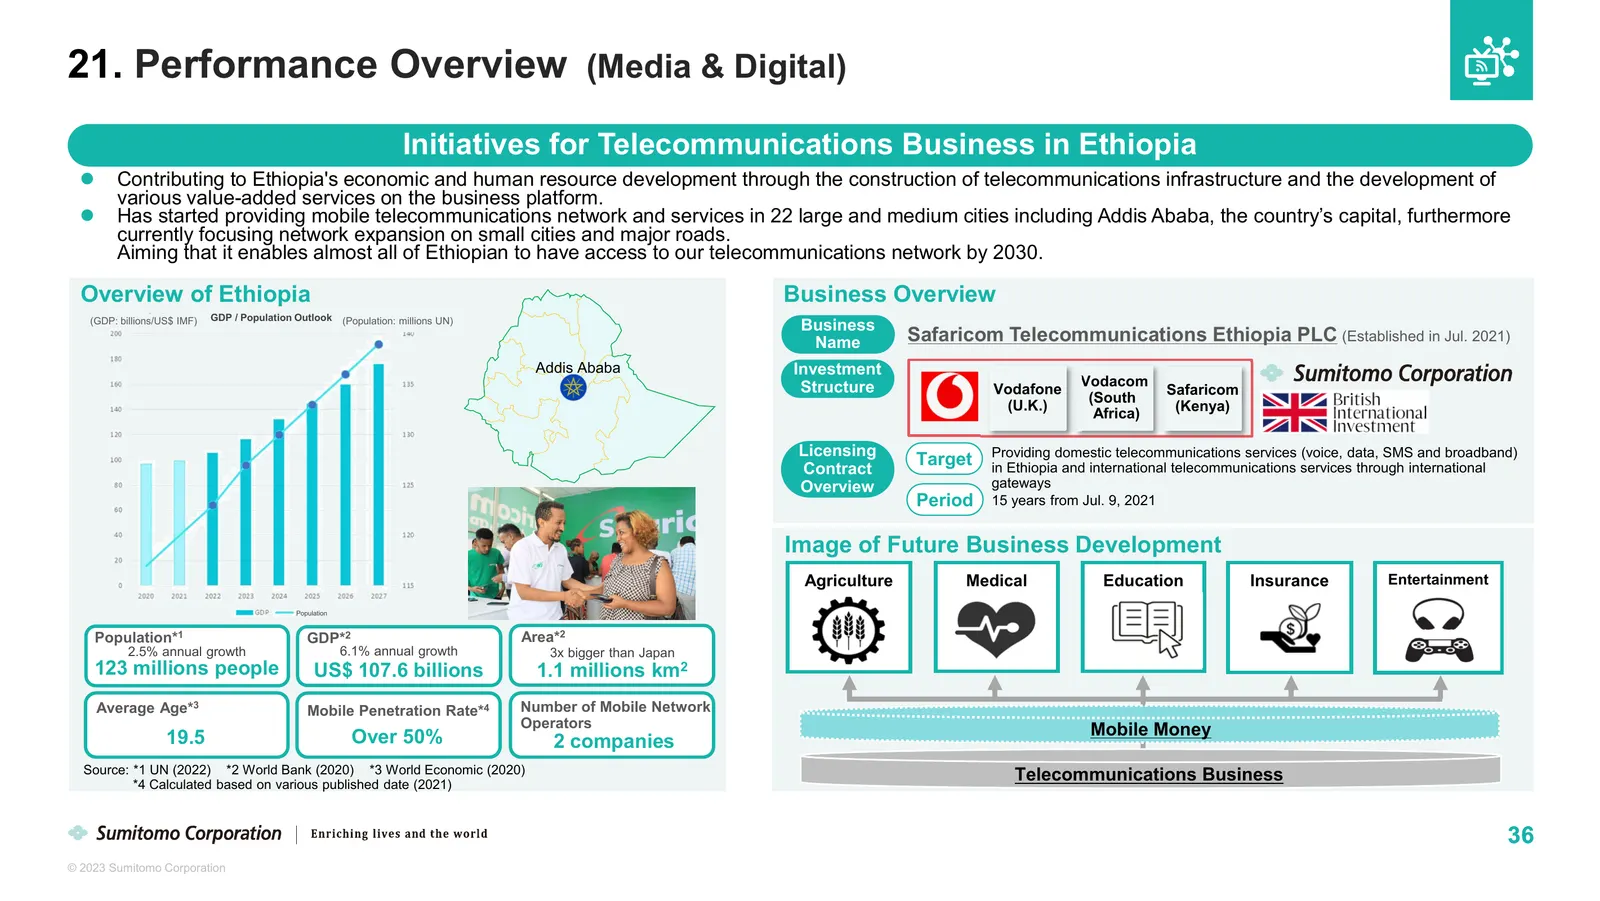
21. Performance Overview (Media & Digital) Initiatives for Telecommunications Business in Ethiopia Contributing to Ethiopia's economic and human resource development through the construction of telecommunications infrastructure and the development of various value-added services on the business pl
Slide 38: Performance Overview (Living Related & Real Estate)
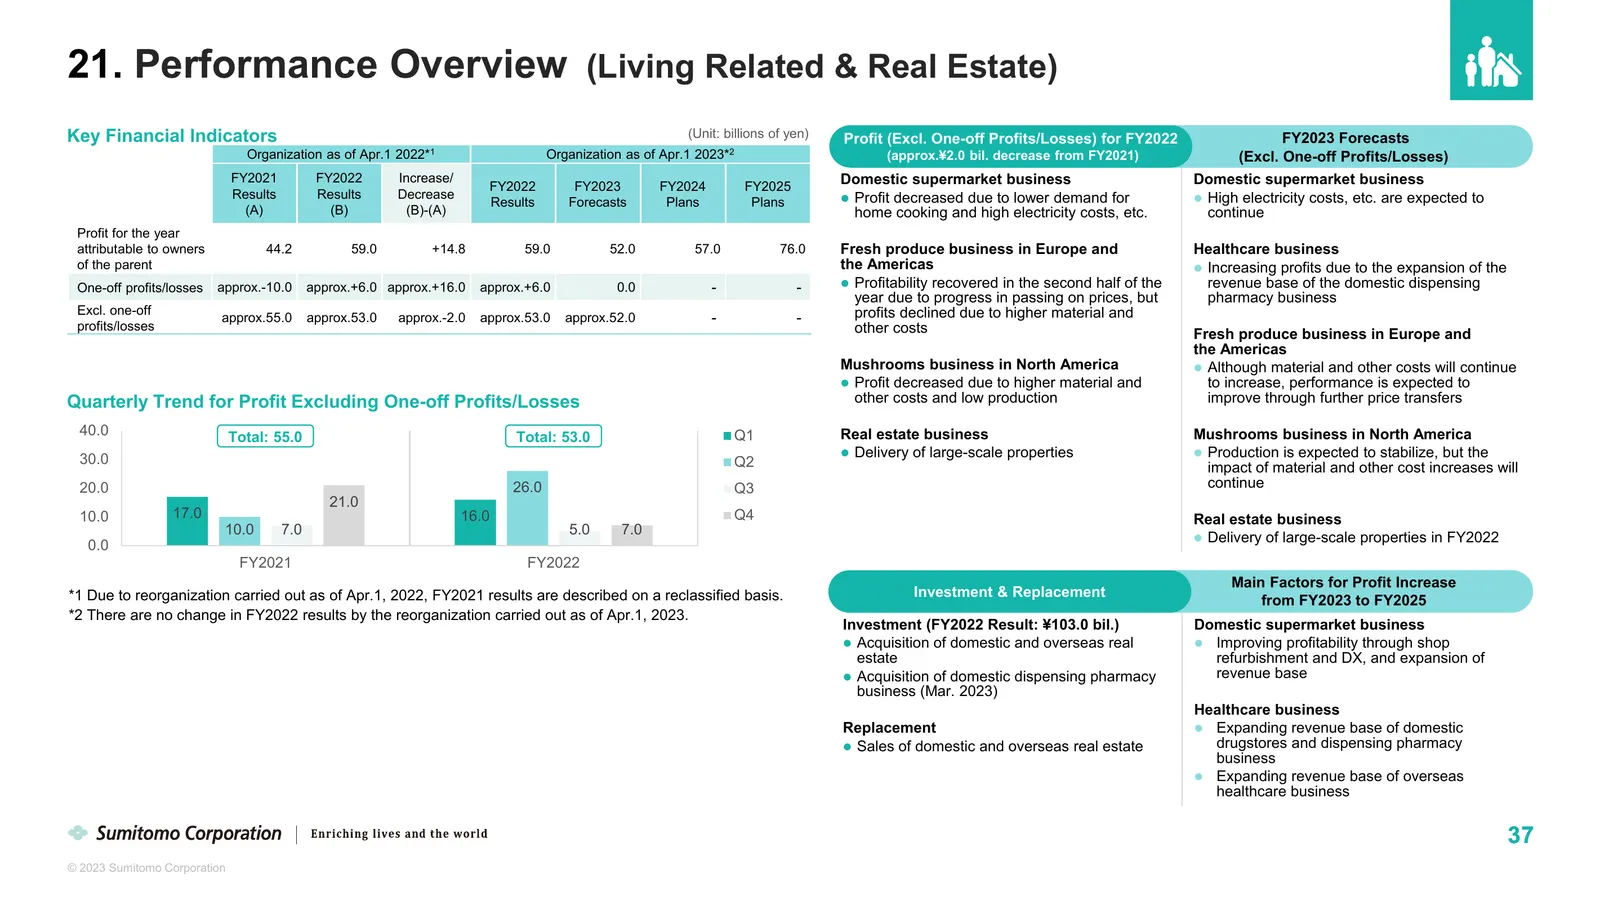
21. Performance Overview (Living Related & Real Estate) Key Financial Indicators (Unit: billions of yen) Profit (Excl. One-off Profits/Losses) for FY2022 FY2023 Forecasts Organization as of Apr.1 2022*1 Organization as of Apr.1 2023*2 (approx.¥2.0 bil. decrease from FY2021) (Excl. One-off Profits/Lo
Slide 39: Principal Subsidiaries and Associated Companies (Living Related & Real Estate)
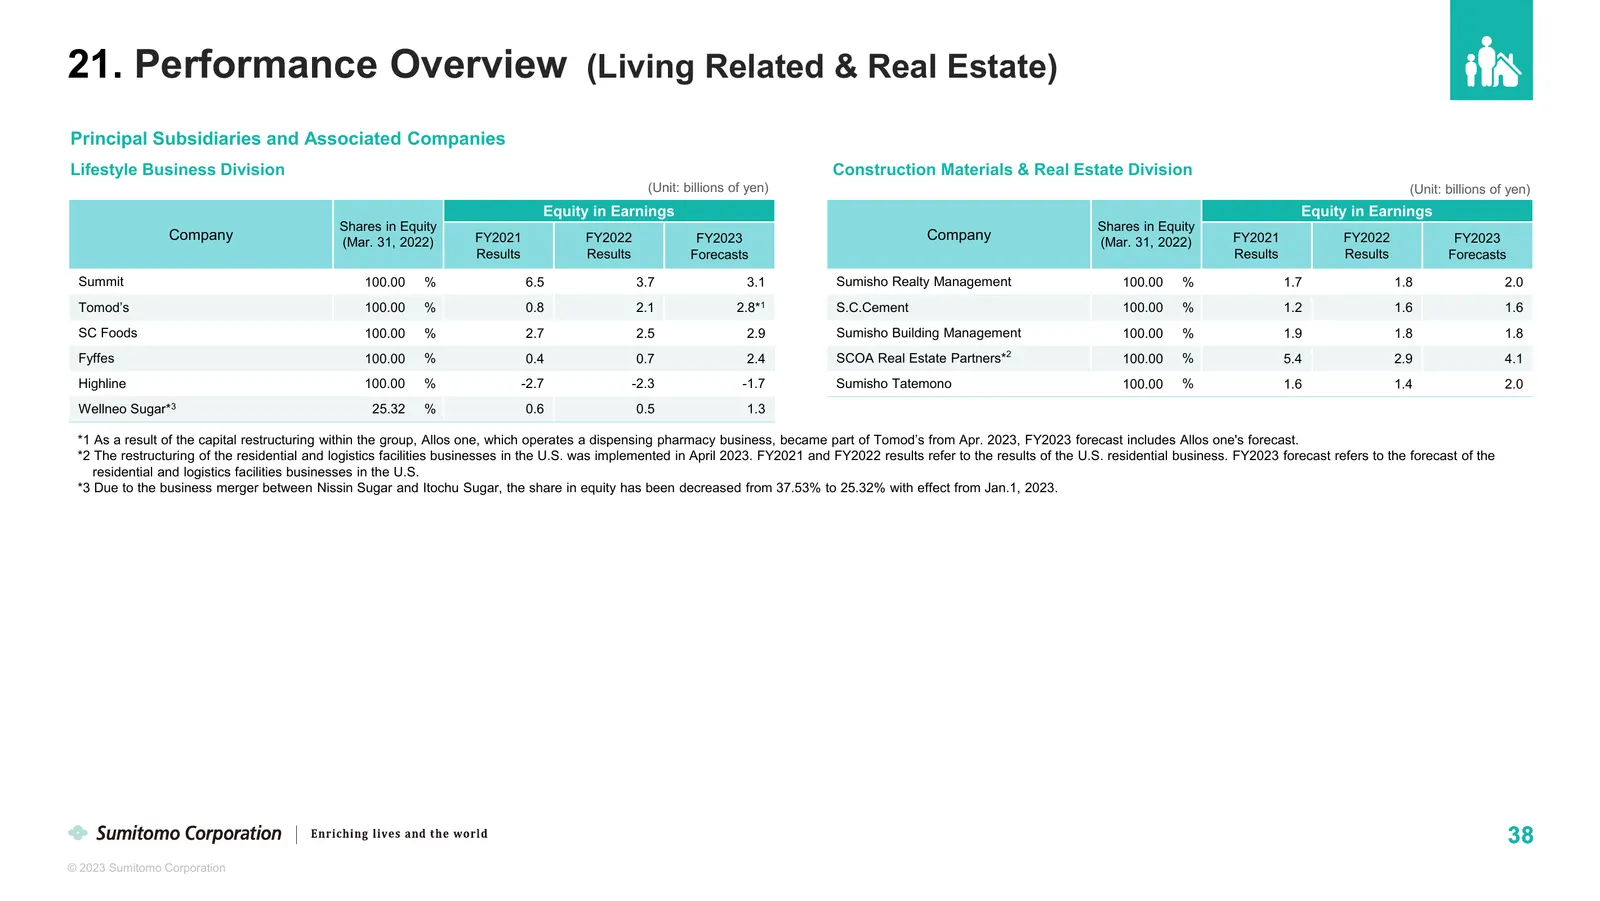
21. Performance Overview (Living Related & Real Estate) Principal Subsidiaries and Associated Companies Lifestyle Business Division Construction Materials & Real Estate Division (Unit: billions of yen) (Unit: billions of yen) Equity in Earnings Equity in Earnings Shares in Equity Shares in Equity Co
Slide 40: Performance Overview (Living Related & Real Estate)
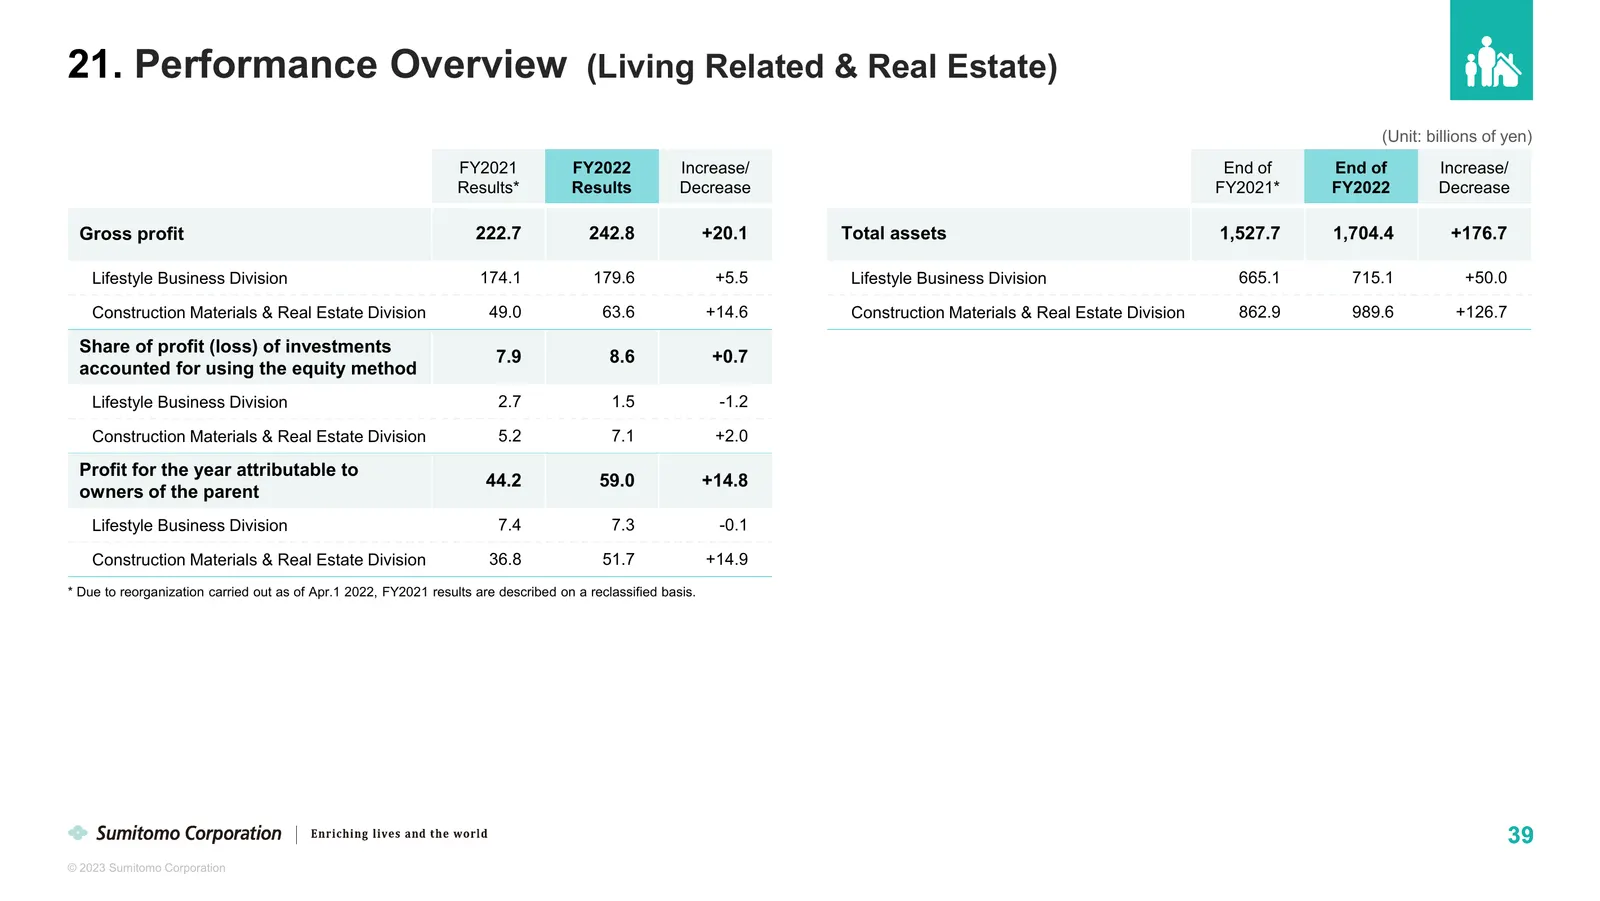
21. Performance Overview (Living Related & Real Estate) (Unit: billions of yen) FY2021 FY2022 Increase/ End of End of Increase/ Results* Results Decrease FY2021* FY2022 Decrease Gross profit 222.7 242.8 +20.1 Total assets 1,527.7 1,704.4 +176.7 Lifestyle Business Division 174.1 179.6 +5.5 Lifestyle
Slide 41: Materials & Cement Business: Solid Business Foundation
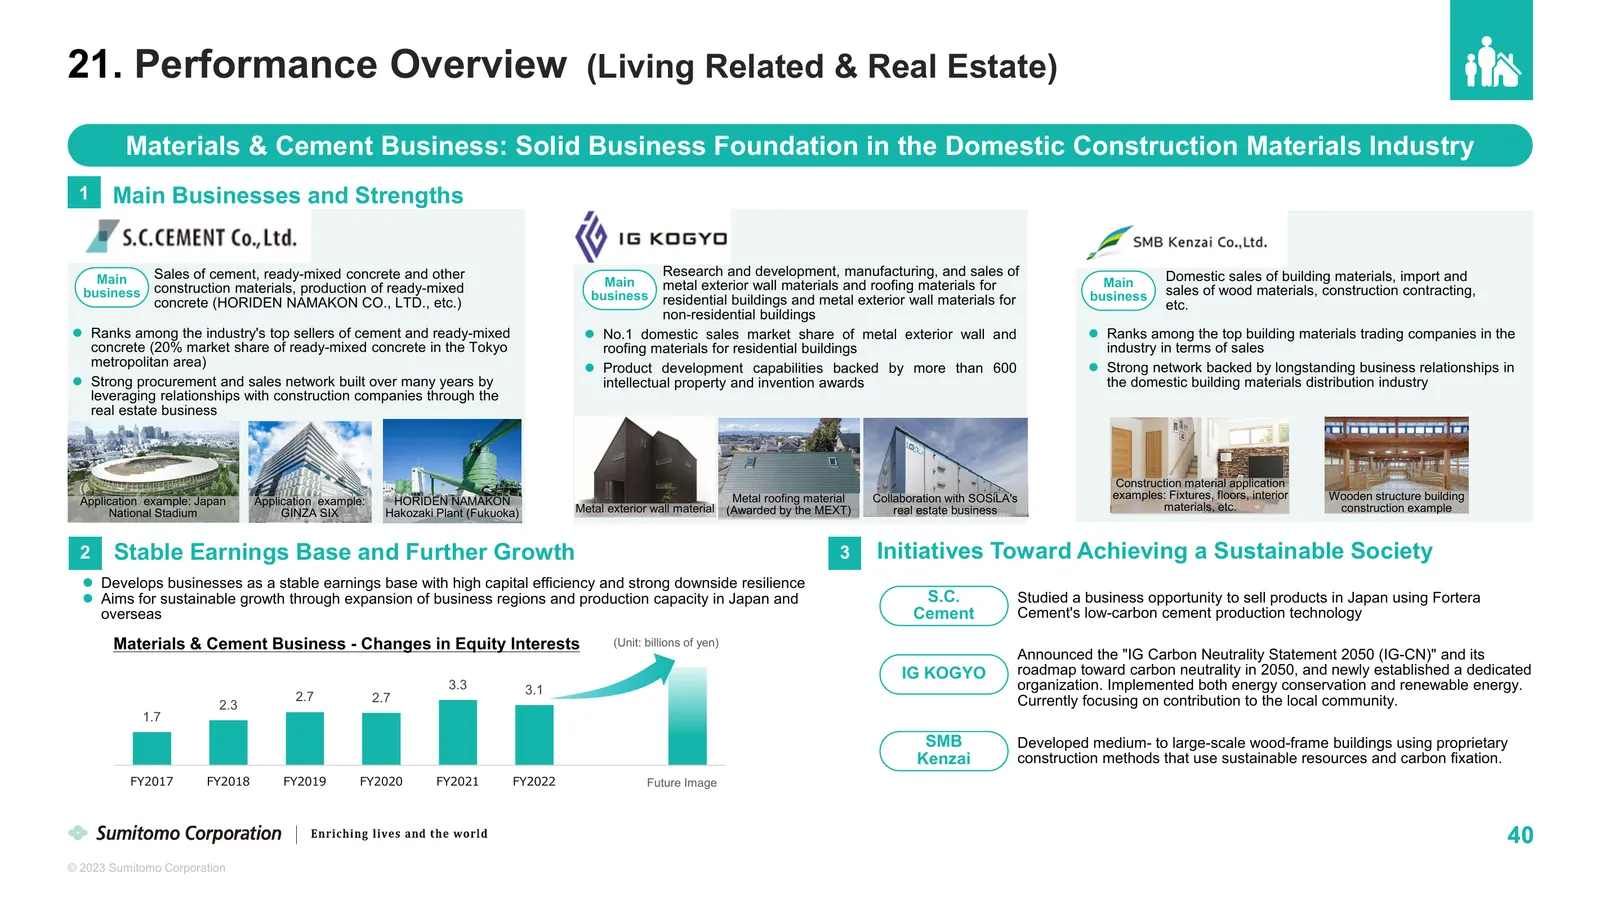
21. Performance Overview (Living Related & Real Estate) Materials & Cement Business: Solid Business Foundation in the Domestic Construction Materials Industry 1 Main Businesses and Strengths Sales of cement, ready-mixed concrete and other Research and development, manufacturing, and sales of Domesti
Slide 42: Performance Overview (Mineral Resources, Energy, Chemical & Electronics)
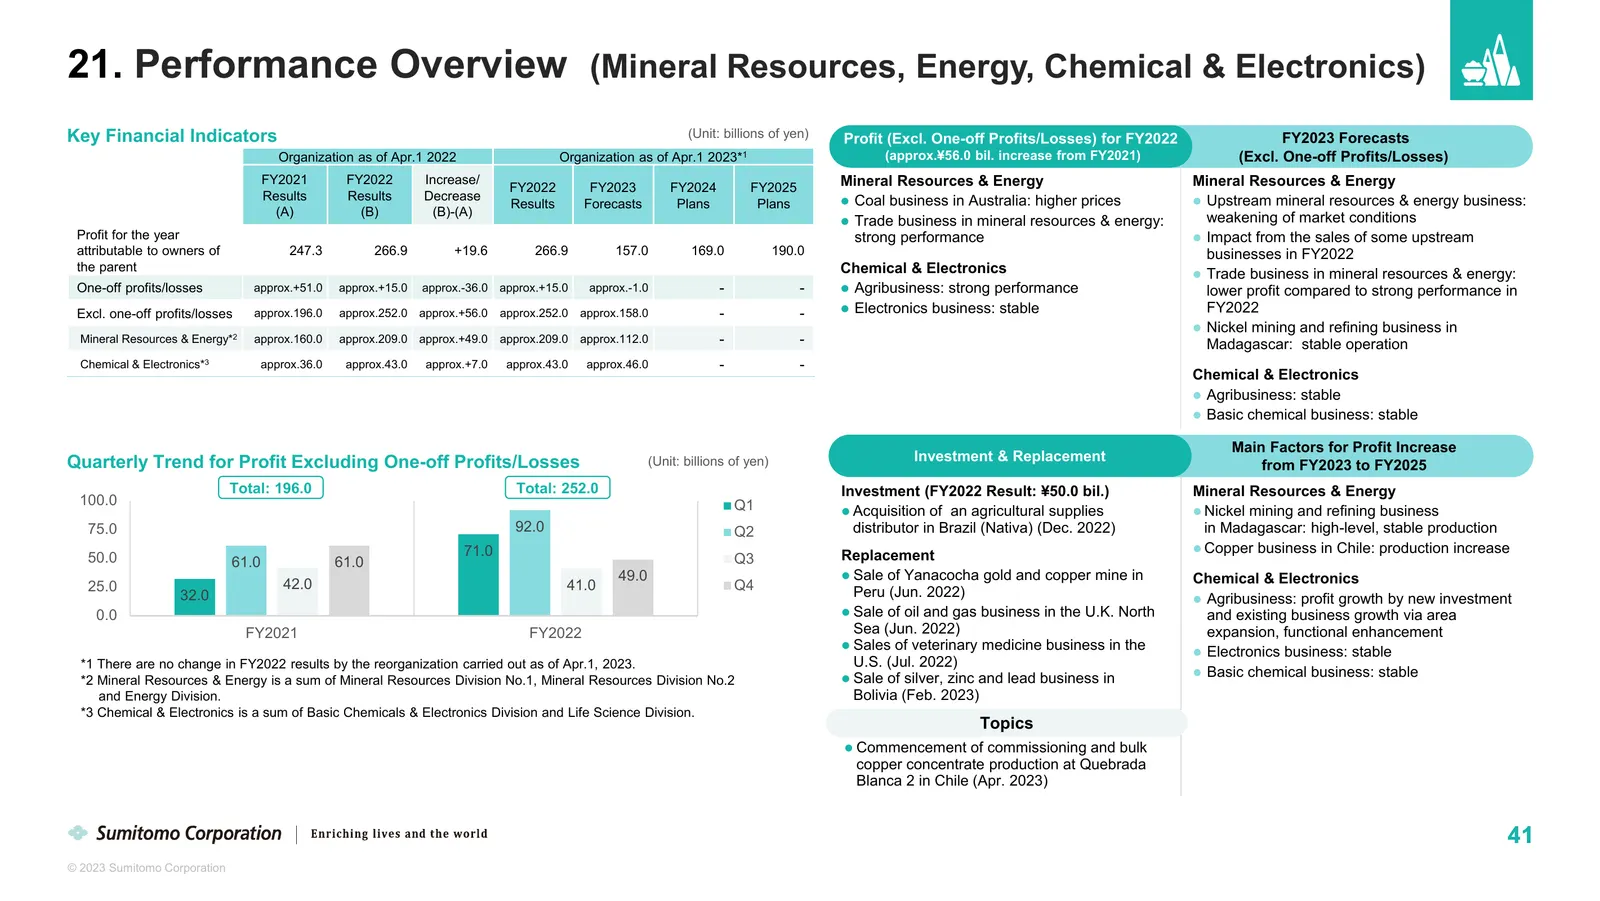
21. Performance Overview (Mineral Resources, Energy, Chemical & Electronics) Key Financial Indicators (Unit: billions of yen) Profit (Excl. One-off Profits/Losses) for FY2022 FY2023 Forecasts Organization as of Apr.1 2022 Organization as of Apr.1 2023*1 (approx.¥56.0 bil. increase from FY2021) (Excl
Slide 43: Principal Subsidiaries and Associated Companies (Mineral Resources, Energy, Chemical & Electronics)
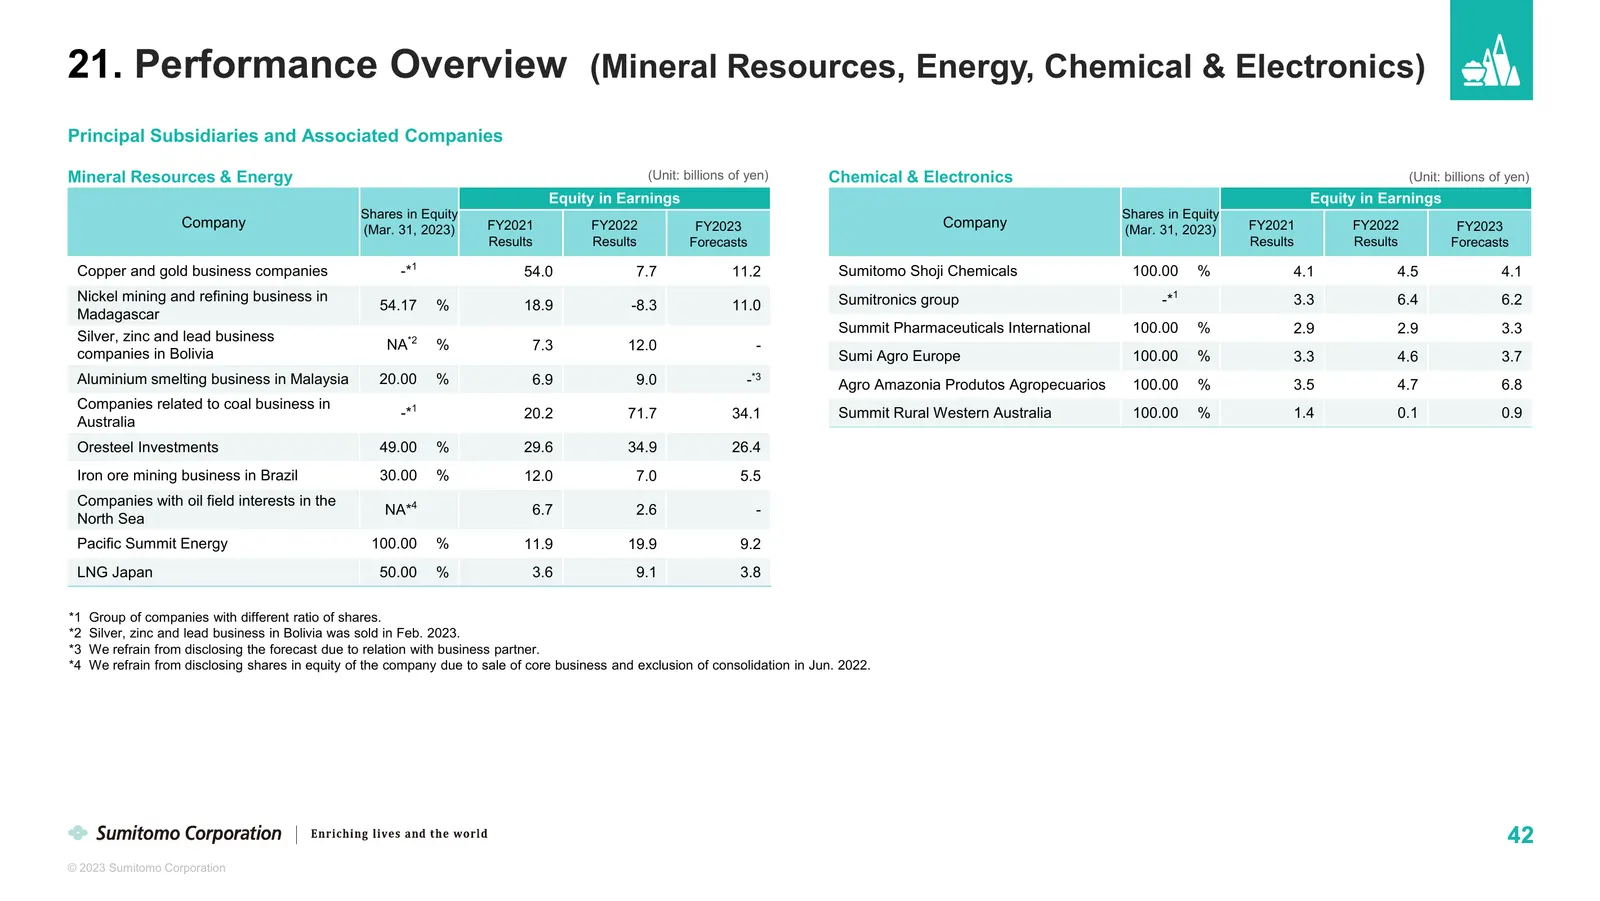
21. Performance Overview (Mineral Resources, Energy, Chemical & Electronics) Principal Subsidiaries and Associated Companies Mineral Resources & Energy (Unit: billions of yen) Chemical & Electronics (Unit: billions of yen) Equity in Earnings Equity in Earnings Shares in Equity Shares in Equity Compa
Slide 44: Performance Overview (Mineral Resources, Energy, Chemical & Electronics)
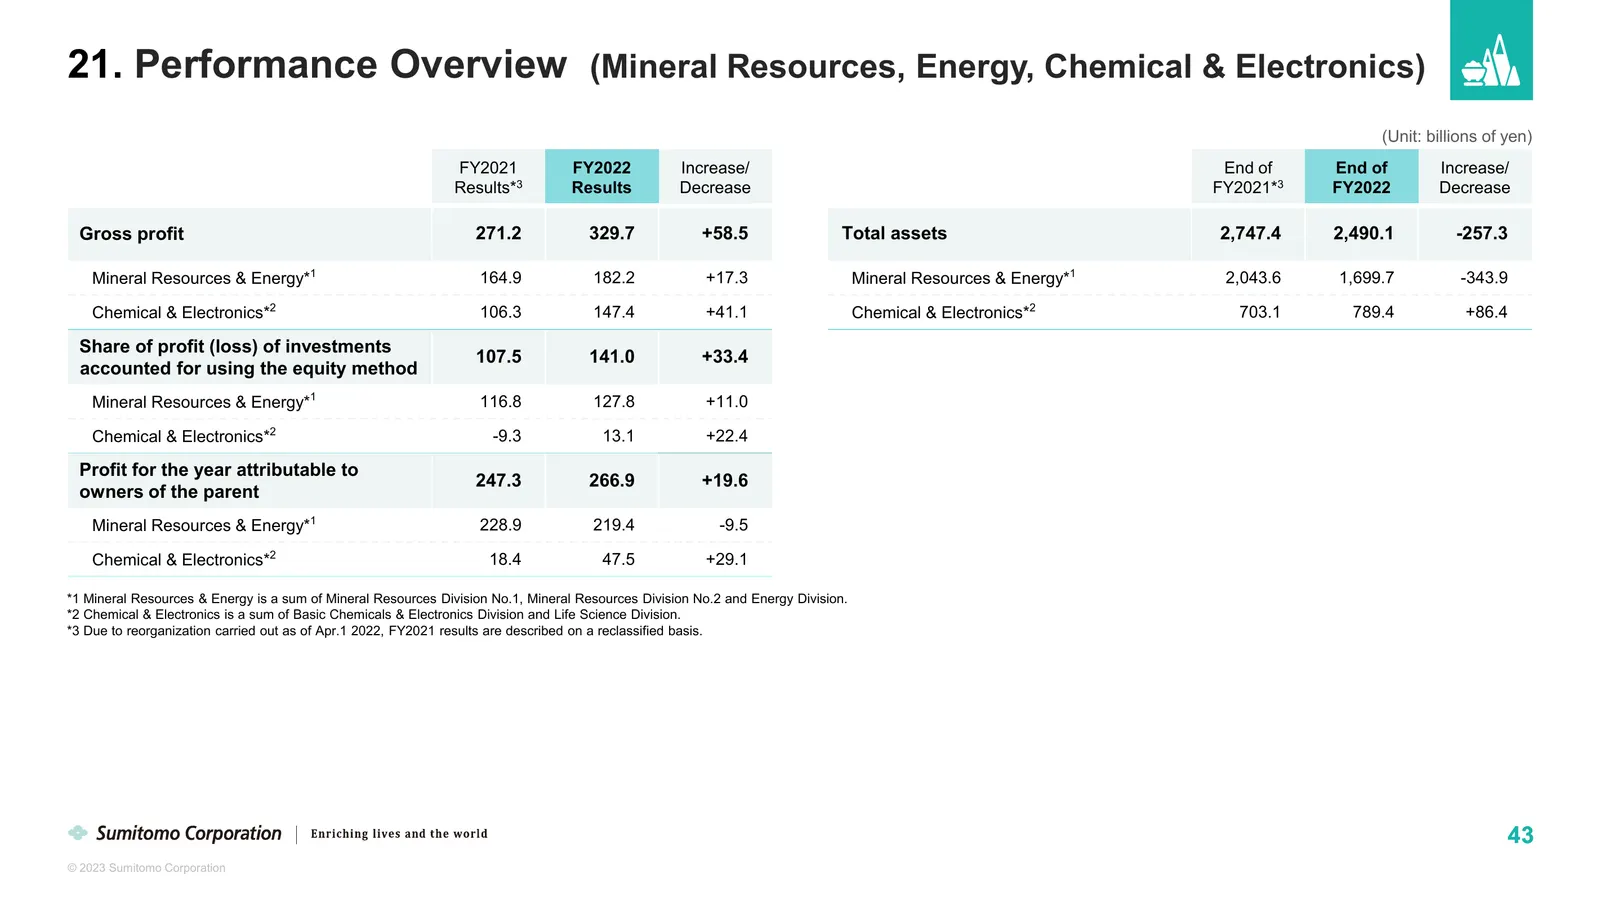
21. Performance Overview (Mineral Resources, Energy, Chemical & Electronics) (Unit: billions of yen) FY2021 FY2022 Increase/ End of End of Increase/ Results*3 Results Decrease FY2021*3 FY2022 Decrease Gross profit 271.2 329.7 +58.5 Total assets 2,747.4 2,490.1 -257.3 Mineral Resources & Energy*1 164
Slide 45: Ambatovy Nickel Project
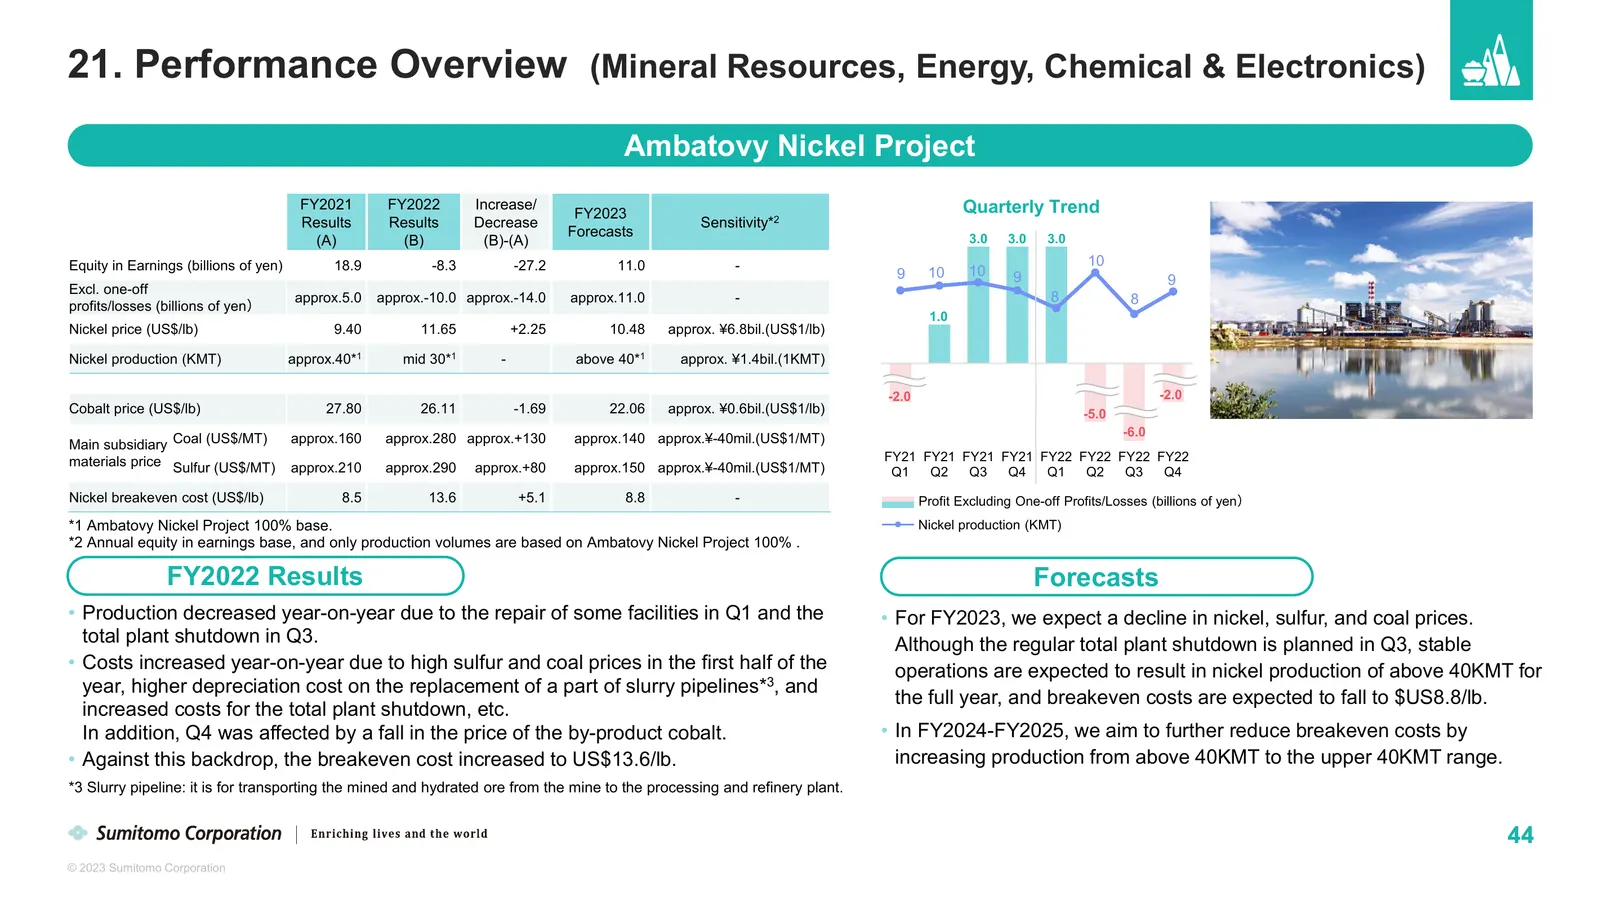
21. Performance Overview (Mineral Resources, Energy, Chemical & Electronics) Ambatovy Nickel Project FY2021 FY2022 Increase/ Quarterly Trend FY2023 Results Results Decrease Sensitivity*2 Forecasts 3.0 3.0 3.0 (A) (B) (B)-(A) 30 12 Equity in Earnings (billions of yen) 18.9 -8.3 -27.2 11.0 - 25 10 9 1
Slide 46: Agribusiness as the Driver of Growth
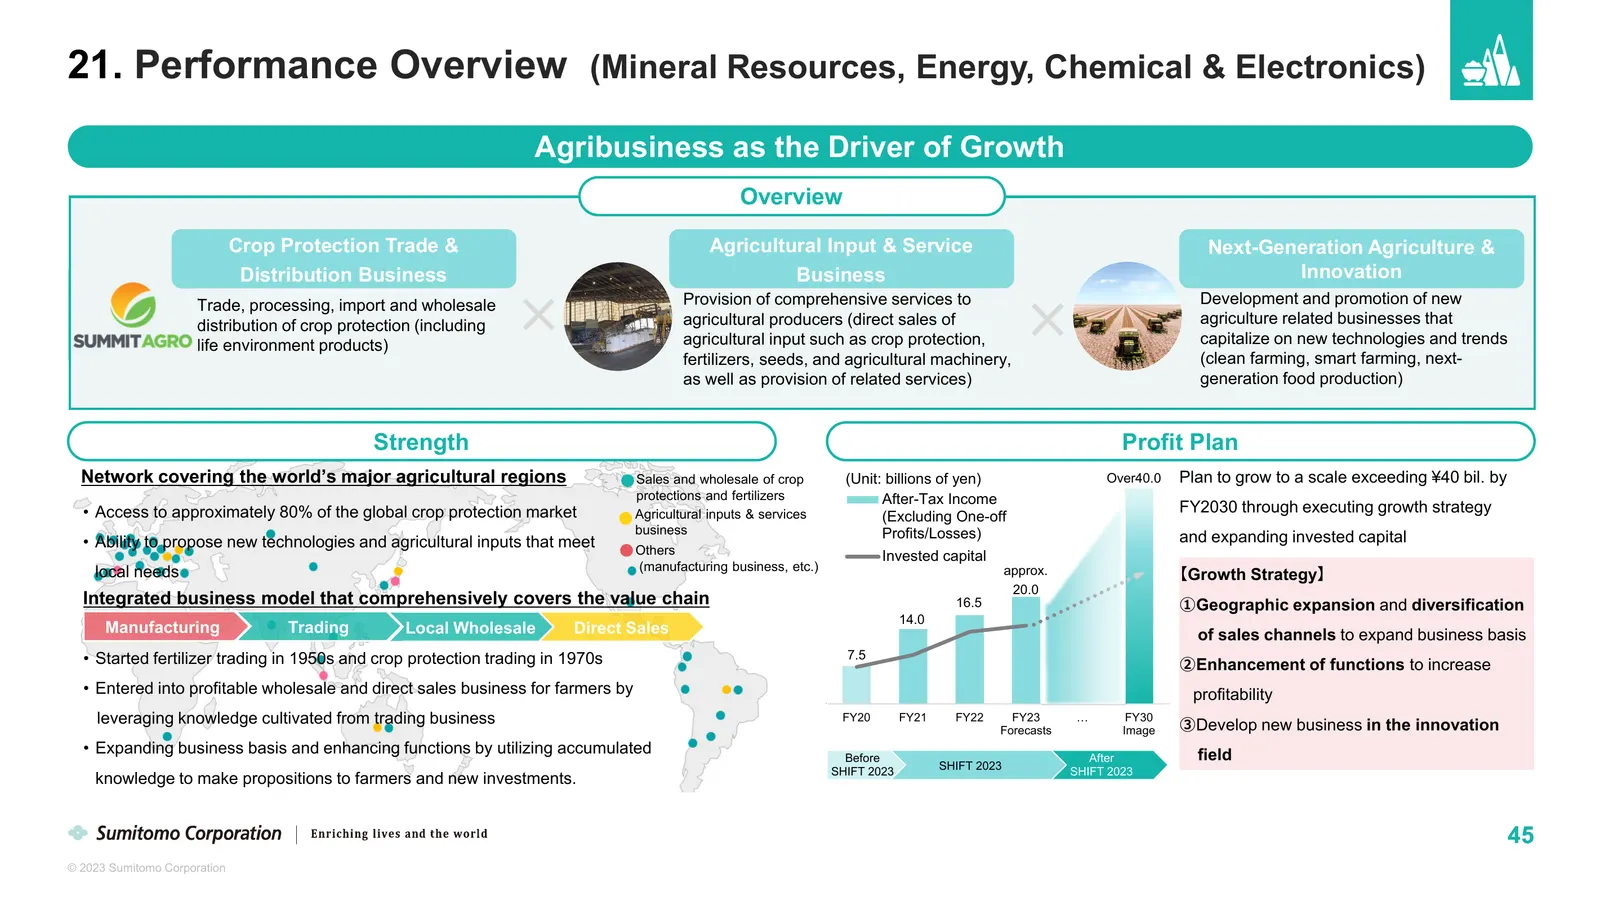
21. Performance Overview (Mineral Resources, Energy, Chemical & Electronics) Agribusiness as the Driver of Growth Overview Crop Protection Trade & Agricultural Input & Service Next-Generation Agriculture & Distribution Business Business Innovation Trade, processing, import and wholesale Provision of
Slide 47: Exposure of Upstream Mineral Resources & Energy Business
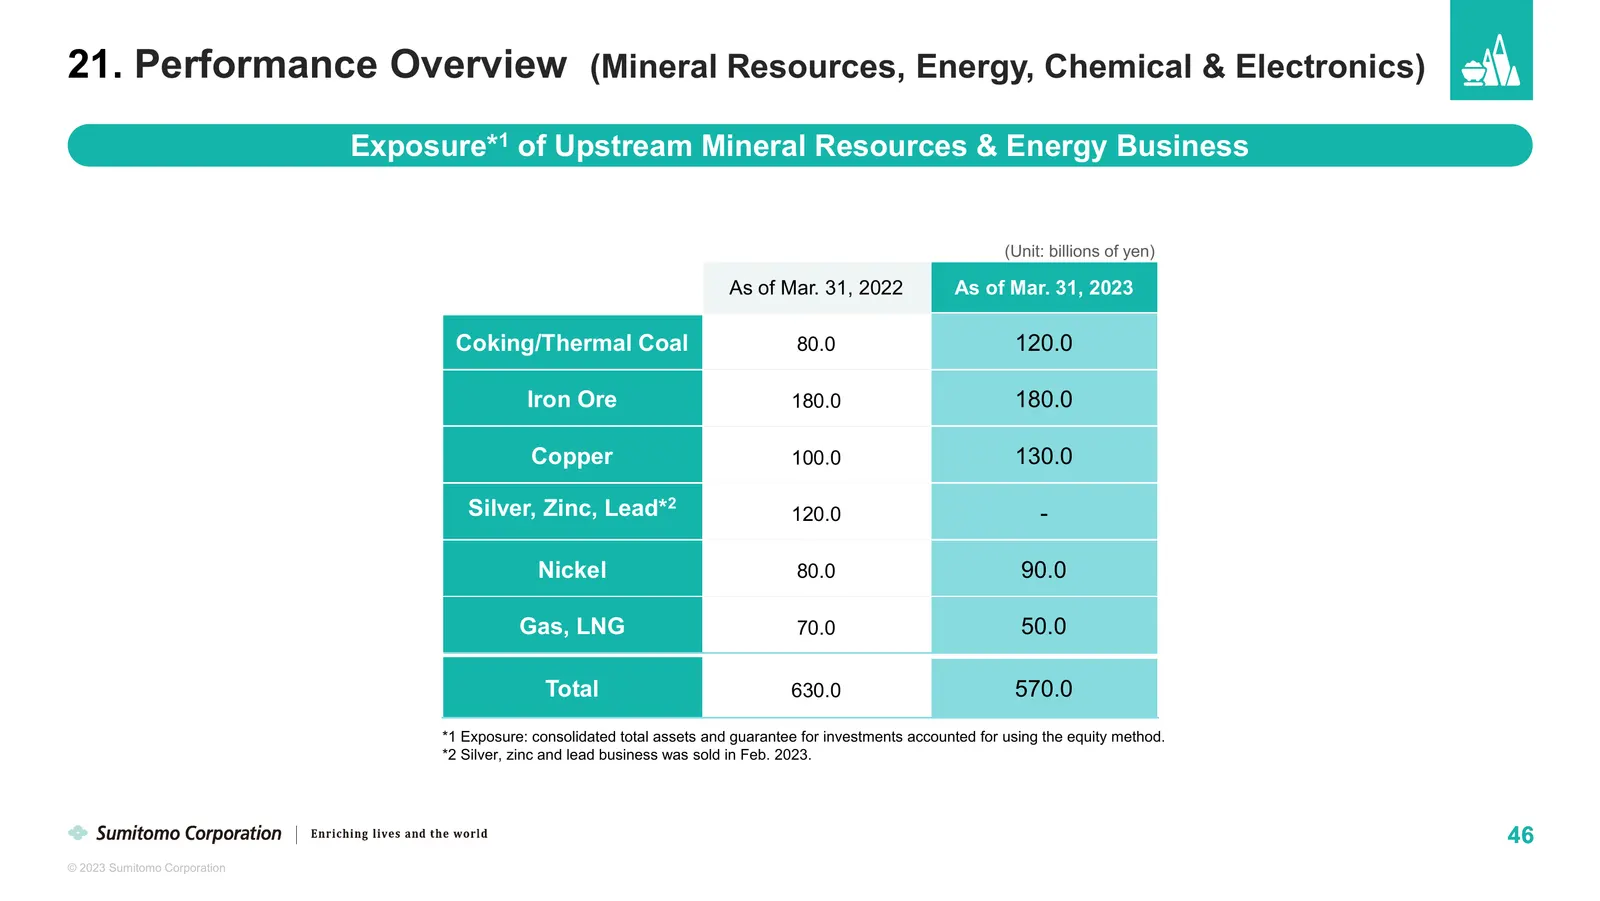
21. Performance Overview (Mineral Resources, Energy, Chemical & Electronics) Exposure*1 of Upstream Mineral Resources & Energy Business (Unit: billions of yen) As of Mar. 31, 2022 As of Mar. 31, 2023 Coking/Thermal Coal 80.0 120.0 Iron Ore 180.0 180.0 Copper 100.0 130.0 Silver, Zinc, Lead*2 120.0 -
Slide 48: Summary of Consolidated Statements of Comprehensive Income
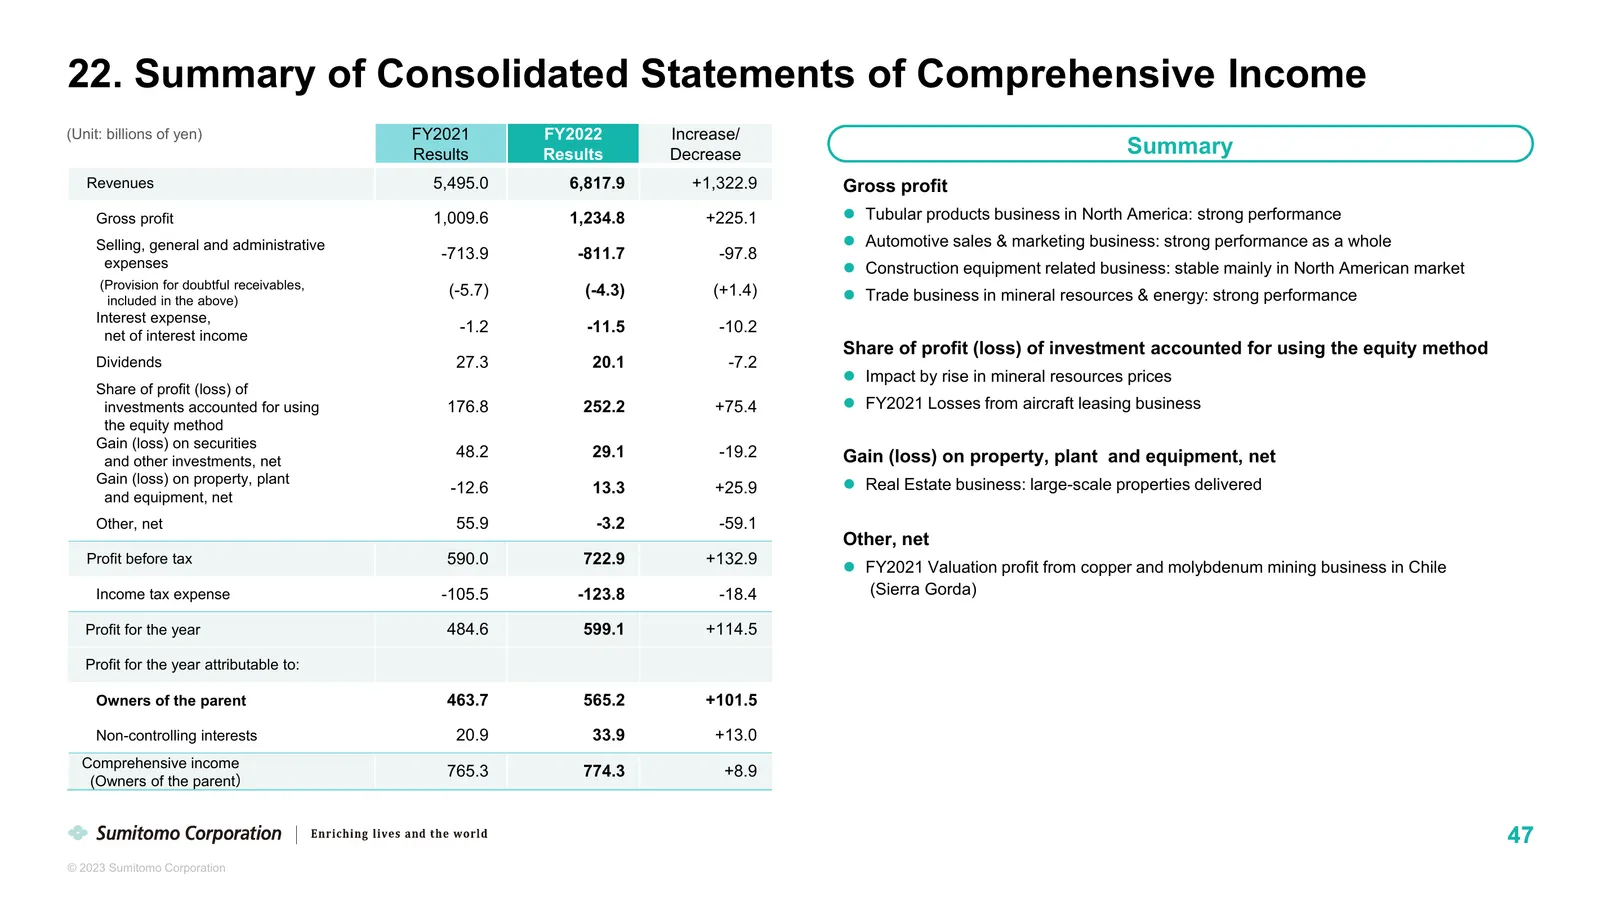
22. Summary of Consolidated Statements of Comprehensive Income (Unit: billions of yen) FY2021 FY2022 Increase/ Results Results Decrease Summary Revenues 5,495.0 6,817.9 +1,322.9 Gross profit Gross profit 1,009.6 1,234.8 +225.1 Tubular products business in North America: strong performance Selling,
Slide 49: Summary of Consolidated Statements of Cash Flows
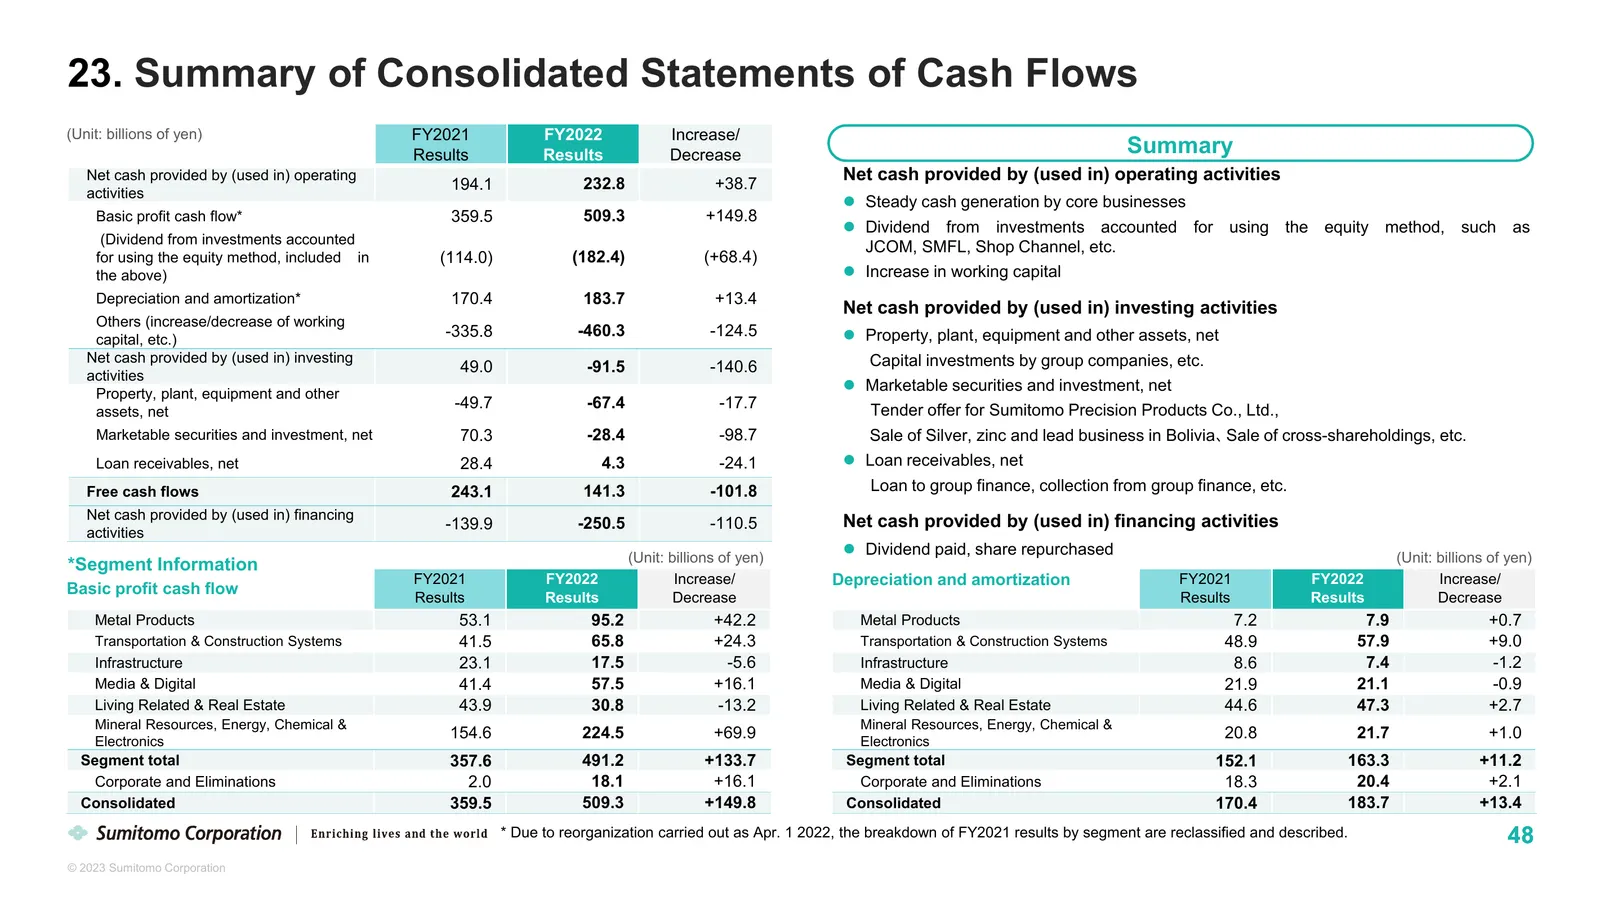
23. Summary of Consolidated Statements of Cash Flows (Unit: billions of yen) FY2021 FY2022 Increase/ Results Results Decrease Summary Net cash provided by (used in) operating Net cash provided by (used in) operating activities 194.1 232.8 +38.7 activities Steady cash generation by core businesses
Slide 50: Summary of Consolidated Statements of Financial Position
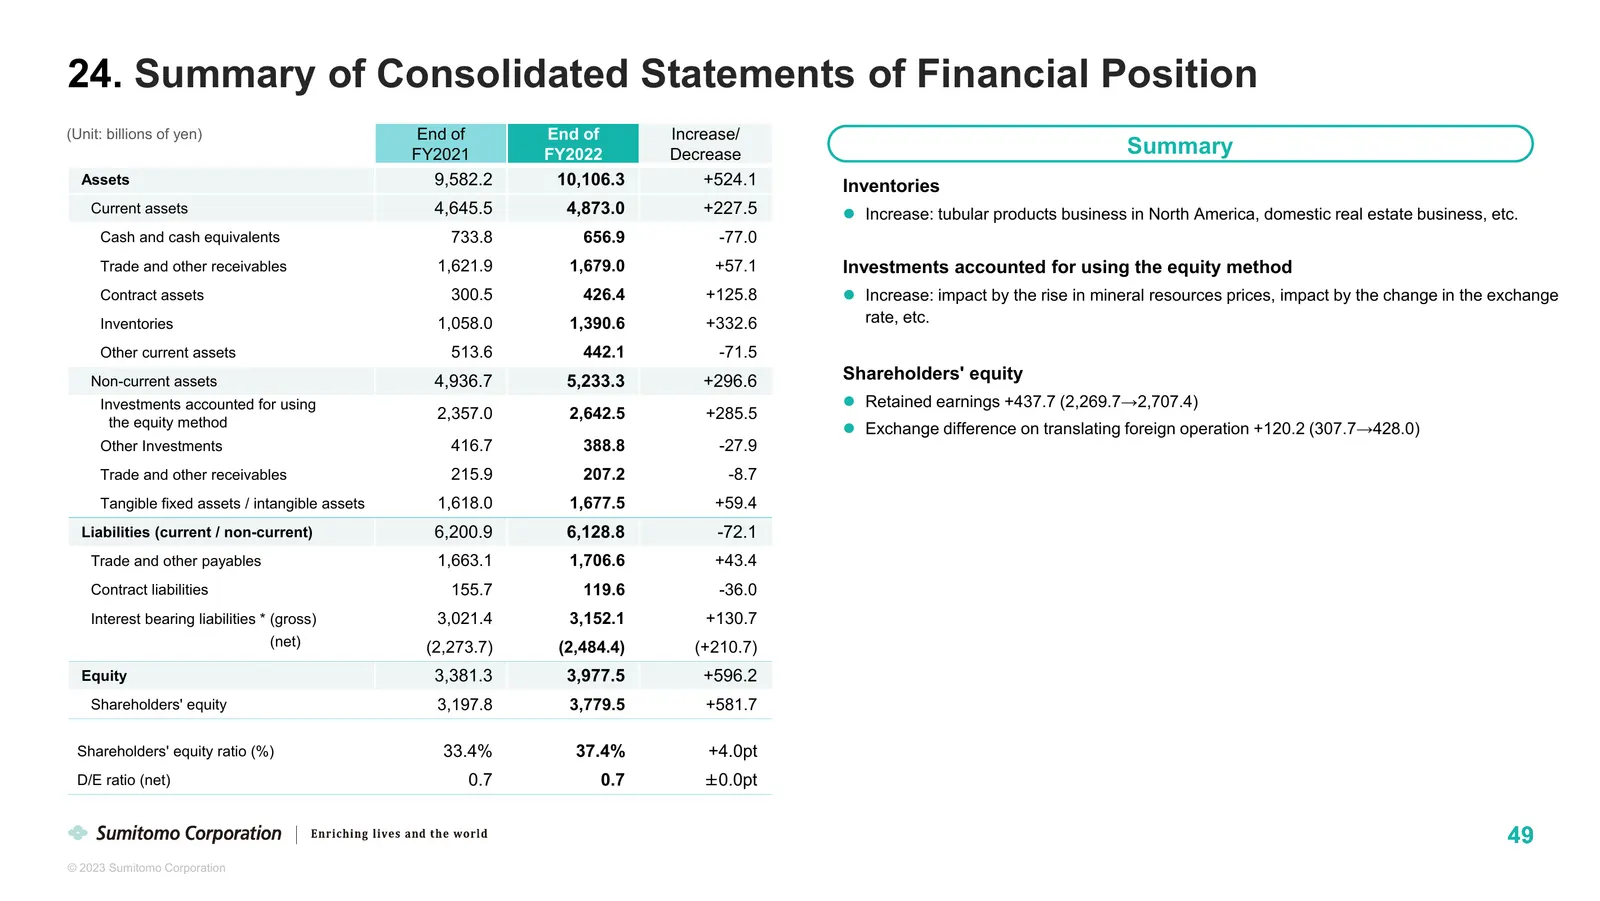
24. Summary of Consolidated Statements of Financial Position (Unit: billions of yen) End of End of Increase/ FY2021 FY2022 Decrease Summary Assets 9,582.2 10,106.3 +524.1 Inventories Current assets 4,645.5 4,873.0 +227.5 Increase: tubular products business in North America, domestic real estate bu
Slide 51: Historical Data (PL, CF)
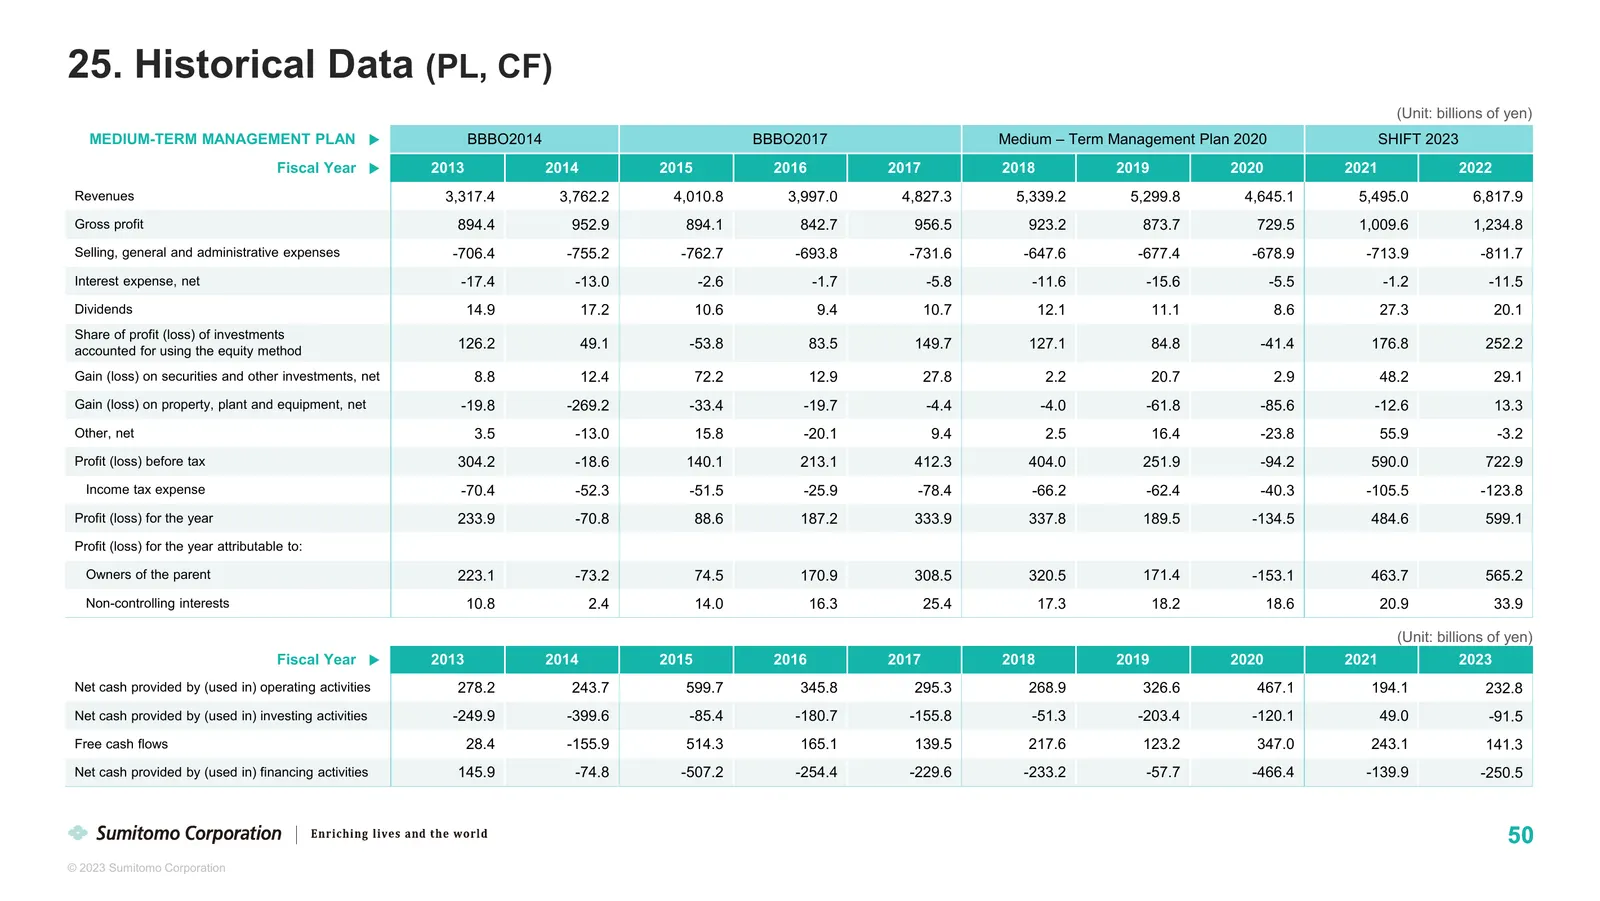
25. Historical Data (PL, CF) (Unit: billions of yen) MEDIUM-TERM MANAGEMENT PLAN ▶ BBBO2014 BBBO2017 Medium – Term Management Plan 2020 SHIFT 2023 Fiscal Year ▶ 2013 2014 2015 2016 2017 2018 2019 2020 2021 2022 Revenues 3,317.4 3,762.2 4,010.8 3,997.0 4,827.3 5,339.2 5,299.8 4,645.1 5,495.0 6,817.9
Slide 52: Historical Data (BS, Key Financial Indicators)
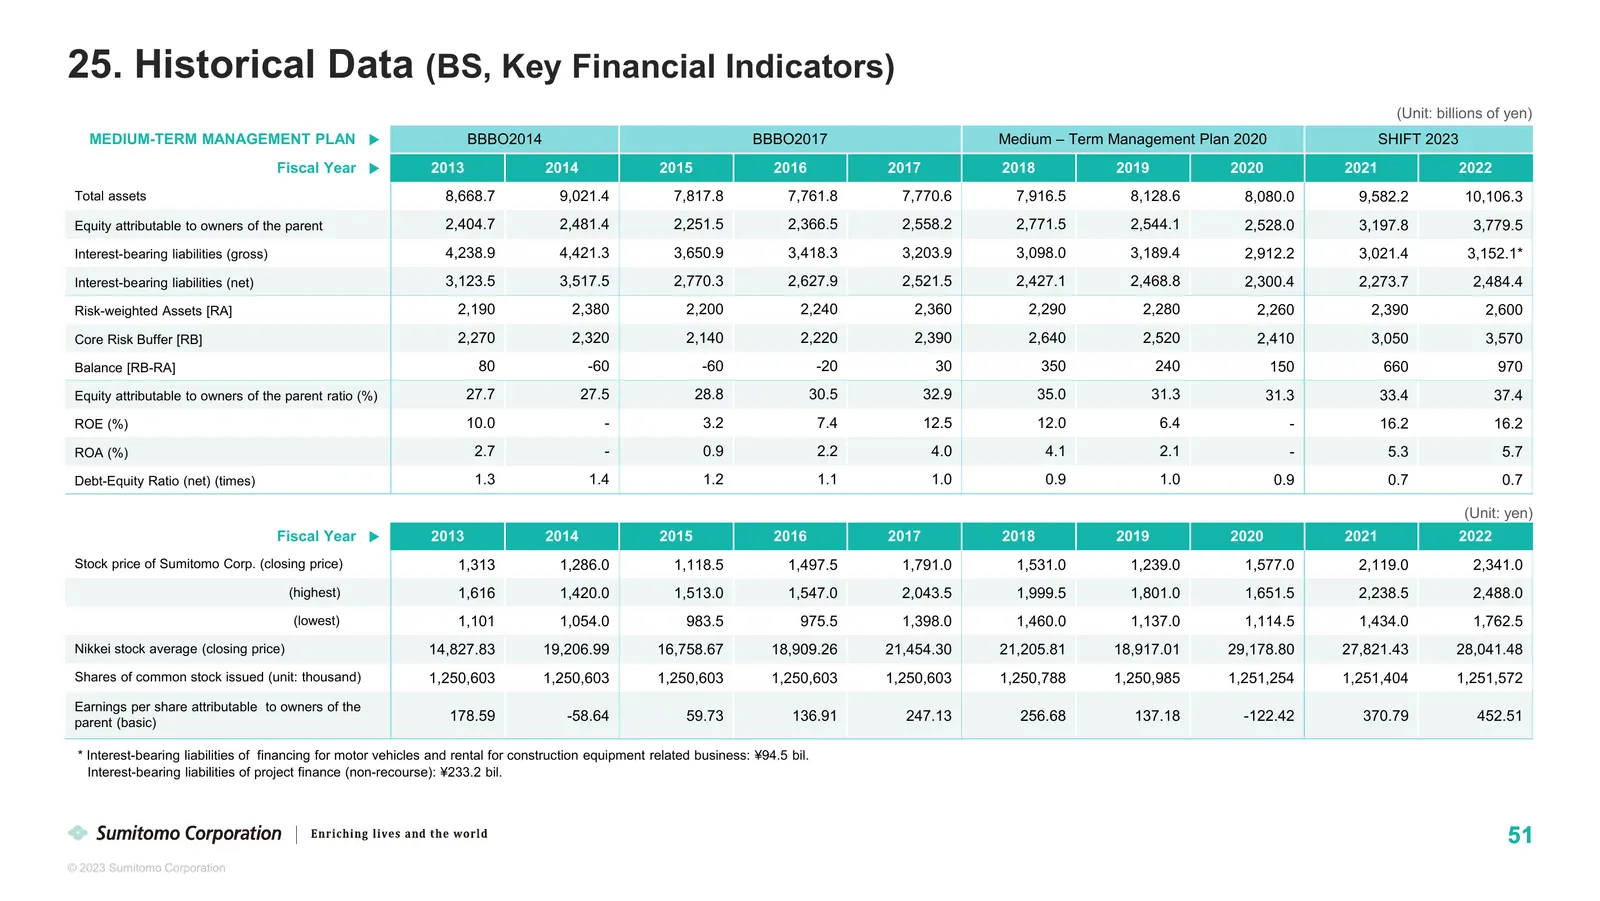
25. Historical Data (BS, Key Financial Indicators) (Unit: billions of yen) MEDIUM-TERM MANAGEMENT PLAN ▶ BBBO2014 BBBO2017 Medium – Term Management Plan 2020 SHIFT 2023 Fiscal Year ▶ 2013 2014 2015 2016 2017 2018 2019 2020 2021 2022 Total assets 8,668.7 9,021.4 7,817.8 7,761.8 7,770.6 7,916.5 8,128.
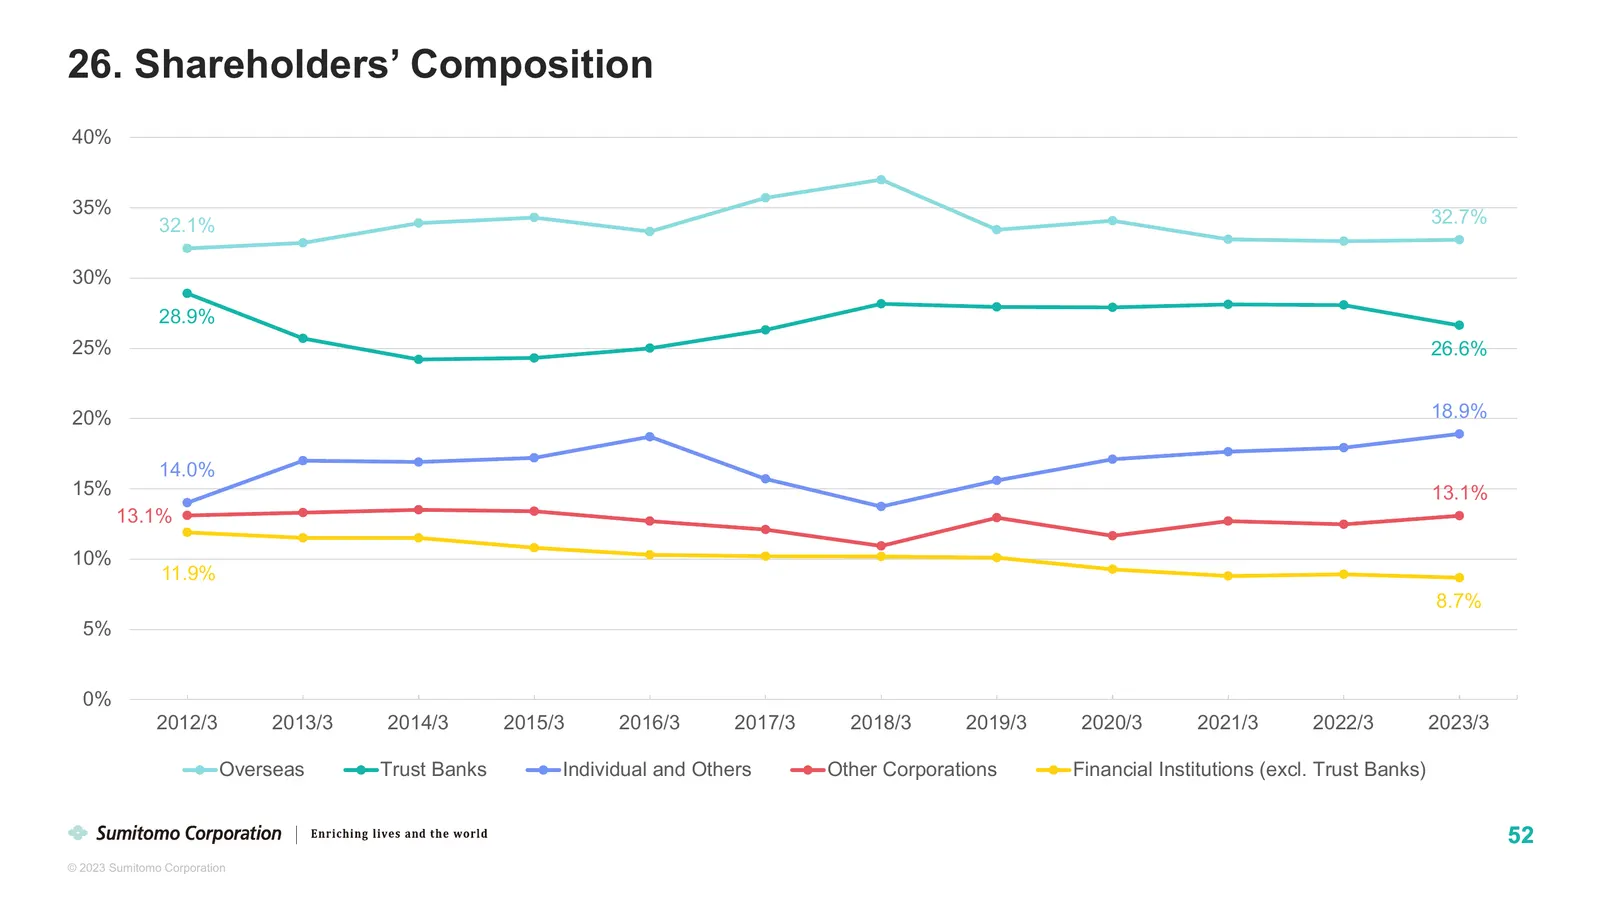
Slide 53: Shareholders' Composition
26. Shareholders’ Composition 40% 35% 32.7% 32.1% 30% 28.9% 25% 26.6% 20% 18.9% 14.0% 15% 13.1% 13.1% 10% 11.9% 8.7% 5% 0% 2012/3 2013/3 2014/3 2015/3 2016/3 2017/3 2018/3 2019/3 2020/3 2021/3 2022/3 2023/3 Overseas Trust Banks Individual and Others Other Corporations Financial Institutions (excl. T
Source: Internet Archive copy of sumitomocorp.com
More decks from Sumitomo Corporation
 FY2026 Q2 Earnings Presentation48 slides · Nov 2, 2026
 Q1 FY2026 Earnings Presentation38 slides · Jul 31, 2026
 FY2025 Earnings Presentation50 slides · May 1, 2026
 FY2025 Earnings Presentation50 slides · May 1, 2026
 Q3 FY2025 Earnings Presentation36 slides · Feb 4, 2026
 FY2025 Q1-3 Earnings Presentation36 slides · Feb 4, 2026