Archstone Smith Trust — Investor Presentation (September 2005)
34 slides from Archstone Smith Trust's investor presentation, Sep 22, 2005

Slide 1: Equity Offering Discussion September 2005
Equity Offering Discussion September 2005
Slide 2: Safe Harbor
Safe Harbor In addition to historical information, this presentation contains forward-looking statements and information under the federal securities laws. These statements are based on current expectations, estimates and projections about the industry and markets in which Archstone- Smith and/or Am
Slide 3: Equity Offering Summary
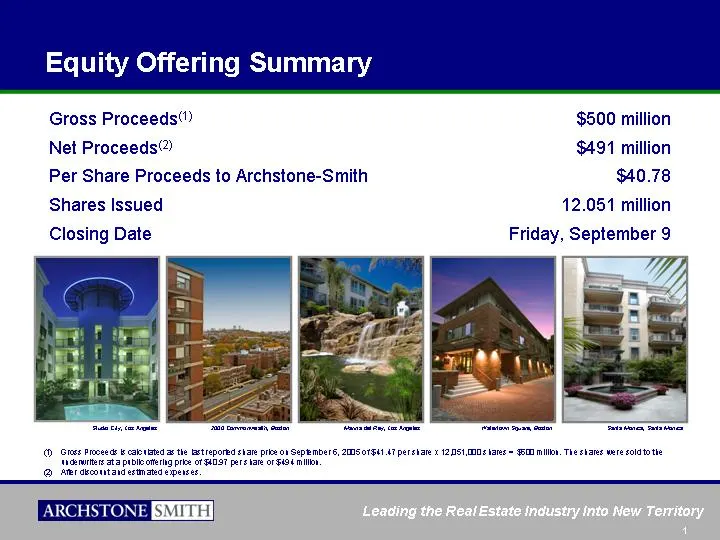
Equity Offering Summary Gross Proceeds(1) Gross Proceeds(1) $500 million Net Proceeds(2) Net Proceeds(2) $491 million Per Share Proceeds to Archstone-Smith Per Share Proceeds to Archstone-Smith $40.78 Shares Issued 12.051 million 12.051 million Closing Date Friday, September 9 Friday, September 9 St
Slide 4: Compelling Reasons for Equity Offering
Compelling Reasons for Equity Offering Successful capital redeployment program expected to be largely completed by early 2006 Future asset sales targeted to produce short-term accretion, not dilution ASN portfolio located in core, protected markets Significant embedded tax gains in core assets limit
Slide 5: Compelling Reasons for Equity Offering
Compelling Reasons for Equity Offering Expected to create incremental value for shareholders and preserve financial flexibility Development value creation is anticipated to significantly exceed NAV dilution(1) Reiterate 2005 guidance(2): EPS: $1.50 to $1.70 FFO: $1.94 to $2.01 per share (No change t
Slide 6: We Have Transformed the Company
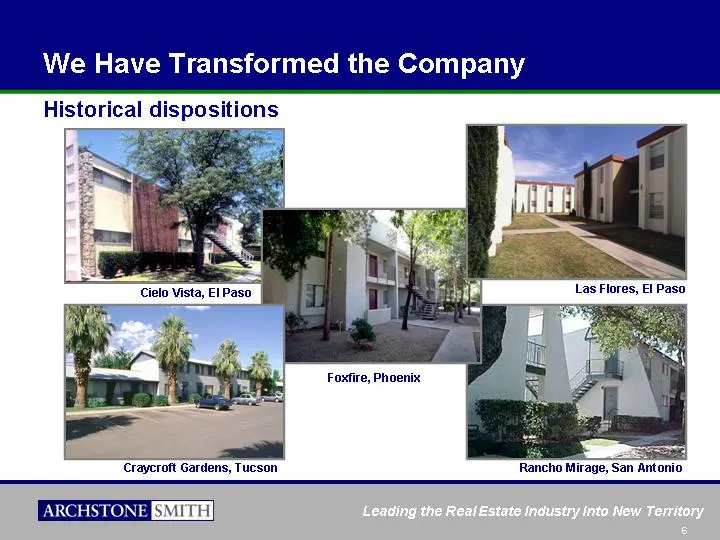
We Have Transformed the Company Cielo Vista, El Paso Las Flores, El Paso Craycroft Gardens, Tucson Foxfire, Phoenix Rancho Mirage, San Antonio Historical dispositions
Slide 7: Completion of Successful Capital Redeployment Program
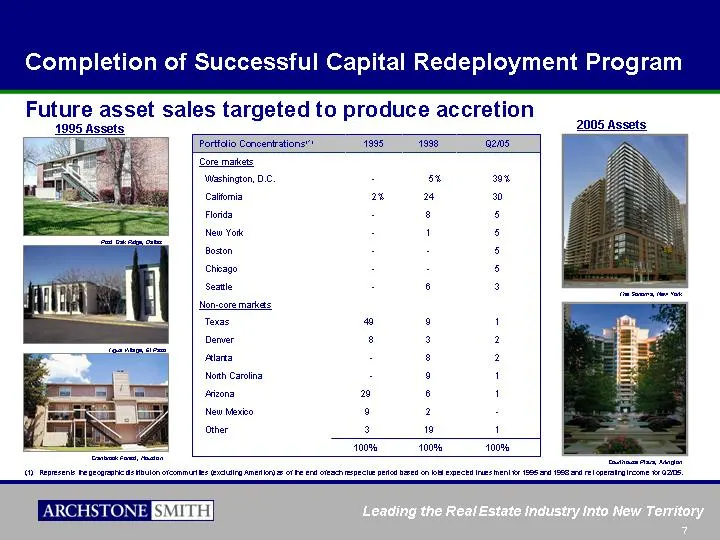
Completion of Successful Capital Redeployment Program Future asset sales targeted to produce accretion Portfolio Concentrations(1) Portfolio Concentrations(1) 1995 1998 Q2/05 Core markets Core markets Washington, D.C. Washington, D.C. - 5% 39% California California 2% 24 30 Florida Florida - 8 5 New
Slide 8: Disposition Profits and Returns Have Been Very Attractive
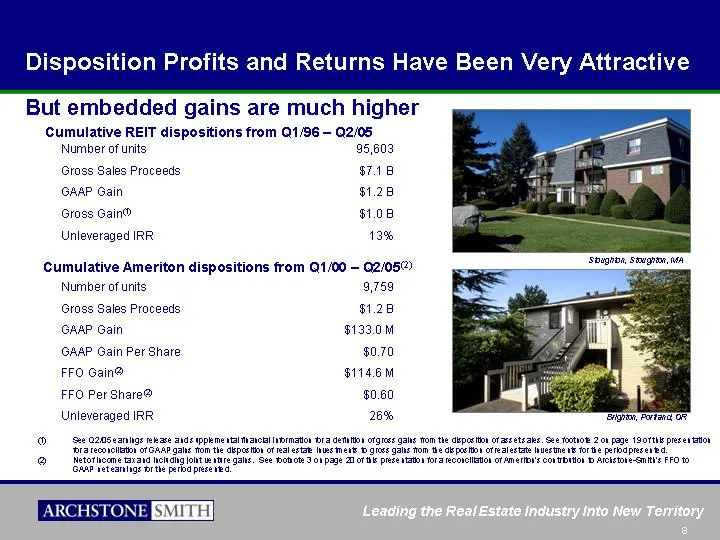
Disposition Profits and Returns Have Been Very Attractive Number of units 95,603 Gross Sales Proceeds $7.1 B GAAP Gain $1.2 B Gross Gain(1) $1.0 B Unleveraged IRR 13% Cumulative REIT dispositions from Q1/96 - Q2/05 (1) See Q2/05 earnings release and supplemental financial information for a definitio
Slide 9: Net Dispositions Have Funded Developments
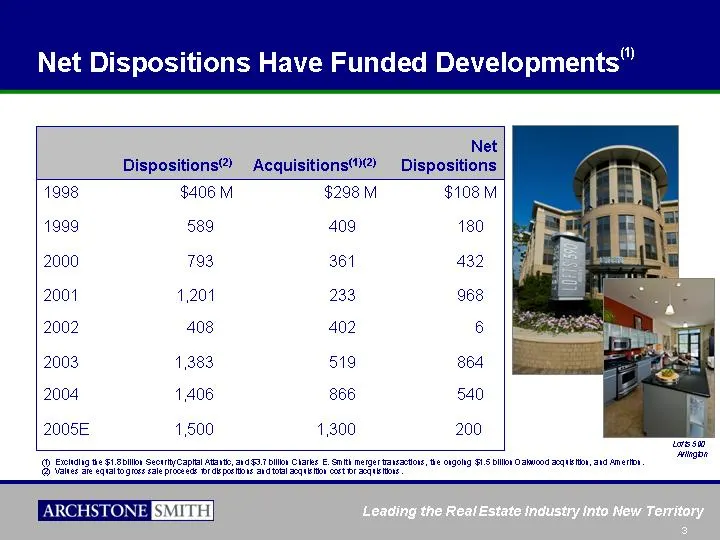
Net Dispositions Have Funded Developments(1) Dispositions(2) Acquisitions(1)(2) Net Dispositions 1998 $406 M $298 M $108 M 1999 589 409 180 2000 793 361 432 2001 1,201 233 968 2002 408 402 6 2003 1,383 519 864 2004 1,406 866 540 2005E 1,500 1,300 200 (1) Excluding the $1.8 billion Security Capital A
Slide 10: Strong Development Track Record
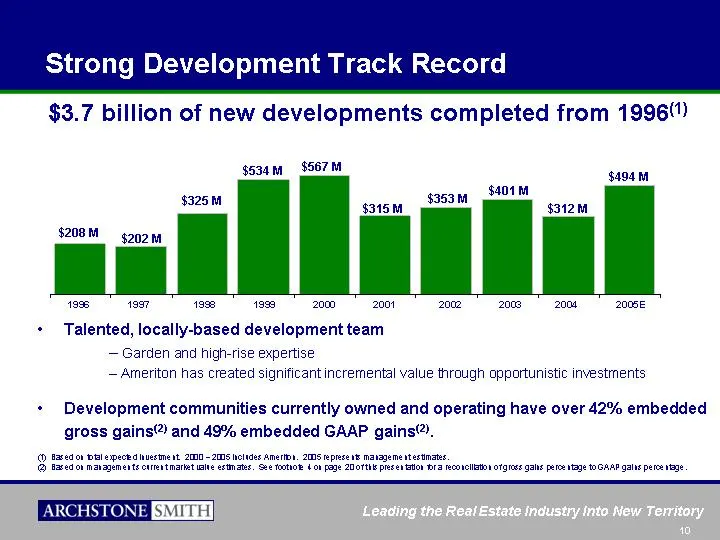
Strong Development Track Record Talented, locally-based development team Garden and high-rise expertise Ameriton has created significant incremental value through opportunistic investments Development communities currently owned and operating have over 42% embedded gross gains(2) and 49% embedded GA
Slide 11: Incremental Value Embedded in $2.5 Billion Development Pipeline
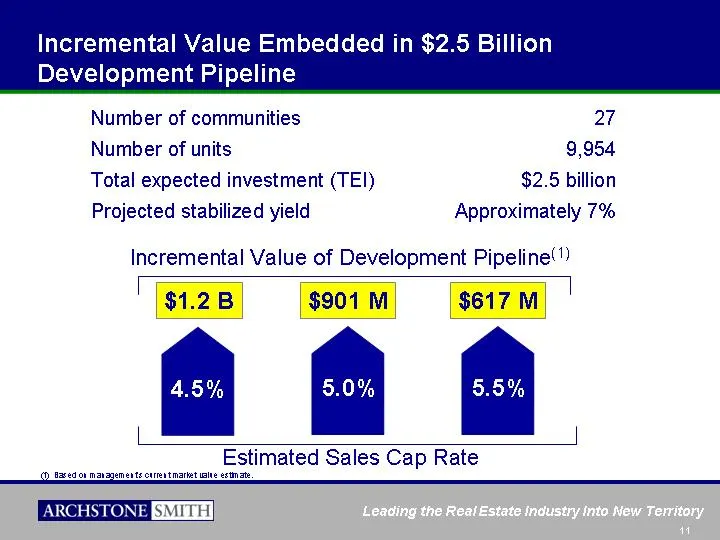
Incremental Value Embedded in $2.5 Billion Development Pipeline Estimated Sales Cap Rate 4.5% 5.0% 5.5% Incremental Value of Development Pipeline(1) $1.2 B $901 M $617 M Number of communities 27 Number of units 9,954 Total expected investment (TEI) $2.5 billion Projected stabilized yield Approximate
Slide 12: Archstone-Smith Developments Southern California
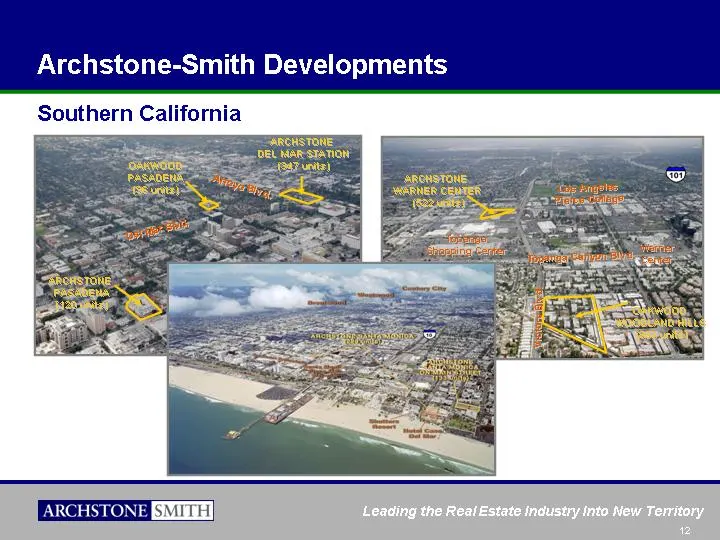
Warner Center Topanga Canyon Blvd. Victory Blvd. OAKWOOD WOODLAND HILLS (883 units) Topanga Shopping Center ARCHSTONE WARNER CENTER (522 units) Los Angeles Pierce College Archstone-Smith Developments Southern California ARCHSTONE PASADENA (120 units) ARCHSTONE DEL MAR STATION (347 units) OAKWOOD PAS
Slide 13: Northeast
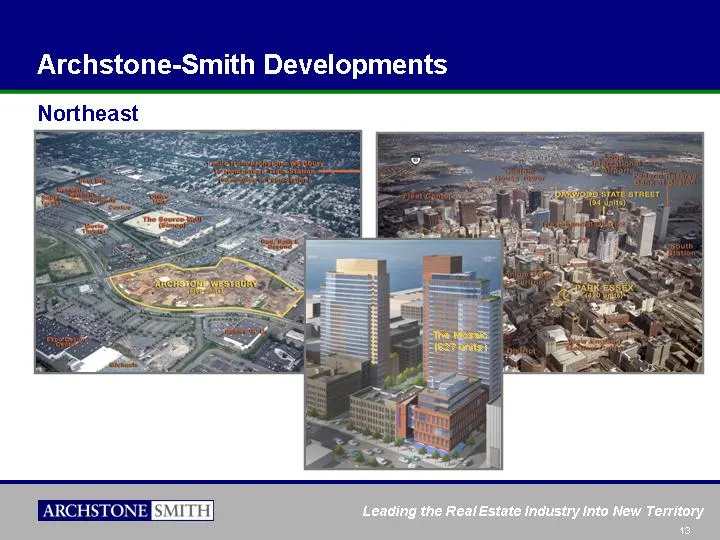
Archstone-Smith Developments Northeast The Mosaic (627 units)
Slide 14: Washington, D.C.
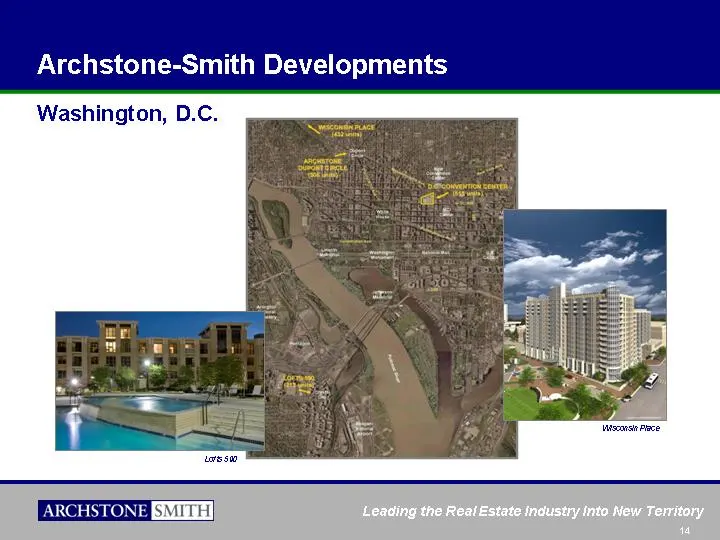
Archstone-Smith Developments Washington, D.C. Lofts 590 Wisconsin Place
Slide 15: Estimated Funding Requirement for $2.5 Billion Development Pipeline
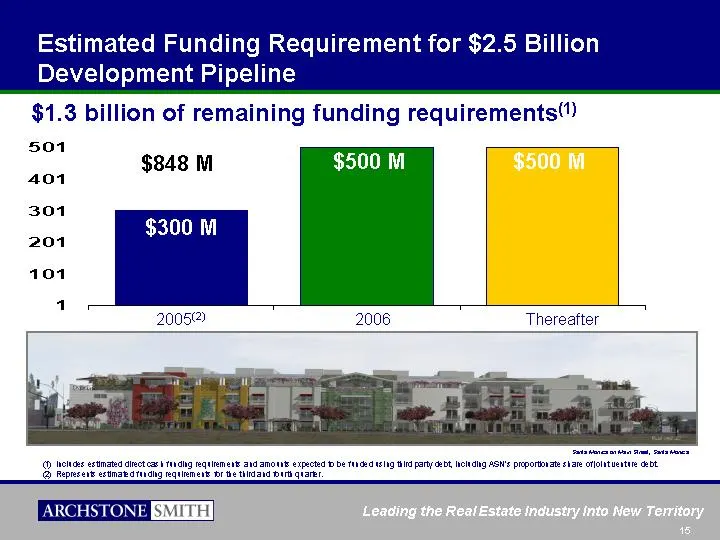
Funded to Date 2005 2006 Thereafter East 838 300 500 500 Estimated Funding Requirement for $2.5 Billion Development Pipeline $1.3 billion of remaining funding requirements(1) 2005(2) 2006 Thereafter $848 M $300 M $500 M $500 M Santa Monica on Main Street, Santa Monica (1) Includes estimated direct c
Slide 16: Significant Embedded Tax Gains Limit Ability to Complete Non-1031 Exchange Sales
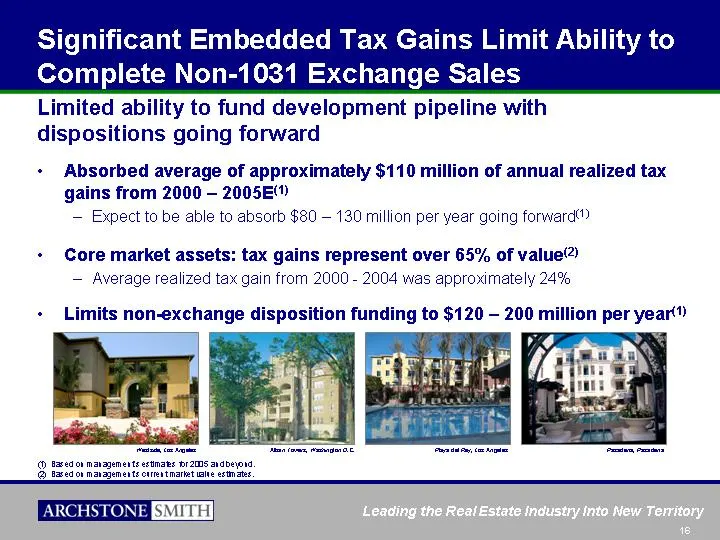
Significant Embedded Tax Gains Limit Ability to Complete Non-1031 Exchange Sales Absorbed average of approximately $110 million of annual realized tax gains from 2000 - 2005E(1) Expect to be able to absorb $80 - 130 million per year going forward(1) Core market assets: tax gains represent over 65% o
Slide 17: Calculation of NAV Per Share
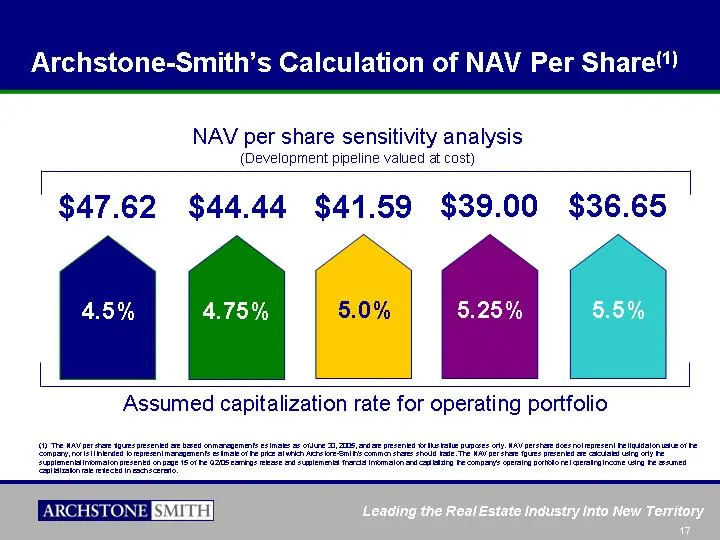
Archstone-Smith's Calculation of NAV Per Share(1) 4.75% 4.5% Assumed capitalization rate for operating portfolio 4.75% 5.0% 5.25% 5.5% NAV per share sensitivity analysis (Development pipeline valued at cost) $47.62 $44.44 $41.59 $39.00 $36.65 (1) The NAV per share figures presented are based on mana
Slide 18: Development Value Creation Is Anticipated to Significantly Exceed NAV Dilution
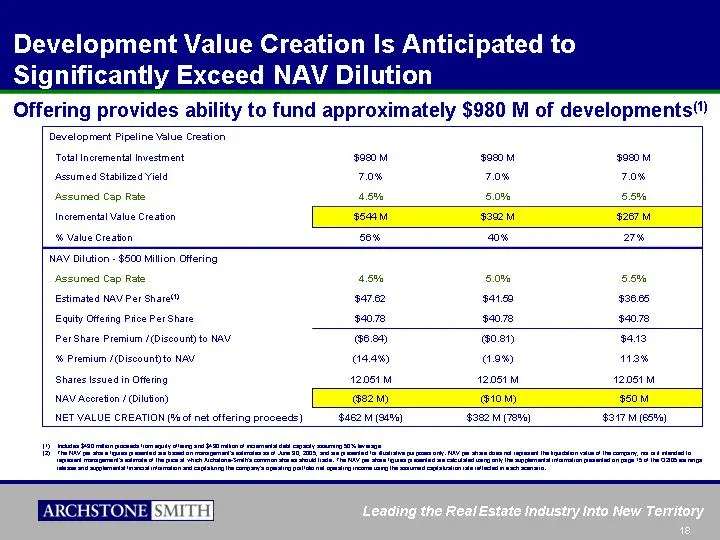
Development Value Creation Is Anticipated to Significantly Exceed NAV Dilution Development Pipeline Value Creation Total Incremental Investment $980 M $980 M $980 M Assumed Stabilized Yield 7.0% 7.0% 7.0% Assumed Cap Rate 4.5% 5.0% 5.5% Incremental Value Creation $544 M $392 M $267 M % Value Creatio
Slide 19: Supplemental information and reconciliations
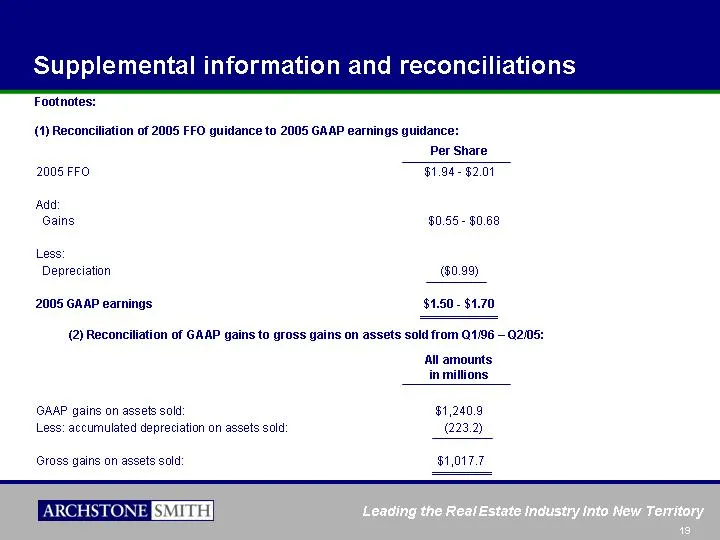
All amounts in millions GAAP gains on assets sold: $1,240.9 Less: accumulated depreciation on assets sold: (223.2) Gross gains on assets sold: $1,017.7 Supplemental information and reconciliations Footnotes: (1) Reconciliation of 2005 FFO guidance to 2005 GAAP earnings guidance: (2) Reconciliation o
Slide 20: Supplemental information and reconciliations
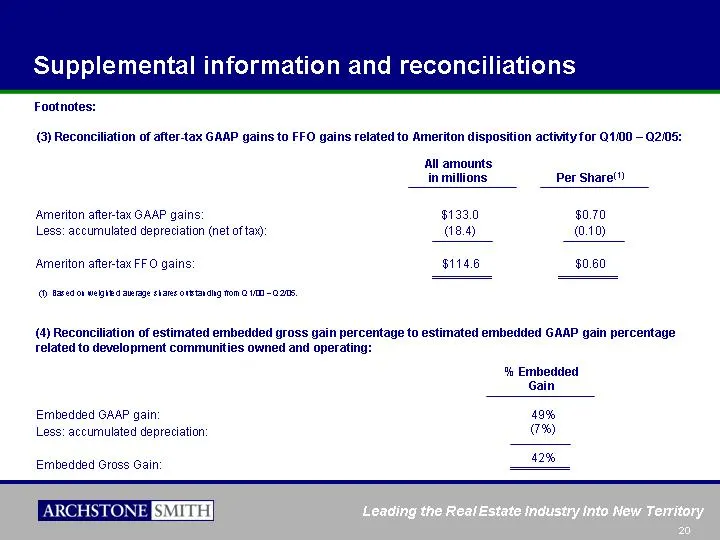
Embedded GAAP gain: Less: accumulated depreciation: Embedded Gross Gain: Supplemental information and reconciliations Footnotes: (4) Reconciliation of estimated embedded gross gain percentage to estimated embedded GAAP gain percentage related to development communities owned and operating: All amoun
Slide 21: Supplemental information and reconciliations
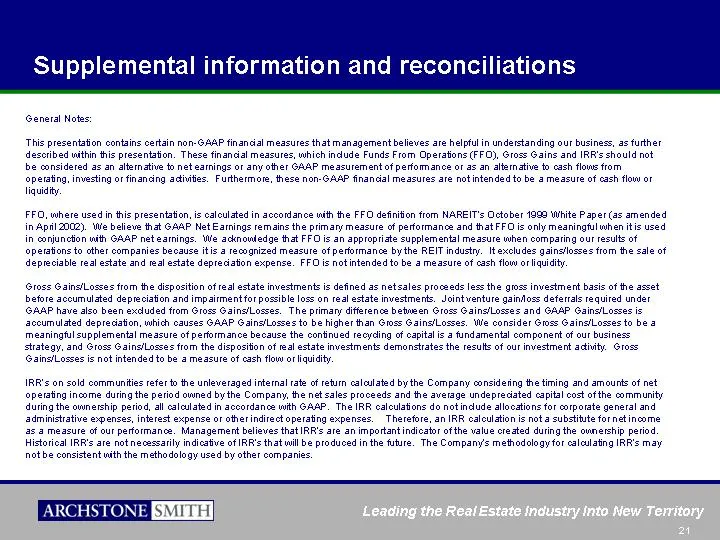
Supplemental information and reconciliations General Notes: This presentation contains certain non-GAAP financial measures that management believes are helpful in understanding our business, as further described within this presentation. These financial measures, which include Funds From Operations

Slide 22: Appendix Development Communities
Appendix Development Communities
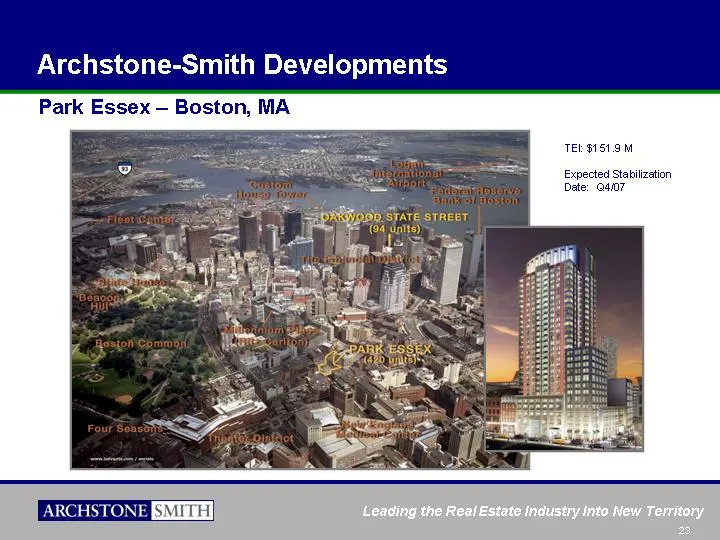
Slide 23: Park Essex - Boston, MA
Archstone-Smith Developments Park Essex - Boston, MA TEI: $151.9 M Expected Stabilization Date: Q4/07
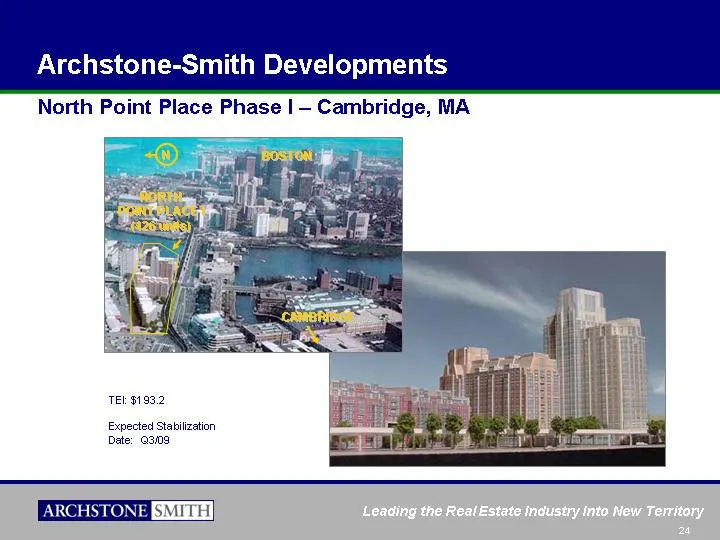
Slide 24: North Point Place Phase I - Cambridge, MA
Archstone-Smith Developments North Point Place Phase I - Cambridge, MA TEI: $193.2 Expected Stabilization Date: Q3/09 NORTH POINT PLACE I (426 units) BOSTON CAMBRIDGE N
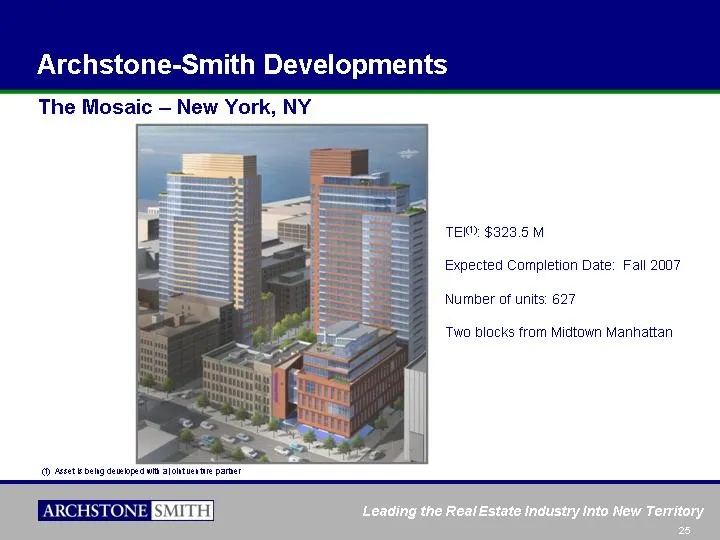
Slide 25: The Mosaic - New York, NY
Archstone-Smith Developments The Mosaic - New York, NY TEI(1): $323.5 M Expected Completion Date: Fall 2007 Number of units: 627 Two blocks from Midtown Manhattan (1) Asset is being developed with a joint venture partner
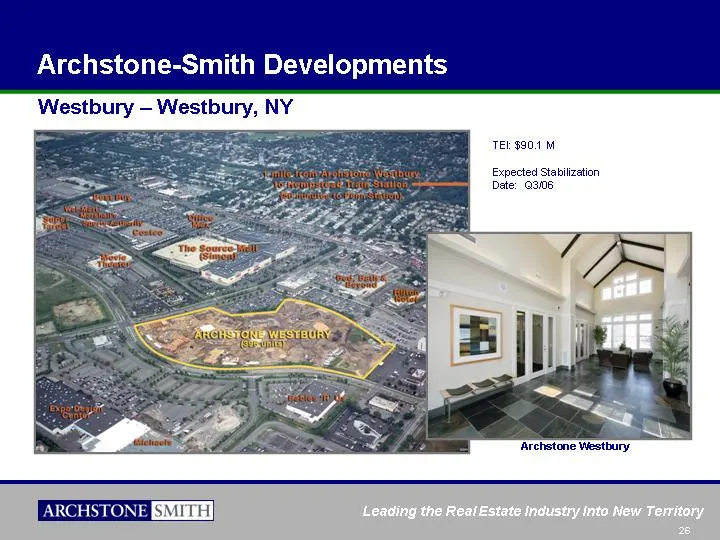
Slide 26: Archstone Westbury - Westbury, NY
Archstone-Smith Developments Archstone Westbury TEI: $90.1 M Expected Stabilization Date: Q3/06 Westbury - Westbury, NY
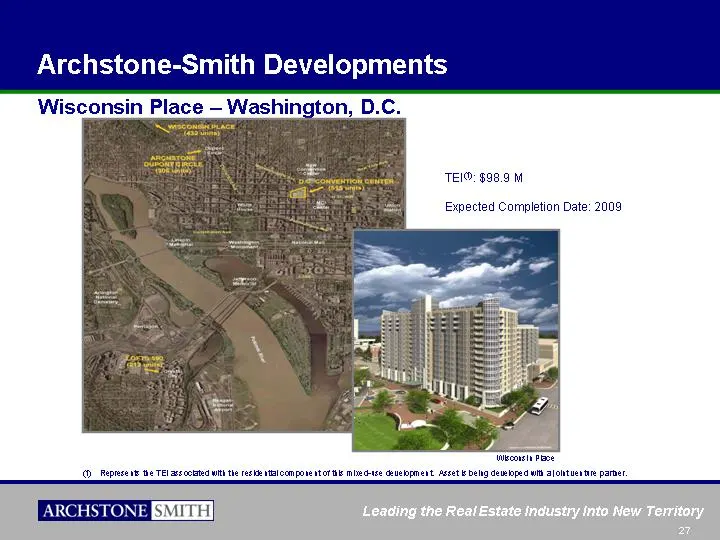
Slide 27: Wisconsin Place - Washington, D.C.
Archstone-Smith Developments Wisconsin Place - Washington, D.C. TEI(1): $98.9 M Expected Completion Date: 2009 Wisconsin Place (1) Represents the TEI associated with the residential component of this mixed-use development. Asset is being developed with a joint venture partner.
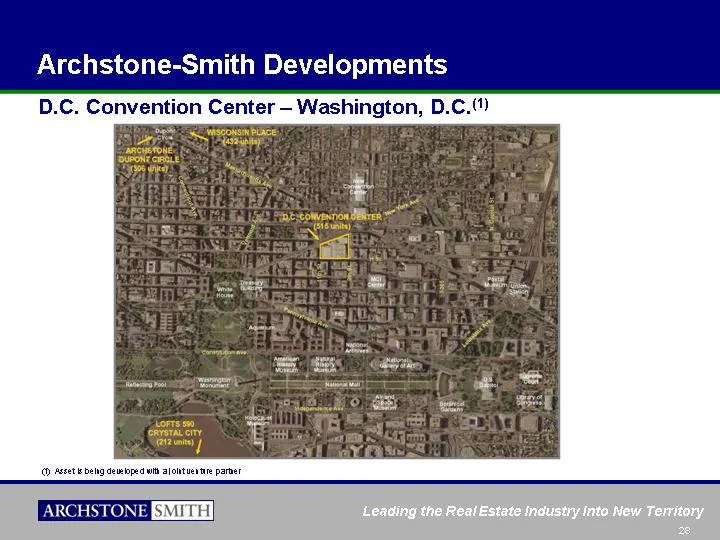
Slide 28: D.C. Convention Center - Washington, D.C.
Archstone-Smith Developments D.C. Convention Center - Washington, D.C.(1) (1) Asset is being developed with a joint venture partner
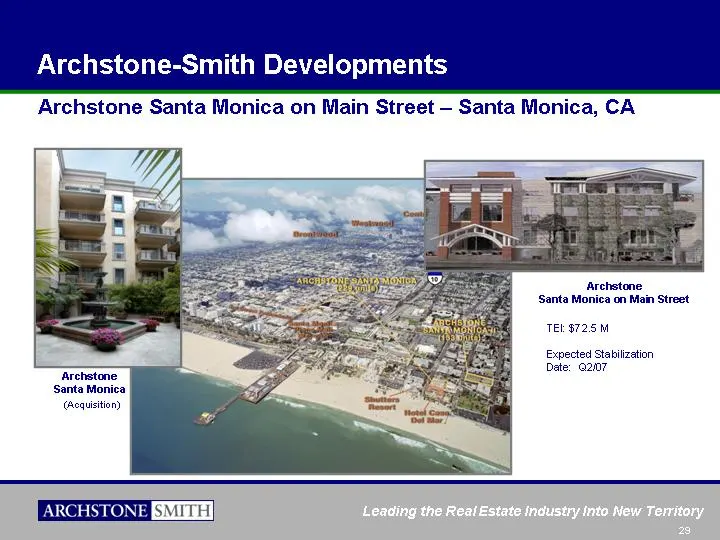
Slide 29: Archstone Santa Monica on Main Street
Archstone-Smith Developments Archstone Santa Monica on Main Street Archstone Santa Monica Archstone Santa Monica on Main Street - Santa Monica, CA TEI: $72.5 M Expected Stabilization Date: Q2/07 (Acquisition)
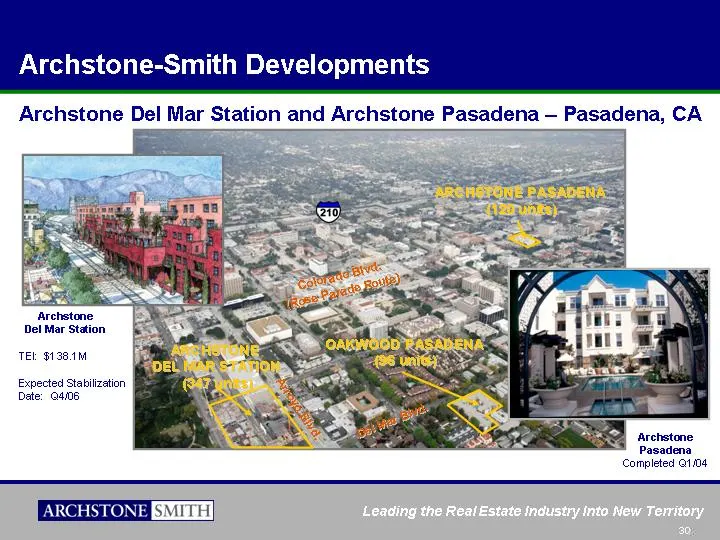
Slide 30: Archstone Del Mar Station and Archstone Pasadena
Archstone-Smith Developments Archstone Del Mar Station and Archstone Pasadena - Pasadena, CA ARCHSTONE PASADENA (120 units) ARCHSTONE DEL MAR STATION (347 units) OAKWOOD PASADENA (96 units) Colorado Blvd. (Rose Parade Route) Del Mar Blvd. Arroyo Blvd. Archstone Pasadena Completed Q1/04 Archstone Del
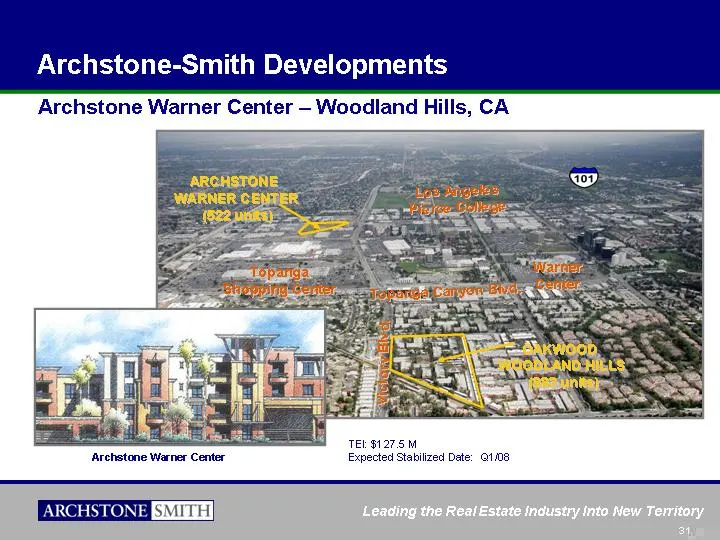
Slide 31: Archstone Warner Center - Woodland Hills, CA
Archstone-Smith Developments Warner Center Topanga Canyon Blvd. Victory Blvd. OAKWOOD WOODLAND HILLS (883 units) Topanga Shopping Center ARCHSTONE WARNER CENTER (522 units) Los Angeles Pierce College Archstone Warner Center Archstone Warner Center - Woodland Hills, CA TEI: $127.5 M Expected Stabiliz
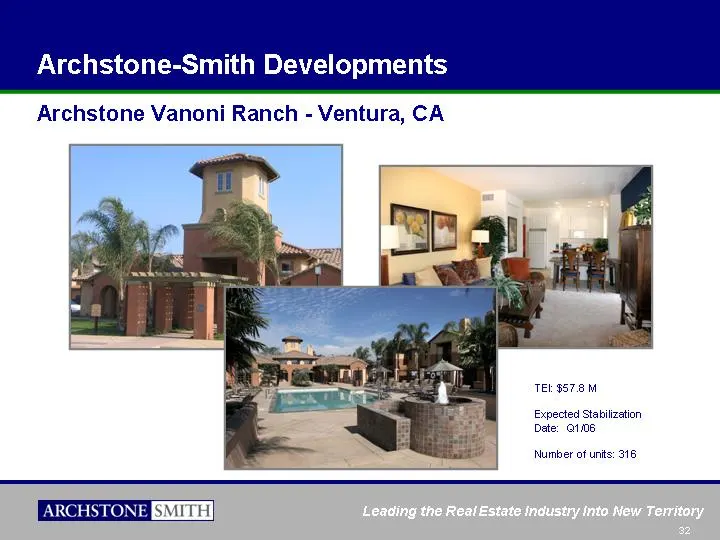
Slide 32: Archstone Vanoni Ranch - Ventura, CA
Archstone-Smith Developments Archstone Vanoni Ranch - Ventura, CA TEI: $57.8 M Expected Stabilization Date: Q1/06 Number of units: 316
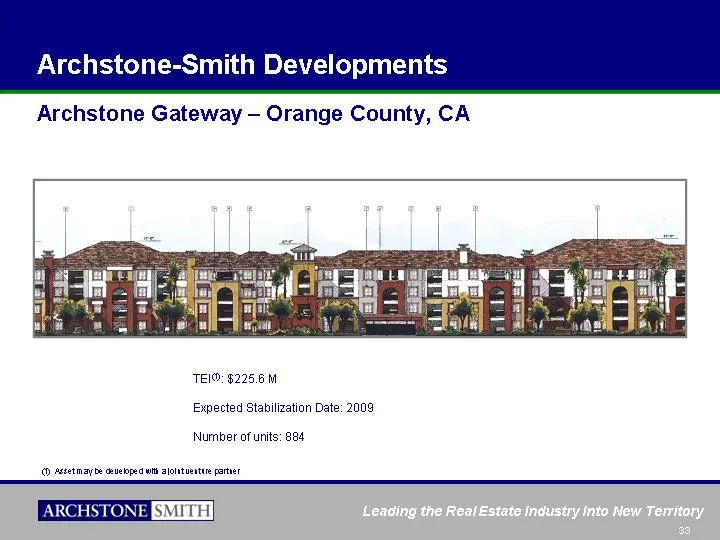
Slide 33: Archstone Gateway - Orange County, CA
Archstone-Smith Developments Archstone Gateway - Orange County, CA TEI(1): $225.6 M Expected Stabilization Date: 2009 Number of units: 884 (1) Asset may be developed with a joint venture partner
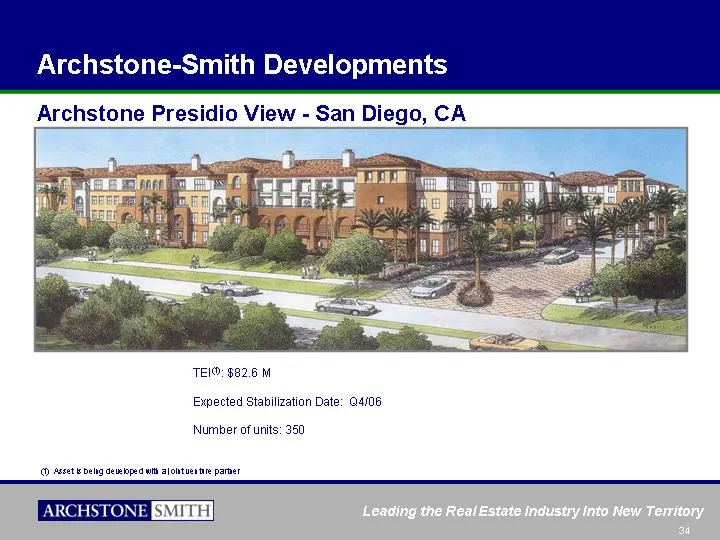
Slide 34: Archstone Presidio View - San Diego, CA
Archstone-Smith Developments Archstone Presidio View - San Diego, CA TEI(1): $82.6 M Expected Stabilization Date: Q4/06 Number of units: 350 (1) Asset is being developed with a joint venture partner
Source: SEC EDGAR · 8-K filed Sep 22, 2005
More decks from Archstone Smith Trust
 Citigroup 2007 Global Property CEO Conference26 slides · Mar 5, 2007
 NAREIT Annual Convention 200625 slides · Nov 7, 2006
 NAREIT Institutional Investor Forum June 200626 slides · Jun 5, 2006
 Corporate Update (June 2006)14 slides · Jun 5, 2006
 Corporate Update (April 2006)17 slides · Apr 11, 2006
 Citigroup REIT CEO Conference March 200620 slides · Mar 7, 2006