Railamerica — BB&T Transportation Services Conference 2006
21 slides from Railamerica's conference presentation, Feb 15, 2006
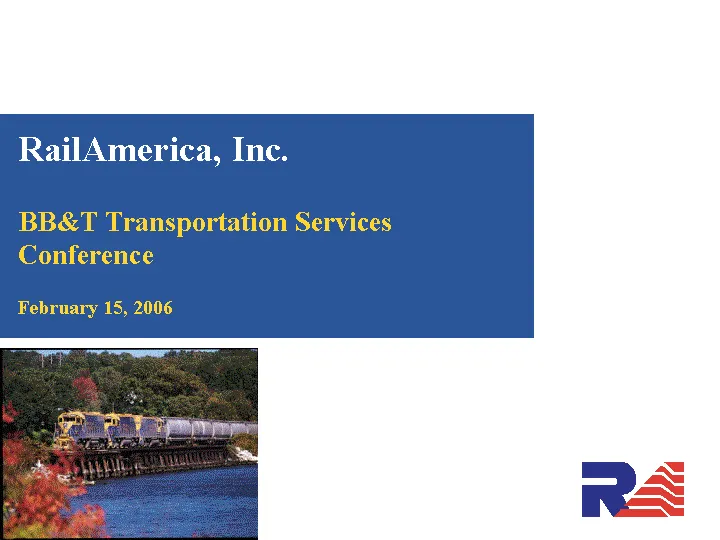
Slide 1: RailAmerica, Inc. BB&T Transportation Services Conference
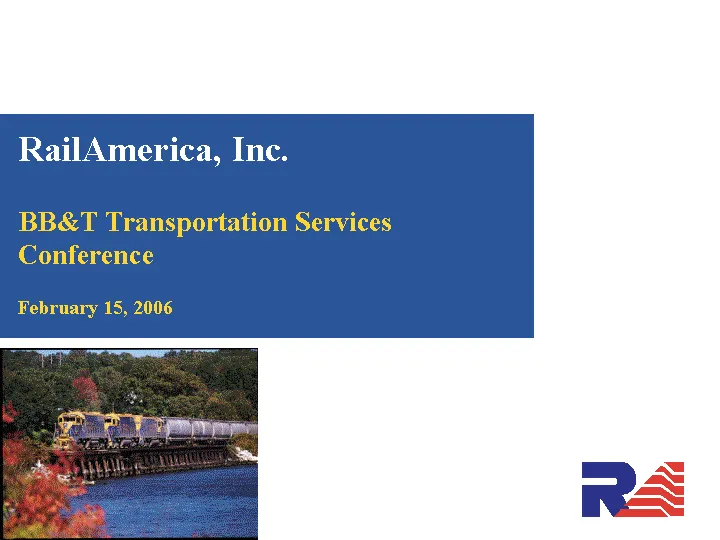
RailAmerica, Inc. BB&T Transportation Services Conference February 15, 2006
Slide 2: Forward-Looking Statements and Forecasts
Forward -Looking Statements and Forecasts This presentation contains forward-looking statements, forecasts, and information regarding future events and the future performance of RailAmerica, Inc. ("RailAmerica" or the "Company") that involve risks and uncertainties that could cause actual results an
Slide 3: Charles Swinburn, Chief Executive Officer
Charles Swinburn Chief Executive Officer
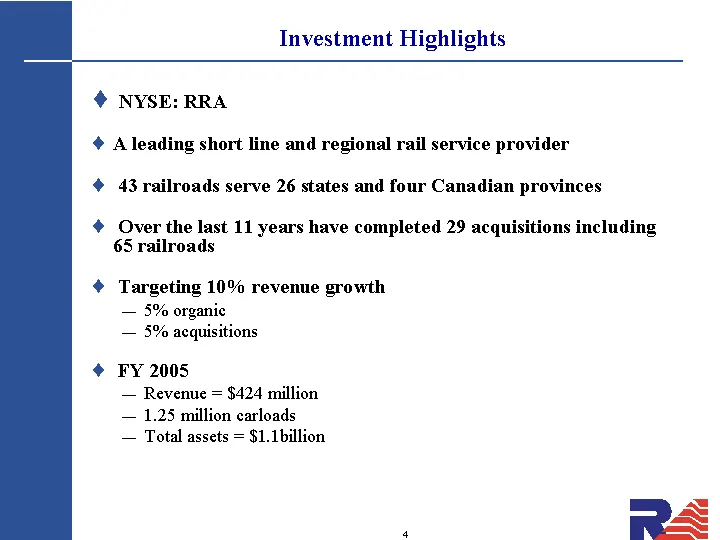
Slide 4: Investment Highlights
Investment Highlights NYSE: RRA A leading short line and regional rail service provider 43 railroads serve 26 states and four Canadian provinces Over the last 11 years have completed 29 acquisitions including 65 railroads Targeting 10% revenue growth 5% organic 5% acquisitions FY 2005 Revenue = $424
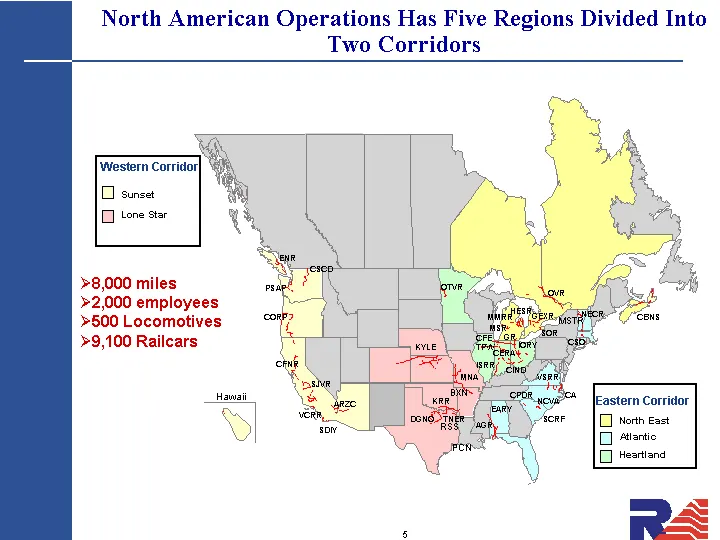
Slide 5: North American Operations Has Five Regions Divided Into Two Corridors
SDIY VCRR CFNR SJVR ARZC CORP PSAP ENR CSCD OTVR KYLE MNA AGR DGNO TNER KRR EARY CPDR SCRF VSRR NCVA CA TPW ISRR IORY CIND HESR MSR MMRR GR SOR GEXR OVR NECR CSO CBNS CERA CFE Hawaii Western Corridor Lone Star Sunset Eastern Corridor North East Atlantic Heartland North American Operations Has Five R
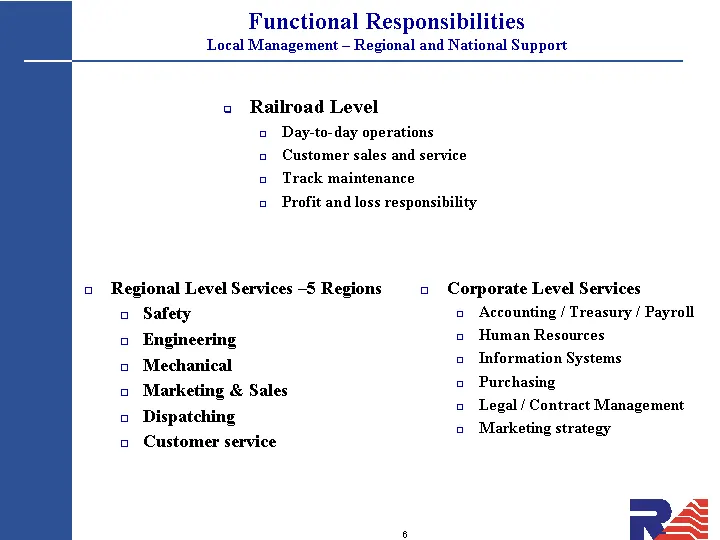
Slide 6: Functional Responsibilities
Functional Responsibilities Local Management - Regional and National Support Regional Level Services -5 Regions Safety Engineering Mechanical Marketing & Sales Dispatching Customer service Corporate Level Services Accounting / Treasury / Payroll Human Resources Information Systems Purchasing Legal /
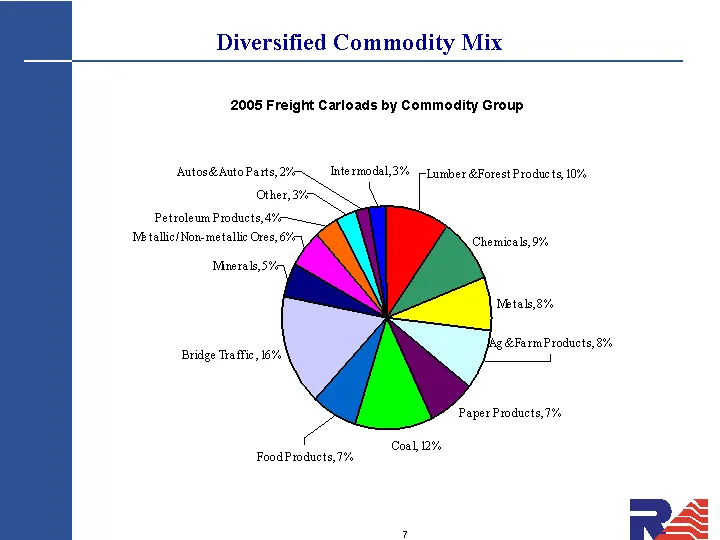
Slide 7: Diversified Commodity Mix
Diversified Commodity Mix 2005 Freight Carloads by Commodity Group
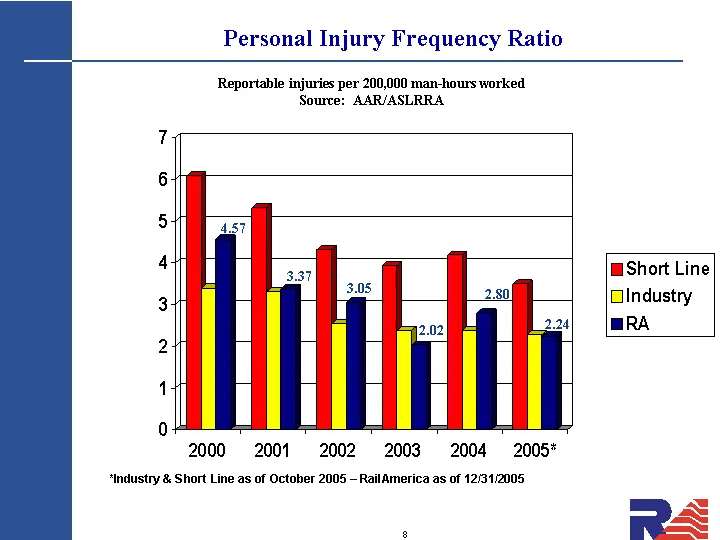
Slide 8: Personal Injury Frequency Ratio
Personal Injury Frequency Ratio 2000 2001 2002 2003 2004 2005* Short Line 6.08 5.32 4.32 3.93 4.19 3.49 Industry 3.39 3.3 2.54 2.37 2.38 2.28 RA 4.57 3.37 3.05 2.02 2.8 2.24 *Industry & Short Line as of October 2005 - RailAmerica as of 12/31/2005 3.05 2.02 2.80 2.24 Reportable injuries per 200,000 m
Slide 9: 2005 Acquisitions and Divestitures
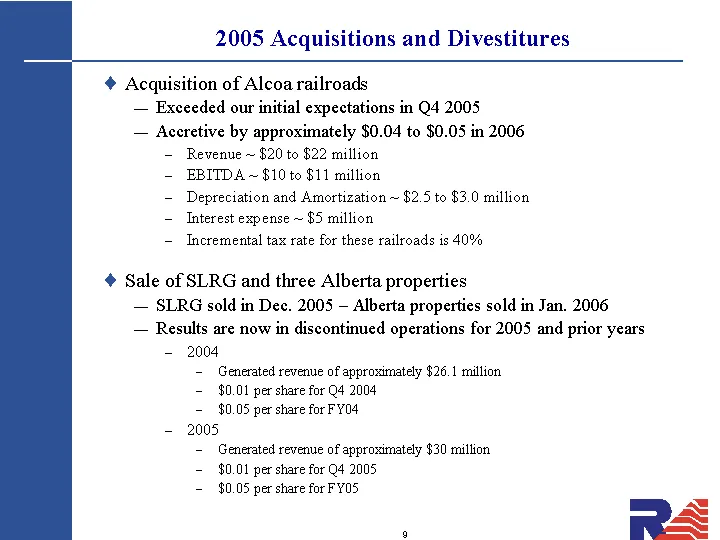
2005 Acquisitions and Divestitures Acquisition of Alcoa railroads Exceeded our initial expectations in Q4 2005 Accretive by approximately $0.04 to $0.05 in 2006 Revenue ~ $20 to $22 million EBITDA ~ $10 to $11 million Depreciation and Amortization ~ $2.5 to $3.0 million Interest expense ~ $5 million
Slide 10: 2006 Initiatives and Strategic Direction
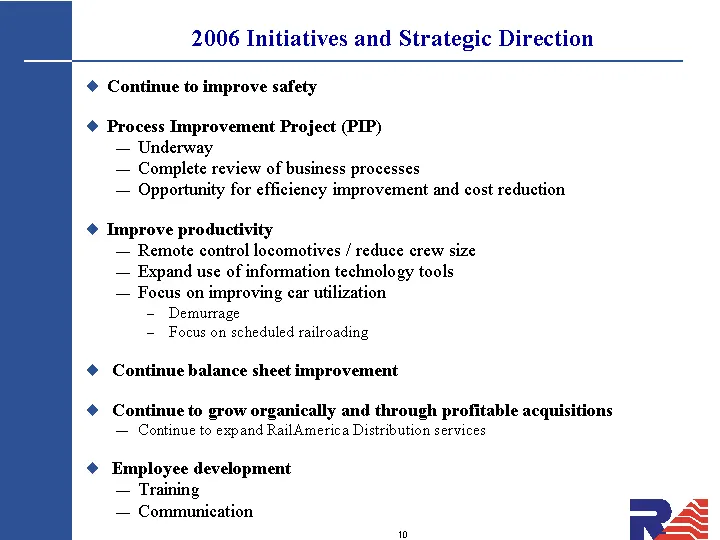
2006 Initiatives and Strategic Direction Continue to improve safety Process Improvement Project (PIP) Underway Complete review of business processes Opportunity for efficiency improvement and cost reduction Improve productivity Remote control locomotives / reduce crew size Expand use of information
Slide 11: Michael Howe, Executive Vice President and Chief Financial Officer
Michael Howe Executive Vice President and Chief Financial Officer
Slide 12: Earnings Per Share Continuing Operations
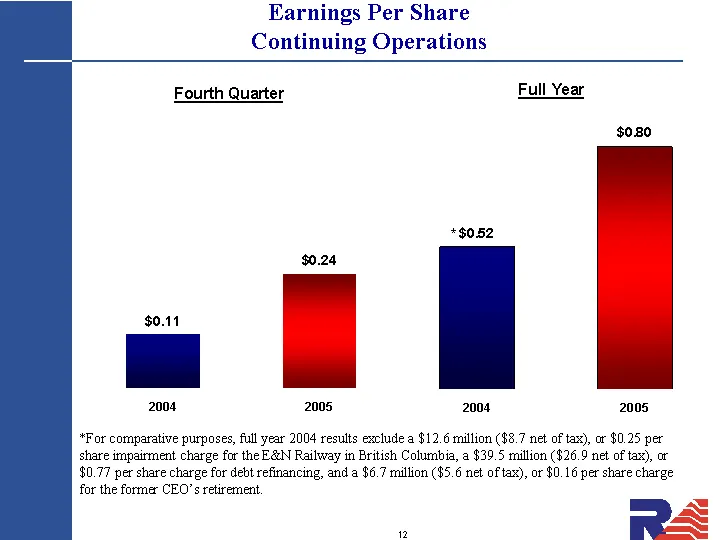
Earnings Per Share Continuing Operations *For comparative purposes, full year 2004 results exclude a $12.6 million ($8.7 net of tax), or $0.25 per share impairment charge for the E&N Railway in British Columbia, a $39.5 million ($26.9 net of tax), or $0.77 per share charge for debt refinancing, and
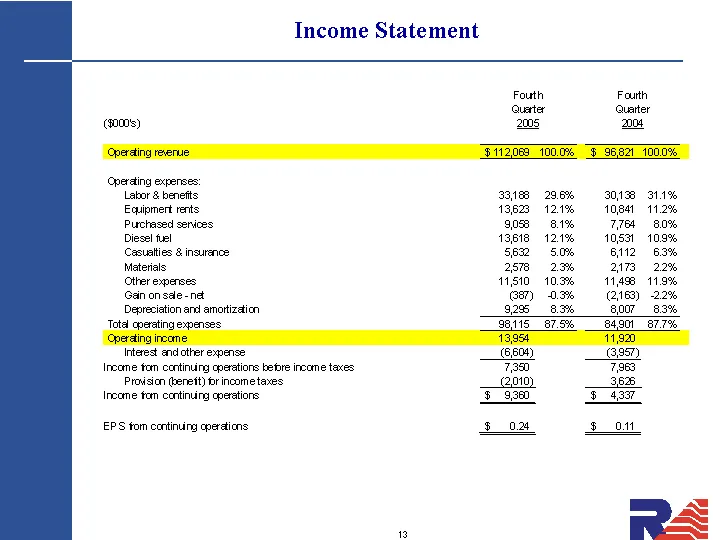
Slide 13: Income Statement
Income Statement Fouth Fouth uerter Guatter (goons) 200s not Operating expenses: Labor & henefts 33188 296% 30198 31.1% Equipmert rents 13623 121% 10841 11.2% Purchased senices cr CT Diese! te! 13618 121% 105" 109% Casuatties & insurance 5e2 50% ©8112 8.3% Materials 257 23% © -2IT3 2.2% Other expens
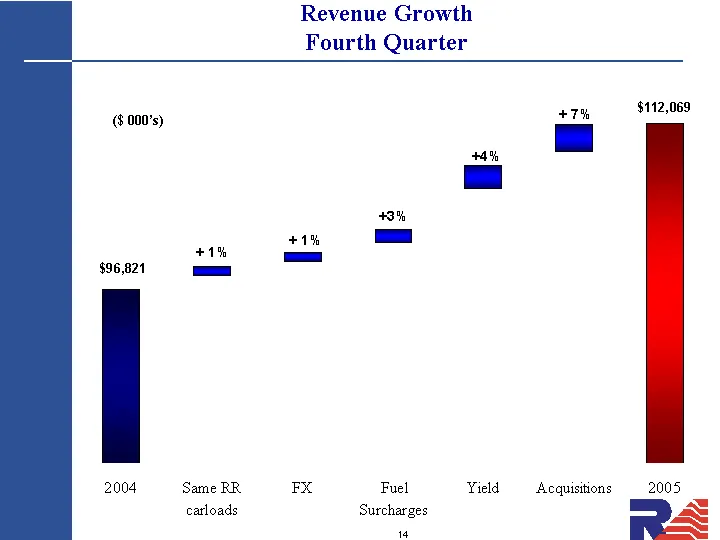
Slide 14: Revenue Growth Fourth Quarter
Revenue Growth Fourth Quarter + 1% + 1% +4% + 7% +3% ($ 000's) 2004 Same RR carloads FX Fuel Surcharges Yield Acquisitions 2005 X 94000 95500 97000 99000 105000 109000 112069 Y 1000 1000 1500 2500 3000
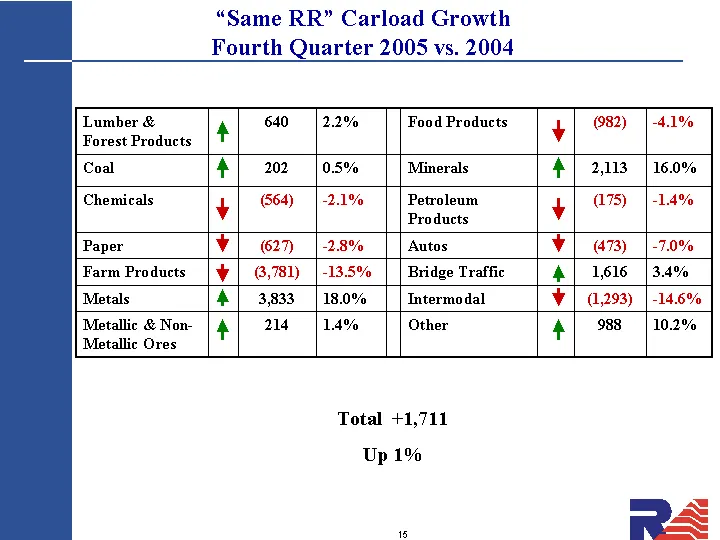
Slide 15: "Same RR" Carload Growth Fourth Quarter 2005 vs. 2004
"Same RR" Carload Growth Fourth Quarter 2005 vs. 2004 Total +1,711 Up 1% Lumber & Forest Products 640 2.2% Food Products (982) -4.1% Coal 202 0.5% Minerals 2,113 16.0% Chemicals (564) -2.1% Petroleum Products (175) -1.4% Paper (627) -2.8% Autos (473) -7.0% Farm Products (3,781) -13.5% Bridge Traffic
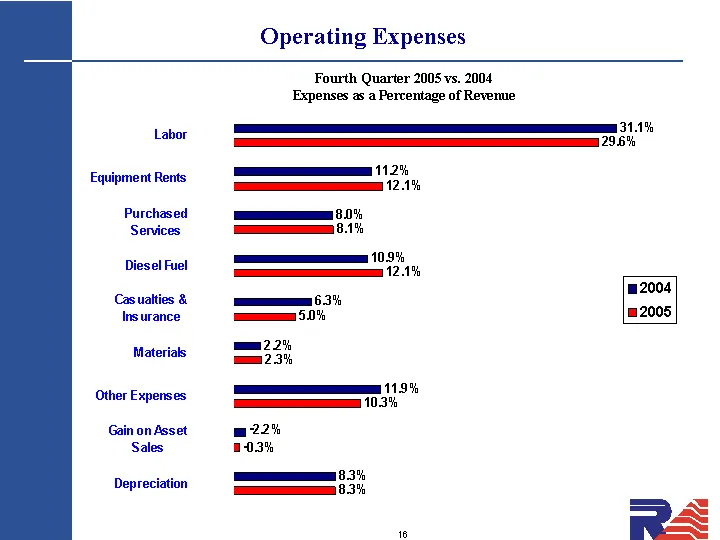
Slide 16: Operating Expenses as a Percentage of Revenue
Operating Expenses Depreciation Gain on Asset Sales Other Expenses Materials Casualties & Insurance Diesel Fuel Purchased Services Equipment Rents Labor 2005 0.083 0.005 0.103 0.023 0.05 0.121 0.081 0.121 0.296 2004 0.083 0.01 0.119 0.022 0.063 0.109 0.08 0.112 0.311 Fourth Quarter 2005 vs. 2004 Exp
Slide 17: Fuel
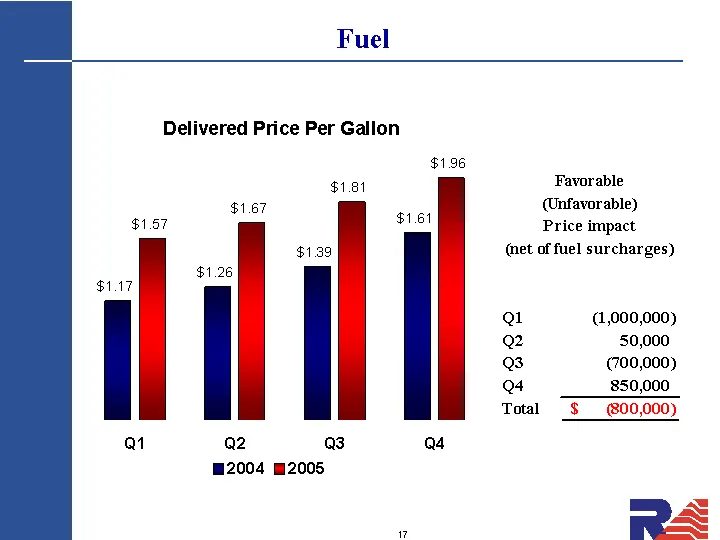
Fuel Q1 Q2 Q3 Q4 2004 1.17 1.26 1.39 1.61 2005 1.57 1.67 1.81 1.96
Slide 18: Financial Highlights: Consolidated Balance Sheet Summary
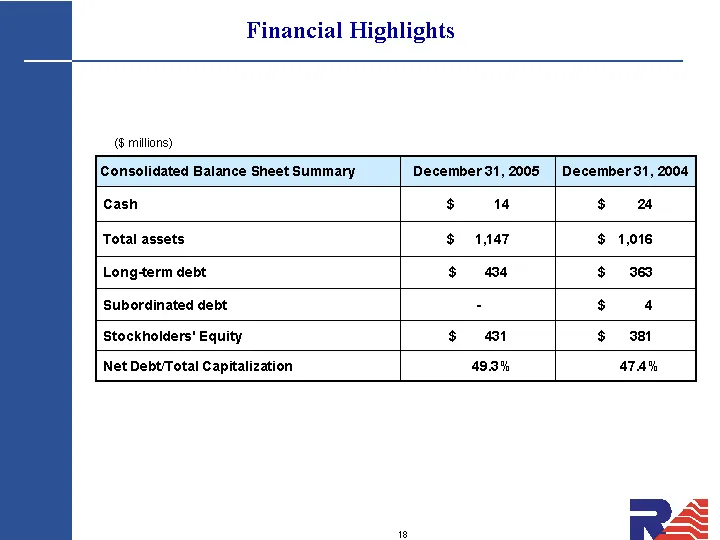
Financial Highlights ($ millions) Consolidated Balance Sheet Summary December 31, 2005 December 31, 2004 Cash $ 14 $ 24 Total assets $ 1,147 $ 1,016 Long-term debt $ 434 $ 363 Subordinated debt - $ 4 Stockholders' Equity $ 431 $ 381 Net Debt/Total Capitalization 49.3% 47.4%
Slide 19: Capital Structure: Net Debt-to-Capital
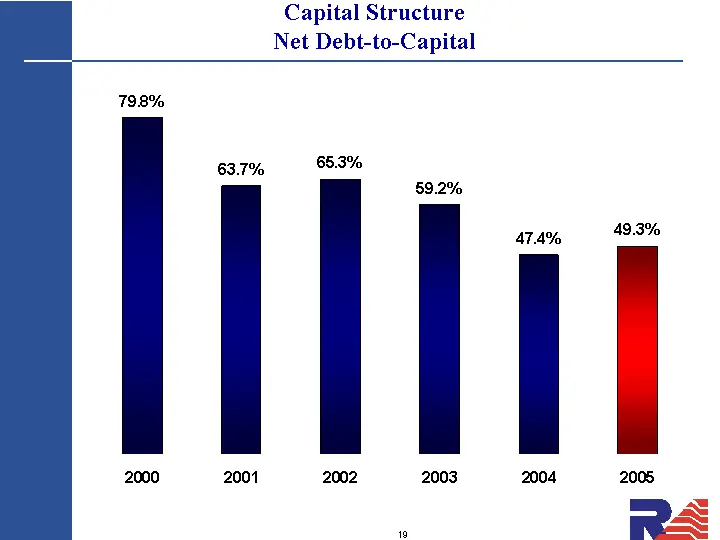
Capital Structure Net Debt-to-Capital 2000 2001 2002 2003 2004 2005 Net Debt to Capital 0.798 0.637 0.653 0.592 0.474 0.493
Slide 20: RailAmerica Summary
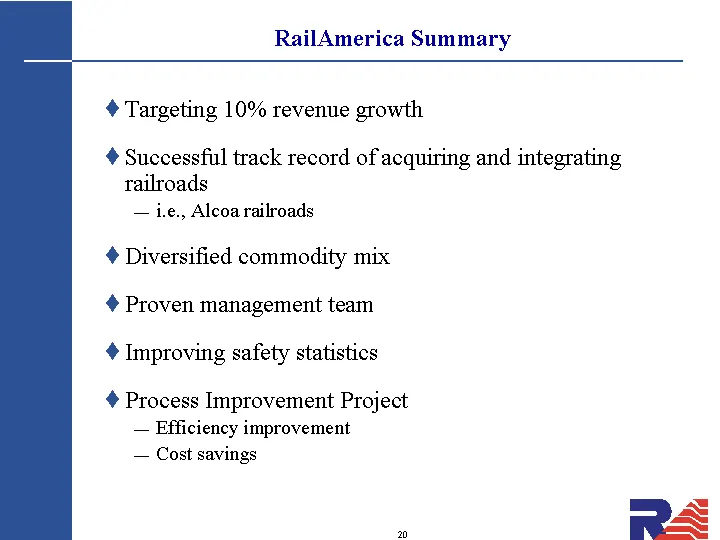
RailAmerica Summary Targeting 10% revenue growth Successful track record of acquiring and integrating railroads i.e., Alcoa railroads Diversified commodity mix Proven management team Improving safety statistics Process Improvement Project Efficiency improvement Cost savings
Slide 21: RailAmerica, Inc. BB&T Transportation Services Conference
RailAmerica, Inc. BB&T Transportation Services Conference February 15, 2006
Source: SEC EDGAR · 8-K filed Feb 15, 2006
More decks from Railamerica Inc
 Q2 2012 Earnings Presentation25 slides · Jul 25, 2012
 Q1 2012 Earnings Presentation29 slides · Apr 26, 2012
 Q4 2011 Earnings Presentation33 slides · Feb 9, 2012
 Q3 2011 Earnings Presentation28 slides · Oct 26, 2011
 Q2 2011 Earnings Presentation27 slides · Jul 28, 2011
 Q1 2011 Earnings Presentation28 slides · Apr 28, 2011