Railamerica — Q4 2004 Earnings Presentation
19 slides from Railamerica's earnings presentation, Feb 16, 2005
Slide 1: Fourth Quarter 2004 Financial Results
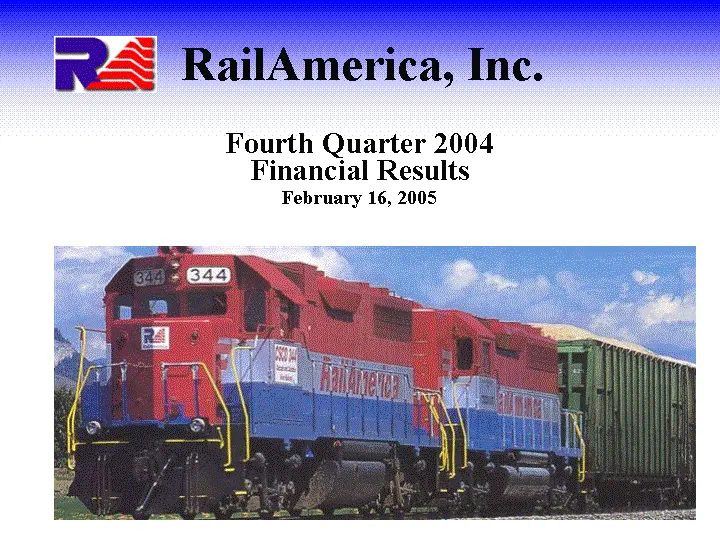
RailAmerica, Inc. Fourth Quarter 2004 Financial Results February 16, 2005
Slide 2: Forward Looking Statements and Forecasts
Forward Looking Statements and Forecasts This presentation contains forward-looking statements, forecasts, and information regarding future events and the future performance of RailAmerica that involve risks and uncertainties that could cause actual results and actions to differ materially, includin
Slide 3: Charles Swinburn, Chief Executive Officer
Charles Swinburn Chief Executive Officer
Slide 4: Earnings Per Share Continuing Operations
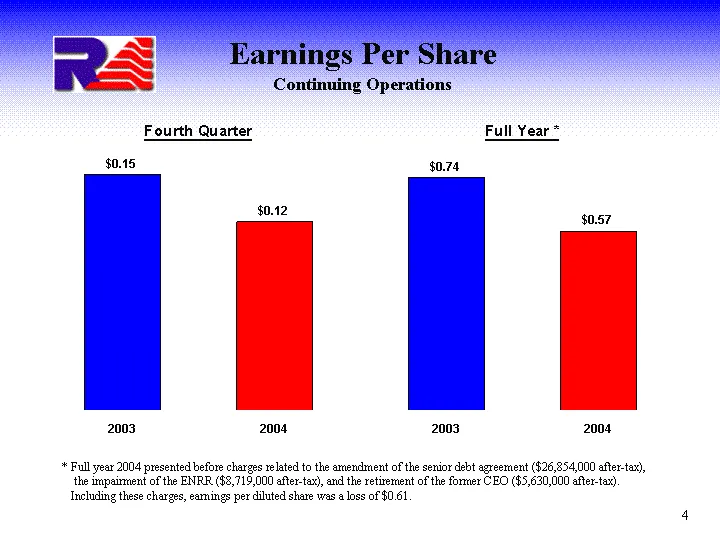
Earnings Per Share Continuing Operations 2003 2004 EPS 0.15 0.12 2003 2004 EPS 0.74 0.57 * Full year 2004 presented before charges related to the amendment of the senior debt agreement ($26,854,000 after-tax), the impairment of the ENRR ($8,719,000 after-tax), and the retirement of the former CEO ($
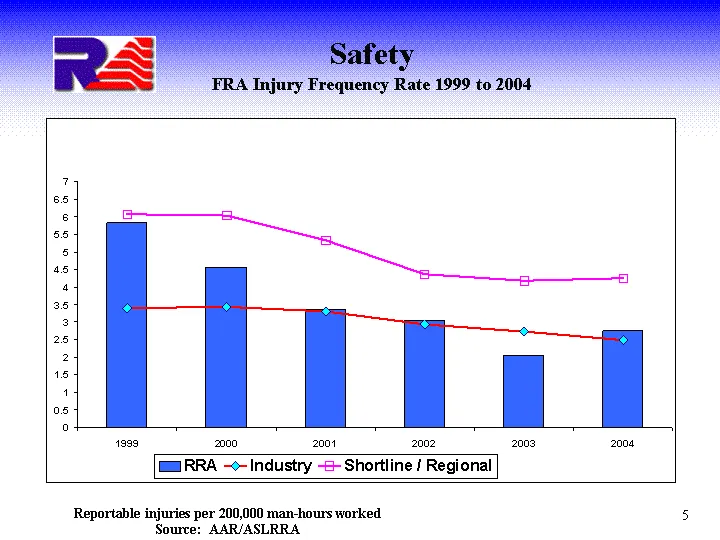
Slide 5: Safety: FRA Injury Frequency Rate 1999 to 2004
Safety FRA Injury Frequency Rate 1999 to 2004 Reportable injuries per 200,000 man-hours worked Source: AAR/ASLRRA
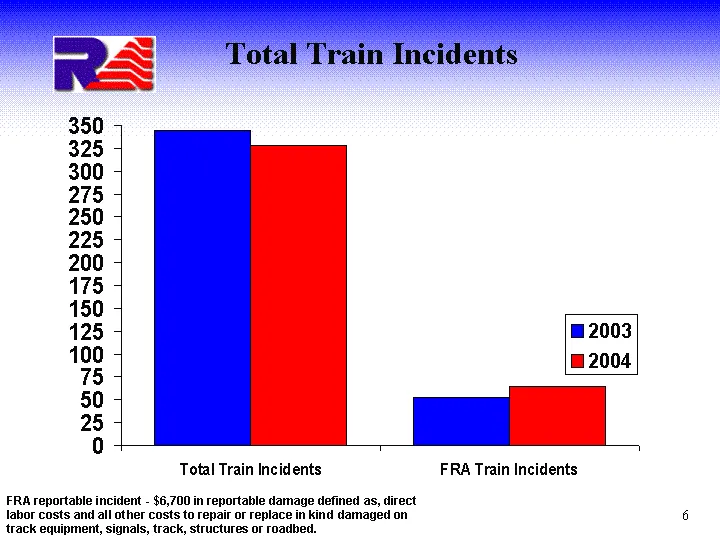
Slide 6: Total Train Incidents
Total Train Incidents Total Train Incidents FRA Train Incidents 2003 344 52 2004 328 65 FRA reportable incident - $6,700 in reportable damage defined as, direct labor costs and all other costs to repair or replace in kind damaged on track equipment, signals, track, structures or roadbed.
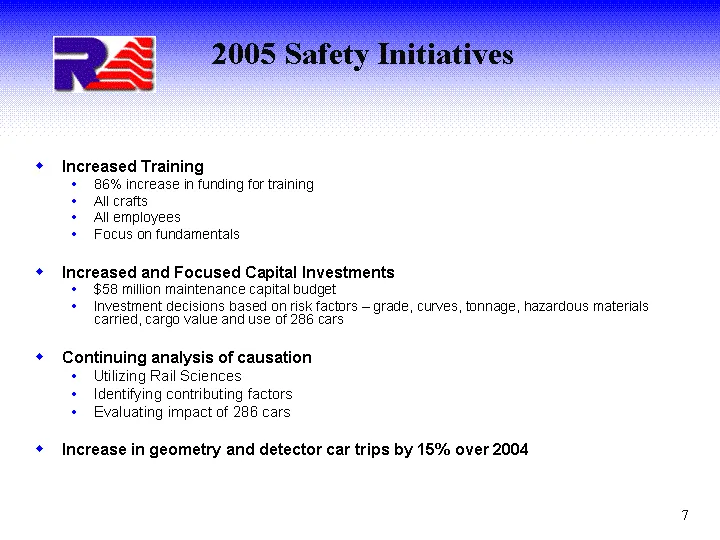
Slide 7: 2005 Safety Initiatives
2005 Safety Initiatives Increased Training 86% increase in funding for training All crafts All employees Focus on fundamentals Increased and Focused Capital Investments $58 million maintenance capital budget Investment decisions based on risk factors - grade, curves, tonnage, hazardous materials car
Slide 8: Michael J. Howe, Executive Vice President and Chief Financial Officer
Michael J. Howe Executive Vice President and Chief Financial Officer
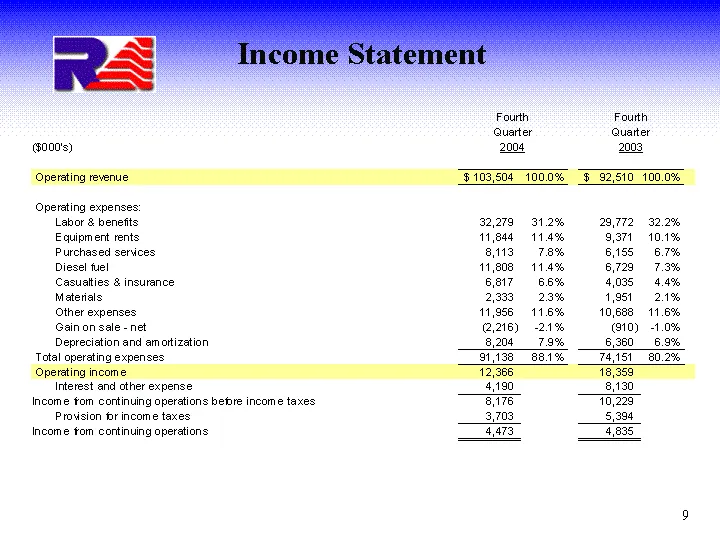
Slide 9: Fourth Quarter Income Statement
Fourth Fourth Quarter Quarter goons) 2004, 2003 Operating expenses: Labor & benefits 2279 2% «© 29,772 32.2% Equipment rents 11,844 11.4% 9am 10.1% Purchased services B13 7.8% 6158 6.7% Diesel tuel 11808 11.4% 6728 7.3% Casuatties & insurance 6aI7 6.6% 4.098 4.4% Materials 2.933 23% 1981 2.1% Other
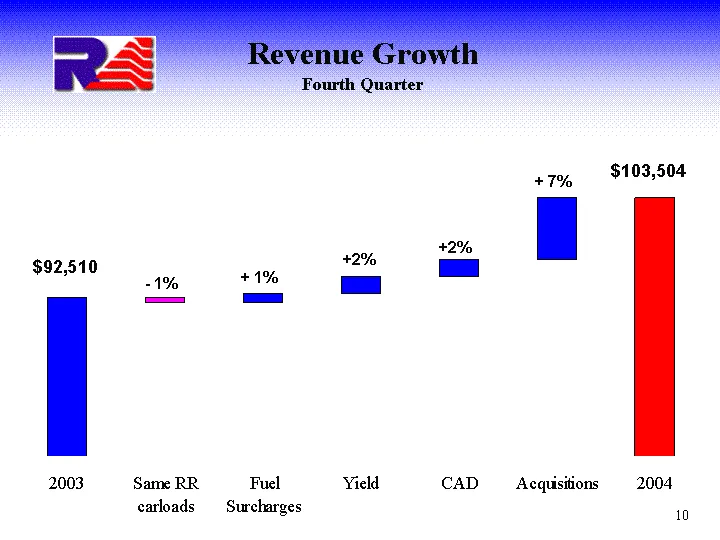
Slide 10: Revenue Growth Fourth Quarter
Revenue Growth Fourth Quarter 2003 Same RR carloads Fuel Surcharges Yield CAD Acquisitions 2004 X 92510 91949 91949 92950 94896 96666 103504 Y 561 1001 1946 1770 6838 - - 1% + 1% +2% + 7% +2%
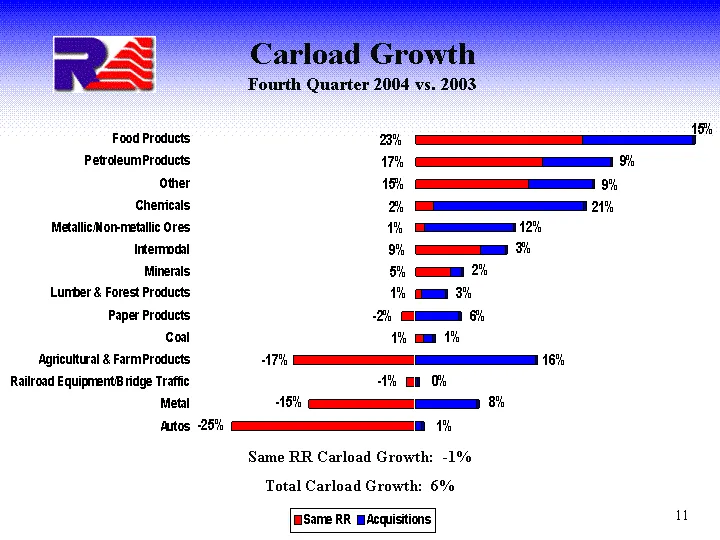
Slide 11: Carload Growth Fourth Quarter 2004 vs. 2003
Carload Growth Fourth Quarter 2004 vs. 2003 Same RR Carload Growth: -1% Total Carload Growth: 6%
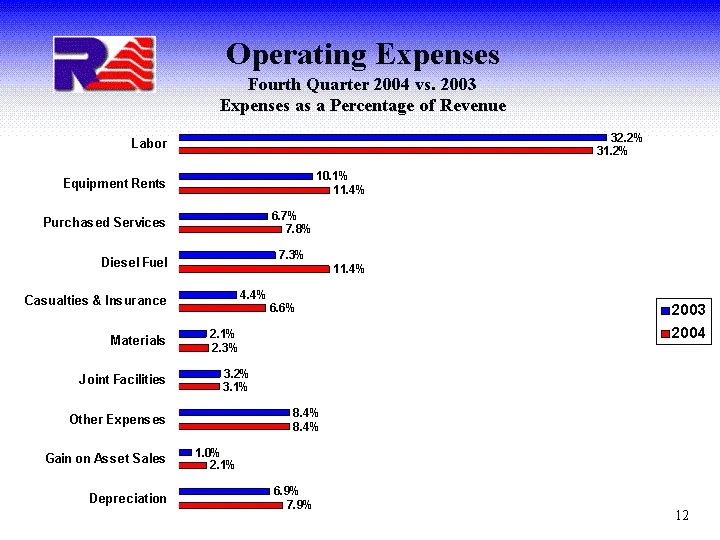
Slide 12: Operating Expenses Fourth Quarter 2004 vs. 2003
Operating Expenses Fourth Quarter 2004 vs. 2003 Expenses as a Percentage of Revenue Depreciation Gain on Asset Sales Other Expenses Joint Facilities Materials Casualties & Insurance Diesel Fuel Purchased Services Equipment Rents Labor 2004 0.079 0.021 0.084 0.031 0.023 0.066 0.114 0.078 0.114 0.312
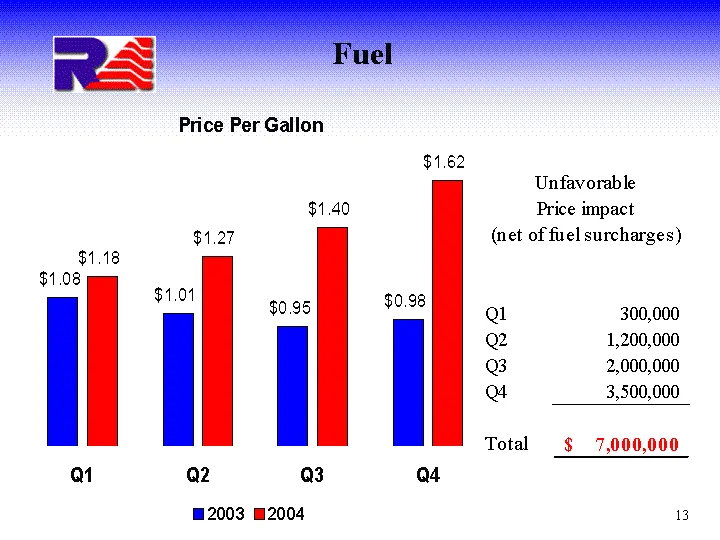
Slide 13: Fuel
Fuel Q1 Q2 Q3 Q4 2003 1.08 1.01 0.95 0.98 2004 1.18 1.27 1.4 1.62
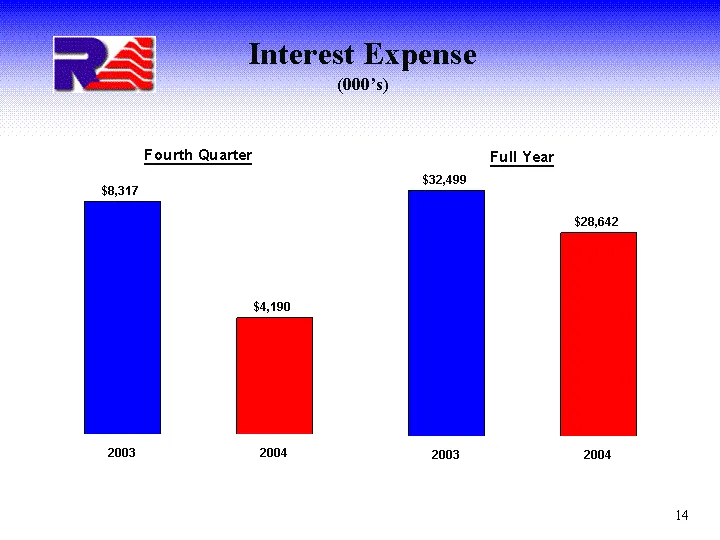
Slide 14: Interest Expense
Interest Expense (000's) 2003 2004 Interest Expense 8317 4190 2003 2004 EPS 32499 28642
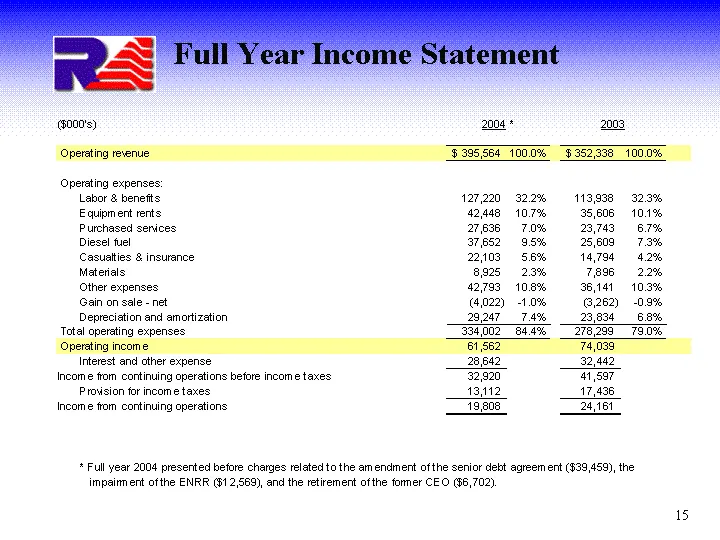
Slide 15: Full Year Income Statement
Me 000s) 2004 + Operating revenue F505 564 100.0% Operating expenses: Labor & benetts 127220 32.2% Equipment rents 42448 10.7% Purchased senices 27838 7.0% Diese! tue! 37852 85% Casuaties & insurance 22403 56% Materials 8925 2.3% Other expenses 42793 108% Gain on sale - net (4022) 1.0% Depreciation
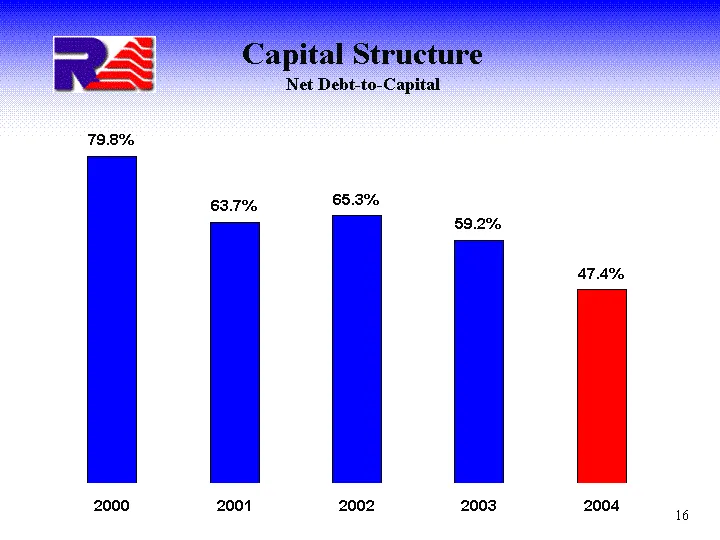
Slide 16: Capital Structure: Net Debt-to-Capital
Capital Structure Net Debt-to-Capital 2000 2001 2002 2003 2004 Net Debt to Capital 0.798 0.637 0.653 0.592 0.474
Slide 17: 2005 Outlook
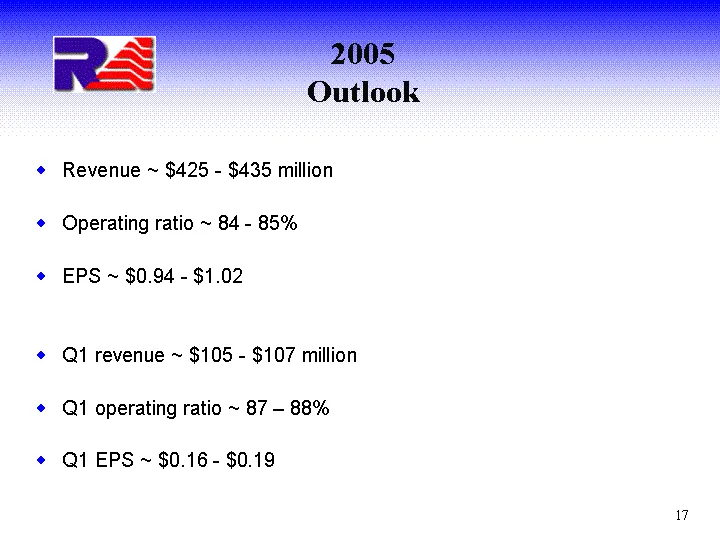
2005 Outlook Revenue ~ $425 - $435 million Operating ratio ~ 84 - 85% EPS ~ $0.94 - $1.02 Q1 revenue ~ $105 - $107 million Q1 operating ratio ~ 87 - 88% Q1 EPS ~ $0.16 - $0.19
Slide 18: Charles Swinburn, Chief Executive Officer
Charles Swinburn Chief Executive Officer
Slide 19: Recap
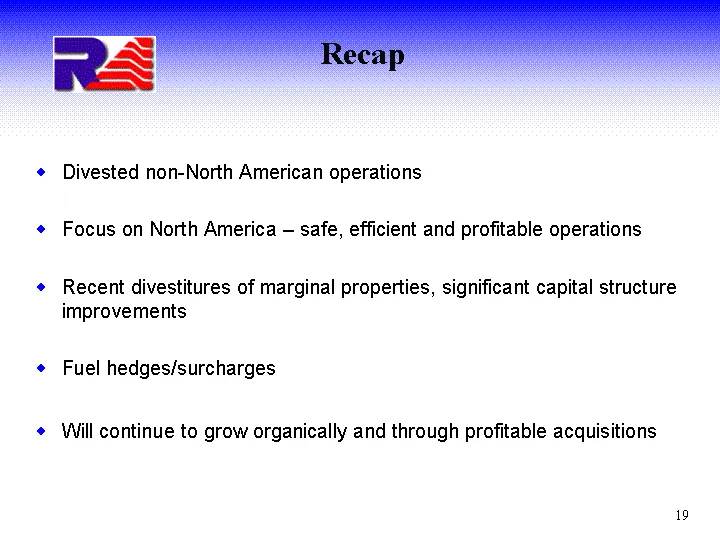
Recap Divested non-North American operations Focus on North America - safe, efficient and profitable operations Recent divestitures of marginal properties, significant capital structure improvements Fuel hedges/surcharges Will continue to grow organically and through profitable acquisitions
Source: SEC EDGAR · 8-K filed Feb 16, 2005
More decks from Railamerica Inc
 Q2 2012 Earnings Presentation25 slides · Jul 25, 2012
 Q1 2012 Earnings Presentation29 slides · Apr 26, 2012
 Q4 2011 Earnings Presentation33 slides · Feb 9, 2012
 Q3 2011 Earnings Presentation28 slides · Oct 26, 2011
 Q2 2011 Earnings Presentation27 slides · Jul 28, 2011
 Q1 2011 Earnings Presentation28 slides · Apr 28, 2011