Railamerica — Q2 2010 Earnings Presentation
30 slides from Railamerica's earnings presentation, Jul 29, 2010
Slide 1: Second Quarter 2010 Earnings Conference Call
RailAmerica, Inc. Second Quarter 2010 Earnings Conference Call July 29, 2010
Slide 2: Forward-looking statements
2 Certain items in this presentation and other information we provide from time to time may constitute forward-looking statements within the meaning of the Private Securities Litigation Reform Act of 1995 including, but not necessarily limited to, statements relating to future events and financial p
Slide 3: Executive Summary
3 Executive Summary John Giles, President and Chief Executive Officer
Slide 4: Second Quarter 2010 Overview
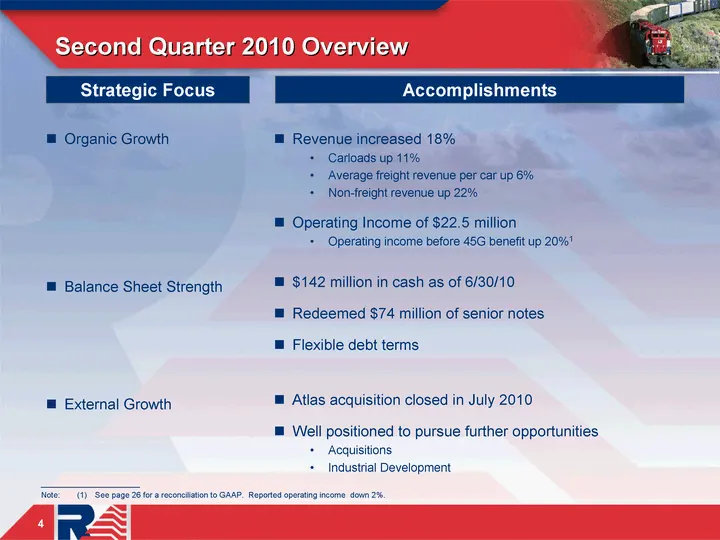
Second Quarter 2010 Overview 4 Strategic Focus Accomplishments Organic Growth Balance Sheet Strength External Growth Revenue increased 18% Carloads up 11% Average freight revenue per car up 6% Non-freight revenue up 22% Operating Income of $22.5 million Operating income before 45G benefit up 20%1 $1
Slide 5: Second Quarter 2010 Revenue
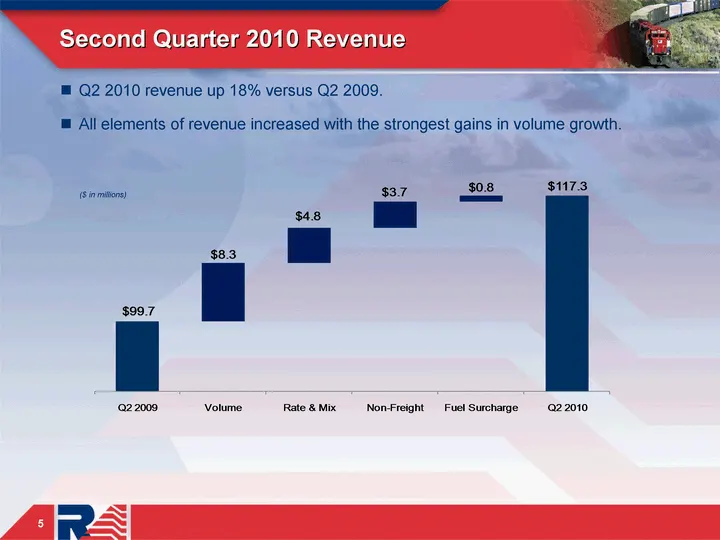
Second Quarter 2010 Revenue 5 Q2 2010 revenue up 18% versus Q2 2009. All elements of revenue increased with the strongest gains in volume growth. ($ in millions)
Slide 6: Second Quarter 2010 Carloads
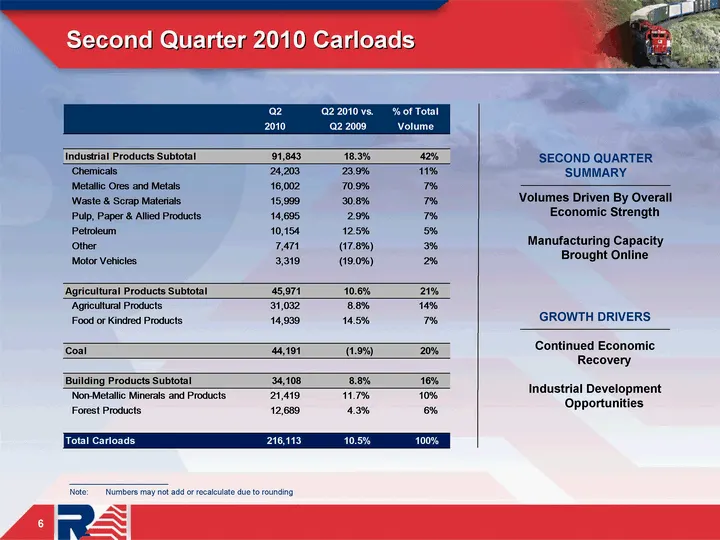
6 Second Quarter 2010 Carloads 6 ______________________ Note: Numbers may not add or recalculate due to rounding SECOND QUARTER SUMMARY Volumes Driven By Overall Economic Strength Manufacturing Capacity Brought Online GROWTH DRIVERS Continued Economic Recovery Industrial Development Opportunities
Slide 7: Average Freight Revenue Per Carload
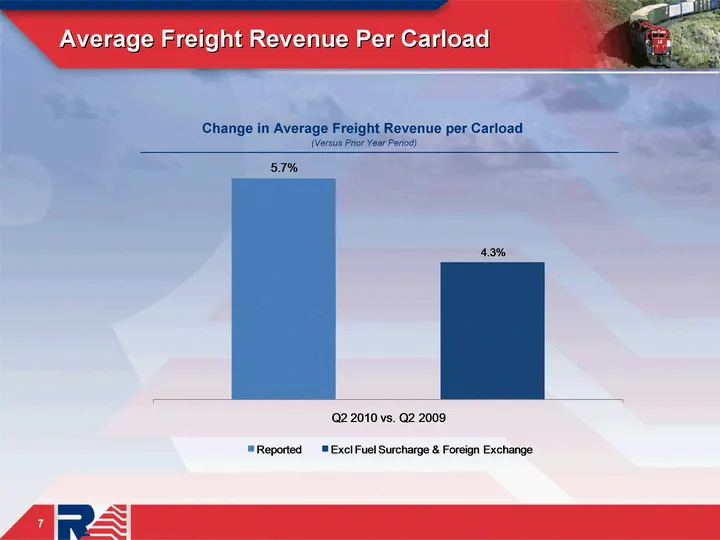
Average Freight Revenue Per Carload 7 Change in Average Freight Revenue per Carload (Versus Prior Year Period)
Slide 8: Second Quarter 2010 Non-Freight Revenue
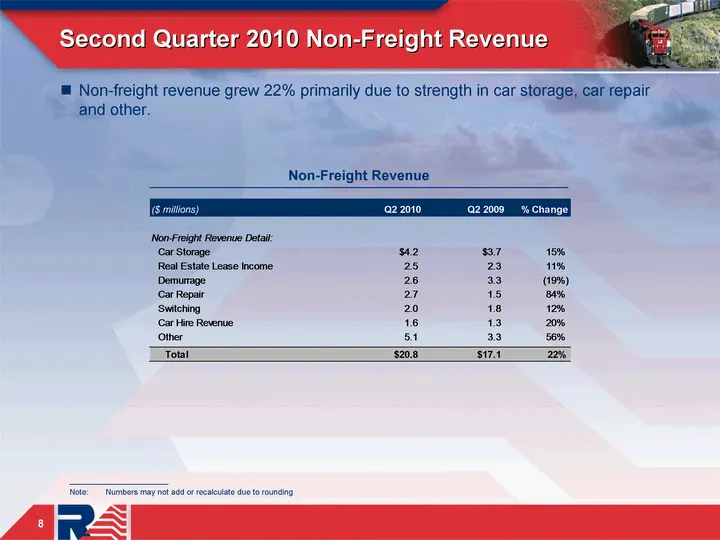
Second Quarter 2010 Non-Freight Revenue 8 Non-Freight Revenue ______________________ Note: Numbers may not add or recalculate due to rounding Non-freight revenue grew 22% primarily due to strength in car storage, car repair and other.
Slide 9: Second Quarter Operating Ratio
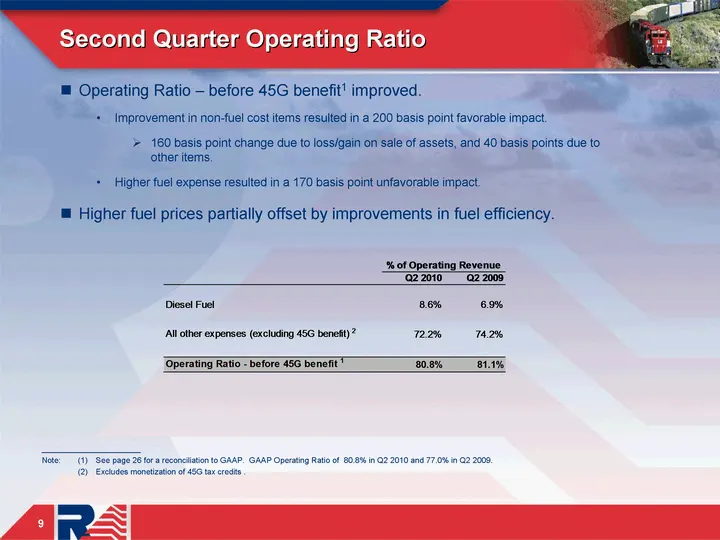
Second Quarter Operating Ratio 9 Operating Ratio - before 45G benefit1 improved. Improvement in non-fuel cost items resulted in a 200 basis point favorable impact. 160 basis point change due to loss/gain on sale of assets, and 40 basis points due to other items. Higher fuel expense resulted in a 170
Slide 10: Productivity
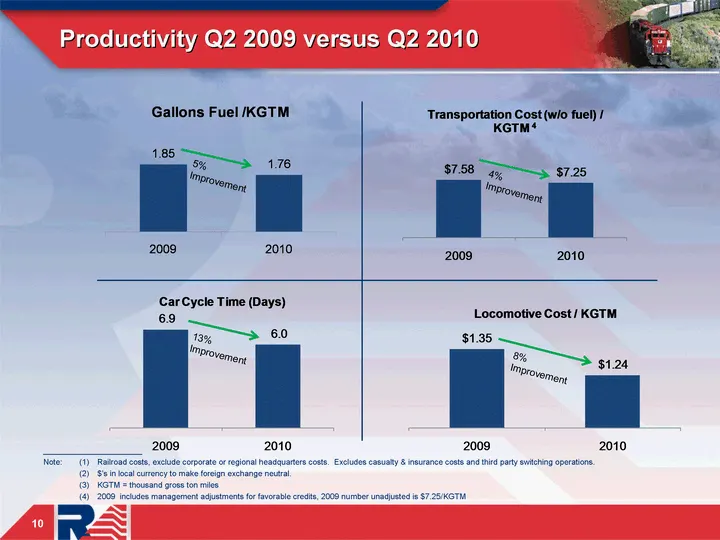
Productivity Q2 2009 versus Q2 2010 10 5% Improvement 13% Improvement 8% Improvement ______________________ Note: (1) Railroad costs, exclude corporate or regional headquarters costs. Excludes casualty & insurance costs and third party switching operations. (2) $'s in local currency to make foreign
Slide 11: Safety Performance
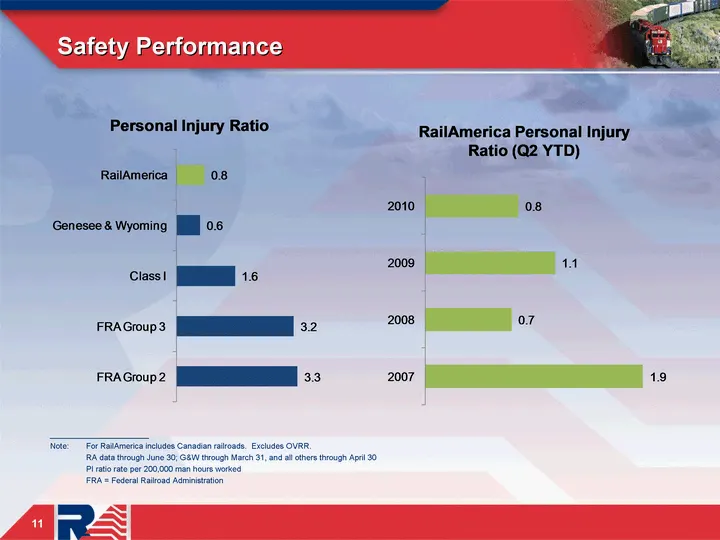
Safety Performance ______________________ Note: For RailAmerica includes Canadian railroads. Excludes OVRR. RA data through June 30; G&W through March 31, and all others through April 30 PI ratio rate per 200,000 man hours worked FRA = Federal Railroad Administration 11
Slide 12: Safety Performance
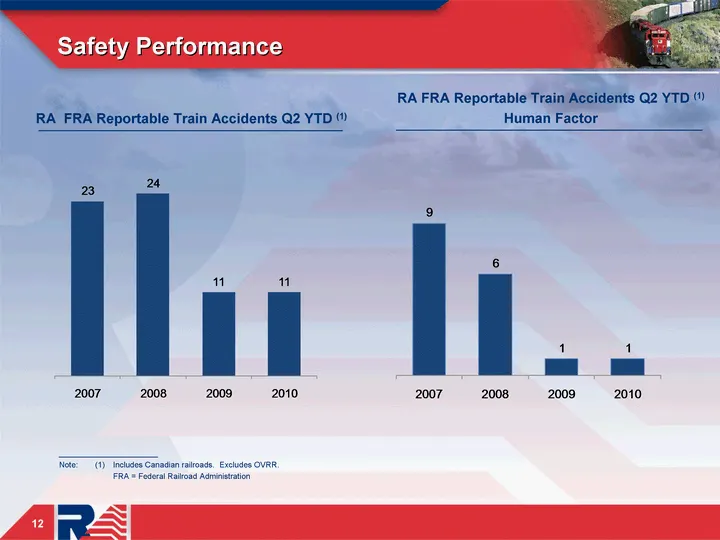
Safety Performance 12 RA FRA Reportable Train Accidents Q2 YTD (1) Human Factor RA FRA Reportable Train Accidents Q2 YTD (1) ______________________ Note: (1) Includes Canadian railroads. Excludes OVRR. FRA = Federal Railroad Administration
Slide 13: Productivity Initiatives
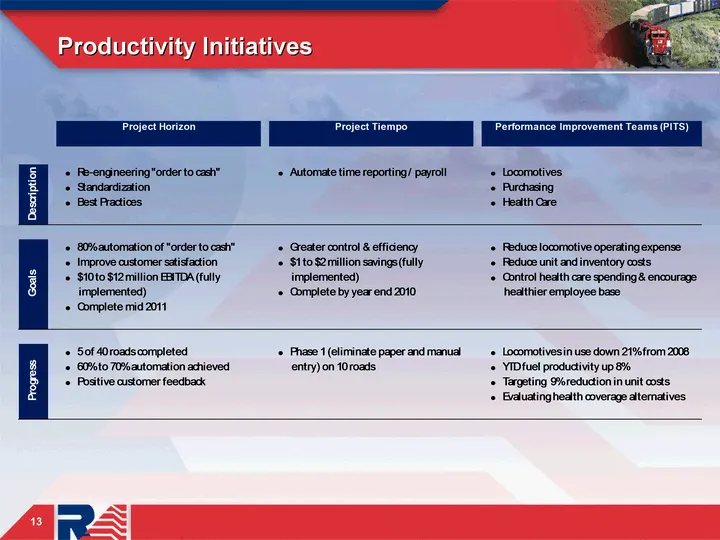
13 Productivity Initiatives
Slide 14: Atlas Acquisition
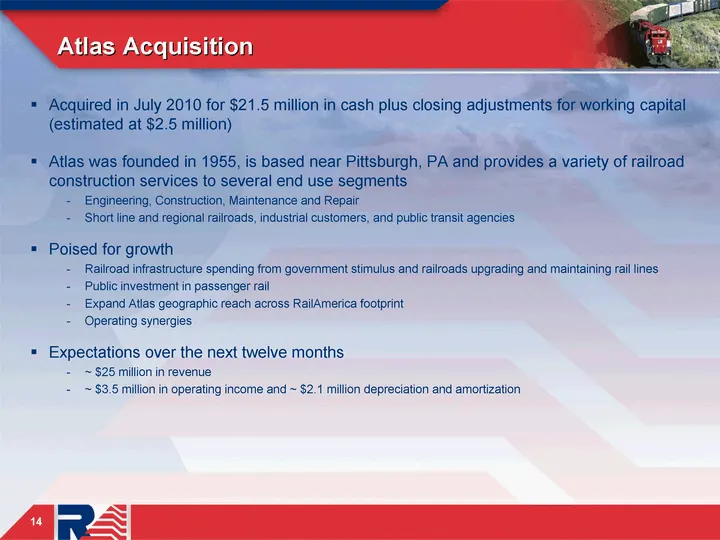
Acquired in July 2010 for $21.5 million in cash plus closing adjustments for working capital (estimated at $2.5 million) Atlas was founded in 1955, is based near Pittsburgh, PA and provides a variety of railroad construction services to several end use segments Engineering, Construction, Maintenance
Slide 15: Strategic Focus
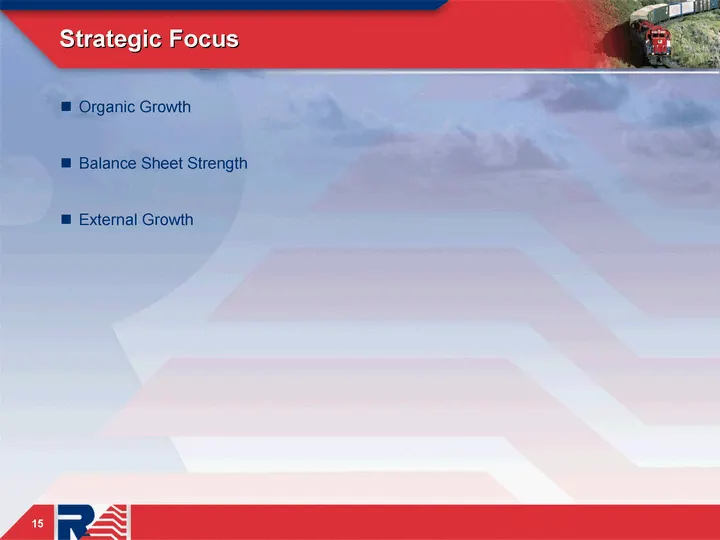
Strategic Focus 15 Organic Growth Balance Sheet Strength External Growth
Slide 16: Second Quarter 2010 Financial Review
16 Second Quarter 2010 Financial Review Clyde Preslar, Chief Financial Officer
Slide 17: Second Quarter 2010 Results Compared to Prior Year
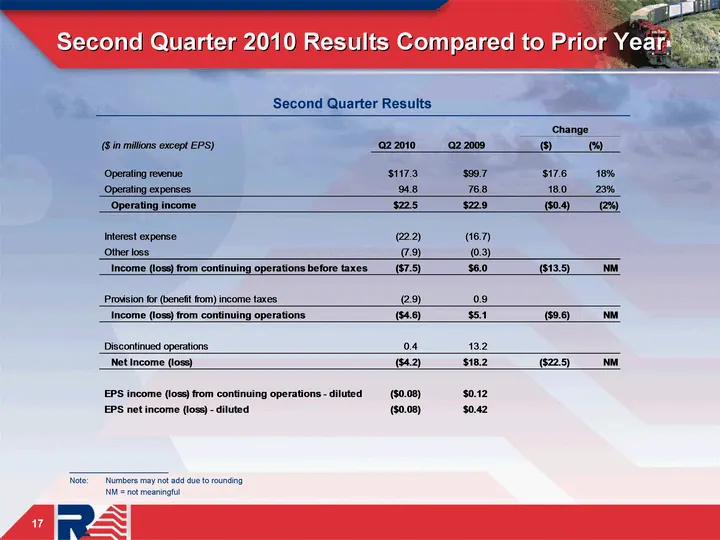
17 Second Quarter 2010 Results Compared to Prior Year 17 Second Quarter Results ______________________ Note: Numbers may not add due to rounding NM = not meaningful
Slide 18: Second Quarter 2010 Selected Items
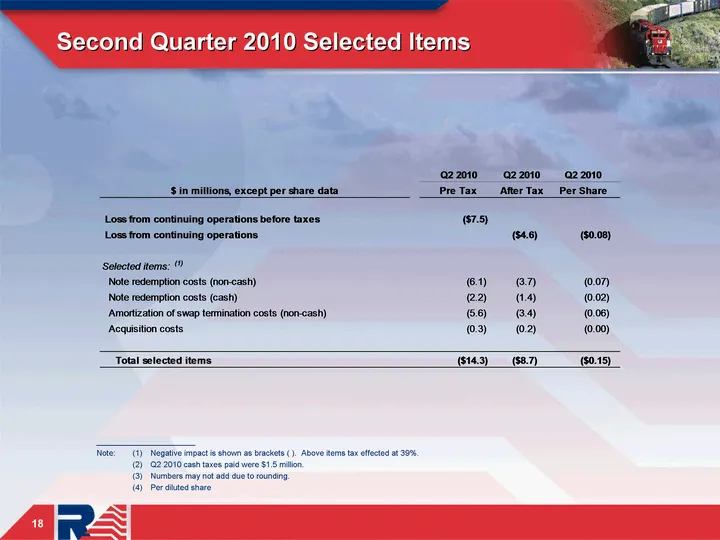
18 Second Quarter 2010 Selected Items 18 ______________________ Note: (1) Negative impact is shown as brackets ( ). Above items tax effected at 39%. (2) Q2 2010 cash taxes paid were $1.5 million. (3) Numbers may not add due to rounding. (4) Per diluted share
Slide 19: Second Quarter 2010 Detailed Results Compared to Prior Year
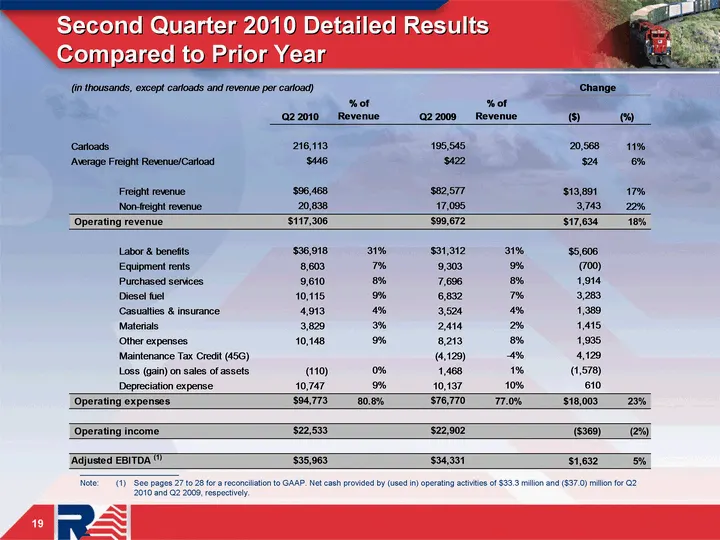
19 19 Second Quarter 2010 Detailed Results Compared to Prior Year ______________________ Note: (1) See pages 27 to 28 for a reconciliation to GAAP. Net cash provided by (used in) operating activities of $33.3 million and ($37.0) million for Q2 2010 and Q2 2009, respectively.
Slide 20: Capital Expenditures
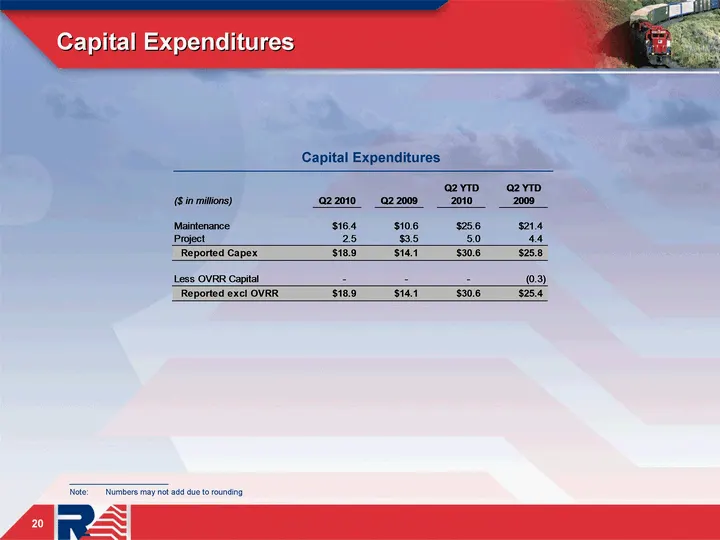
20 Capital Expenditures 20 Capital Expenditures ______________________ Note: Numbers may not add due to rounding
Slide 21: Capitalization
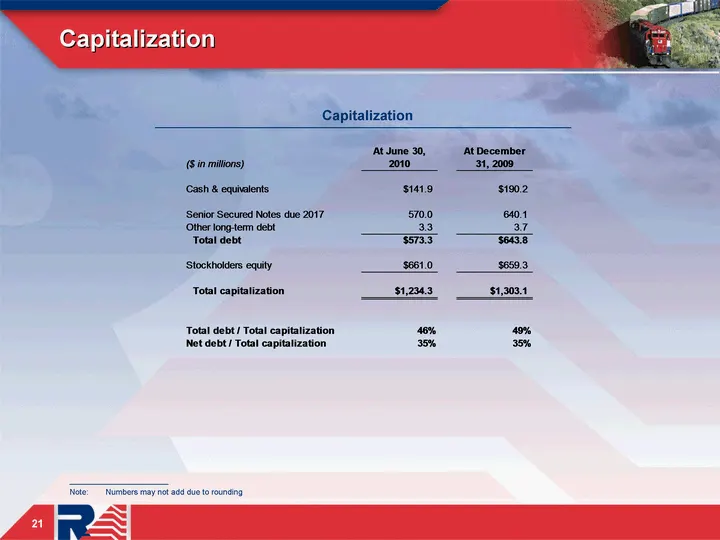
Capitalization 21 Capitalization ______________________ Note: Numbers may not add due to rounding
Slide 22: Q3 and FY 2010 Estimates
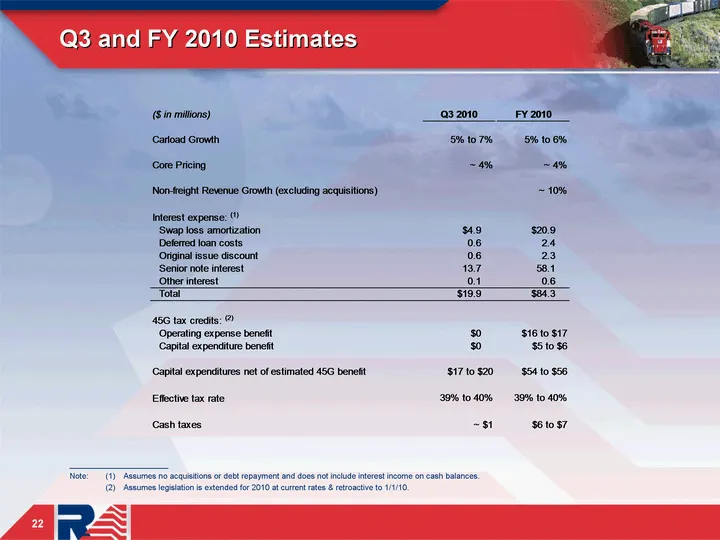
Q3 and FY 2010 Estimates 22 ______________________ Note: (1) Assumes no acquisitions or debt repayment and does not include interest income on cash balances. (2) Assumes legislation is extended for 2010 at current rates & retroactive to 1/1/10.

Slide 23: 23
23
Slide 24: Appendix
24 Appendix
Slide 25: Swap Amortization
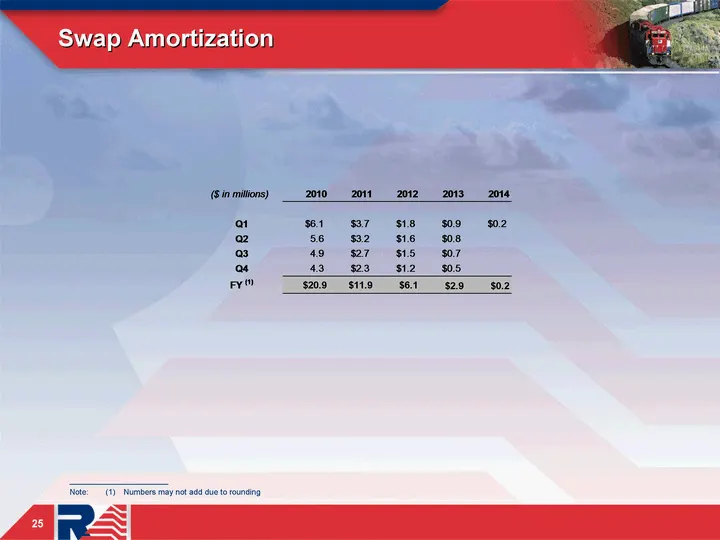
Swap Amortization ______________________ Note: (1) Numbers may not add due to rounding 25
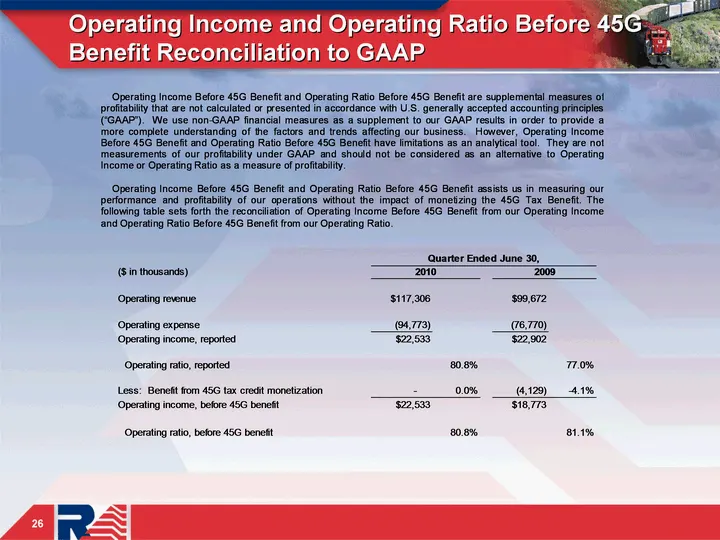
Slide 26: Operating Income and Operating Ratio Before 45G Benefit Reconciliation to GAAP
26 Operating Income and Operating Ratio Before 45G Benefit Reconciliation to GAAP 26
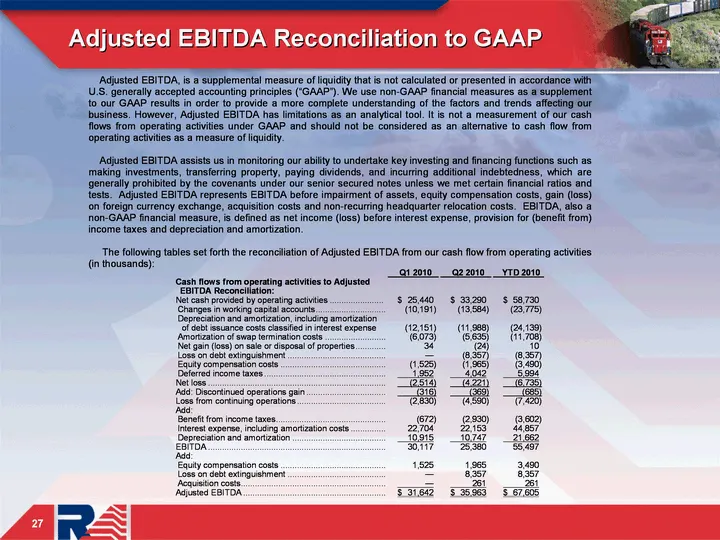
Slide 27: Adjusted EBITDA Reconciliation to GAAP
27 Adjusted EBITDA Reconciliation to GAAP 27
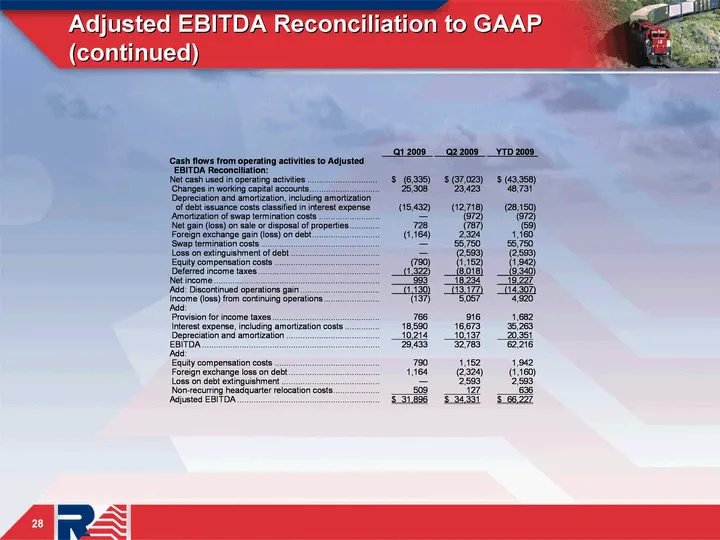
Slide 28: Adjusted EBITDA Reconciliation to GAAP (continued)
28 Adjusted EBITDA Reconciliation to GAAP (continued) 28
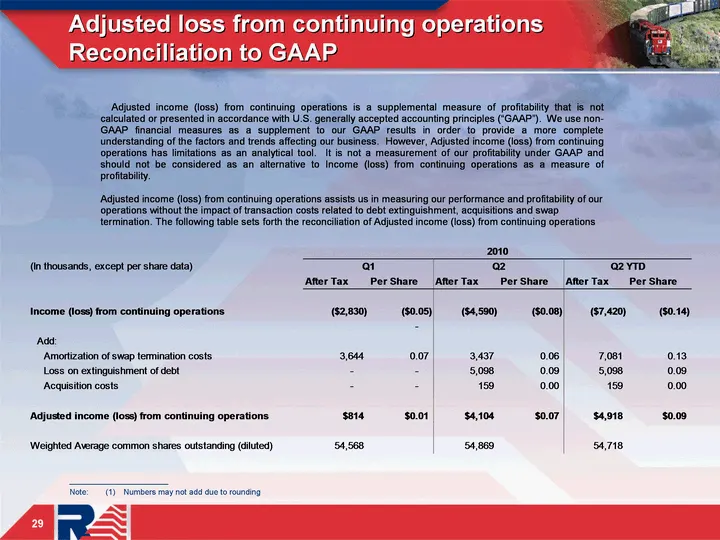
Slide 29: Adjusted loss from continuing operations Reconciliation to GAAP
29 Adjusted loss from continuing operations Reconciliation to GAAP 29 ______________________ Note: (1) Numbers may not add due to rounding
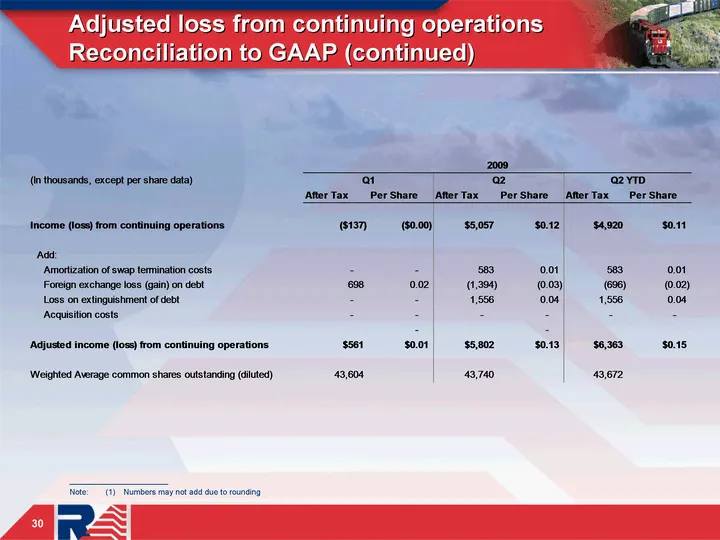
Slide 30: Adjusted loss from continuing operations Reconciliation to GAAP (continued)
30 Adjusted loss from continuing operations Reconciliation to GAAP (continued) 30 ______________________ Note: (1) Numbers may not add due to rounding
Source: SEC EDGAR · 8-K filed Jul 29, 2010
More decks from Railamerica Inc
 Q2 2012 Earnings Presentation25 slides · Jul 25, 2012
 Q1 2012 Earnings Presentation29 slides · Apr 26, 2012
 Q4 2011 Earnings Presentation33 slides · Feb 9, 2012
 Q3 2011 Earnings Presentation28 slides · Oct 26, 2011
 Q2 2011 Earnings Presentation27 slides · Jul 28, 2011
 Q1 2011 Earnings Presentation28 slides · Apr 28, 2011