Peoplein Limited · ASX:PPE
Peoplein — H1 FY2026 Earnings Presentation
23 slides from Peoplein's earnings presentation, Feb 20, 2026

Slide 1: Half Year Results Financial Year 2026
HALF YEAR RESULTS FINANCIAL YEAR 2026 SIMPLIFY WORKFORCE COMPLEXITY

Slide 2: Our Purpose
OUR PURPOSE TO INSPIRE EXCELLENCE IN OUR PEOPLE
Slide 3: Focused Business Growing Momentum
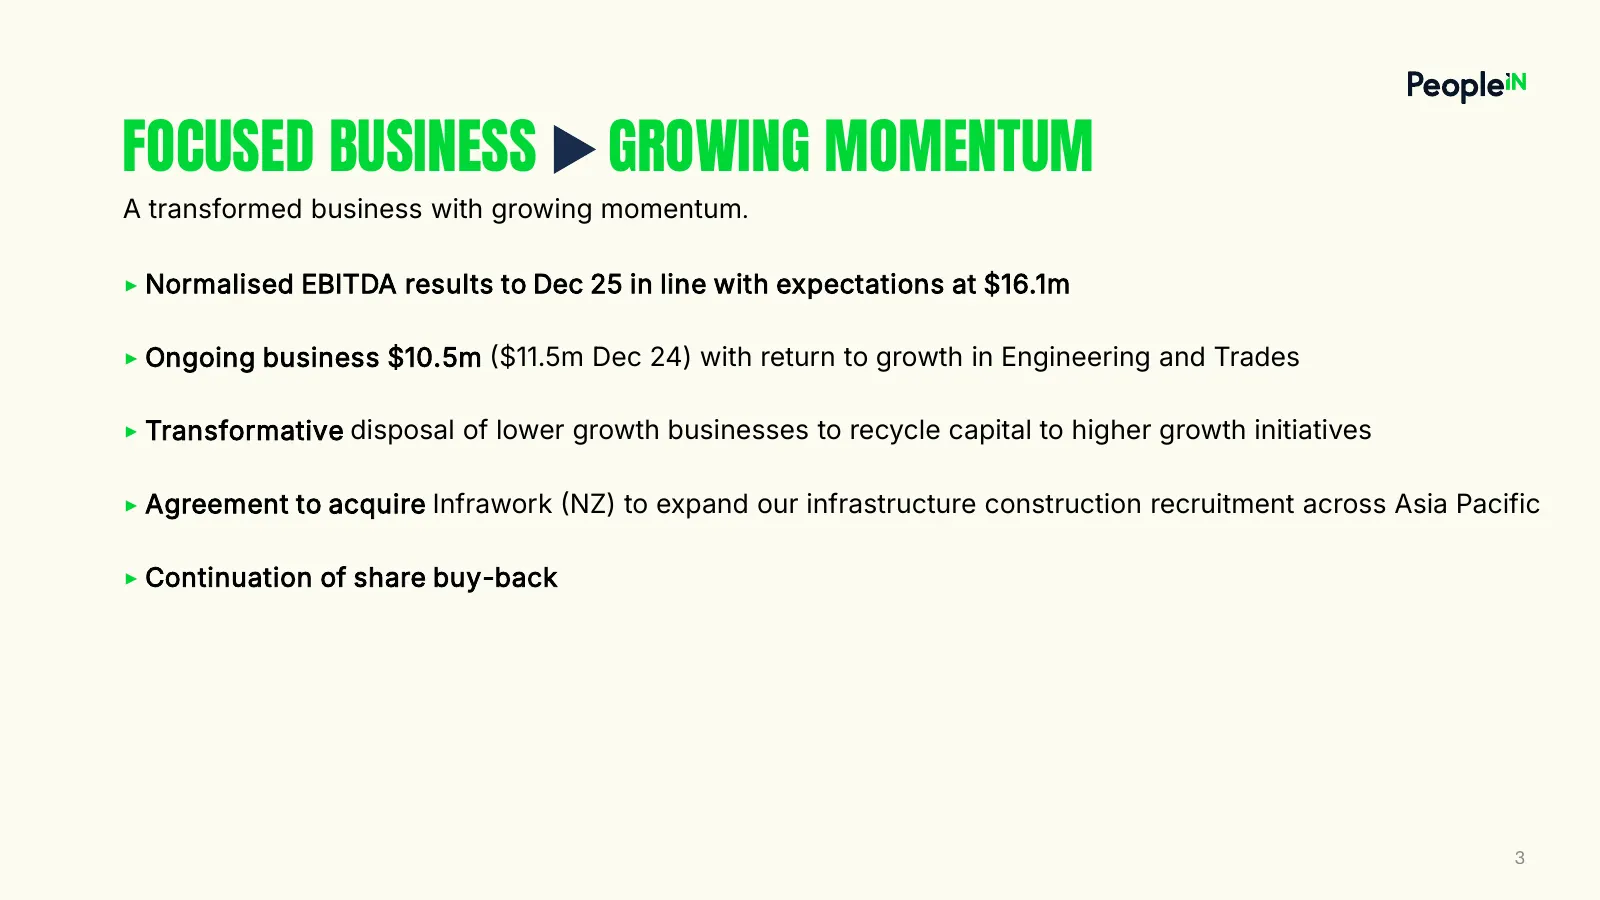
FOCUSED BUSINESS GROWING MOMENTUM A transformed business with growing momentum. ▶ Normalised EBITDA results to Dec 25 in line with expectations at $16.1m ▶ Ongoing business $10.5m $11.5m Dec 24) with return to growth in Engineering and Trades ▶ Transformative disposal of lower growth businesses to
Slide 4: Financial Performance
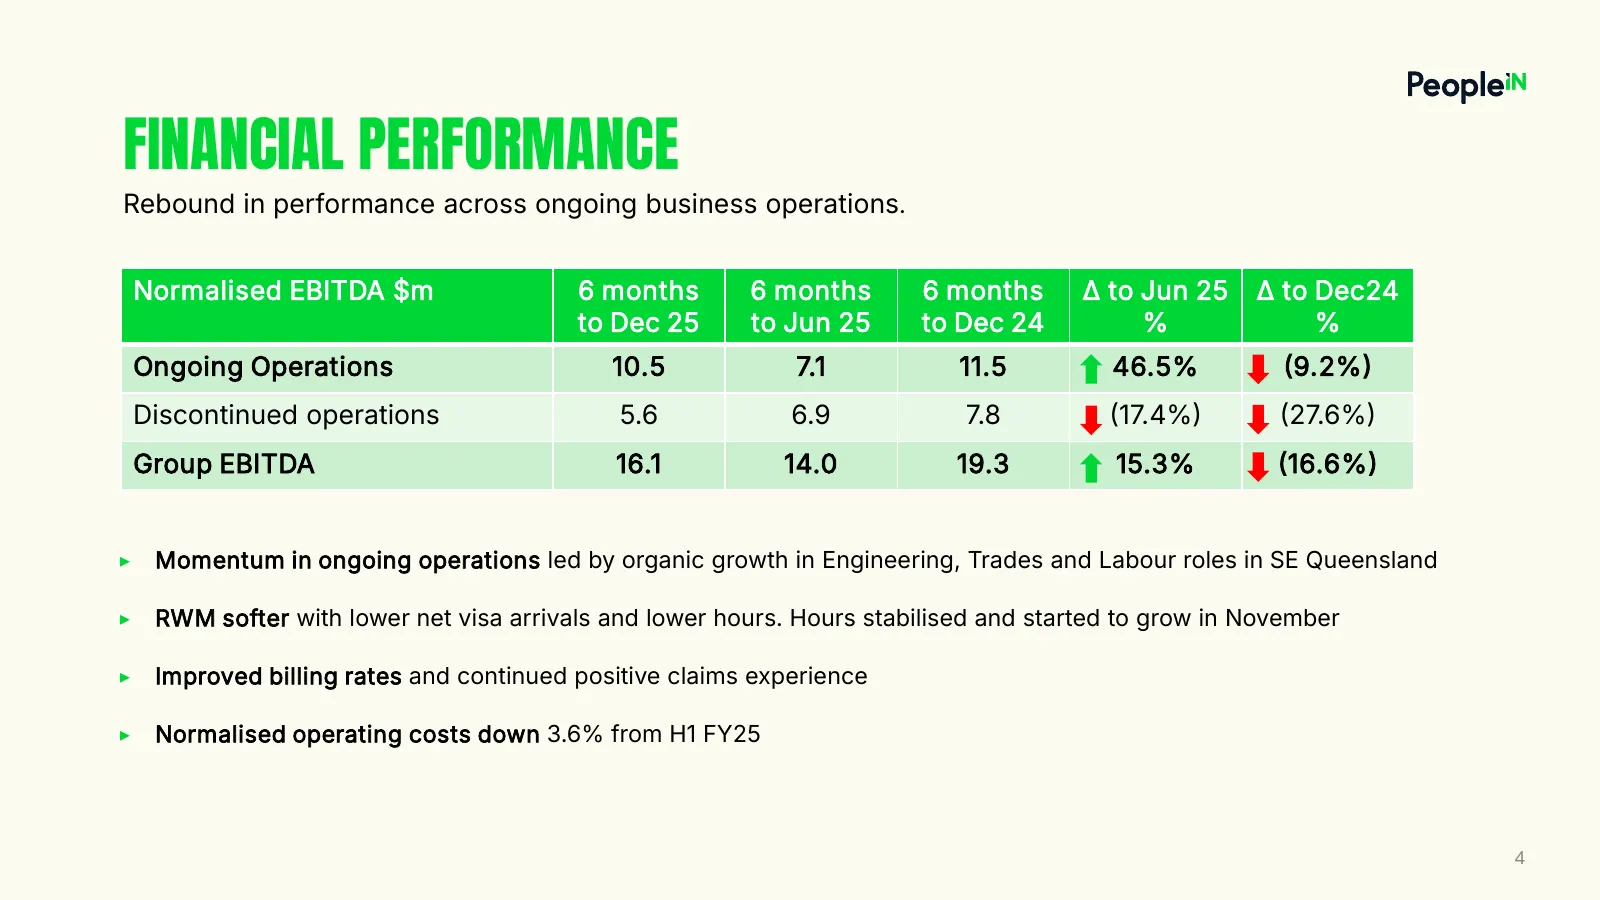
FINANCIAL PERFORMANCE Rebound in performance across ongoing business operations. Normalised EBITDA $m 6 months 6 months 6 months ∆ to Jun 25 ∆ to Dec24 to Dec 25 to Jun 25 to Dec 24 % % Ongoing Operations 10.5 7.1 11.5 46.5% 9.2% Discontinued operations 5.6 6.9 7.8 17.4% 27.6% Group EBITDA 16.
Slide 5: Momentum in Ongoing Business
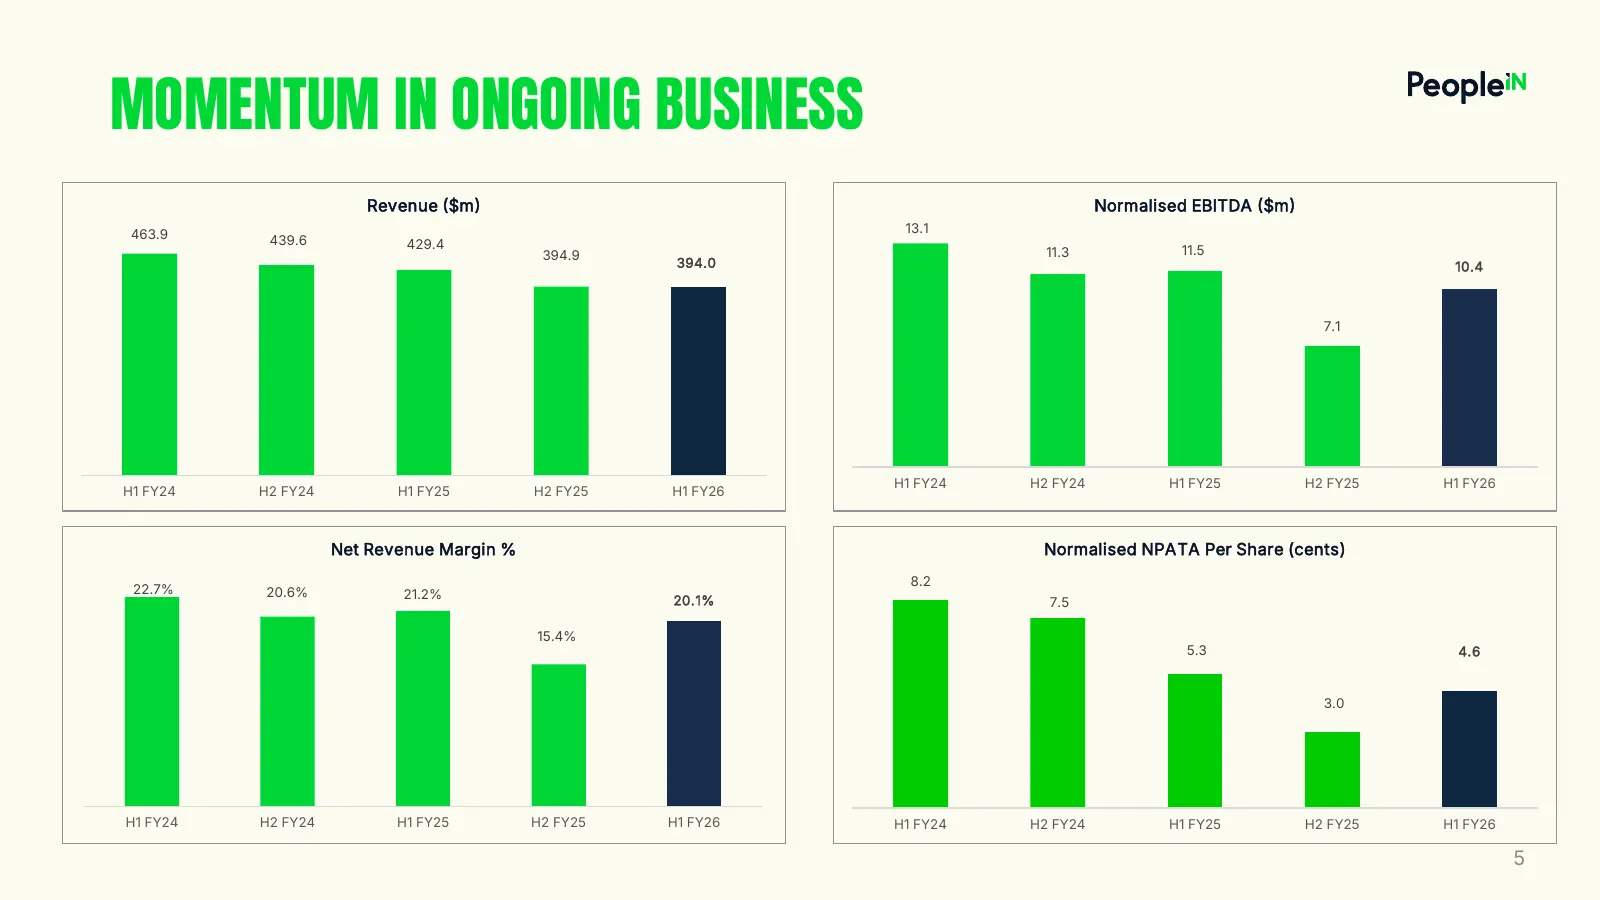
MOMENTUM IN ONGOING BUSINESS Revenue $m Normalised EBITDA $m 463.9 13.1 439.6 429.4 394.9 11.3 11.5 394.0 10.4 7.1 H1 FY24 H2 FY24 H1 FY25 H2 FY25 H1 FY26 H1 FY24 H2 FY24 H1 FY25 H2 FY25 H1 FY26 Net Revenue Margin % Normalised NPATA Per Share (cents) 8.2 22.7% 20.6% 21.2% 20.1% 7.5 15.4% 5.3 4.6
Slide 6: Financial Results Ongoing Operations
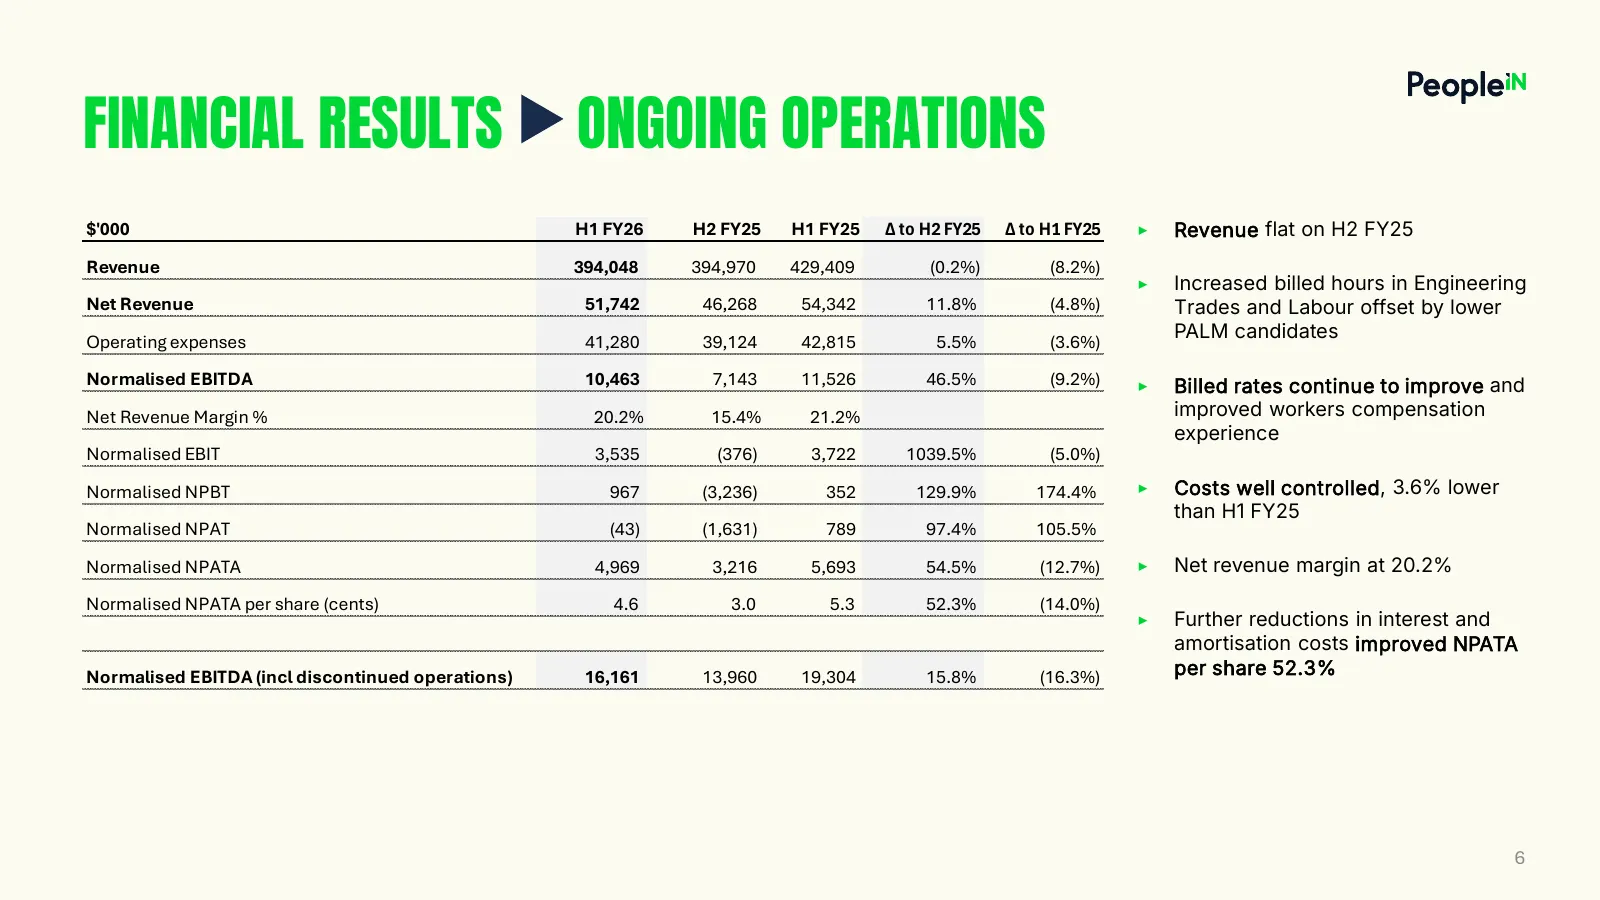
FINANCIAL RESULTS ONGOING OPERATIONS $'000 H1 FY26 H2 FY25 H1 FY25 Δ to H2 FY25 Δ to H1 FY25 ▶ Revenue flat on H2 FY25 Revenue 394,048 394,970 429,409 (0.2%) (8.2%) ▶ Increased billed hours in Engineering Net Revenue 51,742 46,268 54,342 11.8% (4.8%) Trades and Labour offset by lower Operating expen
Slide 7: Engineering, Trades and Labour
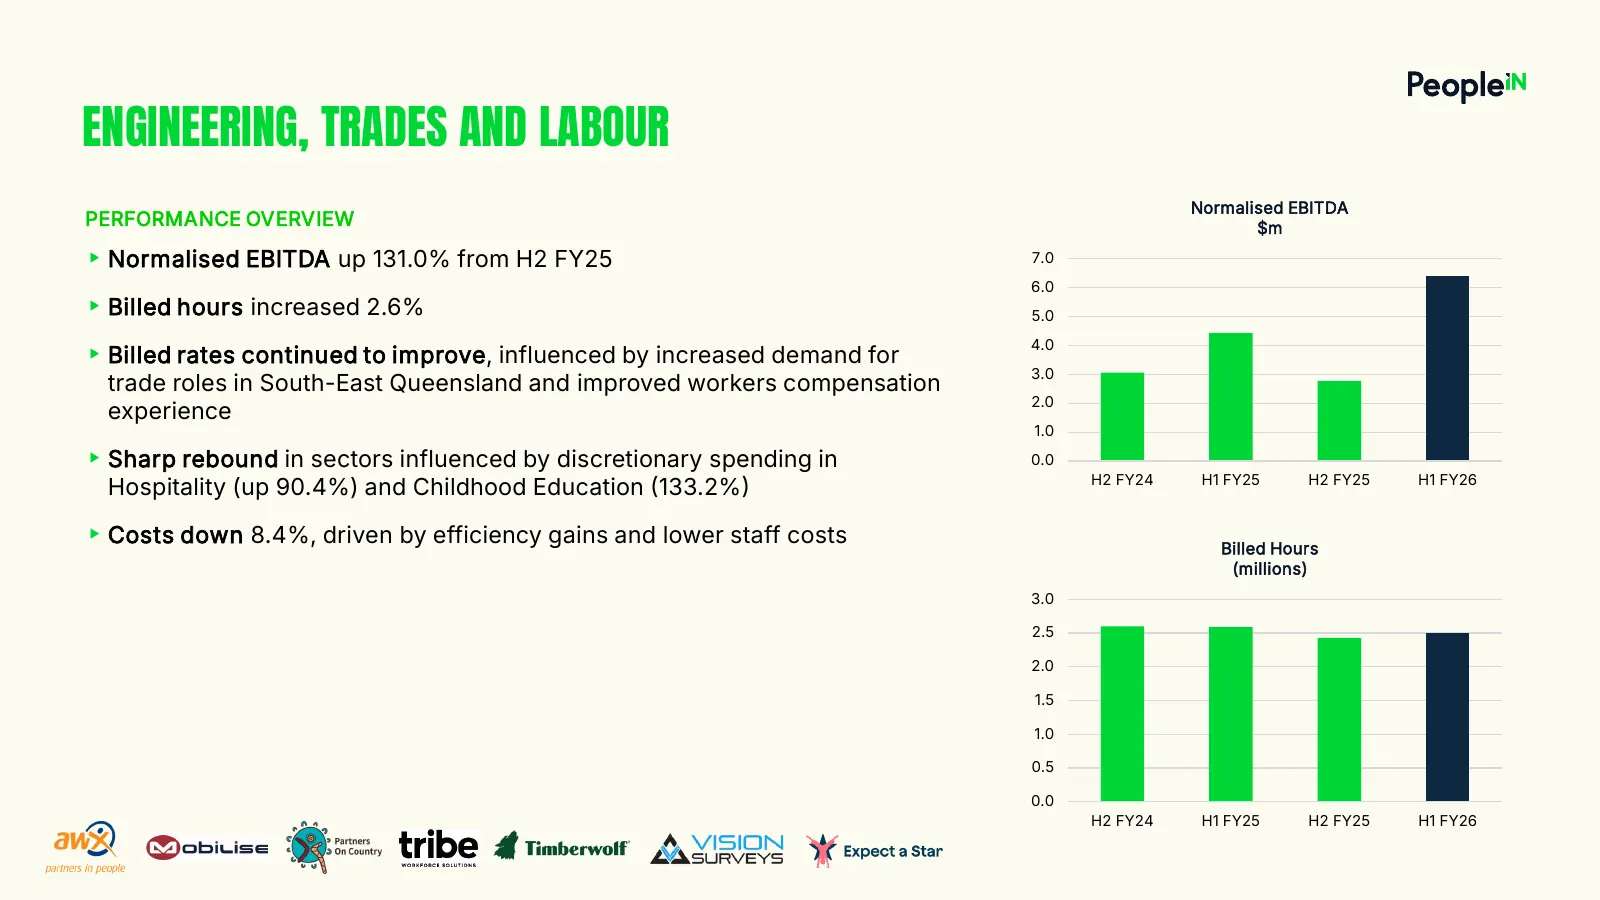
ENGINEERING, TRADES AND LABOUR Normalised EBITDA PERFORMANCE OVERVIEW $m ‣ Normalised EBITDA up 131.0% from H2 FY25 7.0 6.0 ‣ Billed hours increased 2.6% 5.0 ‣ Billed rates continued to improve, influenced by increased demand for 4.0 3.0 trade roles in South-East Queensland and improved workers comp
Slide 8: Food and Agriculture
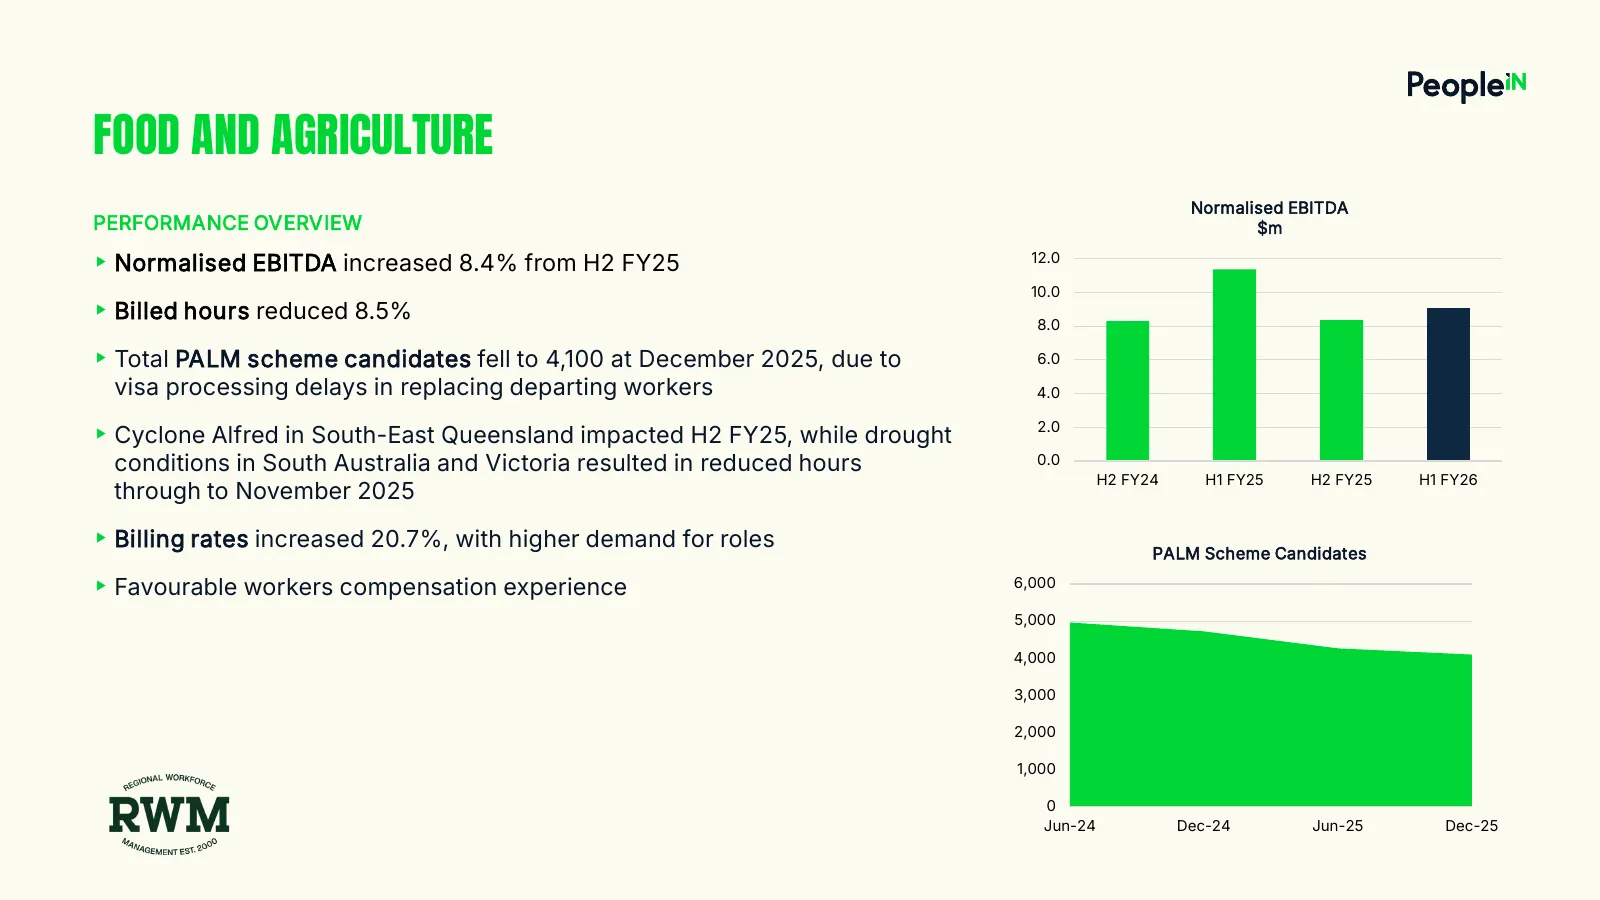
FOOD AND AGRICULTURE Normalised EBITDA PERFORMANCE OVERVIEW $m ‣ Normalised EBITDA increased 8.4% from H2 FY25 12.0 10.0 ‣ Billed hours reduced 8.5% 8.0 ‣ Total PALM scheme candidates fell to 4,100 at December 2025, due to 6.0 visa processing delays in replacing departing workers 4.0 ‣ Cyclone Alfre
Slide 9: Professional Services
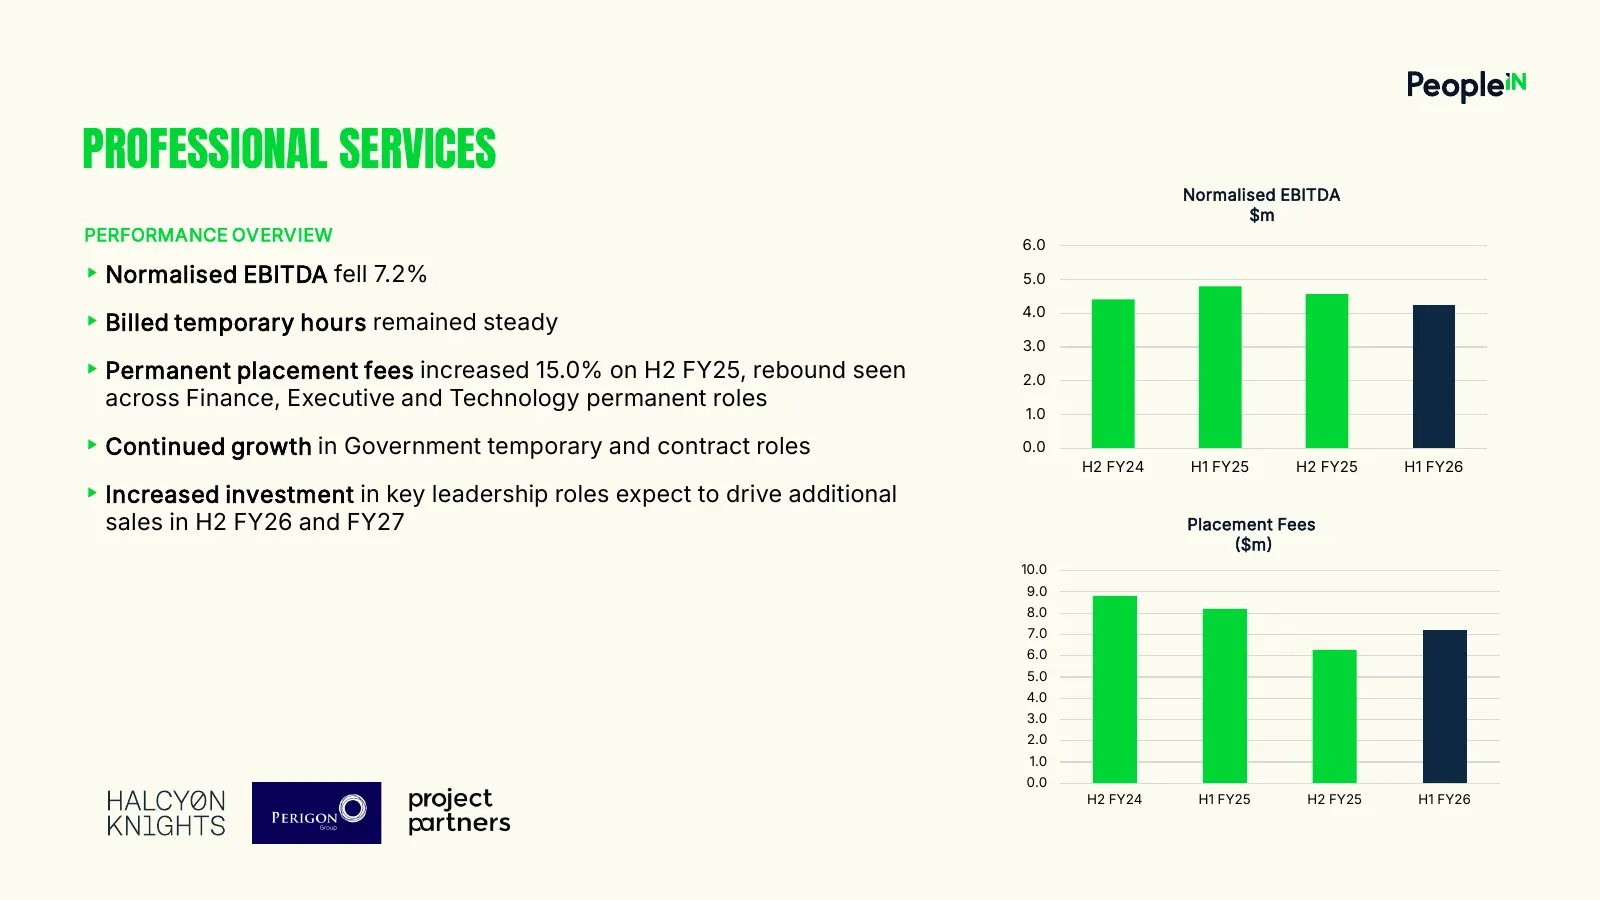
PROFESSIONAL SERVICES Normalised EBITDA $m PERFORMANCE OVERVIEW 6.0 ‣ Normalised EBITDA fell 7.2% 5.0 ‣ Billed temporary hours remained steady 4.0 3.0 ‣ Permanent placement fees increased 15.0% on H2 FY25, rebound seen 2.0 across Finance, Executive and Technology permanent roles 1.0 ‣ Continued grow
Slide 10: Cash Flow
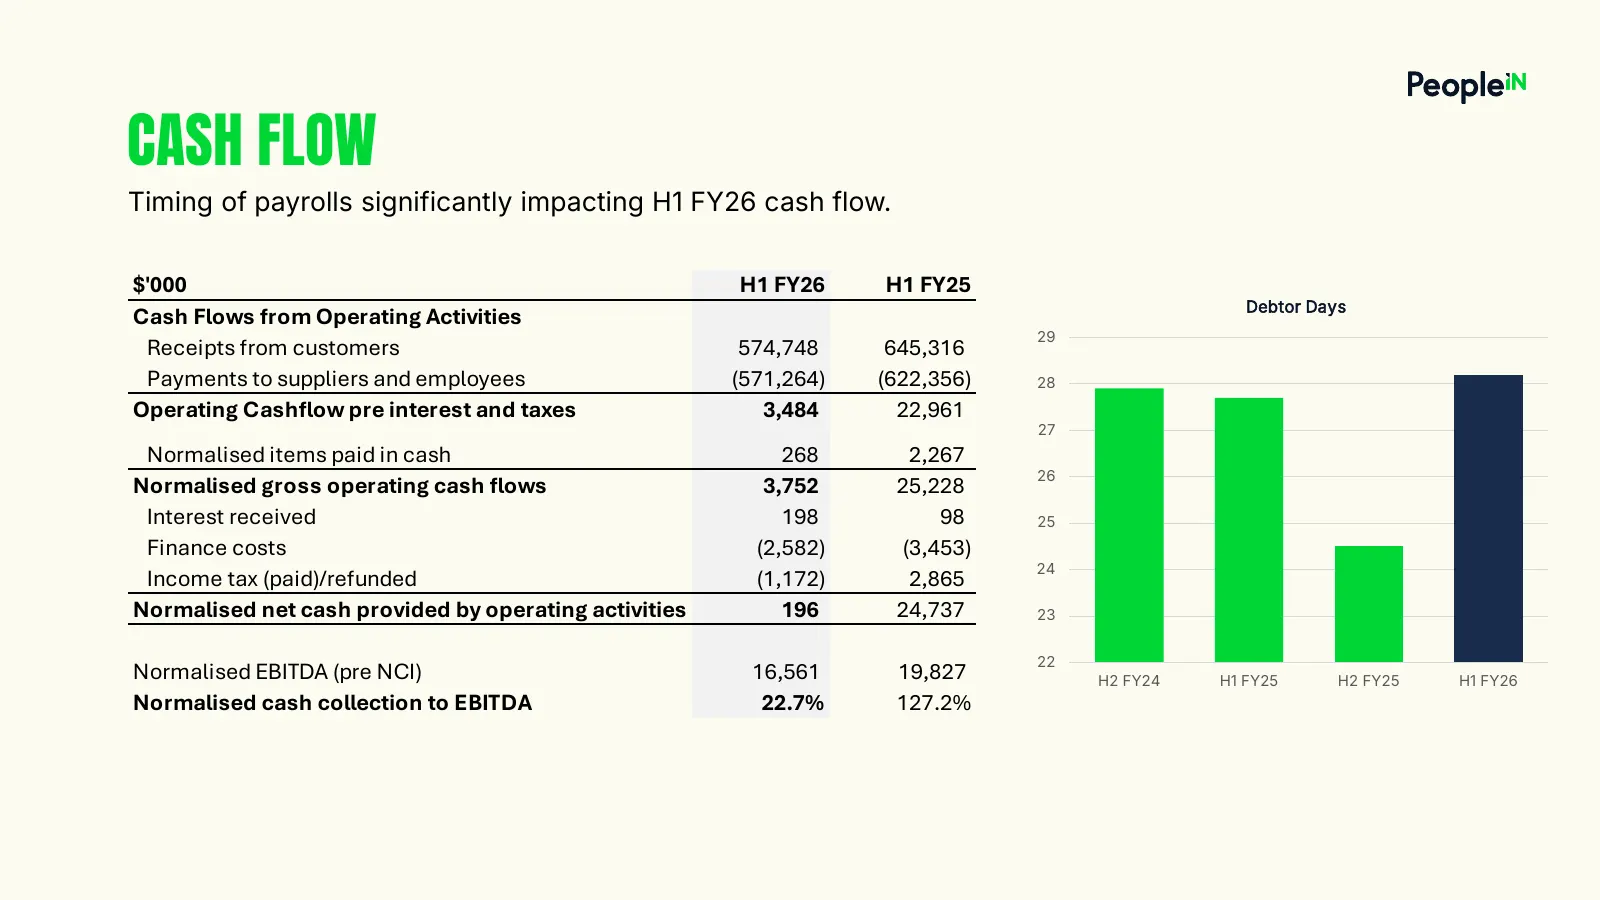
CASH FLOW Timing of payrolls significantly impacting H1 FY26 cash flow. $'000 H1 FY26 H1 FY25 Debtor Days Cash Flows from Operating Activities 29 Receipts from customers 574,748 645,316 Payments to suppliers and employees (571,264) (622,356) 28 Operating Cashflow pre interest and taxes 3,484 22,961
Slide 11: Significant Capacity to Grow
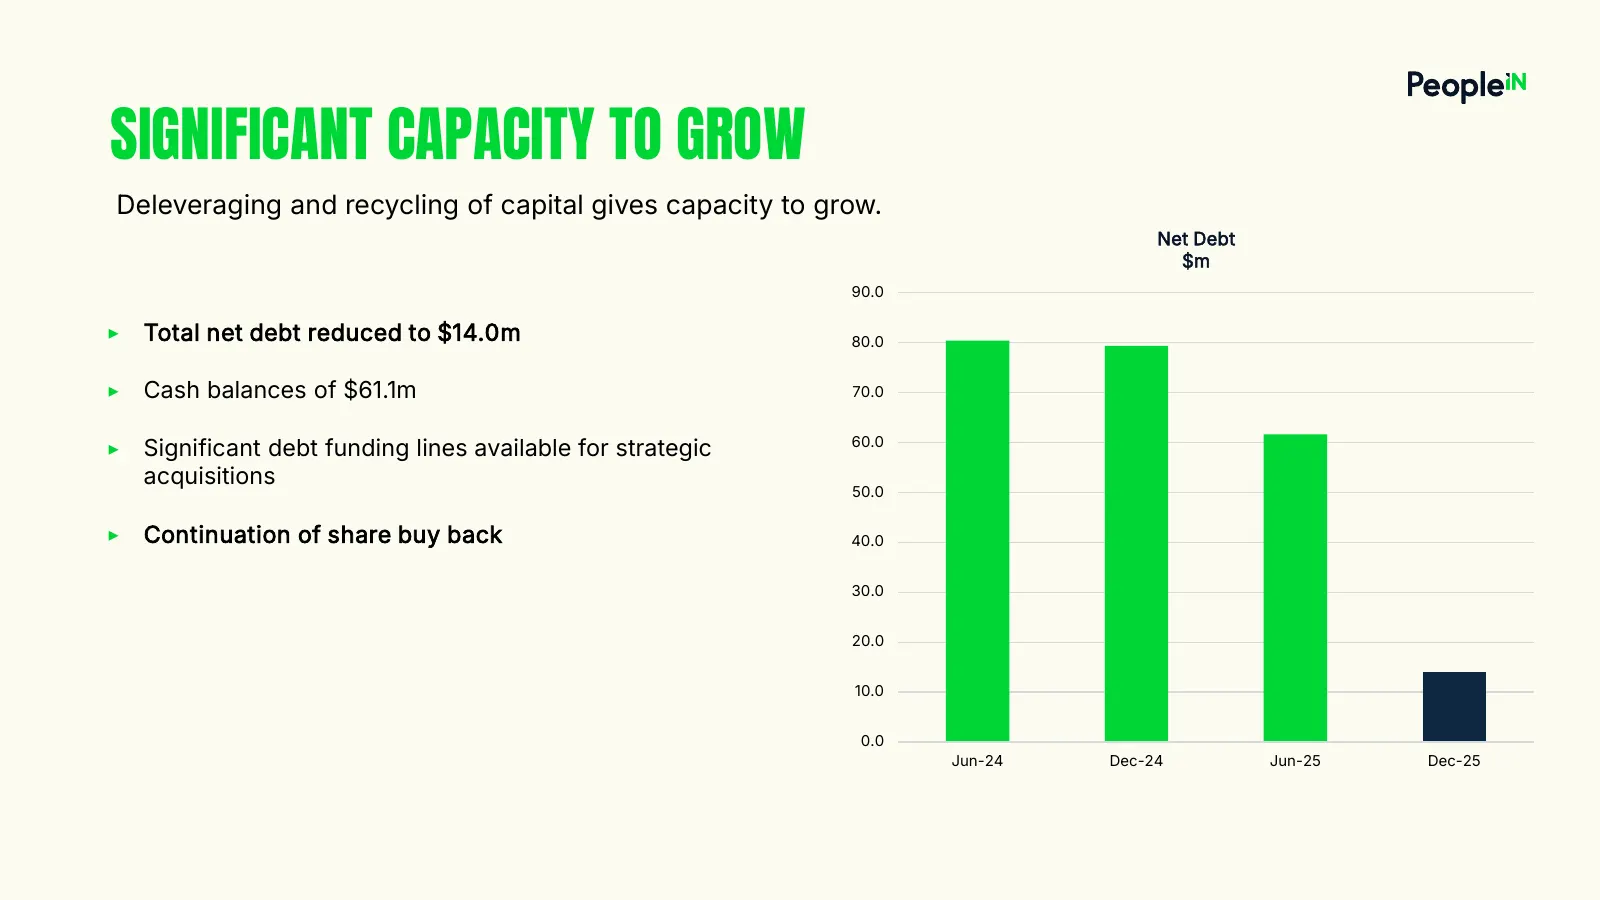
SIGNIFICANT CAPACITY TO GROW Deleveraging and recycling of capital gives capacity to grow. Net Debt $m 90.0 ▶ Total net debt reduced to $14.0m 80.0 ▶ Cash balances of $61.1m 70.0 60.0 ▶ Significant debt funding lines available for strategic acquisitions 50.0 ▶ Continuation of share buy back 40.0 30.
Slide 12: Focused Plan with Capital to Grow
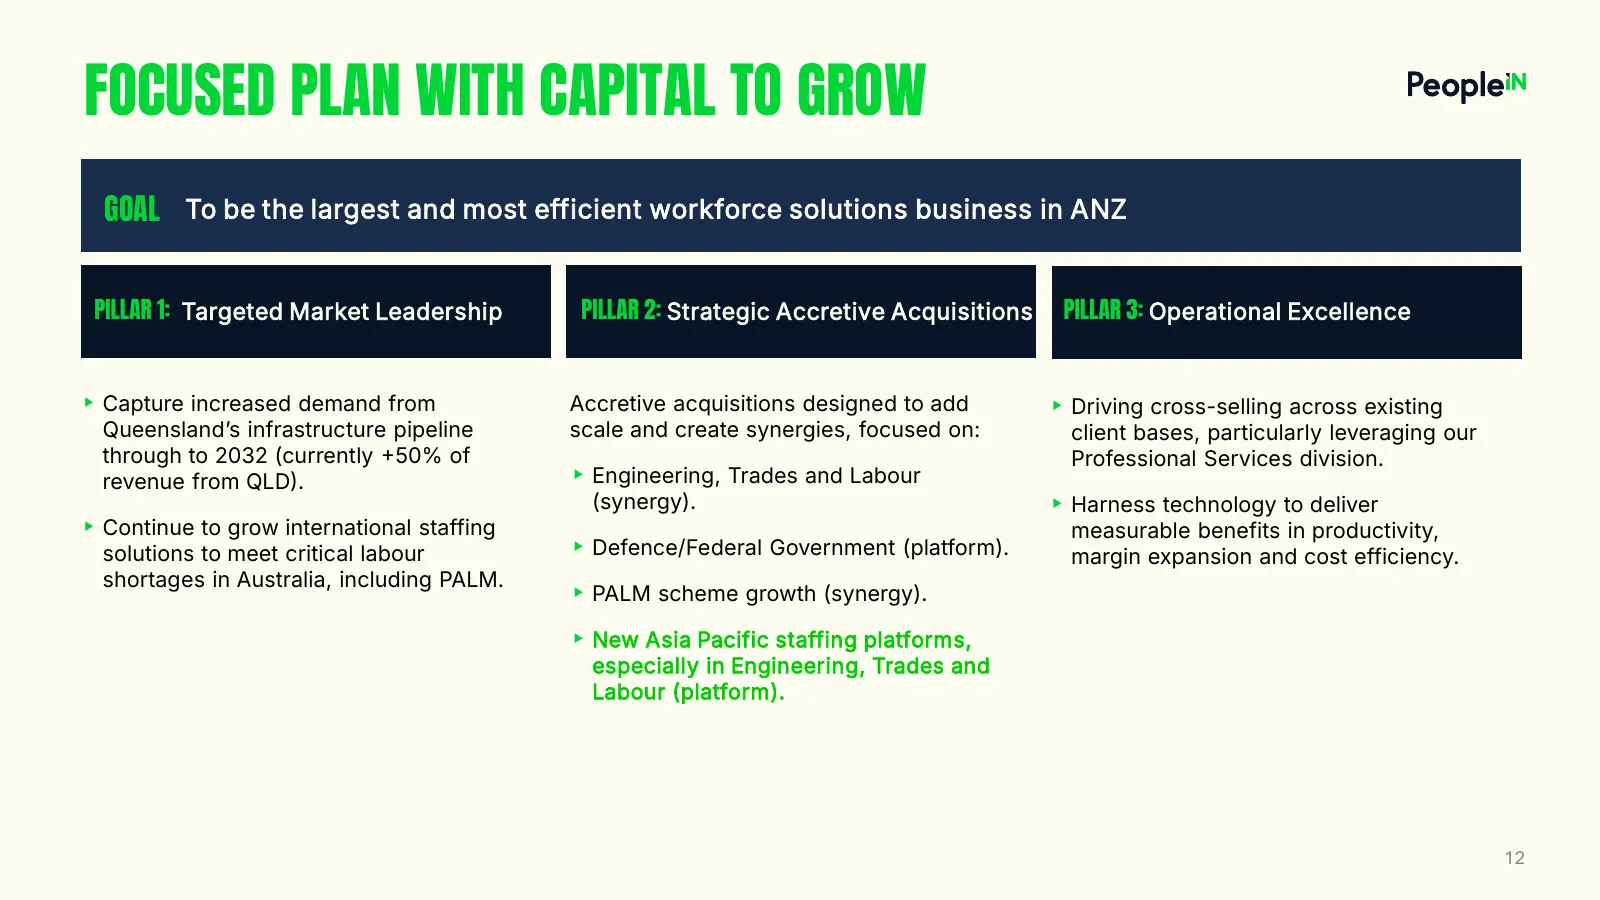
FOCUSED PLAN WITH CAPITAL TO GROW GOAL To be the largest and most efficient workforce solutions business in ANZ PILLAR 1: Targeted Market Leadership PILLAR 2: Strategic Accretive Acquisitions PILLAR 3: Operational Excellence ‣ Capture increased demand from Accretive acquisitions designed to add ‣ Dr
Slide 13: Expanding Our Trans-Tasman Workforce Capability
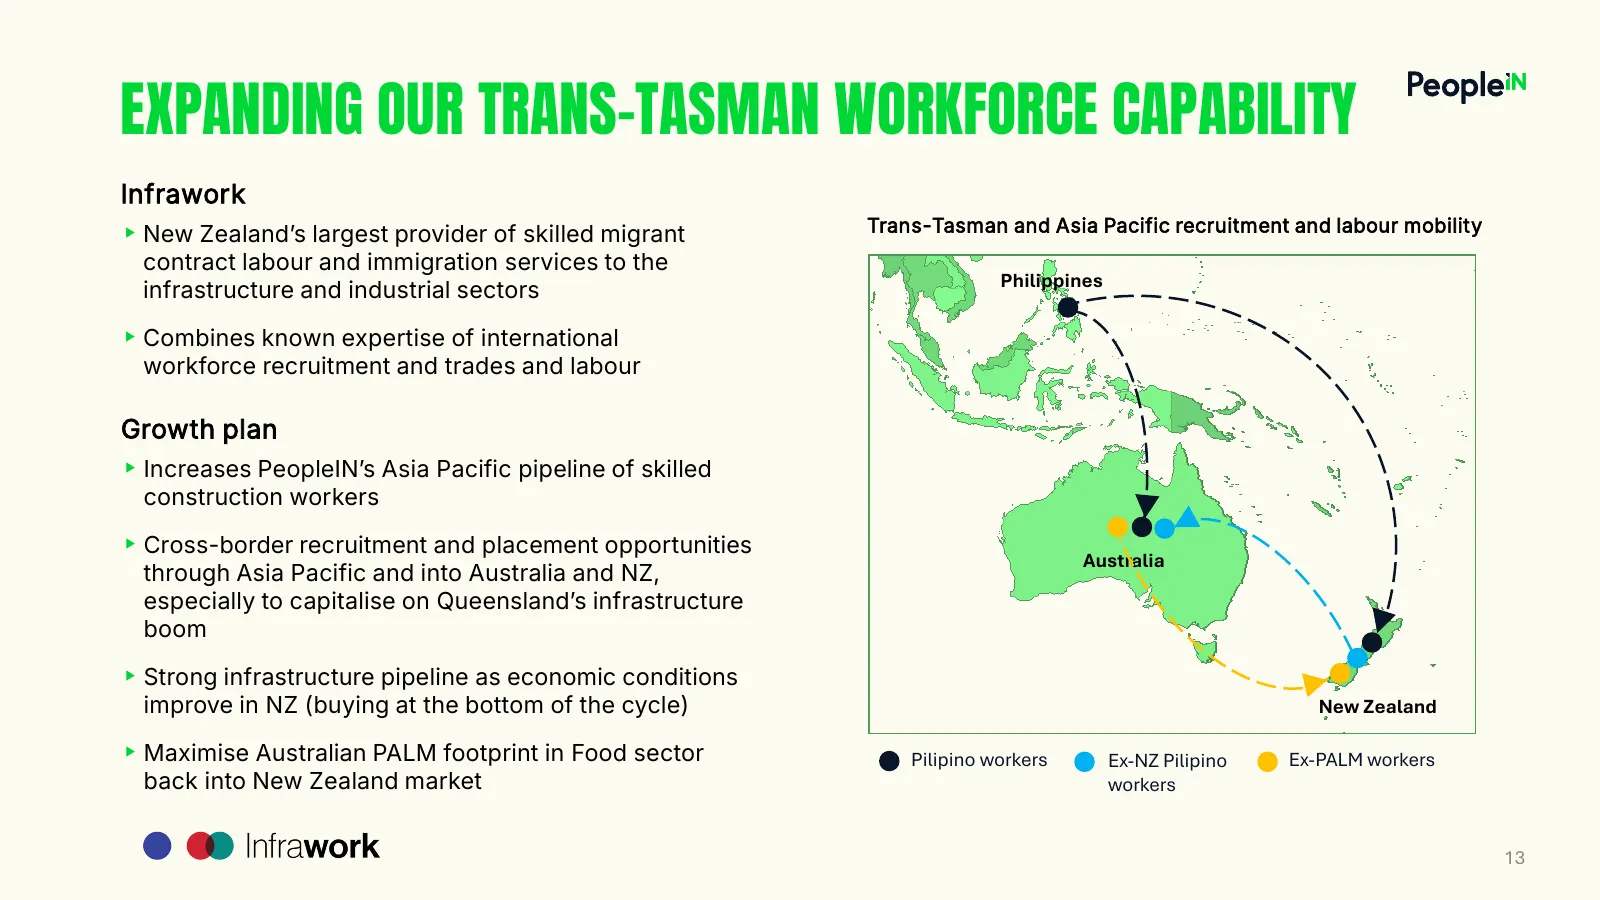
EXPANDING OUR TRANS-TASMAN WORKFORCE CAPABILITY Infrawork ‣ New Zealandʼs largest provider of skilled migrant Trans-Tasman and Asia Pacific recruitment and labour mobility contract labour and immigration services to the Philippines infrastructure and industrial sectors ‣ Combines known expertise of
Slide 14: Infrawork Investment Metrics
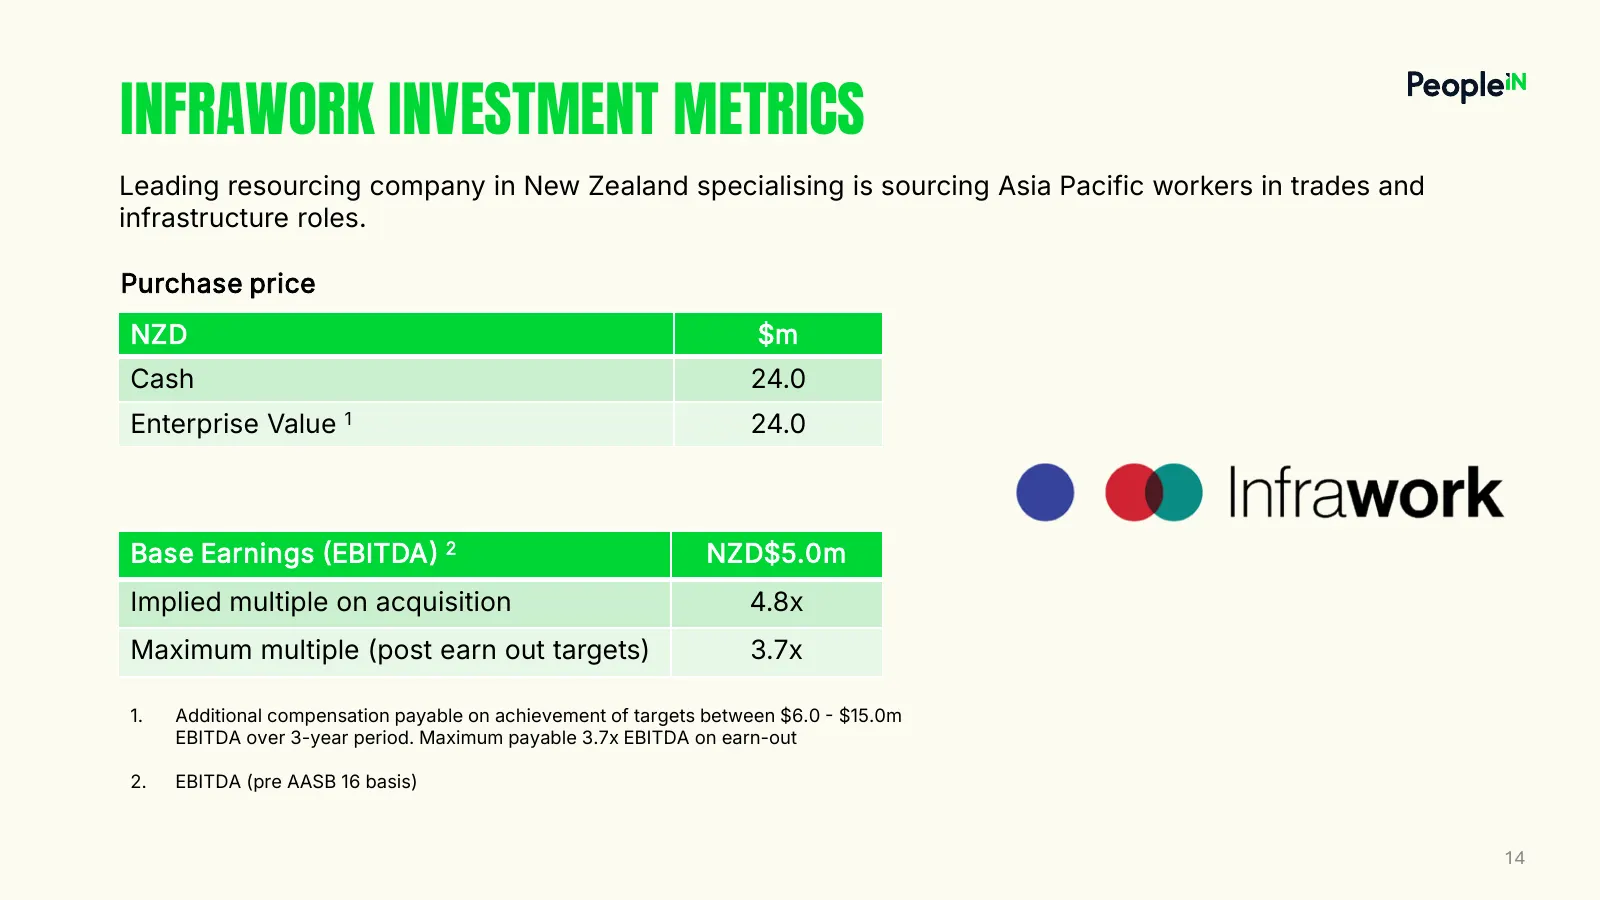
INFRAWORK INVESTMENT METRICS Leading resourcing company in New Zealand specialising is sourcing Asia Pacific workers in trades and infrastructure roles. Purchase price NZD $m Cash 24.0 Enterprise Value 1 24.0 Base Earnings EBITDA 2 NZD$5.0m Implied multiple on acquisition 4.8x Maximum multiple (po
Slide 15: Building Unique Advantage in Workforce Supply
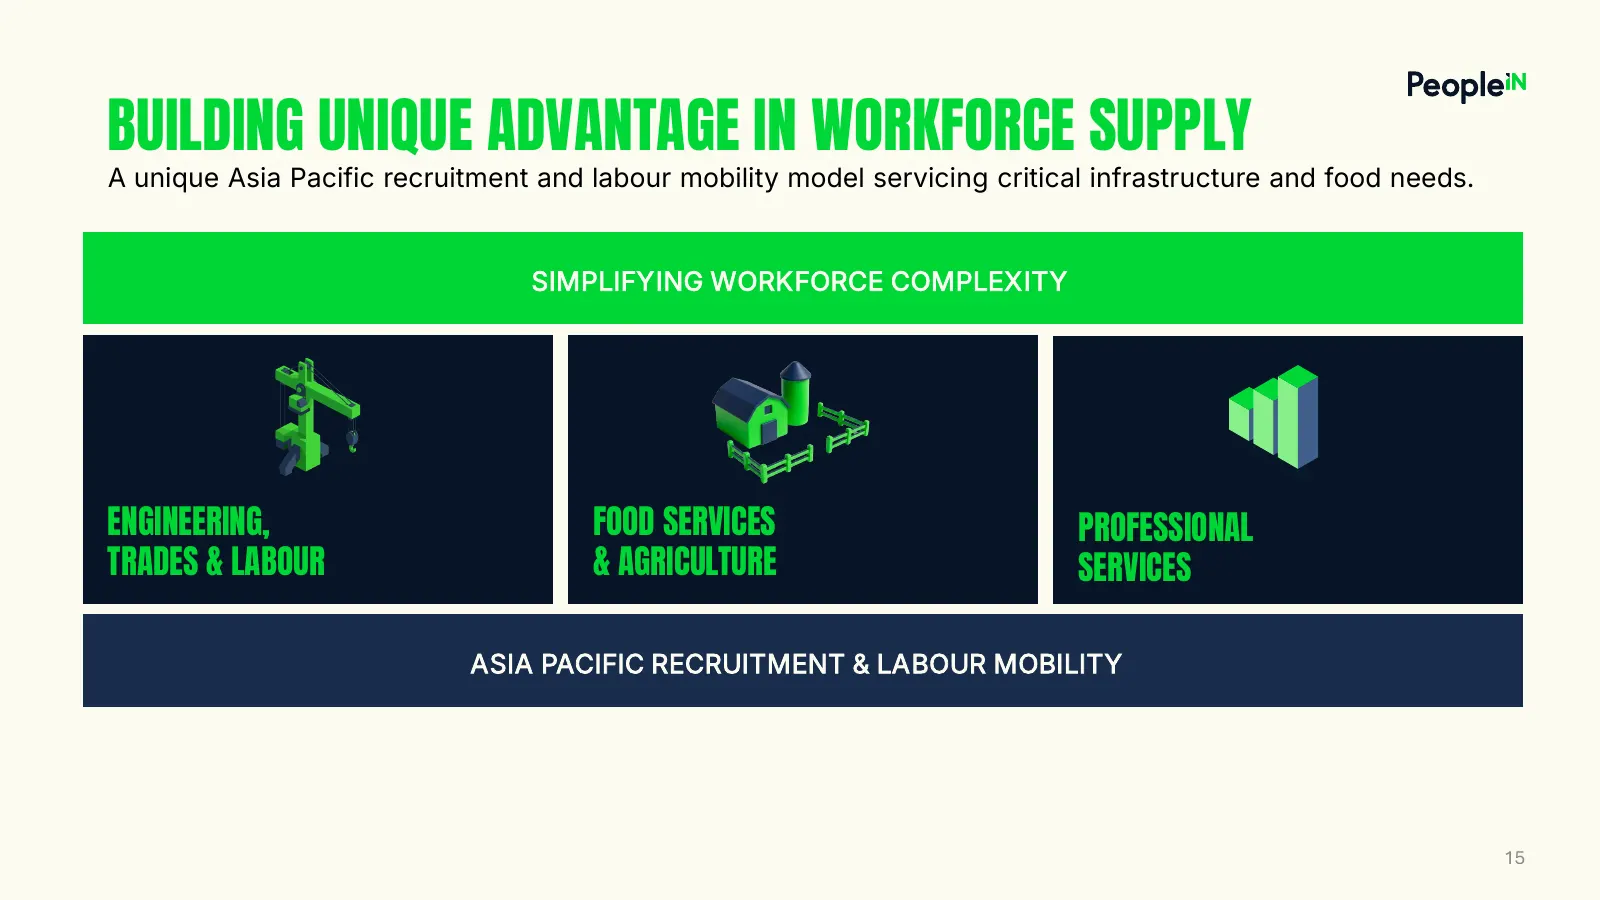
BUILDING UNIQUE ADVANTAGE IN WORKFORCE SUPPLY A unique Asia Pacific recruitment and labour mobility model servicing critical infrastructure and food needs. SIMPLIFYING WORKFORCE COMPLEXITY ENGINEERING, FOOD SERVICES PROFESSIONAL TRADES & LABOUR & AGRICULTURE SERVICES ASIA PACIFIC RECRUITMENTSERVICES
Slide 16: Focused Strategy
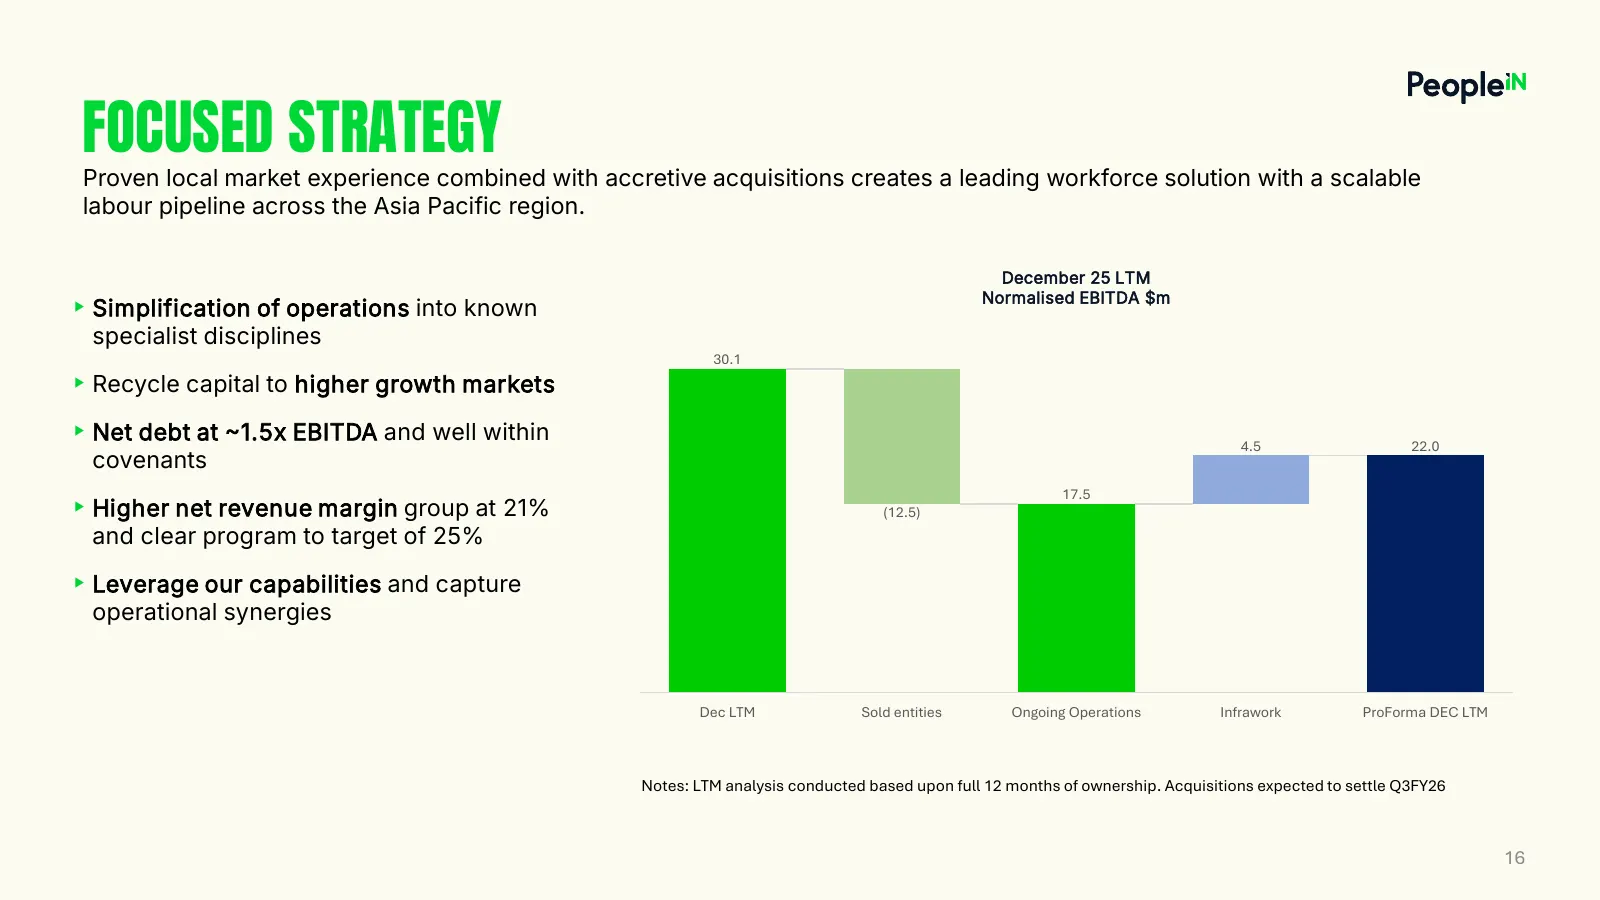
FOCUSED STRATEGY Proven local market experience combined with accretive acquisitions creates a leading workforce solution with a scalable labour pipeline across the Asia Pacific region. December 25 LTM ‣ Simplification of operations into known Normalised EBITDA $m specialist disciplines 30.1 ‣ Recyc

Slide 17: Thank You
People’ THANK YOU 17

Slide 18: Appendices
People’ APPENDICES 18
Slide 19: Reconciliation of Statutory to Normalised EBITDA
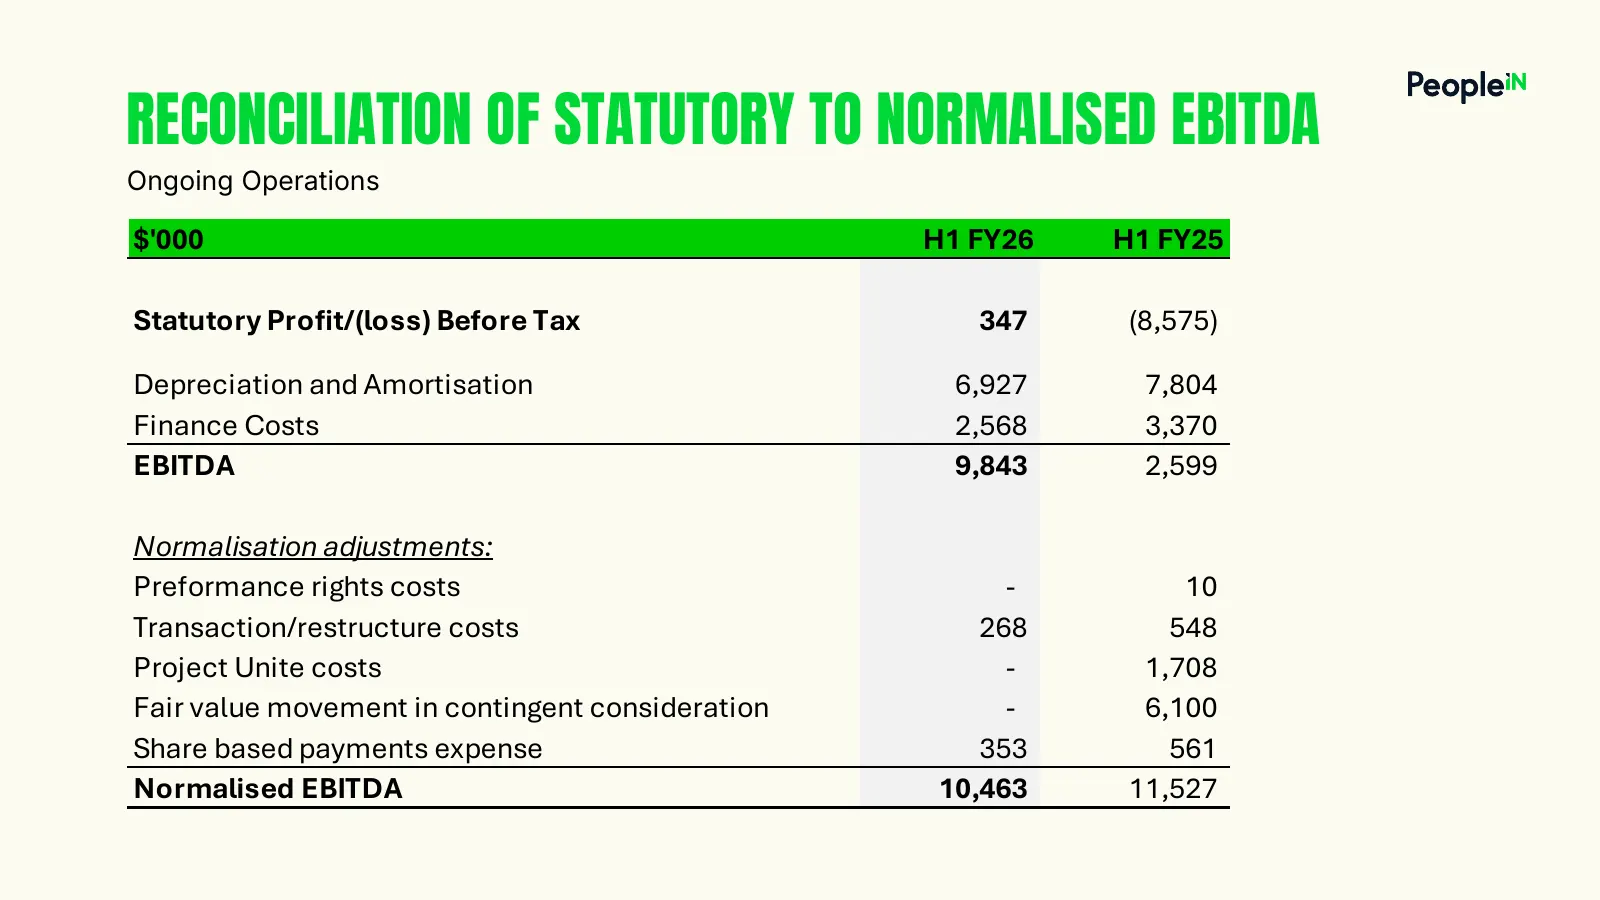
RECONCILIATION OF STATUTORY TO NORMALISED EBITDA Ongoing Operations $'000 H1 FY26 H1 FY25 Statutory Profit/(loss) Before Tax 347 (8,575) Depreciation and Amortisation 6,927 7,804 Finance Costs 2,568 3,370 EBITDA 9,843 2,599 Normalisation adjustments: Preformance rights costs - 10 Transaction/restruc
Slide 20: Segment Reporting
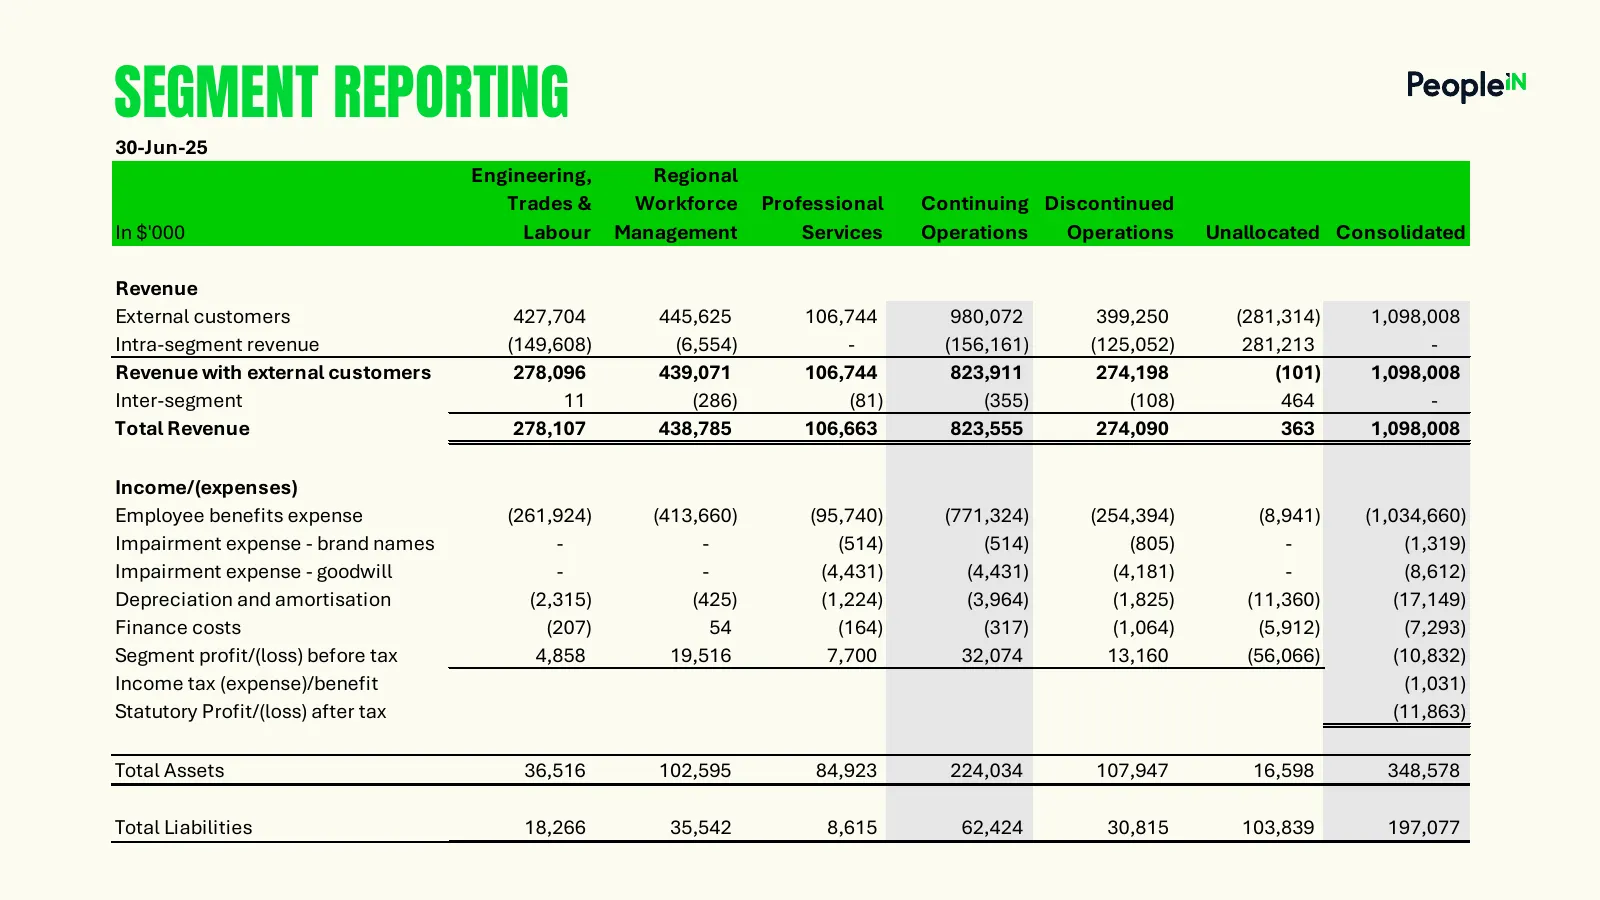
SEGMENT REPORTING 30-Jun-25 Engineering, Regional Trades & Workforce Professional Continuing Discontinued In $'000 Labour Management Services Operations Operations Unallocated Consolidated Revenue External customers 427,704 445,625 106,744 980,072 399,250 (281,314) 1,098,008 Intra-segment revenue (1
Slide 21: Segment Reporting
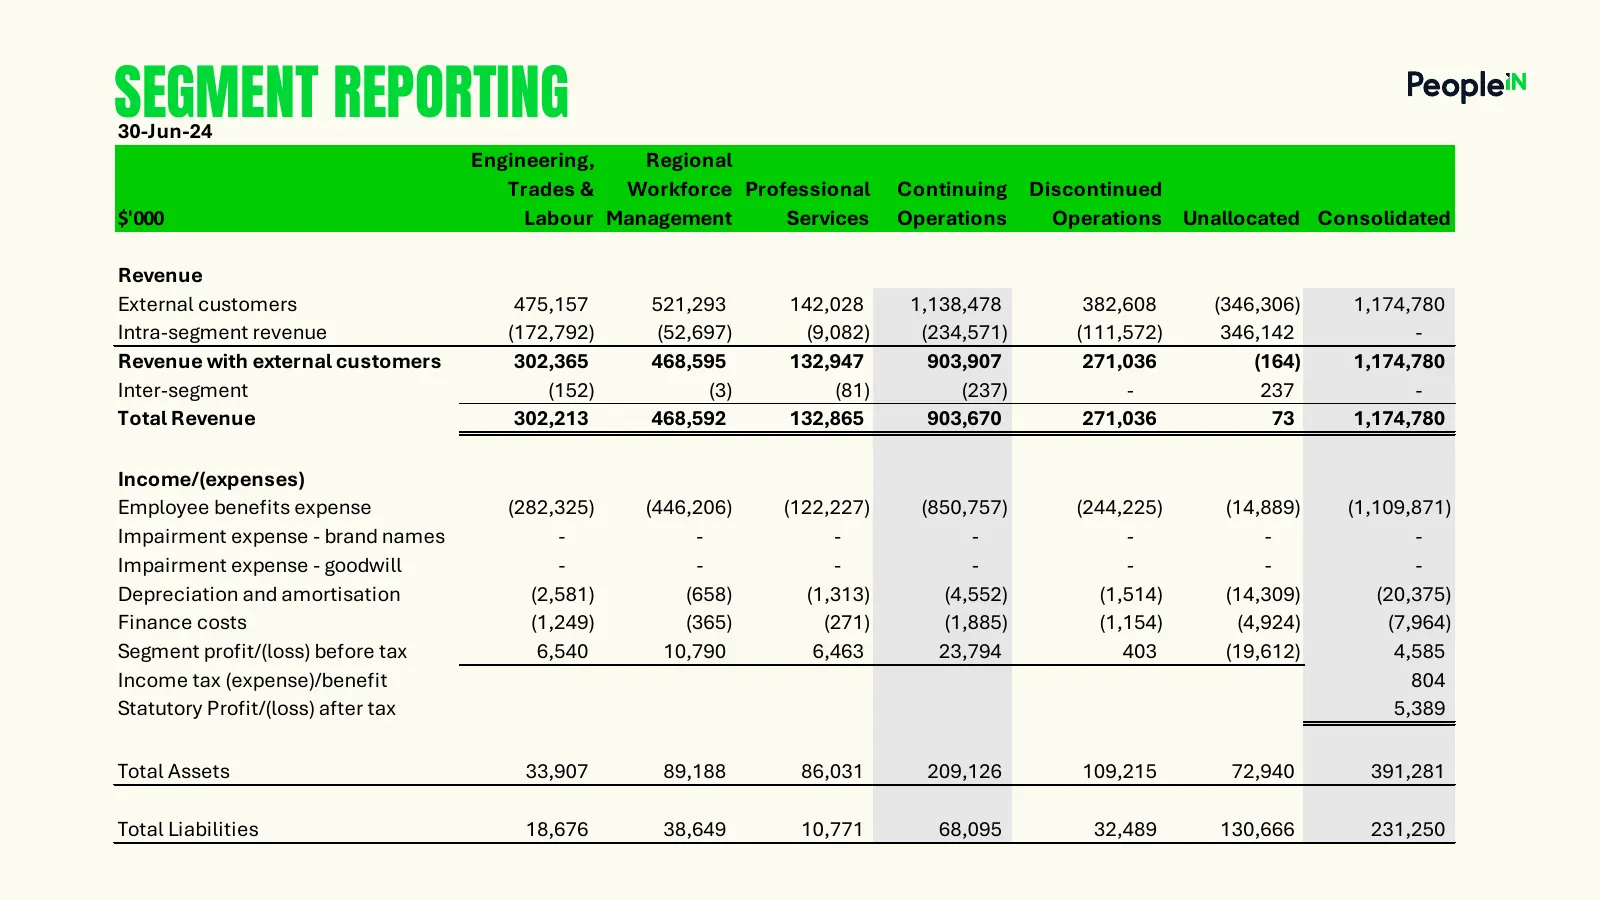
SEGMENT REPORTING 30-Jun-24 Engineering, Regional Trades & Workforce Professional Continuing Discontinued $'000 Labour Management Services Operations Operations Unallocated Consolidated Revenue External customers 475,157 521,293 142,028 1,138,478 382,608 (346,306) 1,174,780 Intra-segment revenue (17

Slide 22: Disclaimer
DISCLAIMER This presentation has been prepared by PeopleIn Limited (Company) together with its related bodies corporate (PeopleIN). The material contained in this presentation is for information purposes only and is intended to be general background information on PeopleIN and its activities. This p

Slide 23: People’
People’ People’
Source: ASX announcement via 6ix News
More decks from Peoplein Limited
 FY2026 Earnings Presentation20 slides · Aug 31, 2026
 FY2025 Earnings Presentation20 slides · Aug 25, 2025
 H1 2025 Earnings Presentation19 slides · Feb 24, 2025
 FY2024 Earnings Presentation23 slides · Aug 27, 2024
 H1 FY2024 Earnings Presentation24 slides · Feb 26, 2024
 FY2023 Earnings Presentation26 slides · Aug 25, 2023